Article

Effect of Maize Canopy Structure on Light Interception and Radiation Use Efficiency at Different Canopy Layers

by
Meng Duan
1,2,
Xiaotao Zhang
1,3,
Zheng Wei
1,3,
Xu Chen
4 and
Baozhong Zhang
1,3,*
1
State Key Laboratory of Simulation and Regulation of Water Cycle in River Basin, China Institute of Water Resources and Hydropower Research, Beijing 100038, China
2
National Center of Efficient Irrigation Engineering and Technology Research, Beijing 100048, China
3
Key Laboratory of River Basin Digital Twinning, Ministry of Water Resources, Beijing 100038, China
4
College of Forestry, Shanxi Agricultural University, Jinzhong 030801, China
*
Author to whom correspondence should be addressed.
Agronomy 2024, 14(7), 1511; https://doi.org/10.3390/agronomy14071511
Submission received: 6 June 2024 / Revised: 2 July 2024 / Accepted: 8 July 2024 / Published: 12 July 2024
(This article belongs to the Section Farming Sustainability)

Abstract

:
Reasonable dense planting is an important measure to increase crop yield per unit area and save resources. However, there is no unified view of the competition for photosynthetic radiation in different stratification structures of maize plants due to different planting densities, as well as the internal mechanism of yield increase. In order to investigate these issues, field experiments were conducted from 2021 to 2022 in Daxing, Beijing, China (39°37′ N, 116°25′ E, altitude 31.3 m a.s.l.). Field plots were arranged in a randomized block design, with the main plot factor representing plant density. In each replicate, four densities were set, i.e., 33,000 (D1), 42,000 (D2), 55,000 (D3), and 83,000 (D4) plants·ha−1. Canopy stratification structure characteristics, including leaf area index, biomass, and photosynthetically active radiation (PAR), were measured in each stratification structure, and transmitted PAR, radiation use efficiency (RUE), and light extinction coefficient (K) were calculated. We found that increasing plant density significantly increased biomass, leaf area index (LAI), and precipitation use efficiency (PUE), but the light extinction coefficient (K) and harvest index (HI) showed opposite trends. Compared to the D1 treatment, the grain yield, precipitation use efficiency (PUE), radiation use efficiency (RUE), and LAI increased by 22.6–88.2%, 9.2–50.5%, 26.7–116.9%, and 27.7 to 150.6% in the D2, D3, and D4 treatments, and K and HI decreased by 19.7–50.3% and 4.2–11.5%, respectively. These showed that a density of 83,000 plants·ha−1 was effective in promoting maize growth in the Daxing area of Beijing, China.

1. Introduction

Maize (Zea mays L.) is an important food crop, which has been one of the main crops in agricultural production as a food, feed, and industrial material. In order to meet society’s growing demand for food, raw materials, and bioenergy, how to increase crop yields has become an international concern in the context of increasingly poor soil and the constraints of decreasing arable area [1,2,3]. According to the global grain supply and demand model, the demand for maize has increased from 526 million tons in 1993 to 784 million tons in 2020 [4]. It was estimated that an increase of more than 50% in grain production would be required by 2025 to meet demand. However, since the 1990s, the growth rate of world grain production has slowed. From 1982 to 1994, the annual increase in world maize production was only 1.2% [5]. Importantly, the development of unused land is limited to increasing food production [6]. If acreage does not increase, maize production per acre will have to grow at a rate of about 1.5 percent per year to meet demand. Hence, increasing yields per unit area is a realistic option for achieving increased food production, while the rational use of resources and improving the efficiency of resource use are the main issues that must be faced [7,8].
High-density planting is the simplest and most common measure to increase yields per unit area [9,10]. However, high-density planting not only exacerbates inter-plant competition for nutrients and water but also restricts light transport within the canopy, thereby altering the leaf area index, leaf distribution, and mean leaf inclination [11,12]. During plant growth, structure and function interact, and changes in environmental conditions not only affect plant physiological and ecological processes but also may cause changes in canopy structure [12,13]. Changes in canopy structure not only affect the interception of solar radiation but also influence the micrometeorological environment, such as temperature, relative humidity, and CO2 concentration within the canopy, which ultimately affects the photosynthetic efficiency, water use efficiency, and yield of the crop population [14,15]. Therefore, an in-depth study of the quantitative relationship between canopy structure changes and maize yield and resource use efficiency can provide an important theoretical basis for improving crop yield and efficient use of resources and is of great practical significance for improving grain yields.
The leaf is an essential nutritional organ of maize and, at the same time, determines the light distribution conditions and light energy use within the maize population [16]. Leaf area is an important determinant of photosynthetic yield [17]. Bahadur et al. found that leaf area index (LAI), total dry matter (TDM), biological yield, and seed yield increased with an increase in plant density, while plant height, number of leaves per plant, stem diameter, flowering, and maturity time, number of spikes per plant, thousand kernel weight, and number of grains per spike showed a negative response [18]. Sibonginkosi et al. found that with an increase in the sowing density of the plant, its leaf area and dry biomass also increased accordingly [19]. Ear-leaves of maize are important contributors to ear dry matter, and differences in canopy light environment under high density affect leaf photosynthetic efficiency, which in turn affects plant dry matter accumulation [20]. The accumulation and distribution of dry matter in different organs and different growth periods of maize were different. Leaf dry matter accumulation before the tasseling stage is mainly used for plant organ formation and development, while leaf dry matter accumulation after the tasseling stage is mainly used for seed filling. The effect of dry matter accumulation on maize yield increased with increasing density after the tasseling stage, while leaf dry matter decreased significantly at maturity [21,22].
Dense planting affects light distribution within the canopy and the growth of the maize population [23,24]. During the growth of plants, the interaction of structure and function and environmental conditions not only affects plant physiological and ecological processes but also may cause plant morphological changes [13,25]. Wall found that changing the row spacing of wheat would directly lead to changes in canopy structure and also affect the leaf area index, light interception, and CO2 assimilation rate to a certain extent, and with the change in row spacing, the light interception capacity of its narrower rows was 25–35% higher than that of its wider rows, and the light interception capacity of the canopy was significantly improved [26]. Watiki et al. conducted studies on the They found that different cropping practices such as changing maize density, cowpea variety, and intermixing and intercropping not only improved canopy ventilation and light transmission capacity but also canopy structure and light energy utilization [27]. Bai et al. found that planting density is not higher the better the plant growth but also leads to poorer light transmittance to the lower and middle leaf layers of the population under the optimum density conditions [28]. It is worth noting that as planting density increases, the upper leaf area increases while the photosynthetically active radiation received by the middle and lower leaves decreases, which suppresses the interception of light [17,29]. The distribution of light from top to bottom in the plant canopy has a significant impact on the growth of maize [30,31].
Relatively little is known about how density affects leaf area index (LAI) in the stratified structure of maize canopies and how LAI affects canopy light distribution, including photosynthetically active radiation (PAR), light interception, radiation use efficiency (RUE), light attenuation, and biomass at different stages. The objectives of this study were to investigate (i) the influence of plant density on LAI within each stratification structure of the maize canopy, (ii) the effects of these morphological and structural characteristic factors on incident PAR, fraction of PAR intercepted at midday (FPAR), transmitted PAR (TPAR), RUE, extinction coefficient (K), and dry matter; and (iii) the relationship between K, Biomass, RUE, LAI and TPAR to plant density, and the key characteristic factors affecting the growth and development of maize in dense planting. Our findings will aid researchers in optimizing the maize canopy structure according to the spatial distribution of light under different canopies, thereby optimizing the planting density and achieving high maize yield.

2. Materials and Methods

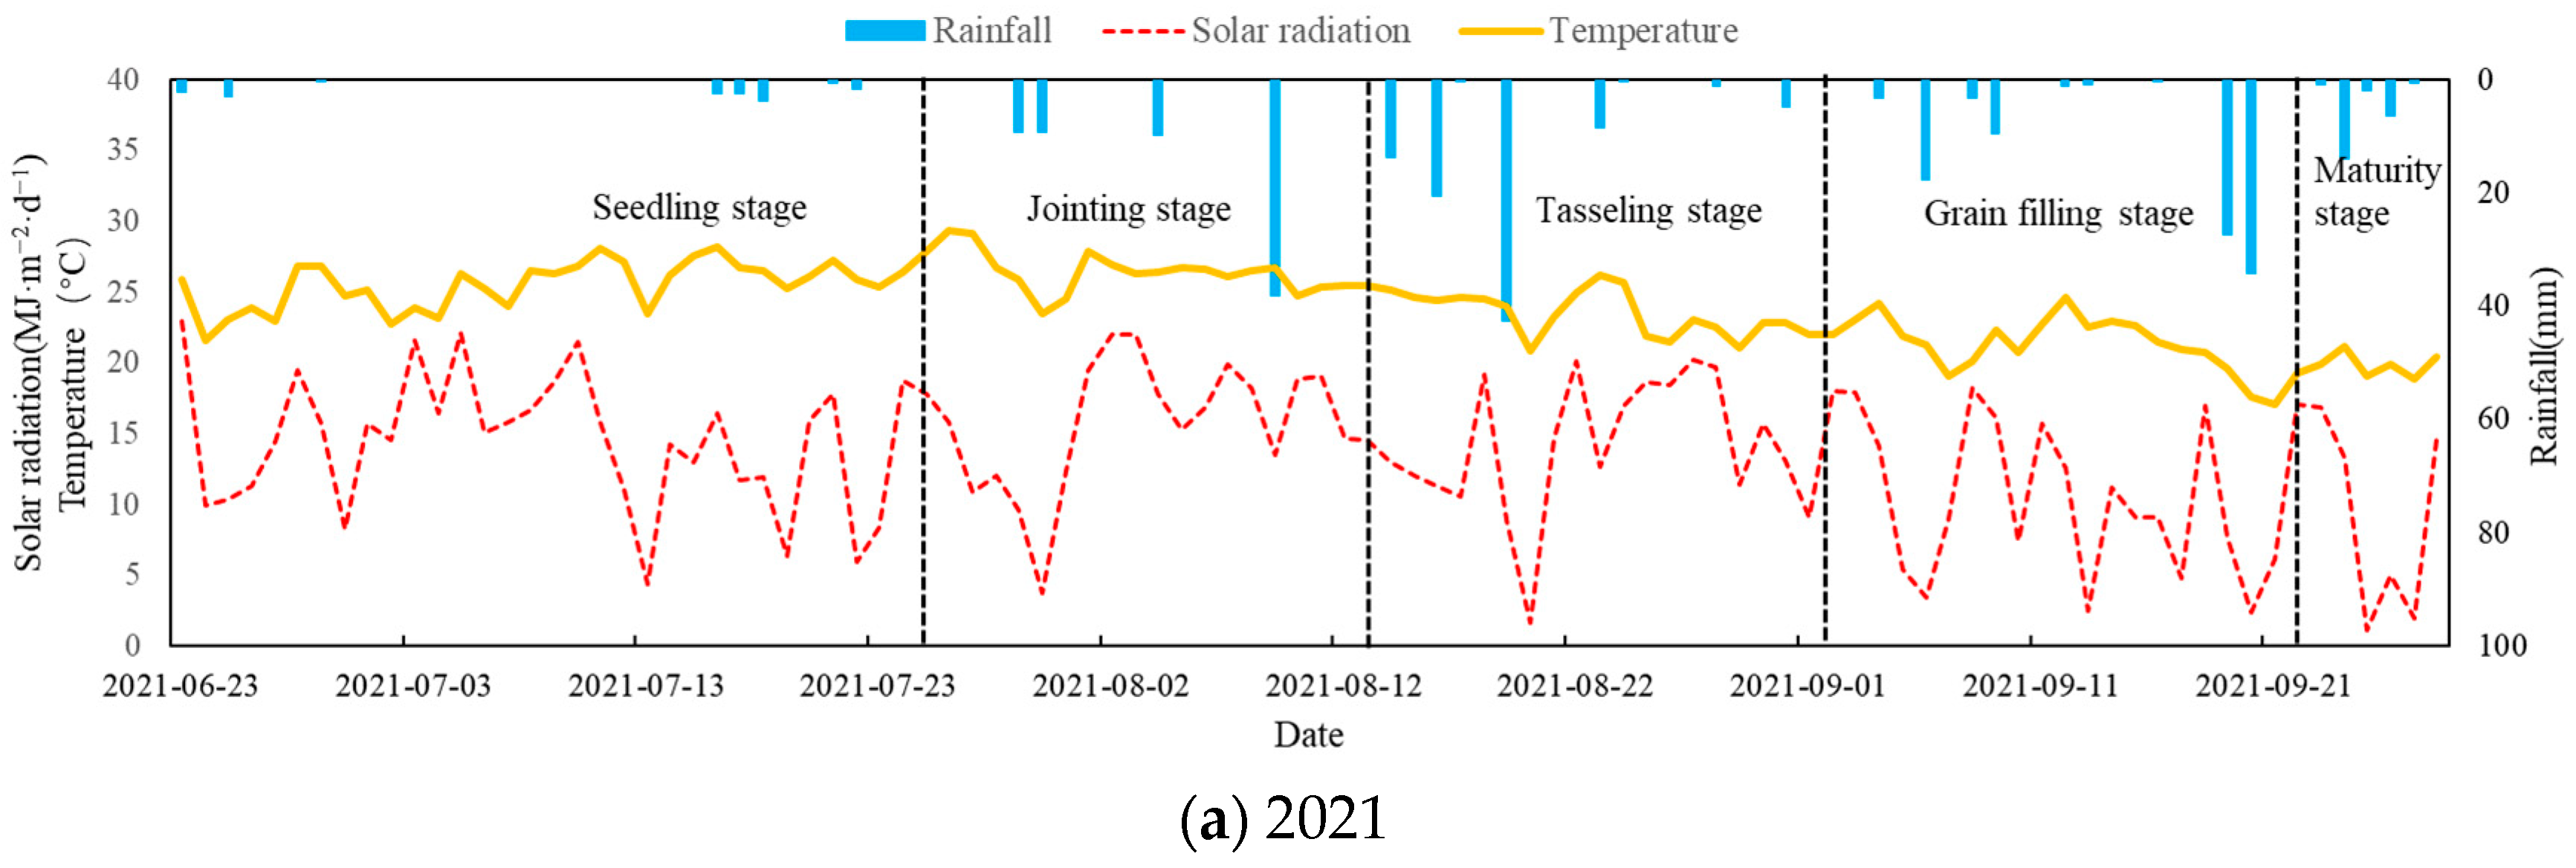
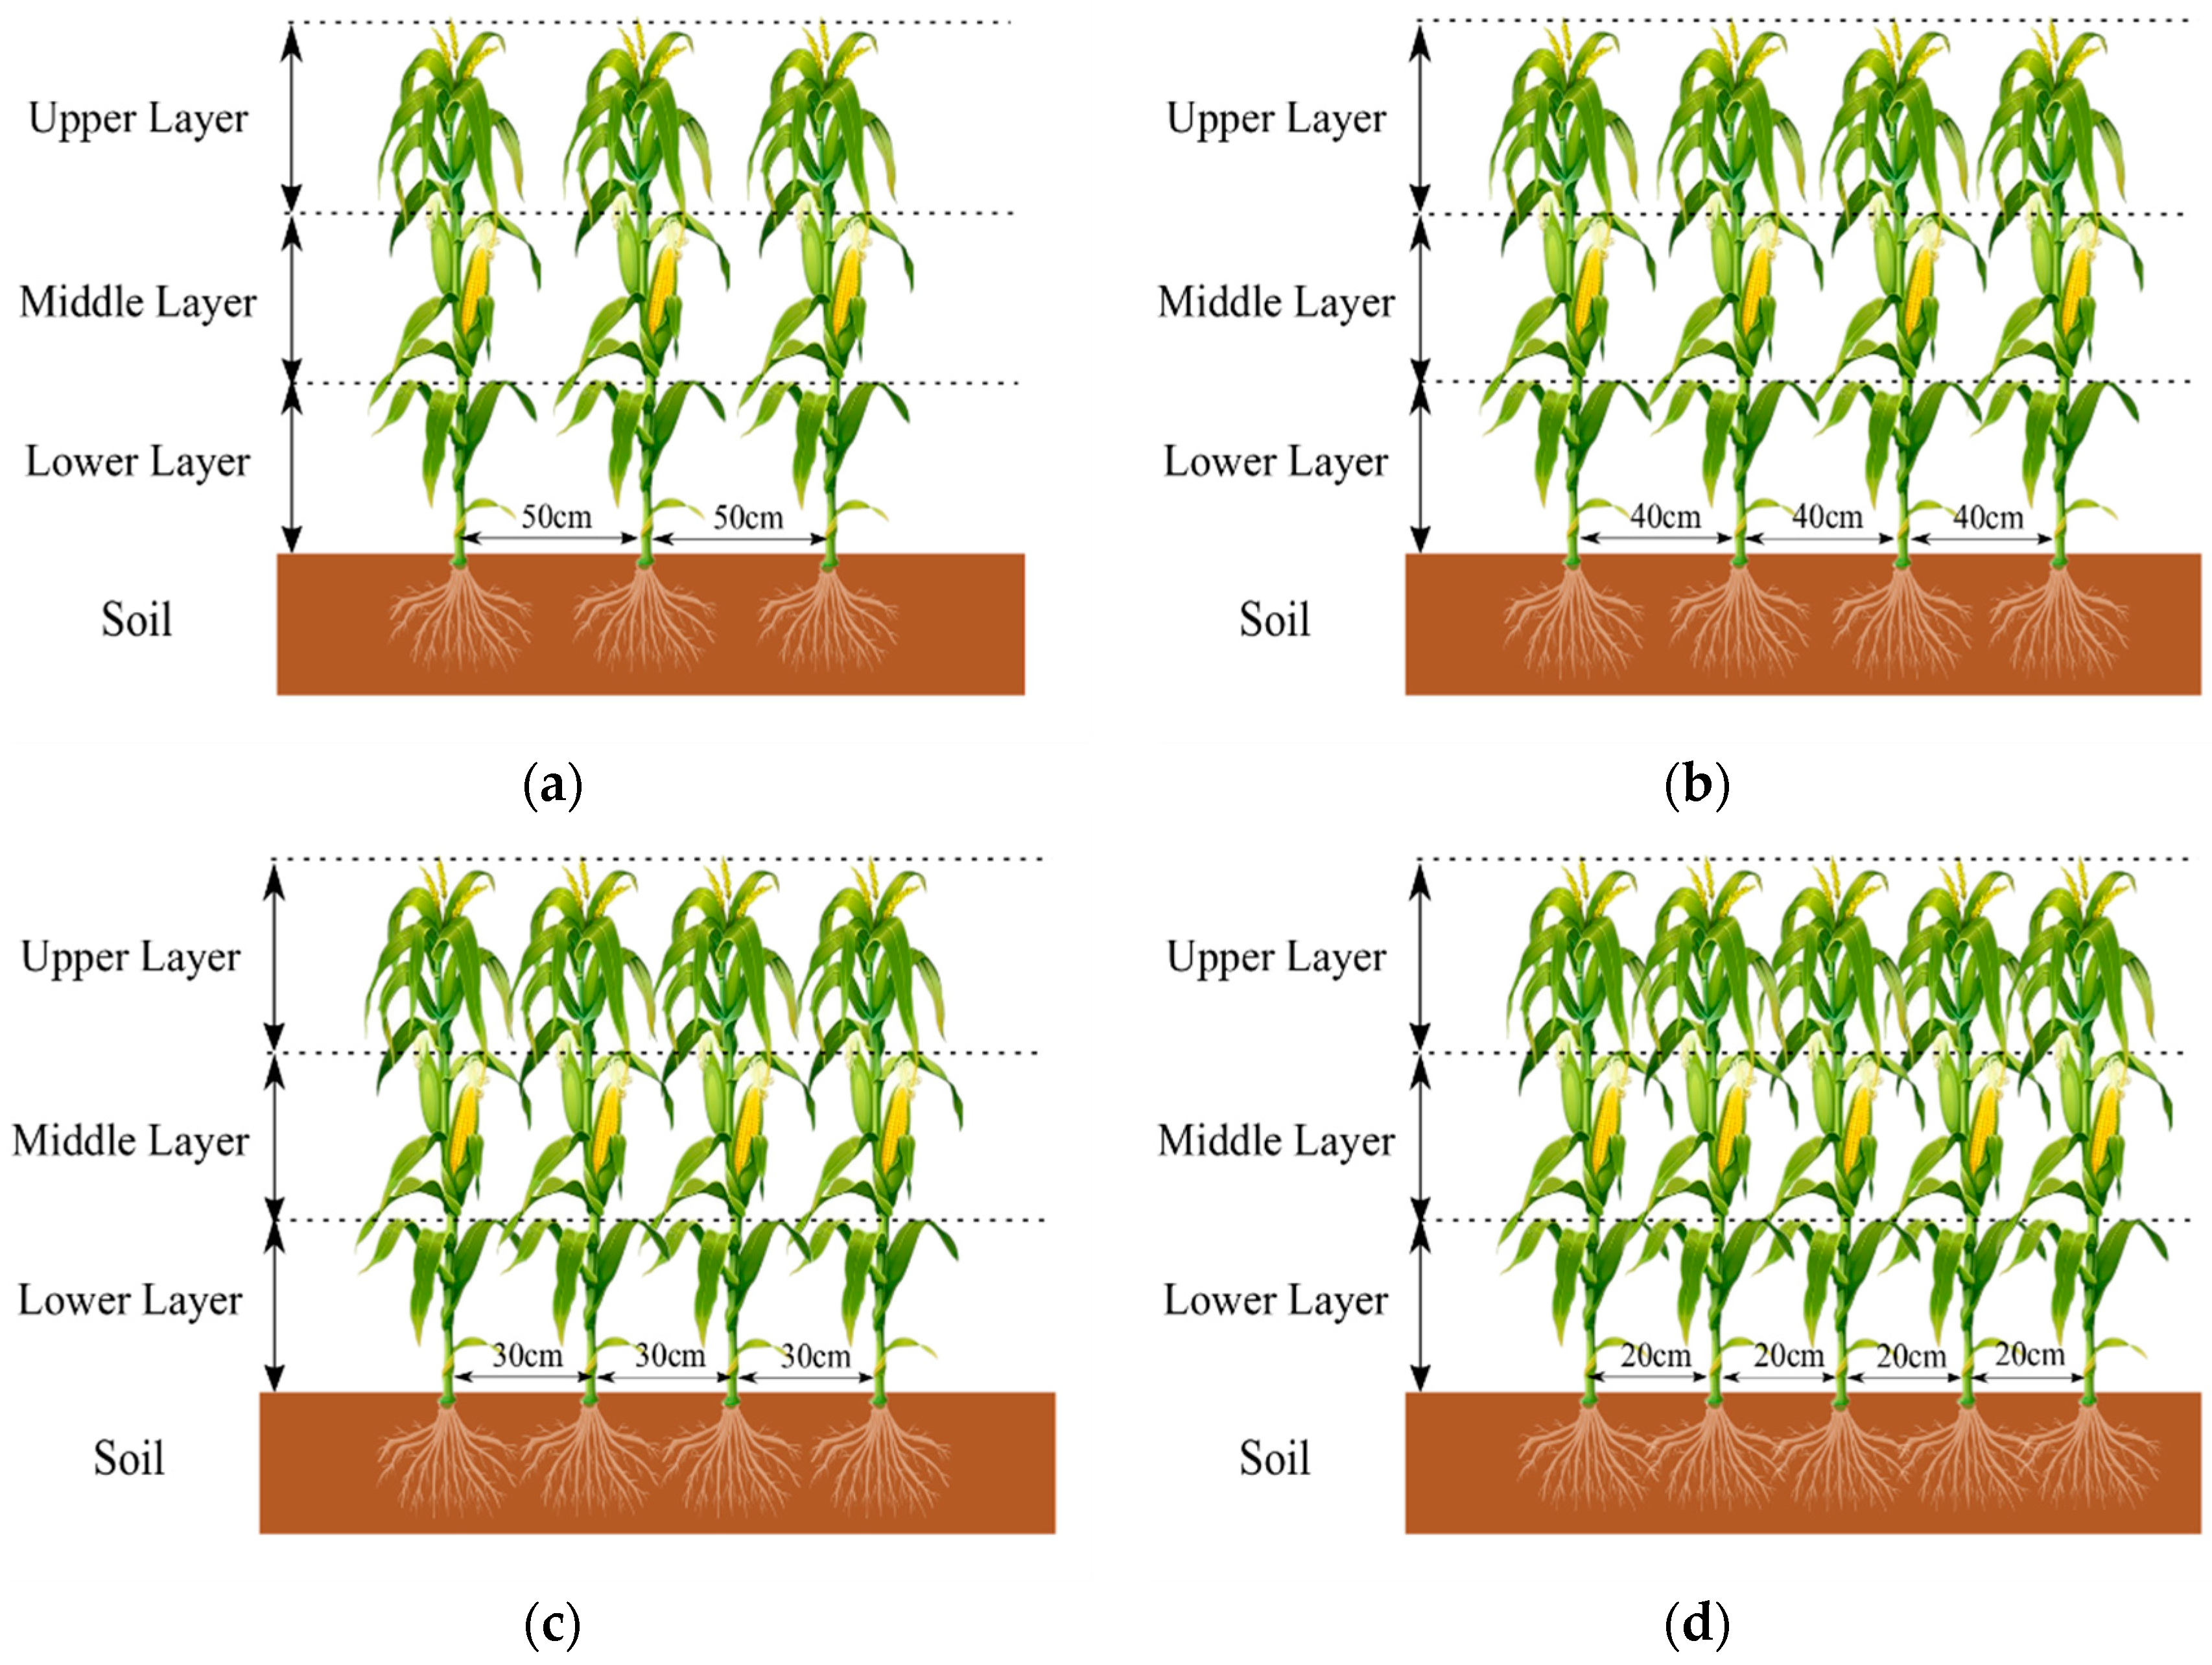
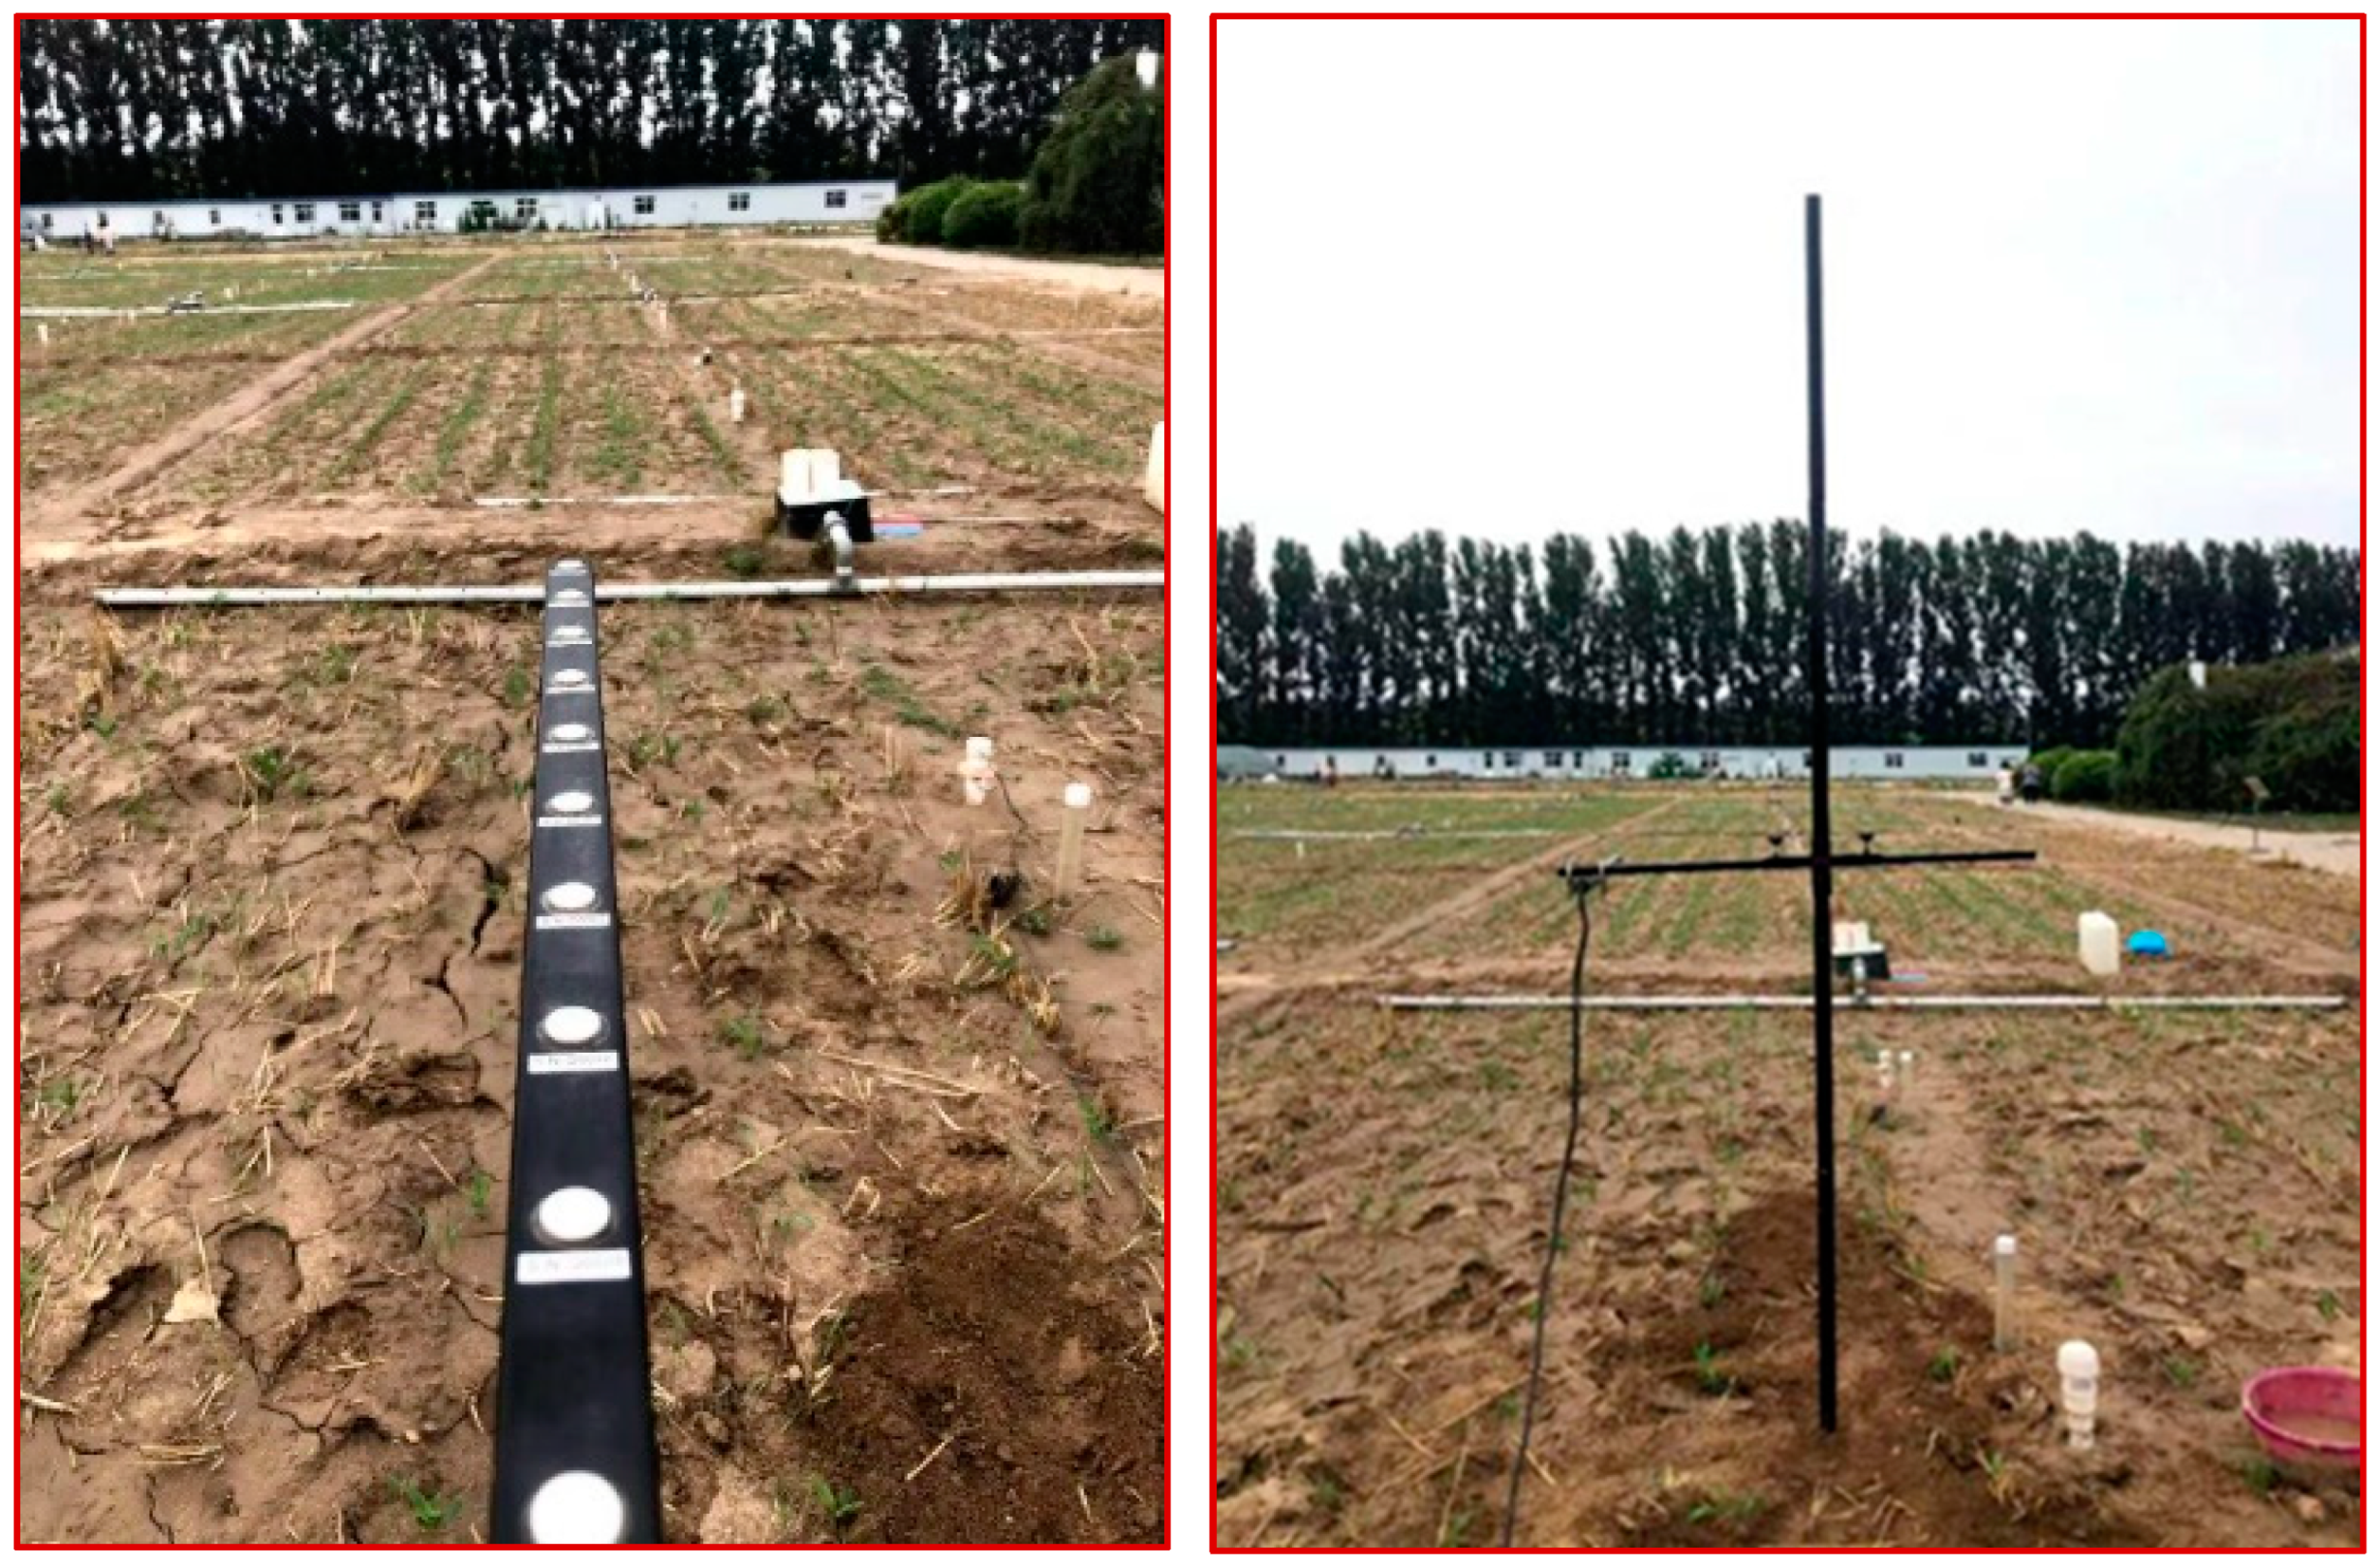
2.1. Experimental Conditions

Field experiments were conducted from 2021 to 2022 at the Daxing Water-saving Experimental Base of the China Institute of Water Resources and Hydropower Research (39°37′ N, 116°25′ E, altitude 31.3 m a.s.l.) in Beijing, China. The region has a warm temperate semi-arid continental monsoon climate, hot and rainy summer, and spring and winter drought with little rain. The mean annual temperature and precipitation are 12.1 °C and 540 mm. The average wind speed is 1.2 m·s−1, the average annual frost-free period is 209 d, the average annual evaporation from free water is more than 1800 mm, and the annual sunshine time is about 2600 h.
Figure 1 shows the meteorological data for 2021 and 2022. In the growing season, average temperatures during the crop cycle were similar for both years (24.05 and 24.21 °C for 2021 and 2022, respectively), but annual mean radiation was lower in 2021 (13.48 and 15.37 MJ·m−2·d−1 for 2021 and 2022, respectively). The experimental plots suffered from waterlogging in early and late July of 2022, and the accumulated effective precipitation in 2021 and 2022 was 292.0 mm and 456.7 mm, respectively.
In 2021, maize was planted on 18 June and harvested on 29 September; in 2022, maize was planted on 20 June and harvested on 30 September. The jointing stage started on 30 July in both years, the tasseling stage on 14 August, the grain-filling stage on 3 September, and the maturity stage on 27 September.
The soil at the site is sandy loam soil, with a field capacity of 0.33 cm3·cm−3, a permanent wilting point of 0.12 cm3·cm−3, a bulk density of 1.41 g·cm−3, and a total soil porosity of 41%. Mean soil properties in the first 100 cm of soil depth at sowing are: initial soil water content 0.20 cm3·cm−3, organic matter 12.17 g·kg−1, total nitrogen 1.00 g·kg−1, available P and available K is 16.9 mg·kg−1 and 123.6 mg·kg−1, respectively. Phosphorus and Potassium were applied (K2O: 115 kg·ha−1, P2O5: 165 kg·ha−1) before sowing, and the amount was also the common doses in the region.
Hybrid maize variety Jiyuan 168 was tested. The experimental design was a randomized block design with three replicate plots (6 m × 5.6 m) for each treatment. Four densities of 33,000 (D1), 42,000 (D2), 55,000 (D3), and 83,000 (D4) plants·ha−1 were arranged in the factorial experiment design (Figure 2). Sowing dates were 23 June 2021 and 26 June 2022.

2.2. Measurements and Calculations

2.2.1. Photosynthetically Active Radiation Measurements

We designed a system called RR-9100-Q (Rainroot Scientific Limited, Co., Ltd., Beijing, China) for measuring photosynthetically active radiation (PAR). The system mainly consists of a probe and a control terminal. Ten PAR (400~700 nm wavelength band) photosensitive diode probes are evenly distributed on a 1m long probe and used to measure the photosynthetic photon flux density along the probing rod at different positions in the canopy. The control terminal is connected to the base of the probe for observation and data storage of the RR-9100-Q system and is connected to a PAR Silicon Photovoltaic Detector LI-190SA (LICOR, Inc., Lincoln, NE, USA) in the same wavelength band. This enables simultaneous measurement of photosynthetic photon flux density (PPFD) outside the canopy (Figure 3).
The sensor consists of one set of AV-19LQ (Rainroot Scientific Limited, Co., Ltd., Beijing, China) solar total radiation sensors and four sets of AV-19LQ linear photosynthetically active radiation sensors. The power supply system consists of 12 Ah rechargeable batteries and 20 W solar panels. A set of AV-19LQ linear photosynthetically active radiation sensors is placed in each processing group of the support frame to drive AV-19LQ to move horizontally on the horizontal support arm. The top of the vertical column is the LI-190SA container. The overall color of the support frame is black to reduce the interference of its reflection on the radiation status of the observation site.

2.2.2. Light Interception Rate

Photosynthetically active radiation interception (IPAR) was measured with the 1-m long RR-9100-Q detector system between 10:00 and 14:00 h every 5 days after the jointing stage. Three measurements were performed for each replicate. The first measurements were taken above the canopy to determine incident PAR, with the probe moving parallel to the crop rows at an interval of 20 cm as the horizontal distance of the canopy [32]. The other measurements were taken above the soil surface, and the sensor was placed below the canopy. PAR was measured at an interval of 20 cm vertically from the soil surface upward to determine transmitted PAR. The maize canopy was divided into three layers. The bottom layer is from the ground to 1/3 of the plant height. The middle layer is from 1/3 to 2/3 of the plant height, and the top layer is above 2/3 of the plant height, in addition. The PAR interception rates of four different horizontal interlines at the same canopy height were averaged to obtain the PAR interception rate at the canopy height [33]. The incident PAR and fraction of PAR intercepted at midday (FPAR) were calculated as follows:
I P A R = P A R n P A R n 1
F P A R = I P A R P A R n
where IPAR is the photosynthetically active radiation interception (MJ·m−2·d−1), PARn is the mean of the incident PAR detected above the canopy, n represents the top of the canopy, 2/3, and 1/3 of the canopy, and n − 1 represents 2/3 and 1/3 of the bottom of the canopy (ground).
The transmitted fraction PAR (TPAR) through the canopy was obtained by linear regression between the incident PAR above the canopy and the incident PAR through the canopy. The canopy TPAR was calculated using the following equation [34]:
T P A R = P A R n P A R n 1
The first and last measurements were taken above the canopy to determine the incident PAR (I0). The other four measurements were taken above the soil surface, with the sensor placed below the canopy and moved parallel to rows at regular intervals to determine the transmitted PAR, as indicated by Charles–Edwards and Lawn [32].

2.2.3. Above-Ground Biomass and Leaf Area Index

Starting from maize emergence, sample plants were measured weekly (2021 and 2022) to estimate the above-ground biomass and leaf area index (LAI). Five plants per plot (those adjacent to the site where radiation interception was measured) were collected. Biomass was separated into leaves, stems, leaf sheaths, ears, and tassels when present. Samples were dried in a forced-air drying oven at 70 °C until constant weight.
LAI was measured at an interval of three days and expressed on a per-ground area basis. Leaf area index was estimated as follows:
L A I = 0.74 × i = 1 n L i × W i M A X D × S
where Li is the length of the leaf, WiMAX is the maximum width of the leaf, D and S are the distance in meters between two rows and the space between two plants, respectively, and 0.74 is an empirical constant.

2.2.4. Radiation Use Efficiency and Precipitation Use Efficiency

In each treatment, three random quadrats covering a 10.0 m2 area were selected to determine yield and yield components (kernel number per square meter and 100-kernel weight). Grain and biomass yields were determined at 13% moisture content. Dry biomass was measured separately at the jointing stage (JS), tasseling stage (TS), grain-filling stage (GS), and maturity stage (MT), and the corresponding cumulative absorption intercepted PAR (IPAR) was computed to estimate radiation use efficiency (RUE, g·MJ−1), as proposed by [35]:
R U E = B I P A R
where B is the cumulative biomass at different stages, and IPAR is the corresponding cumulative intercepted PAR.
The precipitation use efficiency (PUE) was calculated using the following equation:
P U E = G r a i n   y i e l d P
where P is the amount of precipitation (mm) during the growing season.
The harvest index for maize (HI) was calculated using the following equation:
H I = G r a i n   y i e l d B i o m a s s   y i e l d

2.2.5. Light Attenuation

The Beer-Lambert light extinction coefficient (K) through the canopy was obtained by non-linear regression between the intercepted FPAR fraction and the plant’s LAI. The extinction coefficient was calculated by the following equation [36]:
K = ln ( F P A R ) L A I I
where K is the light extinction coefficient during the growing season and LAII is the cumulative leaf area index at canopy height I.

2.3. Statistical Analysis

SPSS 21.0 software (IBM, Armonk, NY, USA) was used for one-way analysis of variance (ANOVA) followed by the least significant difference (LSD) multiple range test. ANOVA was conducted with planting density condition level as a fixed factor to compare the effects of different canopy layers, growth stages, and years on maize radiation use efficiency (RUE), dry matter leaf area index (LAI), and light extinction coefficient (K). Data followed by p < 0.05 was considered statistically significant. Correlation analysis was performed using the Pearson correlation coefficient test, and figures were generated using Origin Pro (version 2021, Origin Lab).

3. Results

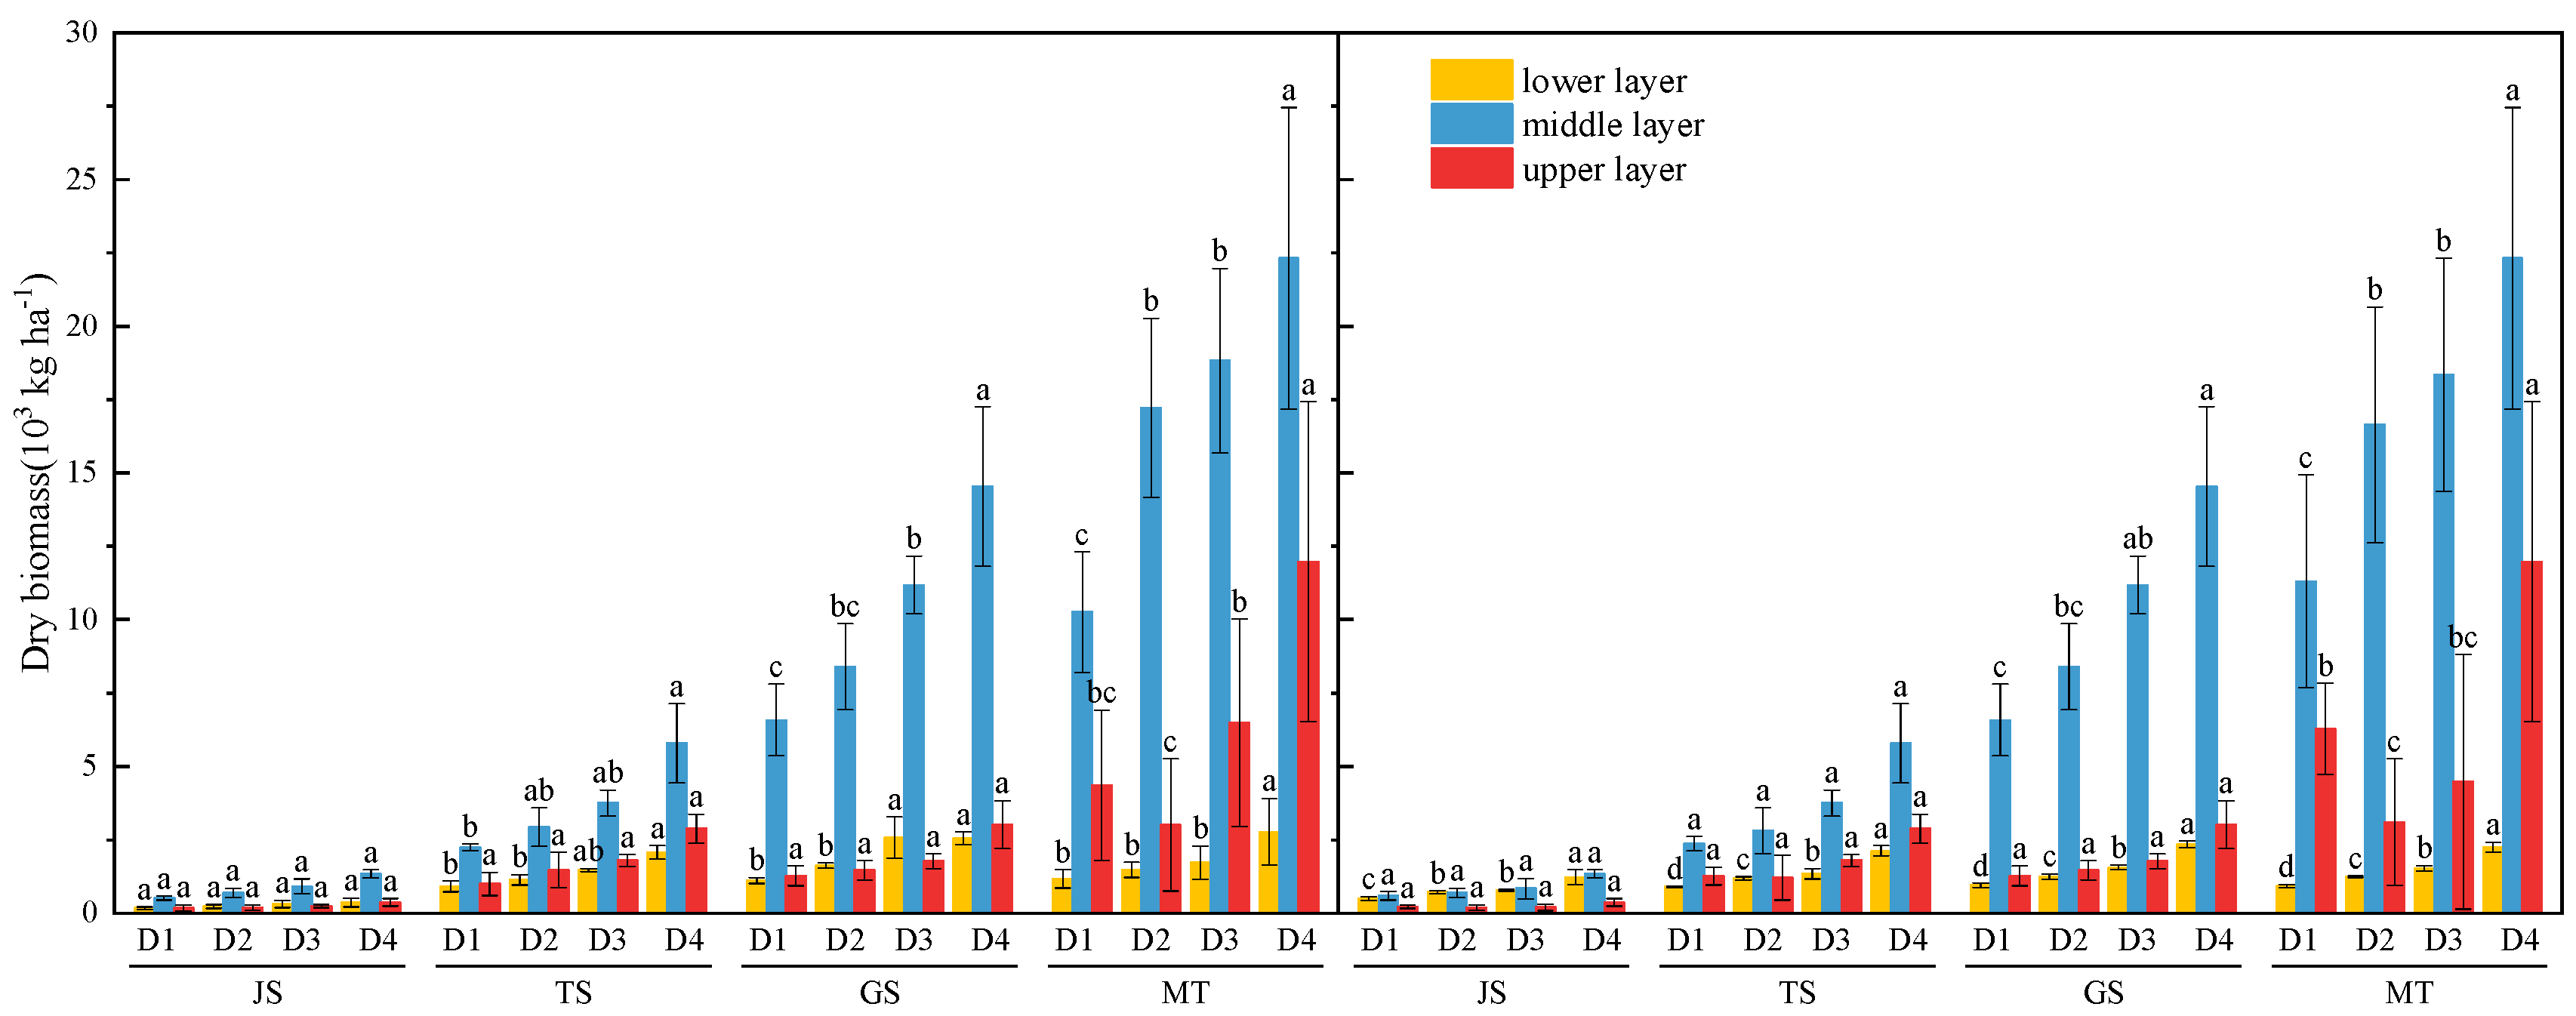
3.1. Biomass Yield and Grain Yield

Maize biomass yield and grain yield varied significantly (p < 0.05) with planting density in the 2021 and 2022 growing seasons (Table 1). The HI decreased with the increase in planting density (Table 1). Yield and its components were significantly affected by density in 2021 (p < 0.05) (Table 1). The average 100-kernel weight did not increase with the increase in planting density and showed the highest value in the D3 treatment (Table 1).
The PUE of maize was significantly (p < 0.05) affected by planting density during the different cropping seasons (Table 1). Similar to the trend of grain yield, the PUE decreased with increasing planting density, reaching the highest level in the D4 treatment. Compared to the D4 treatment, the PUE of the D2 and D3 treatments decreased by 8.3% and 13.8%, respectively.

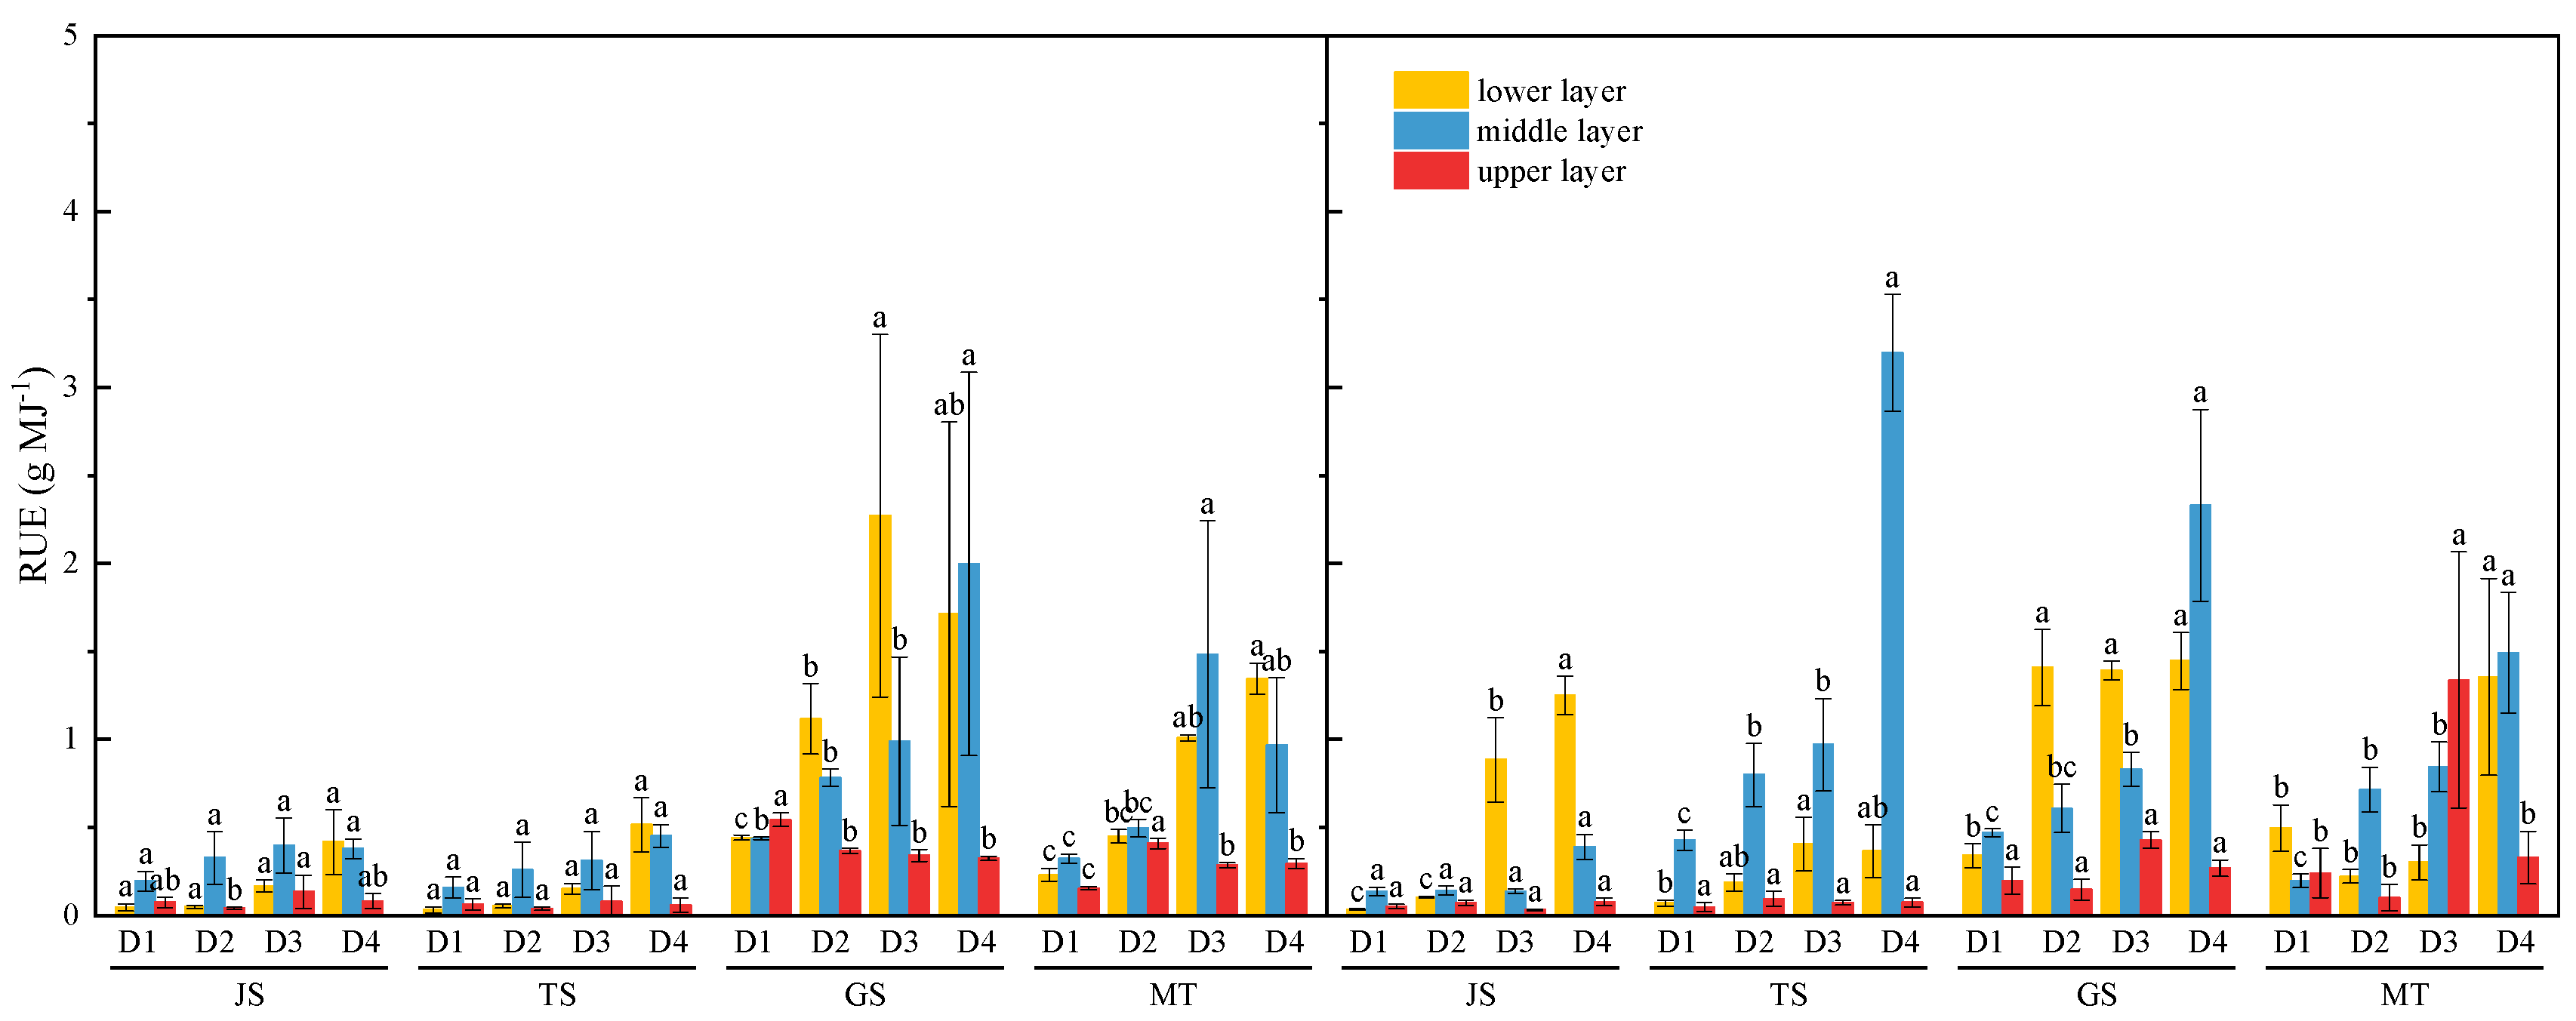
3.2. Radiation Use Efficiency

The RUE of maize was significantly (p < 0.05) affected by planting density after the grain-filling stage of 2 years (Figure 4). In different treatments, the mean value of canopy RUE increased slowly during the jointing stage and rapidly increased after the filling stage. The jointing stage is the key period for the rapid accumulation of dry matter by maize. At this time, the upper part of the crop canopy is not fully developed and is less affected by density. Under high-density treatment during the jointing stage, the RUE of the middle layer and lower canopy was greater than that of the upper layer, with RUEmiddle layer > RUElower layer > RUEupper layer. On the contrary, with the increase in maize canopy closure, IPAR increased with the increase in planting density, while RUE and cumulative biomass showed the same trend. At the mature stage, RUE for biomass yield increased by 13.1% to 66.7% (2021) and 35.6% to 151.8% (2022) for the D2, D3, and D4 treatments, respectively. Planting density had a significant (p < 0.05) effect on biomass RUE.
In the 2 years, the accumulation of above-ground biomass increased with the increasing planting density (Figure 5), with the highest value recorded in the D4 treatment. The accumulation of dry matter rapidly increased from the JS to the GS stage, reaching the highest value during physiological maturity (Figure 5). In 2021, the dry matter of the middle layer increased from 699.9 (D1) and 1611.3 (D4) in the JS stage to 7368.7 (D1) and 16,356.7 (D4) kg ha−1 in the MT stage. The growth rates were 952.7% (D1) and 915.1% (D4), respectively, and the growth rate of D1 was higher than that of D4 treatment. A similar pattern was observed in 2022. The growth rate of the middle layer of the canopy was significantly greater than that of the lower and upper layers, mainly due to the gradual increase in dry matter accumulation in maize male ears after the jointing stage.
In 2 years, maize plant height increased continuously with the fertility period, and the differences between treatments were not significant (p < 0.05) except for the GS period in 2021 (Figure 6). At the GS stage, the pattern of change was consistent: HD1 < HD2 < HD3 < HD4 in both years, and D1 and D4 treatments reached significant levels.

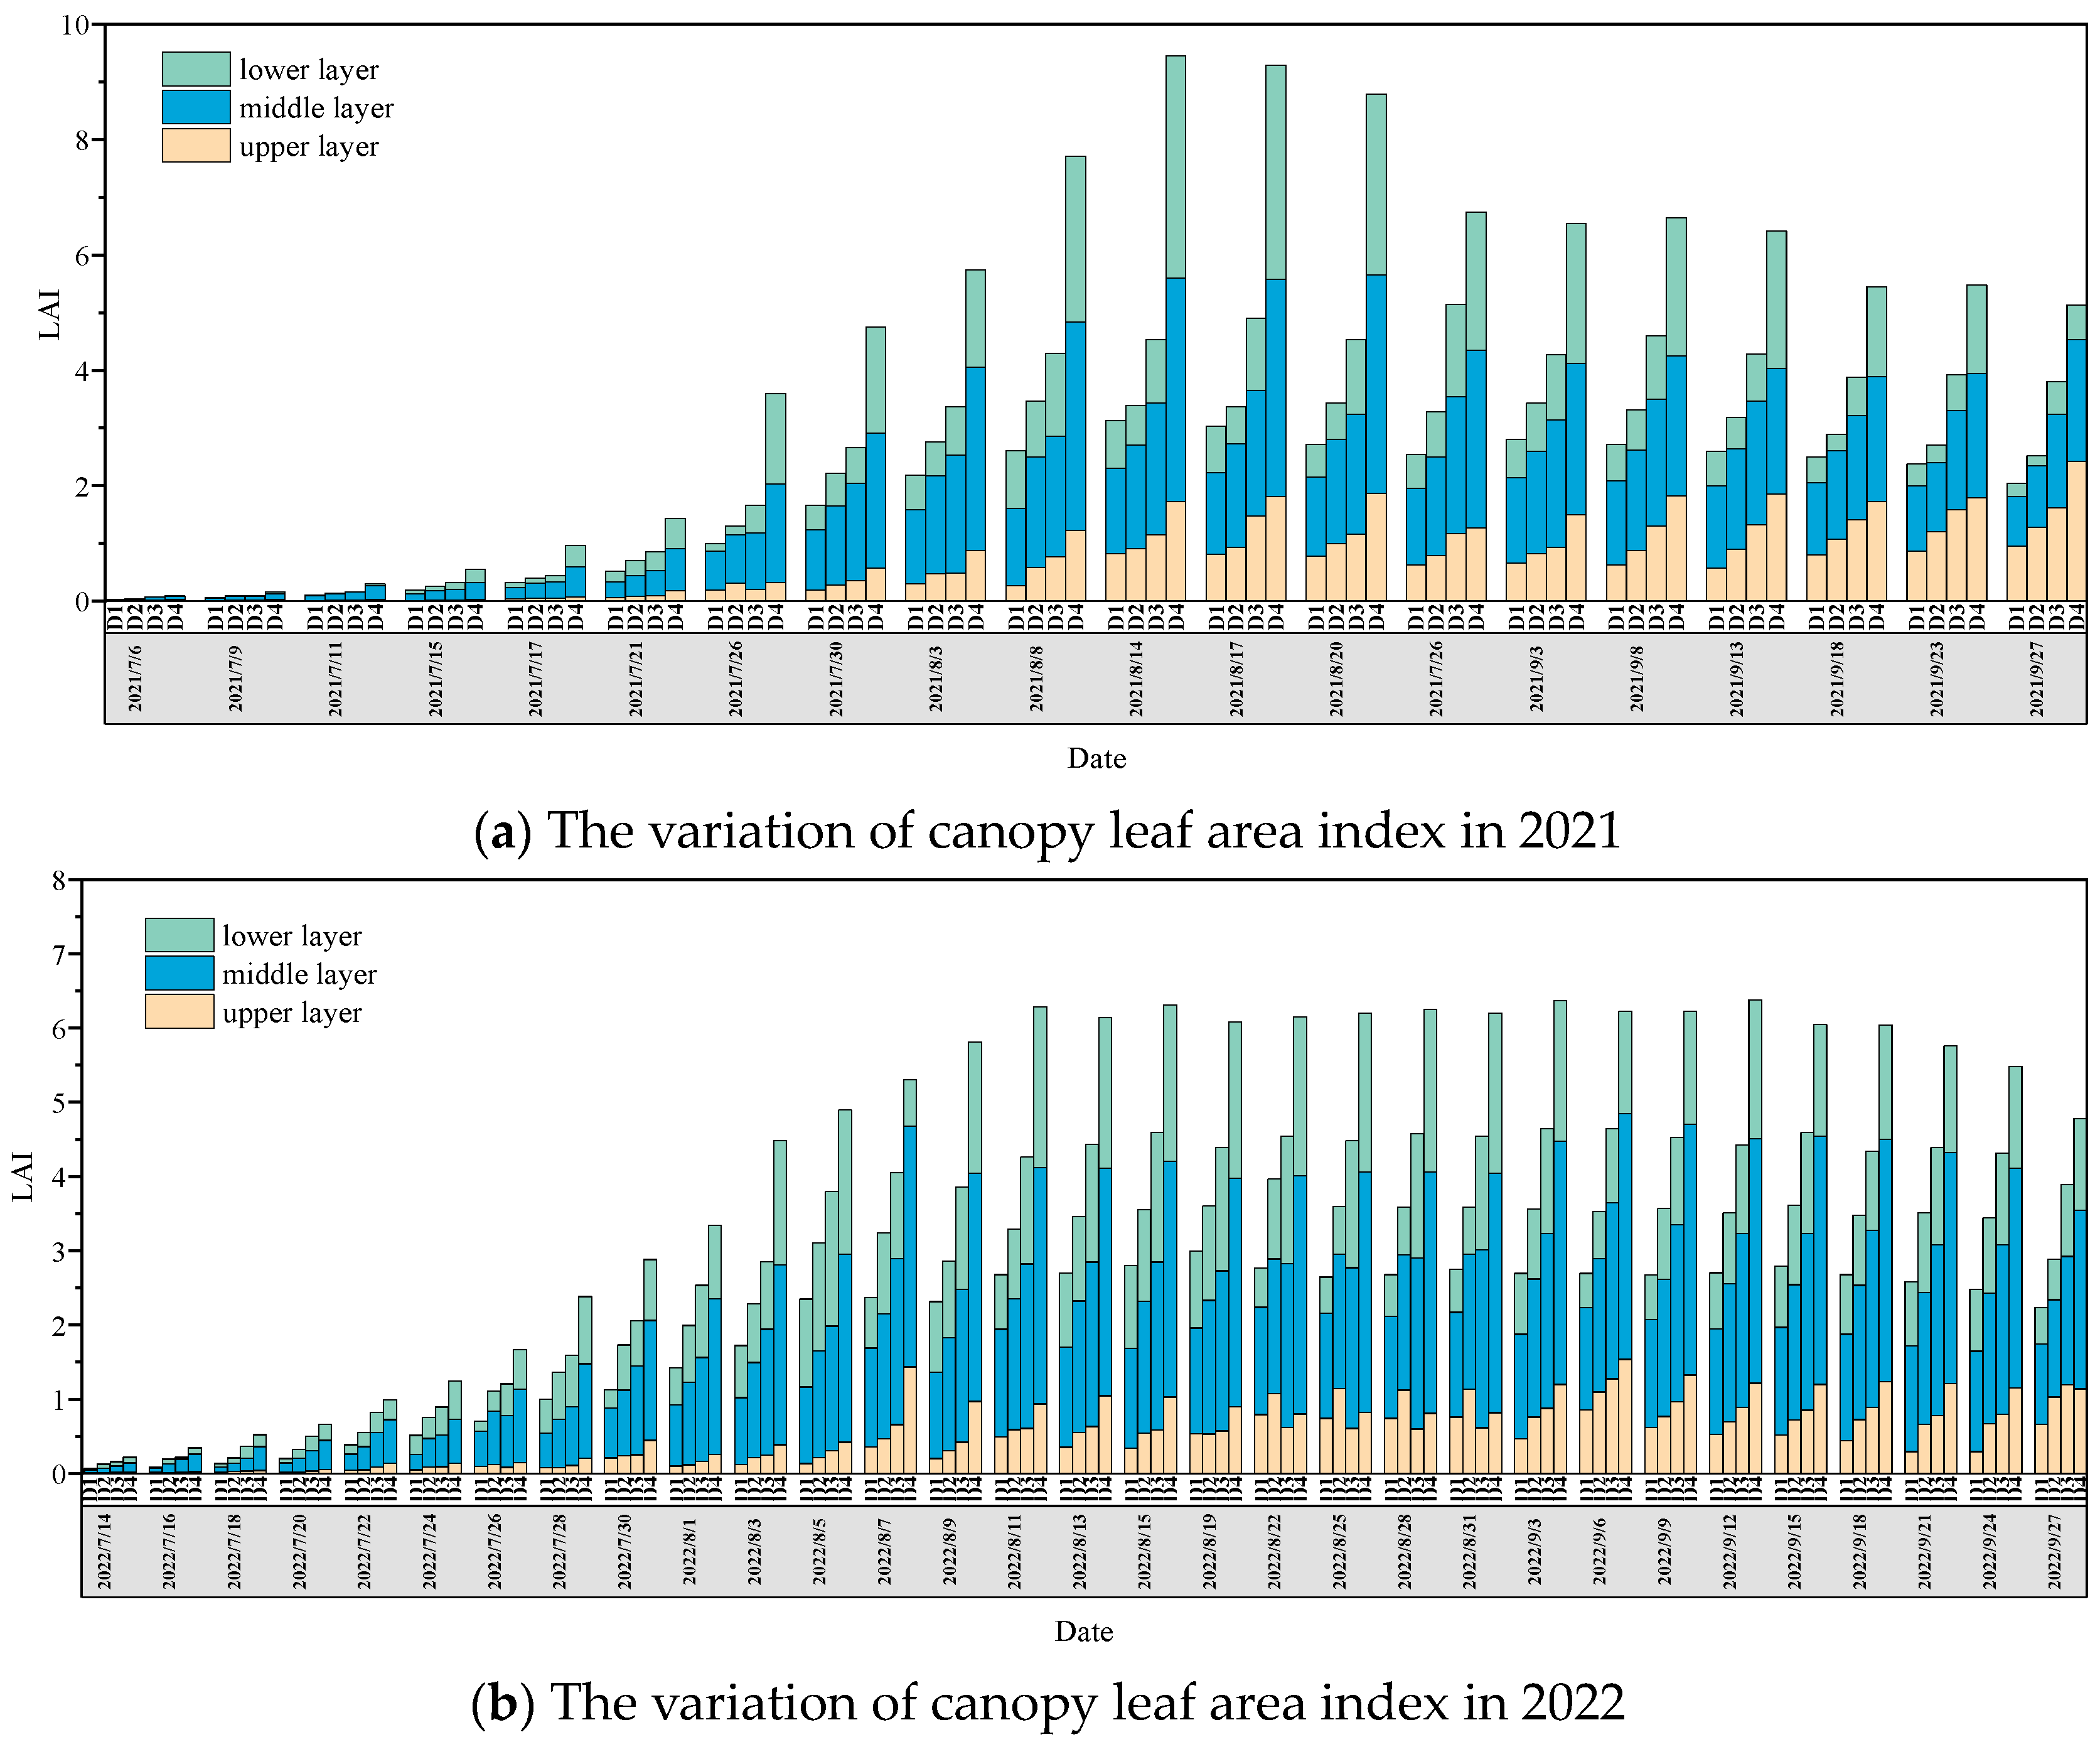
3.3. Leaf Area Index of Different Densities

As shown in Figure 7, the leaf area index (LAI) of different treatments expanded with plant growth in the early stage, while the canopy LAI increased rapidly during the JS and reached its peak at the tasseling stage, and then gradually decreased due to the senescence of lower leaves. The leaf area index during the entire growth period showed a parabolic variation. As the density increased, the LAI gradually increased. The LAI of the D4 treatment was higher in 2021 than in 2022 (Figure 7). Rainfall prior to the jointing stage in 2021 promoted an increase in leaf area, but effective rainfall at the tasseling stage promoted a more significant increase in leaf area index in the D4 treatment. The maximum LAIs differed among densities (p < 0.01). The highest value of D4 treatment in 2021 was 9.45 (14 August 2021), while the maximum LAI in 2022 was only 6.38 (31 August 2022).
The LAI was significantly affected by planting density over the 2 years (p < 0.05) (Table 2). Total LAI reached its highest values at the TS, but the upper LAI reached its highest values at the maturity stage. Compared with the D1 treatment, the total LAI of the D2, D3, and D4 treatments showed an increase of 22% to 172% (2021) and 32% to 129% (2022), respectively. The vertical variation in LAI in the canopy indicated that the overall difference came mainly from the differences in the upper and middle parts of the canopy. The effect of density on the LAI of upper layer leaves was most significant at the maturity stage, for middle layer leaves at the jointing stage, and most significant for lower layer leaves at the filling stage. The interaction effect of planting density was significant for the middle and lower layers of the canopy (p < 0.05).

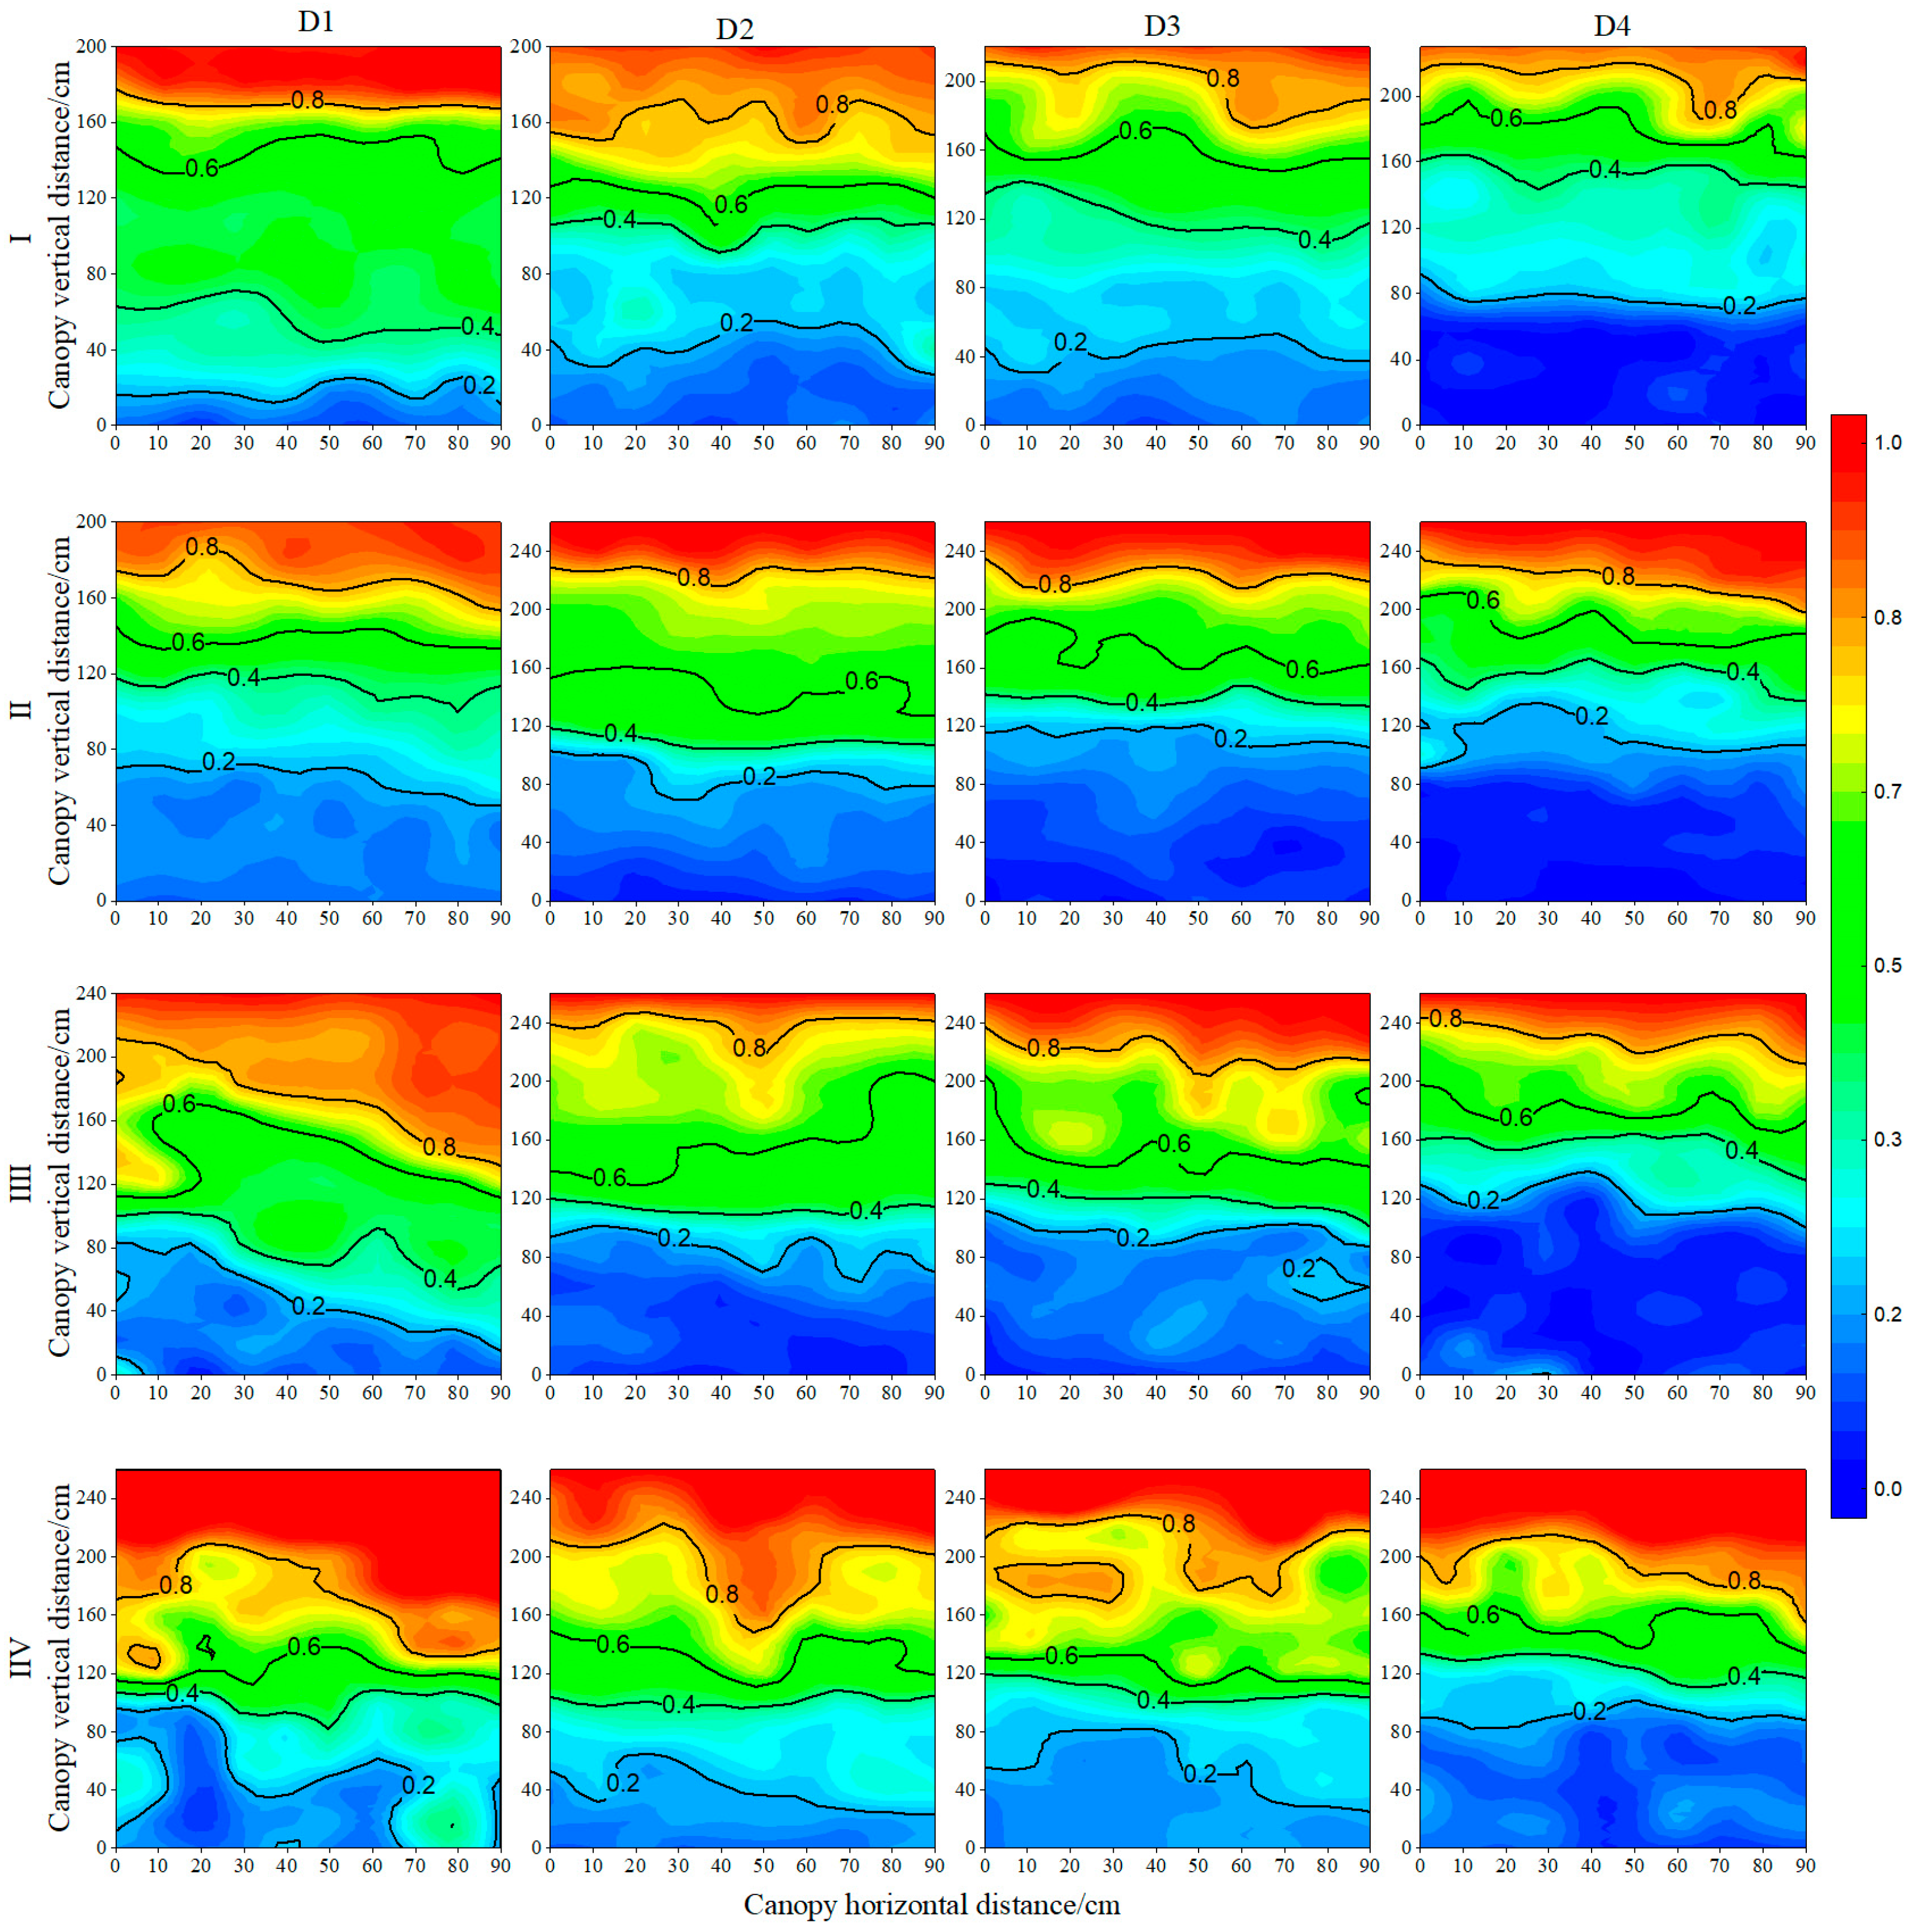
3.4. Maize Transmitted Photosynthetically Active Radiation of Entire Canopy throughout Growth Period

Figure 8 and Figure 9 show the vertical and horizontal distribution of transmitted photosynthetically active radiation (TPAR) over the maize developmental stages (jointing, tasseling, grain filling, and maturity) with four plant densities in 2021 and 2022. A tendency toward less TPAR was observed under high plant densities. Compared with the D4 treatment, the mean TPAR values of the D1, D2, and D3 treatments increased by 26.7%, 19.6%, and 13.6% over the entire growth season in 2021, and by 56.7%, 38.1%, and 26.0% in 2022, respectively. The TPAR of maize was significantly affected by planting density and canopy hierarchical structure. As the canopy increased, the TPAR in the lower part of the canopy gradually decreased. During the entire growth season, the TPAR values of the upper and middle layers in 2021 increased by 430.5% and 188.3%, respectively, compared to the lower canopy layer. In 2022, these increases reached 515.9% and 215.1%, respectively, surpassing the values of the lower canopy layer. Although the blade angle can automatically adjust and improve the light transmittance with increasing density, the degree of adjustment is not as significant as the effect of density on light transmittance. As the density increased, the light transmittance at the lower and middle layers of the canopy (panicle layer) still showed a significant downward trend.
The numbers on the contour lines in the Figure 8 and Figure 9 represent the values of TPAR, with TPAR closer to 1 indicating more abundant light exposure; conversely, values farther from 1 suggest insufficient light transmittance. A dense distribution of contour lines indicates a rapid decrease in light transmittance, while sparse contour lines suggest a slower decrease in transmittance. During the entire growing season, the average value PAR at the top of the canopy was 2140 μmol/(m2·s), whereas the average PAR at the bottom of the canopy under D4 treatment was only 44.18 μmol/(m2·s). Meanwhile, the PAR at the bottom of the canopy under the D1 treatment was 201.41 μmol/(m2·s), the D2 treatment was 183.32 μmol/(m2·s), and the D3 treatment was 169.45 μmol/(m2·s). The light transmittance of the different leaf layers of the population decreased with the increase in density. Particularly, density has a great influence on the light distribution of the population in the jointing and filling stages. At the same growth stage, different maize populations had different leaf stratification structures and light transmittance. The TPAR of a specific maize population varied at different growth stages. At the jointing stage, in the lower part of canopy, the TPAR of D4 treatment near the horizontal position of maize was 0.18 (2021) and 0.10 (2022), respectively, lower (p < 0.05) than PAR transmittance of D1 treatment at the same location of 0.32 (2021) and 0.24 (2022), as well as the TPAR of D2 treatment at the same location of 0.36 (2021) and 0.18 (2022). During the grain-filling period, four treatments were performed at the mid-point between rows (40-cm horizontal position; Figure 8 and Figure 9). The TPAR in the middle of the canopy remained between 0.20 and 0.25 with no significant difference (p > 0.05), whereas the TPAR in the lower canopy under D4 treatment was 0.15 (2021) and 0.17 (2022). The TPAR at the same location treated with D1 was 0.10 (2021) and 0.11 (2022), respectively, with significant differences (p < 0.05), indicating that the increase in density mainly improved the TPAR in the lower part of the canopy.

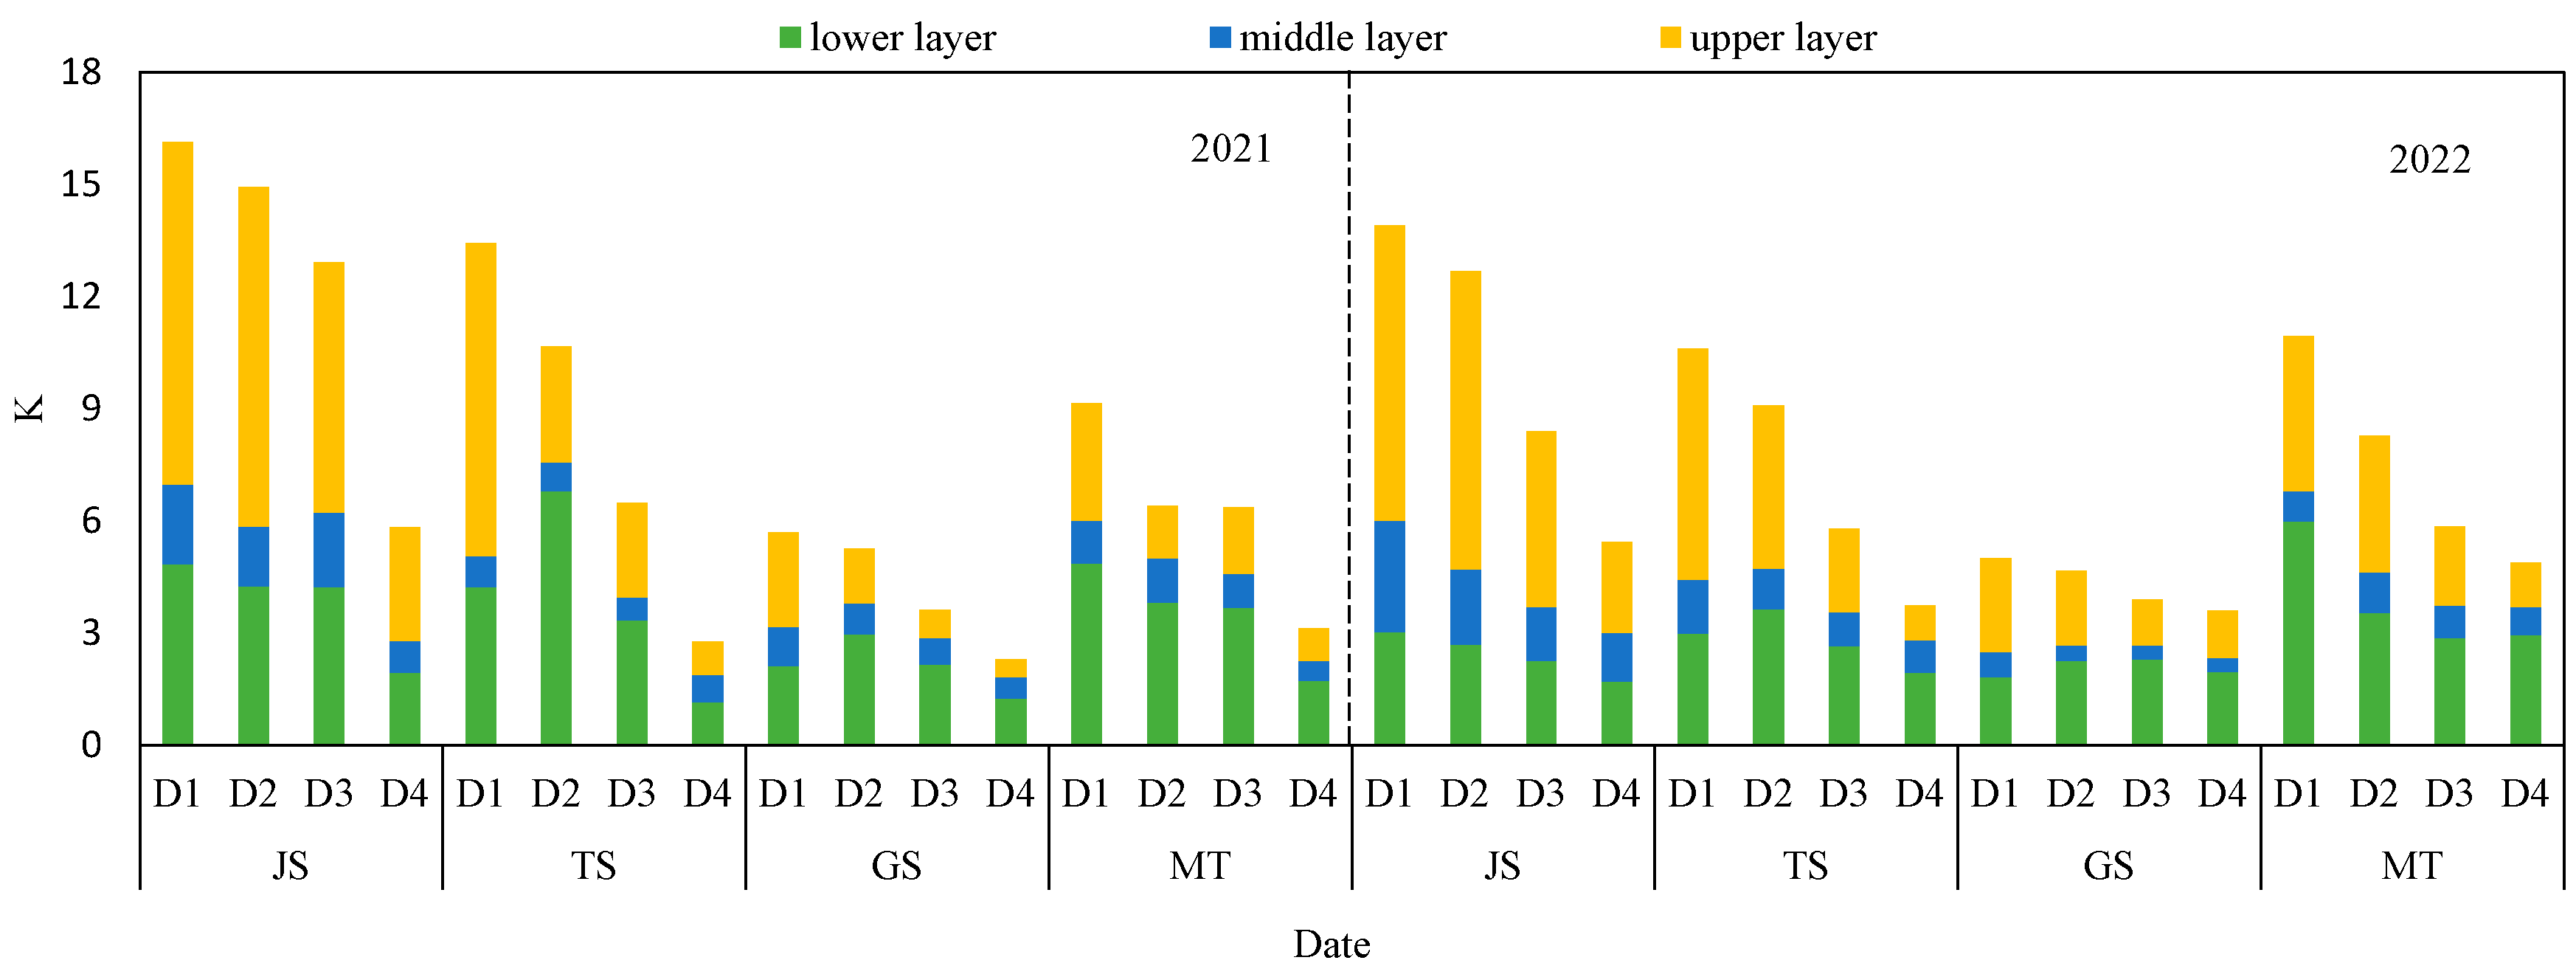
3.5. The Light Extinction Coefficient

Canopy structure can affect the radiation distribution and the interception rate of the canopy. The extinction coefficient of a crop population can indicate the degree of radiation attenuation by the crop canopy. The extinction coefficient is sensitive to environmental factors and is affected by the leaf angle distribution, sun altitude angle, leaf area index, planting density, and planting method. As shown in Figure 10 and Table 3, the K values of maize populations under different treatments in 2021 and 2022 were the highest at the jointing stage, and the K value varied significantly under different density treatments, ranging from 5.82 to 16.14 (2021) and 5.43 to 13.90 (2022), respectively. The variation patterns were as follows: KD1 > KD2 > KD3 > KD4. With growth and development, the leaves thickened, the leaf area increased, and the extinction coefficient gradually decreased. At the tasseling stage, maize leaves grow vigorously; the extinction coefficient gradually decreases with values ranging from 0.60 to 8.38 (2021) and 0.87 to 6.18 (2022). During the grain filling and maturity stages, leaf growth slowed down, and plant and leaf shape changes were relatively small, resulting in a lower extinction coefficient.
As the height of the canopy decreased, the degree of radiation attenuation increased, and the lower leaves received less light, resulting in lower shading levels. Therefore, the extinction coefficient K of the crop population became smaller. The variation in K values in each layer of maize was Kupper layer > Klower layer > Kmiddle layer, which indicated that the effect of density on canopy stratification structure was mainly manifested in the lower and middle layers. The K value showed a decreasing trend with an increase in density.

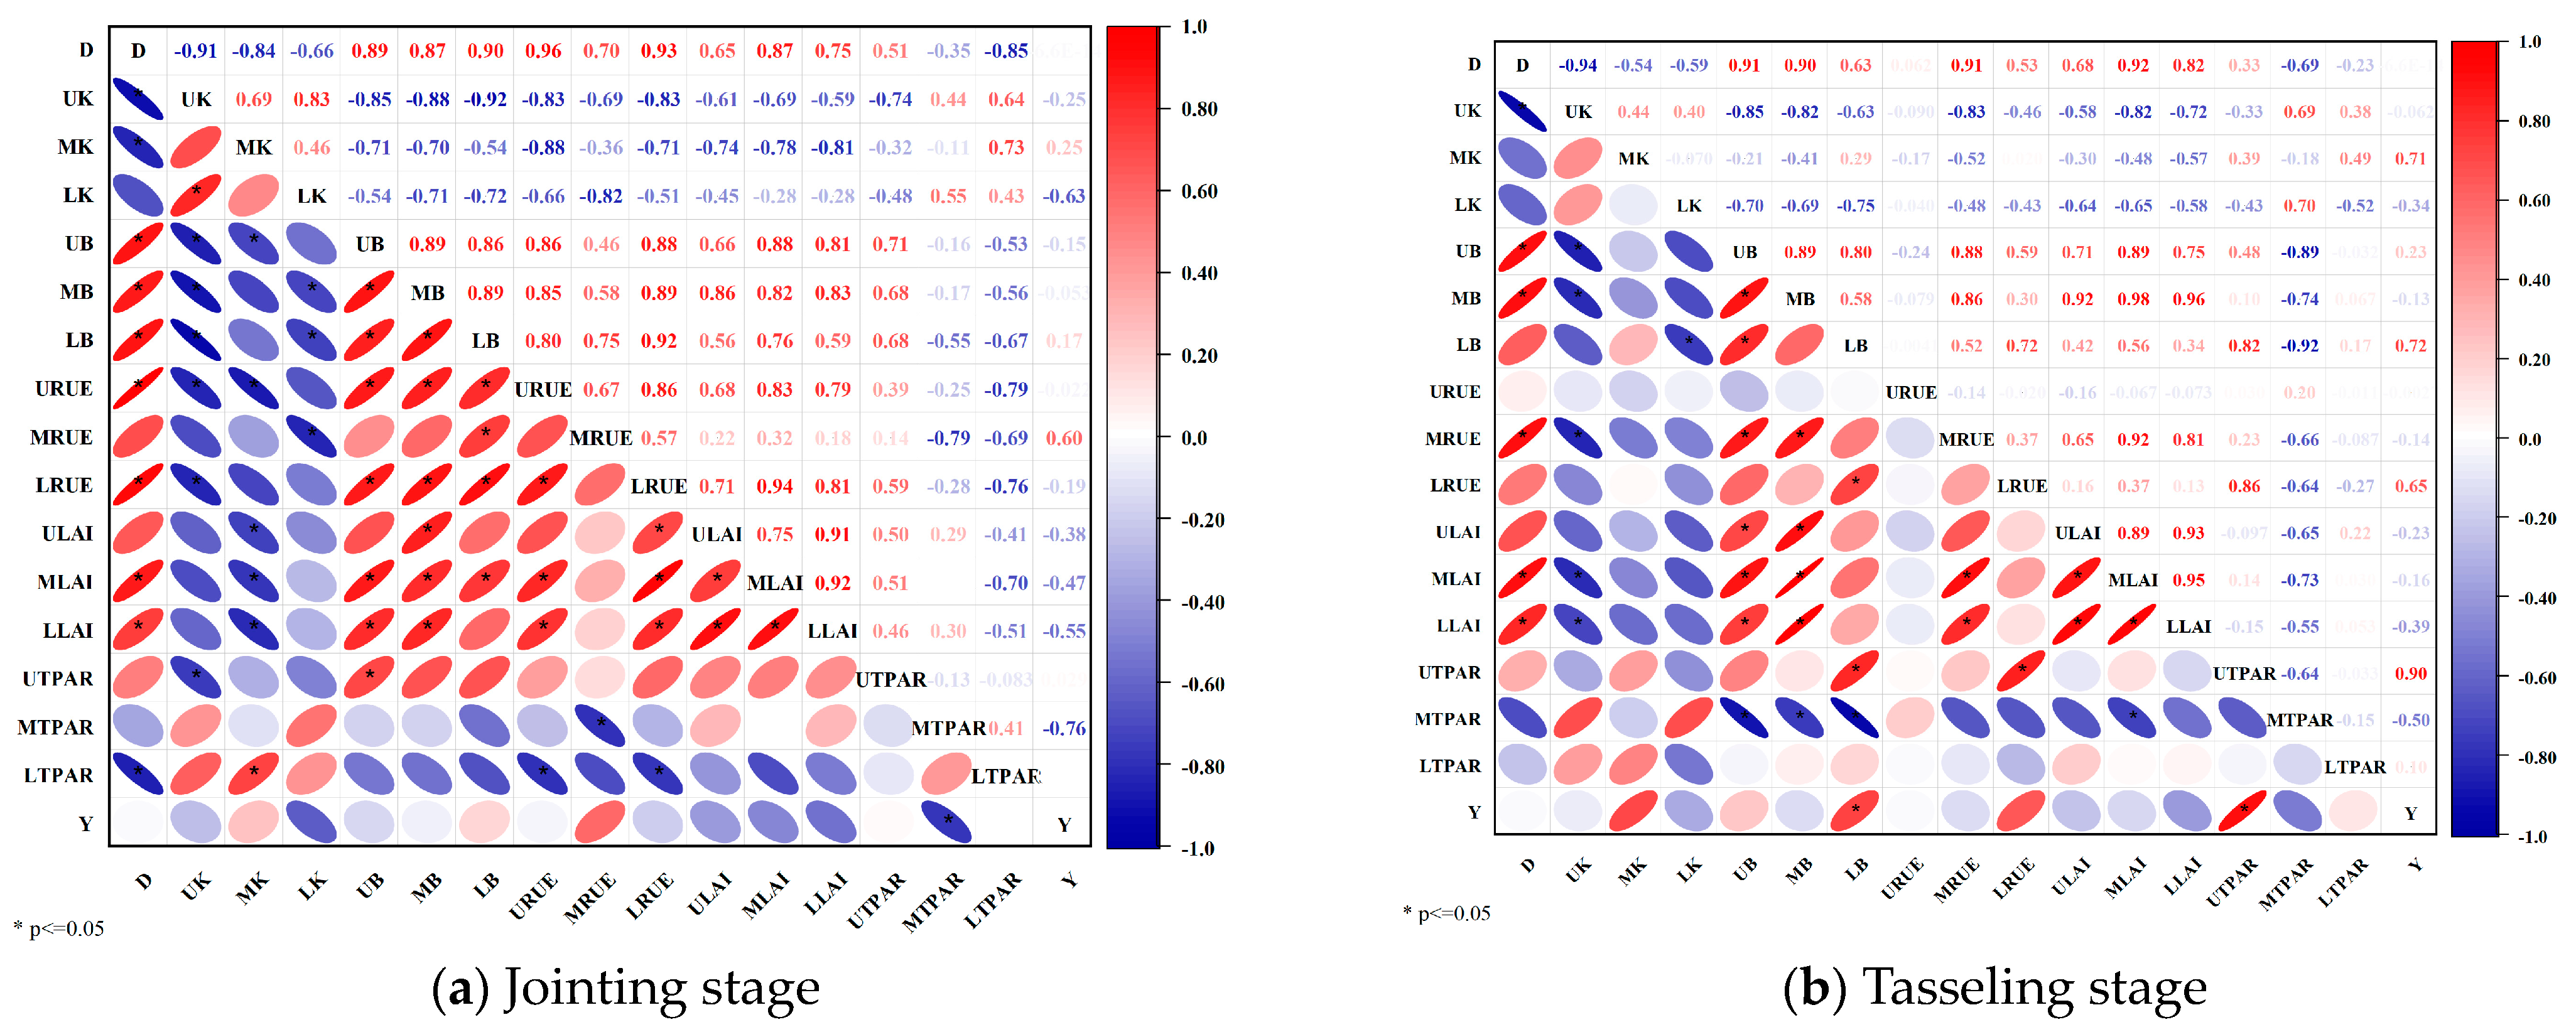
3.6. Relation between the K, B, RUE, LAI and TPAR to Density

Radiation distribution in crop canopies depends on complex processes such as direct solar radiation and scattered sky radiation, which are repeatedly reflected, absorbed, and projected by plant organs and the ground. Figure 11 shows the responses of extinction coefficient (K), biomass (B), radiation use efficiency (RUE), leaf area index (LAI), and transmitted photosynthetically active radiation (TPAR) to different densities in different growth periods and canopy levels (middle layer, lower layer, upper layer). These parameters were interrelated with each other at different growth stages and years. Density was negatively correlated with the extinction coefficient, and the correlation coefficients with the Kupper layer reached a significant level (p < 0.01), with correlation coefficients from 0.83 to 0.94. The correlation coefficients with the Kmiddle layer reached a significant level (p < 0.05). This suggests that the effect of density on the extinction coefficient occurred mainly in the middle and upper layers of the canopy. Except for the maturity stage, density was positively correlated with dry matter (biomass), and the dry matter in the lower layer reached a significance level (p < 0.05). With the extension of the growth period, the difference between the middle layer of dry matter and density gradually became significant, whereas the correlation between the lower layer gradually weakened, which indicated that the effect of density on dry matter was related to the canopy stratification structure.
Density was positively correlated with LAI, with significant levels (p < 0.01) observed in both the upper and middle layers, with correlation coefficients ranging from 0.83 to 0.94. During the tasseling and grain-filling stages, the correlation between lower LAI and density was not significant. This is because, during this period, the lower leaves were fully grown and developed, and due to the high coverage of each density treatment, the differences between treatments were not significant. There was no correlation between density and RUE, which indicated that density was not the main factor affecting RUE. We found that during the tasseling stage, the middle RUE was positively correlated with the upper layer dry matter, reaching a significant level (p < 0.01) with a correlation coefficient of 0.88. The correlation between the lower layer RUE and dry matter was not significant, which indicated that changes in RUE were related to dry matter accumulation. The correlation between density and TPAR was complex. The density was positively correlated with TPAR of the upper layer, reaching a significance level (p < 0.05) at the maturity stages, with a correlation coefficient of 0.80. However, the densities of the middle and lower layers were negatively correlated with the TPAR. During the grain-filling stage, the correlation coefficient between density and lower TPAR reached a significant level (p < 0.01), with a correlation coefficient of 0.95.

4. Discussion

Previous studies have demonstrated that planting density has a greater impact on the population canopy compared to other cultivation and management measures [37,38]. Under high planting density, the maize canopy stratification structure is compact, the plants are short, and the leaves are few and straight. Therefore, the canopy can intercept more light with a higher leaf area index and improve its ability to resist stem lodging by reducing the height of the panicles. These characteristics all contribute to high yields of maize at high densities [39,40]. Similar results were also obtained in this study. Compared with the D1 treatment, the average LAI values of the other three densities of D2, D3, and D4 treatments increased by 18%, 39%, and 63% (2021), as well as 24%, 40%, and 56% (2022), respectively. As the leaves grew, the length and width of the lower leaves in the canopy gradually stabilized, with little change. The upper and middle leaves gradually completed their growth and development during the grain-filling stage and then began to decrease. After the tasseling stage, with the increase in density, the rate of leaf decline increased. When the leaf expansion reached its maximum value, the amplitude of change decreased, but dry matter accumulation gradually increased. Research has shown that the increase in maize yield is associated with a longer green retention period of leaves [41,42]. Maize can still maintain photosynthetic activity in the middle and late grain-filling stages [43,44] and maintain a high rate of dry matter accumulation and light energy utilization in the grain-filling stage [45,46]. The increase in maize yield was mainly due to the increase in dry matter accumulation rate during the grain-filling period [47]. Under different density conditions, maize yield increased with increasing density, and maize exhibited a strong tolerance to high density.
The radiation distribution within the crop canopy is formed by a complex process of repeated reflection, absorption, and projection of direct solar radiation and scattered sky radiation from plant organs and the ground [48]. In this study, as planting density increased, the TPAR values decreased, leading to a lower extinction coefficient. This might explain the elevated maize grain and biomass yield but the decrease in HI under high planting density in this study. As the leaves expanded horizontally, the phenomenon of shading from the upper leaves to the lower leaves of the plant population became increasingly serious, and the PAR was mainly absorbed and utilized by the middle and upper leaves of maize. Therefore, the maize TPAR in the canopy gradually decreased with the increase of LAI. TPAR of maize plants was relatively high in the early stage of growth and rapidly decreased from the tasseling stage. However, in the later stage, due to the aging of leaves in the lower part of the canopy, the PAR increased slowly. At the tasseling stage, the horizontal differences in TPAR under density treatments were relatively small at the 0 cm vertical position but gradually increased from 60 cm. The development of maize leaves and the expansion of LAI have a significant explanatory effect on the spatial distribution of TPAR in different years and spatial locations. During the jointing stage, maize plants grew rapidly, with LAI of 1.84–5.45 (2021 and 2022) for different treatments. The population light distribution was unstable, but the effective radiation transmittance in the canopy was relatively high. At the early stage of tasseling, as the leaf layer gradually increased, the LAI of D4 treatment reached 4.32–5.45 (in 2021 and 2022). The shading of upper leaves on lower leaves of the plant population became more serious, and the PAR decreased sharply from top to bottom. However, during the maturity stage, as the leaves senesced, TPAR increased.
The light energy utilization of the maize canopy was closely related to the canopy characteristics of the population. Efficient canopy can improve the photosynthetic capacity of the plants, thereby accumulating more dry matter [49]. The main factor that affects the distribution of photosynthetically active radiation in maize canopy is LAI. Under specific planting patterns and management systems, the size of the leaf area determines the vertical variation distribution of light intensity [50]. This study found a significant positive linear relationship between the LAI accumulation and biomass accumulation, which was consistent with previous research results [51]. After the tasseling stage, LAI increased to its maximum value, and then the variation magnitude decreased, but dry matter accumulation gradually increased. Additionally, the magnitude of this decrease was relatively small under low densities, which is beneficial to the assimilation of photosynthetic products and increases the distribution of carbohydrates on the spike. After the tasseling stage, the lower part of the canopy under different densities showed little change in dry matter RUE with complete development of stem and leaves, while the variation of RUE in the middle layer showed an upward trend with the increase of female spike dry matter. At the top of the canopy, as the upper leaves and panicles developed, the amplitude of variation in the upper RUE tended to stabilize. The TPAR of maize was significantly affected by planting density. A similar trend was shown with K and HI, but PUE showed an opposite trend, increasing with the increase of planting density.
The improvement of tolerance is an incidental effect of achieving high yield through large-scale breeding under high-density conditions rather than a direct result of selecting planting density adaptability [52]. In all the treatments, the total dry matter production steadily increased from crop growth to maturity (Figure 2). At the grain-filling stage, the dry matter in the (middle) panicle and middle layers reached a significant level (p < 0.01), with a correlation coefficient of 0.92. At the maturity stage, the dry matter in the panicle and lower layer reached a significant level (p < 0.01) with a correlation coefficient of 0.90 (Figure 10). The results showed that the dense planting increased the proportion of leaves in the panicle layer after the grain-filling stage, promoted the expansion of lower layer leaves, delayed the early senescence of upper layer leaves, and improved the supply capacity of assimilates during the grain-filling period. However, the effect of dense planting on dry matter, TPRA, and RUE in the early growth stage was not significant, which indicated that dense planting had little effect on the vegetative growth of maize in the early stage. Increasing the absorption of photosynthetically active radiation is also an effective way to increase yield, as the maximum leaf area index increases, and more importantly, the senescence of leaves is delayed in the final stage of the life cycle, leading to an extension of photosynthetically active period [53,54].
Due to some limitations of the study, we tried to fully consider the effects of various influencing factors on the growth of maize under different planting densities and attempted to quantitatively analyze the correlation analysis between various factors and the development of canopy structure at different fertility stages. However, there are still some influencing factors that have not been taken into consideration. In addition, some potential problems need to be solved in further research, such as the effects of different densities on canopy structure and its processes under water limiting factors and quantifying the interactions between canopy structure-light energy utilization-yield under more complex density scenarios. In future studies, the variables affecting canopy structure characteristics will be investigated more systematically to address the issues of food scarcity and rational resource utilization.

5. Conclusions

In this study, we comprehensively analyzed the effects of four planting densities of maize on transmittance PAR, biomass, leaf area index, radiation use efficiency, and light attenuation at different development stages and three hierarchical structures. The main conclusions are as follows: (1) There was a significant difference in the effect of density on the upper and the middle layer LAI, and from the tasseling stage, the difference gradually decreased with the growth of lower leaves. (2) The effect of density on dry matter was mainly reflected in the middle and lower layers of the canopy hierarchical structure, and the differences between treatments in the middle layer of the canopy were highly significant during the tasseling and grain-filling stages. This was mainly related to the gradual and complete development of female tassels, while the differences in the lower layer were related to the light adaptation of the canopy structure to the density. (3) TPAR is influenced by LAI, which was related to different canopy structures. The impact of density on TPAR varies among different layers, with a positive correlation in the upper layer and a negative correlation in the middle and lower layers. (4) RUE was mainly affected by dry matter accumulation. Especially at the early stage of tasseling, the dry matter in the middle of the canopy had a highly significant impact on RUE. (5) The effect of density on the extinction coefficient was mainly manifested in the upper and middle layers of the canopy, whereas the extinction coefficient of the lower layer was mainly related to TPAR. (6) By comparing the population PAR, IPAR and TPAR with LAI and biomass, we concluded that a density of 83,000 plants·ha−1 can effectively promote the growth of maize in the Daxing area of Beijing, China.

Author Contributions

M.D.: Conceptualization, Data curation, Formal analysis, Methodology, Writing—original draft, Writing—review & editing; Z.W.: Methodology, Software, Writing—review & editing; X.Z.: Writing—review & editing; X.C.: Data monitoring and analysis; B.Z.: Supervision, Data curation, Funding acquisition, Writing—review & editing. All authors have read and agreed to the published version of the manuscript.

Funding

This research was funded by the National Natural Science Foundation of China (52130906) and the Fund of China Institute of Water Resources and Hydropower Research (ID0145B022021).

Data Availability Statement

The data presented in this study are available upon request from the corresponding author. The data are not publicly available.

Acknowledgments

We would like to thank the editors and anonymous reviewers for their guidance and constructive comments.

Conflicts of Interest

The authors declare no conflicts of interest.

References

  1. Erenstein, O.; Jaleta, M.; Sonder, K. Global maize production, consumption and trade: Trends and R & D implications. Food Secur. 2022, 14, 1295–1319. [Google Scholar]
  2. Sherry, A.T.; Laura, M.; Rachel, R. Maize agro-food systems to ensure food and nutrition security in reference to the Sustainable Development Goals. Glob. Food Secur. 2020, 25, 100327. [Google Scholar]
  3. Zhang, L.; Zhang, F.R.; Jiang, G.H.; Yao, H.M. Potential improvement of medium-low yielded farm land and guaran tee of food safety in China. Res. Agric. Mod. 2005, 26, 22–25. [Google Scholar]
  4. Gregory, P.J.; Ingram, J. Global change and food and forest production: Future scientific challenges. Agric. Ecosyst. Environ. 2000, 82, 3–14. [Google Scholar] [CrossRef]
  5. Mottaleb, K.A.; Kruseman, G.; Frija, A.; Sonder, K.; Santiago, L. Projecting wheat demand in China and India for 2030 and 2050: Implications for food security. Front. Nutr. 2022, 9, 10. [Google Scholar] [CrossRef] [PubMed]
  6. Duvick, D.N.; Cassman, K.G. Post-Green revolution trends in yield potential of temperate maize in the north-central United States. Crop Sci. 1999, 39, 1622–1630. [Google Scholar] [CrossRef]
  7. Pimentel, D.; Harvey, C.; Resosudarmo, P.; Sinclair, K.; Kurz, D.; McNair, M.; Crist, S.; Shpritz, L.; Fitton, L.; Saffouri, R.; et al. Environmental and economic costs of soils erosion and conservation benefits. Science 1995, 267, 1117–1123. [Google Scholar] [CrossRef] [PubMed]
  8. Lobell, D.B.; Cassman, K.G.; Field, C.B. Crop yield gaps: Their importance, magnitudes, and causes. Annu. Rev. Environ. Resour. 2009, 34, 179–204. [Google Scholar] [CrossRef]
  9. Li, S.K.; Wang, C.T. The methods of obtaining and expressing information of crop plant shape and population structure. J. Shihezi Univ. Nat. Sci. 1997, 1, 250–256. [Google Scholar]
  10. Liu, J.H.; Wang, Z.M.; Li, L.J.; Zhang, H.M. Higher-yield is key technical method of maintaining future food security in China. Res. Agric. Mod. 2003, 24, 161–165. [Google Scholar]
  11. Ren, B.; Liu, W.; Zhang, J.; Dong, S.; Liu, P.; Zhao, B. Effects of plant density on the photosynthetic and chloroplast characteristics of maize under high-yielding conditions. Sci. Nat. 2017, 104, 3–4. [Google Scholar] [CrossRef] [PubMed]
  12. Liu, G.; Liu, W.; Yang, Y. Marginal superiority of maize: An indicator for density tolerance under high plant density. Sci. Rep. 2020, 10, 15378. [Google Scholar] [CrossRef] [PubMed]
  13. Ciampitti, I.A.; Vyn, T.J. A comprehensive study of plant density consequences on nitrogen uptake dynamics of maize plants from vegetative to reproductive stages. Field Crops Res. 2011, 121, 2–18. [Google Scholar] [CrossRef]
  14. Hirose, T. Development of the Monsi-Saeki theory on canopy structure and function. Ann. Bot. 2005, 95, 483–494. [Google Scholar] [CrossRef] [PubMed]
  15. Liu, X.; Rahman, T.; Song, C.; Yang, F.; Su, B.; Cui, L. Relationships among light distribution, radiation use efficiency and land equivalent ratio in maize-soybean strip intercropping. Field Crops Res. 2018, 224, 91–101. [Google Scholar] [CrossRef]
  16. Beruski, G.C.; Schiebelbein, L.M.; André, B.P. Maize Yield Components as Affected by Plant Population, Planting Date and Soil Coverings in Brazil. Agriculture 2020, 10, 579. [Google Scholar] [CrossRef]
  17. Du, X.B.; Wang, Z.; Lei, W.X.; Kong, L.C. Increased planting density combined with reduced nitrogen rate to achieve high yield in maize. Sci. Rep. 2023, 11, 358. [Google Scholar] [CrossRef]
  18. Bahadur, M.M.; Ashrafuzzaman, M.; Chowdhury, M.F. Growth and Yield Component Responses of Maize as Affected by Population Density. Pak. J. Biol. Sci. 1999, 2, 1092–1095. [Google Scholar] [CrossRef]
  19. Sibonginkosi, N.; Mabuza, M.; Tana, T. Effect of Plant Density on Growth and Yield of Maize [Zea mays (L.)] Hybrids at Luyengo, Middleveld of Eswatini. Asian Plant Res. J. 2020, 3, 1–9. [Google Scholar] [CrossRef]
  20. Cai, F.; Mi, N.; Ming, H. Responses of dry matter accumulation and partitioning to drought and subsequent rewatering at different growth stages of maize in Northeast China. Front. Plant Sci. 2023, 14, 1110727. [Google Scholar] [CrossRef]
  21. Xu, C.L.; Li, R.D.; Song, W.W. High density and uniform plant distribution improve soybean yield by regulating population uniformity and canopy light interception. Agronomy 2021, 11, 1880. [Google Scholar] [CrossRef]
  22. Zhang, D.S.; Sun, Z.X.; Feng, L.S. Maize plant density affects yield, growth and source-sink relationship of crops in maize/peanut intercropping. Field Crops Res. 2020, 257, 107926. [Google Scholar] [CrossRef]
  23. Shi, D.Y.; Li, Y.H.; Zhang, J.W.; Liu, P.; Zhao, B.; Dong, S.T. Increased plant density and reduced N rate lead to more grain yield and higher resource utilization in summer maize. J. Integr. Agric. 2016, 15, 2515–2528. [Google Scholar] [CrossRef]
  24. Zheng, B.; Zhao, W.; Ren, T. Low Light Increases the Abundance of Light Reaction Proteins: Proteomics Analysis of Maize (Zea mays L.) Grown High Planting Density. Int. J. Mol. Sci. 2022, 23, 3015. [Google Scholar] [CrossRef] [PubMed]
  25. Liu, D.; Jia, Q.; Li, J. Increased photosynthesis and grain yields in maize grown with less irrigation water combined with density adjustment in semiarid regions. PeerJ 2020, 8, 1–28. [Google Scholar]
  26. Wall, G.W.; Kanemasu, E.T. Carbon dioxide exchange rate in wheat canopies. part I, Influence of canopy geometry on trend in leaf area index, light interception and instantaneous exchange rates. Agric. For. Meteorol. 1990, 49, 81–102. [Google Scholar] [CrossRef]
  27. Watiki, J.M.; Fukai, S.; Banda, J.A. Radiation interception and growth of maize/cowpea intercrop as affected by maize plant density and cowpea cultivars. Field Crops Res. 1993, 35, 123–133. [Google Scholar] [CrossRef]
  28. Bai, Y.; Yang, Y.; Zhu, Y. Effect of planting density on light interception within canopy and grain yield of different plant types of maize. Acta Agron. Sin. 2019, 45, 1868–1879. [Google Scholar]
  29. Chen, C.Y.; Hou, H.P.; Li, Q.; Zhu, P.; Zhang, Z.Y.; Dong, Z.Q.; Zhao, M. Effects of panting density on photosynthetic characteristics and changes of carbon and nitrogen in leaf of different corn hybrids. Acta Agron. Sin. 2010, 36, 871–878. [Google Scholar] [CrossRef]
  30. Gao, J.; Lei, M.; Yang, L.J. Reduced row spacing improved yield by optimizing root distribution in maize. Eur. J. Agron. 2021, 127, 126291. [Google Scholar] [CrossRef]
  31. Liu, G.Z.; Liu, W.M.; Hou, P.; Ming, B.; Yang, Y.S.; Guo, X.X.; Xie, R.Z.; Wang, K.R.; Li, S.K. Reducing maize yield gap by matching plant density and solar radiation. J. Integr. Agric. 2021, 20, 363–370. [Google Scholar] [CrossRef]
  32. Varlet-Grancher, C.; Gosse, G.; Chartier, M. Solar radiation absorbed or intercepted by a crop. Agronomie 1989, 9, 419–439. [Google Scholar] [CrossRef]
  33. Tian, P.; Liu, J.; Zhao, Y. Nitrogen rates and plant density interactions enhance radiation interception, yield, and nitrogen use efficiencies of maize. Front. Plant Sci. 2022, 13, 974714. [Google Scholar] [CrossRef]
  34. Durand, M.; Murchie, E.H.; Lindfors, A.V.; Urban, O.; Aphalo, P.J.; Robson, T.M. Diffuse solar radiation and canopy photosynthesis in a changing environment. Agric. For. Meteorol. 2021, 311, 108684. [Google Scholar] [CrossRef]
  35. Kar, G.; Kumar, A.; Mohapatra, S. Radiation utilization efficiency, nitrogen uptake and modeling crop growth and yield of rainfed rice under different nitrogen rates. J. Indian Soc. Soil Sci. 2014, 62, 108–117. [Google Scholar]
  36. Kiniry, J.R.; Simpson, C.E.; Schuber, A.M.; Reed, J.D. Peanut leaf area index, light interception, radiation use efficiency, and harvest index at three sites in texas. Field Crops Res. 2005, 91, 297–306. [Google Scholar] [CrossRef]
  37. Tollenaar, M. Physiological Basis of Genetic Improvement of Maize Hybrids in Ontario from 1959 to 1988. Crop Sci. 1991, 31, 119–124. [Google Scholar] [CrossRef]
  38. Maddonni, G.A.; Otegui, M.E. Intra-specific competition in maize: Early establishment of hierarchies among plants affects final kernel set. Field Crops Res. 2004, 85, 1–13. [Google Scholar] [CrossRef]
  39. Blessing, C.; Nhamo, M.; Rangarirai, M. The impact of plant density and spatial arrangement on light interception on cotton crop and seed cotton yield: An overview. J. Cotton Res. 2020, 3, 210–215. [Google Scholar]
  40. Mathieu, A.; Cournède, P.H.; Letort, V. A dynamic model of plant growth with interactions between development and functional mechanisms to study plant structural plasticity related to trophic competition. Ann. Bot. 2009, 103, 1173–1186. [Google Scholar] [CrossRef]
  41. Niinemets, U.; Keenan, T.F.; Hallik, L. A worldwide analysis of within-canopy variations in leaf structural, chemical and physiological traits across plant functional types. New Phytol. 2015, 205, 973–993. [Google Scholar] [CrossRef] [PubMed]
  42. Yan, P.; Chen, Y.Q.; Sui, P.; Vogel, A.; Zhang, X.P. Effect of maize plant morphology on the formation of apical kernels at different sowing dates and under different plant densities. Field Crops Res. 2018, 223, 83–92. [Google Scholar] [CrossRef]
  43. Azhar, J.N.; Ehsanzadeh, P. Evaluation of Interrelationship of Growth Indices and Grain Yield of Five Maize Hybrids under Two Irrigation Regimes in Isfahan. J. Sci. Technol. Agric. Nat. Resour. 2007, 41, 261–273. [Google Scholar]
  44. Huang, W.J.; Yang, Q.Y.; Pu, R.L.; Yang, S.Y. Estimation of nitrogen vertical distribution by bi-directional canopy reflectance in winter wheat. Sensors 2014, 14, 20347–20359. [Google Scholar] [CrossRef] [PubMed]
  45. Ying, J.; Lee, E.A.; Tollenaar, M. Response of maize leaf photosynthesis to low temperature during the grain-filling period. Field Crops Res. 2000, 68, 87–96. [Google Scholar] [CrossRef]
  46. Begna, S.H.; Hamilton, R.I.; Dwyer, L.M. Weed Biomass Production Response to Plant Spacing and Corn (Zea mays) Hybrids Differing in Canopy Architecture. Weed Technol. 2009, 15, 647–653. [Google Scholar] [CrossRef]
  47. Vargas, L.A.; Andersen, M.N.; Jensen, C.R.; Jørgensen, U. Estimation of leaf area index, light interception and biomass accumulation of Miscanthus sinensis ‘Goliath’ from radiation measurements. Biomass Bioenergy 2002, 22, 1–14. [Google Scholar] [CrossRef]
  48. Evers, J.B.; Vos, J.; Yin, X. Simulation of wheat growth and development based on organ-level photosynthesis and assimilate allocation. J. Exp. Bot. 2010, 61, 3–16. [Google Scholar] [CrossRef] [PubMed]
  49. Tahiri, A.Z.; Anyoji, H.; Yasuda, H. Fixed and variable light extinction coefficients for estimating plant transpiration and soil evaporation under irrigated maize. Agric. Water Manag. 2006, 84, 186–192. [Google Scholar] [CrossRef]
  50. Kandel, T.P.; Elsgaard, L.; Andersen, M.N. Influence of harvest time and frequency on light interception and biomass yield of festulolium and tall fescue cultivated on a peatland. Eur. J. Agron. 2016, 81, 150–160. [Google Scholar] [CrossRef]
  51. Koetz, B.; Baret, F.; Poilvé, H.; Hill, J. Use of coupled canopy structure dynamic and radiative transfer models to estimate biophysical canopy characteristics. Remote Sens. Environ. 2005, 95, 115–124. [Google Scholar] [CrossRef]
  52. Osawa, A. Plant canopies: Their growth, form and function. For. Ecol. Manag. 1992, 49, 168–170. [Google Scholar] [CrossRef]
  53. Maddonni, G.A.; Cirilo, A.G.; Otegui, M.E. Row Width and Maize Grain Yield. Agron. J. 2006, 98, 1532–1543. [Google Scholar] [CrossRef]
  54. Meng, Q.F.; Hou, P.; Wu, L.Q.; Chen, X.P.; Cui, Z.L.; Zhang, F.S. Understanding production potentials and yields gaps in intensive maize production in China. Field Crops Res. 2013, 143, 91–97. [Google Scholar] [CrossRef]
Figure 1. Daily characteristics of solar radiation, average temperature, and rainfall during the maize growth period of 2021–2022.
Agronomy 14 01511 g001aAgronomy 14 01511 g001b
Figure 2. Schematics of different planting patterns for maize (a) D1 treatments with a density of 33,000 plants·ha−1; (b) D2 treatments with a density of 42,000 plants·ha−1; (c) D3 treatments with a density of 55,000 plants·ha−1; (d) D4 treatments with a density of 83,000 plants·ha−1.
Agronomy 14 01511 g002
Figure 3. AV-19LQ total solar radiation sensor.
Agronomy 14 01511 g003
Figure 4. Maize canopy radiation use efficiency (RUE) under four densities in 2021 (left) and 2022 (right). JS = Jointing stage, TS = Tasseling stage, GS = Grain-filling stage, MT = Maturity stage. Note: Data represent mean value ± SD of RUE with three replicates. Different letters (e.g., abc) within the same variables represent significant differences at p < 0.05 [least significant difference (LSD) test].
Agronomy 14 01511 g004
Figure 5. The variation of canopy dry matter in maize under four densities in 2021 and 2022. Note: Data represent mean value ± SD of dry matter for three replicates. Different letters within the same variables represent significant differences at p < 0.05 [least significant difference (LSD) test].
Agronomy 14 01511 g005
Figure 6. The variation in plant height of maize under four densities in 2021 and 2022. Note: Data represent mean value ± SD of plant height with three replicates. Different letters within the same variables represent significant differences at p < 0.05 [least significant difference (LSD) test].
Agronomy 14 01511 g006
Figure 7. The variation in the canopy leaf area index of maize under four densities in 2021 and 2022.
Agronomy 14 01511 g007
Figure 8. Effects of planting density on vertical and horizontal distribution of TPAR for maize in 2021 at different growth stages. Ι = Jointing stage, II = Tasseling stage, III = Grain-filling stage, IV = Maturity stage.
Agronomy 14 01511 g008
Figure 9. Effects of plant density on vertical and horizontal distribution of TPAR for maize in 2022 at different growth stages.
Agronomy 14 01511 g009
Figure 10. Canopy K of maize under four densities in 2021 and 2022.
Agronomy 14 01511 g010
Figure 11. Correlation between D, K, B, RUE, LAI, and TPAR to different densities at different years, growth stages, and canopy levels.
Agronomy 14 01511 g011aAgronomy 14 01511 g011b
Table 1. Maize yield and its components in different treatments.
Growth PeriodTreatmentKernel Weight (g 100 Seed−1)Grain Yield (kg·ha−1)Biomass Yield (kg·ha−1)HI (%)PUE (kg·ha−1 mm−1)
2021D131.2 d5497.2 d9247.6 d59.4 a18.8 d
D233.0 c6142.1 c12,383.0 c49.6 b21.0 c
D337.9 a6996.9 b14,570.1 b48.0 c24.0 b
D434.6 b9257.3 a20,937.6 a44.2 d31.7 a
2022D138.5 b7233.2 d14,519.2 d49.8 a15.8 d
D238.9 ab7718.4 c16,177.9 c47.7 b16.9 c
D339.8 a9204.6 b20,263.0 b45.4 c20.2 b
D436.7 c9599.1 a21,771.8 a44.1 d21.0 a
Note: Different letters (e.g., abcd) represent the significant differences at p < 0.05 among the various treatments [least significant difference (LSD) test].
Table 2. Effects of different densities on canopy leaf area index (LAI) at different growth stages and different canopy layers.
Growth PeriodTreatmentLAI (m2 m−2)
20212022
Upper Layer of CanopyMiddle Layer of CanopyLower Layer of CanopySumUpper Layer of CanopyMiddle Layer of CanopyLower Layer of CanopySum
Jointing stageD10.57 b0.79 b0.27 b1.640.37 b0.52 c0.14 b1.02
D20.77 b0.98 ab0.42 ab2.170.69 ab0.71 bc0.24 ab1.65
D30.79 b1.39 ab0.42 ab2.610.80 ab0.90 b0.25 ab1.95
D42.93 a1.62 a0.77 a5.330.91 a1.32 a0.45 a2.68
Tasseling stageD10.64 b1.35 d0.62 b2.600.82 c1.33 c0.48 b2.62
D20.83 b1.80 c0.76 b3.401.11 bc1.57 bc0.64 ab3.32
D31.03 b2.14 b1.08 b4.251.40 ab2.15 b0.83 ab4.38
D45.36 a3.84 a1.92 a11.121.80 a3.05 a1.11 a5.97
Grain-filling stageD10.53 b1.49 c0.75 c2.770.69 c1.25 d0.69 b2.63
D20.71 b1.80 bc0.89 bc3.400.72 c1.82 c0.99 b3.53
D31.04 b2.02 b1.09 b4.161.16 b2.37 b0.97 b4.50
D43.41 a3.43 a1.69 a8.541.47 a2.91 a1.63 a6.02
Maturity stageD10.39 b0.73 c0.87 b1.990.74 a0.83 c0.66 b2.24
D20.47 b0.96 bc1.04 b2.470.63 a1.22 bc1.03 ab2.88
D31.04 a1.25 b1.38 b3.680.97 a1.47 ab1.28 ab3.72
D41.13 a1.92 a2.47 a5.520.92 a1.89 a1.45 a4.26
Note: Different letters represent the significant differences at p < 0.05 among the various treatments [least significant difference (LSD) test].
Table 3. Effect of canopy structure on K in 2021 and 2022 at different growth stages.
Growth PeriodTreatmentK
2021 2022
Lower Layer of CanopyMiddle Layer of CanopyUpper Layer of CanopyAverageLower Layer of CanopyMiddle Layer of CanopyUpper Layer of CanopyAverage
Jointing stageD14.85 a2.13 a9.16 a5.38 3.02 a2.98 a7.89 a4.63
D24.25 b1.59 b9.07 a4.97 2.68 b2.03 b7.97 a4.22
D34.23 b2.00 a6.70 b4.31 2.26 b1.44 c4.69 b2.80
D41.94 c0.85 c3.03 c1.94 1.70 c1.30 c2.43 c1.81
Tasseling stageD14.23 b0.82 a8.38 a4.48 2.99 b1.44 a6.18 a3.54
D26.79 a0.77 b3.11 b3.56 3.64 a1.08 b4.36 b3.03
D33.35 c0.60 c2.54 c2.16 2.65 b0.90 bc2.23 c1.93
D41.15 d0.72 b0.89 d0.92 1.93 c0.87 c0.94 c1.25
Grain-filling stageD12.11 b1.06 a2.52 a1.90 1.82 b0.67 a2.50 a1.67
D22.96 a0.82 b1.48 b1.75 2.25 a0.41 b2.00 a1.55
D32.15 b0.71 b0.76 c1.21 2.30 a0.37 b1.24 b1.30
D41.24 c0.59 b0.47 c0.77 1.95 b0.38 b1.26 b1.20
Maturity stageD14.87 a1.13 a3.15 a3.05 5.99 a0.82 bc4.13 a3.65
D23.80 b1.20 a1.41 b2.14 3.54 b1.09 a3.65 b2.76
D33.68 b0.90 b1.78 b2.12 2.87 c0.87 b2.11 c1.95
D41.72 c0.54 c0.86 c1.04 2.94 bc0.76 c1.18 d1.63
Note: Different letters represent the significant differences at p < 0.05 among the various treatments [least significant difference (LSD) test].
Disclaimer/Publisher’s Note: The statements, opinions and data contained in all publications are solely those of the individual author(s) and contributor(s) and not of MDPI and/or the editor(s). MDPI and/or the editor(s) disclaim responsibility for any injury to people or property resulting from any ideas, methods, instructions or products referred to in the content.

