Article

Understanding the Leaching Dynamics of Lead (Pb+2) in Artificial Soils under Different Conditions

by
Andrés Felipe Chamorro
1,* and
Rubén Albeiro Sánchez-Andica
2,*
1
Grupo de Investigación en Electroquímica y Medio Ambiente (GIEMA), Faculty of Basic Sciences, Universidad Santiago de Cali, Cali 760035, Colombia
2
Grupo de Investigación en Contaminación Ambiental Por Metales Pesados Y Plaguicidas (GICAMP), Department of Chemistry, Faculty of Natural and Exact Science, Universidad del Valle, Cali 760032, Colombia
*
Authors to whom correspondence should be addressed.
Agronomy 2024, 14(7), 1520; https://doi.org/10.3390/agronomy14071520
Submission received: 24 June 2024 / Revised: 7 July 2024 / Accepted: 9 July 2024 / Published: 12 July 2024
(This article belongs to the Section Soil and Plant Nutrition)

Abstract

:
Lead (Pb) is a heavy metal present in many agricultural fields, posing significant risks to the environment and public health. The mobility and leaching of Pb(II) in soils depend on soil characteristics. In agricultural soils, organic matter (OM) content has been reported as a crucial parameter influencing the leaching behavior of Pb(II). However, modeling the leaching behavior of Pb(II) in soils remains challenging, primarily due to the difficulty in obtaining soils that vary solely in OM content. In this study, the behavior of Pb(II) in artificial soils (ASs) was investigated, evaluating the effects of ionic strength, pH, and OM content. Additionally, the spatiotemporal distribution of the metal was explored using a multilevel factorial experimental design and column leaching experiments. The results indicate that lead retention capacity decreases with increasing ionic strength due to the increased leaching of OM, which forms complexes with Pb(II). The lead retention capacity of the soil is also affected by pH, with pH 7 inducing the highest retention. This modified the spatiotemporal distribution of the metal, which was analyzed using response surface methodology. A second-order polynomial model was obtained, allowing for the tracking of Pb(II) leaching in soils with 10% OM content.

1. Introduction

Heavy metals like Cd, Hg, As, Cr, and Pb are persistent pollutants in agricultural soils, arising from anthropogenic activities such as the use of chemical products (pesticides and fertilizers) and natural causes [1]. Superphosphate fertilizers, for example, can contain impurities such as Cd, Co, Pb, and Cr [2,3,4]. Pb poses significant environmental and health risks, as it is a persistent pollutant with a long half-life in soils, potentially contaminating groundwater and entering the food chain [5,6]. Lead is a metal that can occur in different species such as PbS, PbCO3, and PbSO4, all coming from industrial products such as paints [7,8]. Pb’s toxicity affects plants and humans, leading to severe health issues, including cancer [1]. However, lead uptake by plants and/or humans depends on its bioavailability, solubility, and mobility in soil.
Soil properties significantly influence Pb leaching, affecting the interaction between the soil matrix and the leaching solution [9]. Key factors include soil composition, pH, ionic strength, and organic matter (OM) content, which play crucial roles in determining the extent and behavior of lead mobility [10]. OM, clays, hydroxides, and metallic oxides in soil interact with heavy metals, influencing their behavior [11]. OM in soil interacts with metals through functional groups and polyelectrolytic sites formed by the heteropolycondensation of fatty acids, proteins, lignins, and carbohydrates, among others, forming complexes that can either reduce or enhance Pb mobility [12,13,14,15]. Thus, the interplay between these processes makes OM a critical factor in assessing lead dynamics in soil [16]. However, the large and complex composition of soils limits the understanding of the effect of OM. Previous studies using artificial soils (ASs) with varying OM concentrations showed that Pb(II) adsorption is influenced by the OM amount and soil composition, following a pseudo-second-order kinetic model [17].
pH and ionic strength are crucial in determining Pb speciation and mobility. Acidic conditions increase Pb solubility, enhancing mobility, while alkaline conditions reduce Pb availability [18,19,20]. High ionic strength, due to salts like NaCl and CaCl2, decreases Pb adsorption and increases leaching [21,22]. Semi-dynamic leaching tests quantify Pb in leachate fluid, but they have limitations in understanding Pb’s spatiotemporal distribution in soils with different OM content [23].
This study aims to evaluate the effects of pH, ionic strength, and OM on Pb leaching in AS. Using a factorial experimental design and response surface methodology, we analyze Pb(II) concentrations at different soil depths under varying conditions. The insights will aid in developing effective soil management and remediation strategies to mitigate lead contamination.

2. Materials and Methods

2.1. Artificial Soil Preparation and Characterization

ASs were prepared with varying concentrations of OM (0%, 1%, 5%, and 10%), utilizing humus as the OM source, bentonite and kaolinite as clay sources, and PVC (polyvinyl chloride) as an inert material. The proportion of each material is shown in Table 1. Each component was individually dried, ground, and sieved (170 mesh, W.S Tyler, Mentor, OH, USA) before being blended in specific proportions. Several physical and chemical properties of the ASs were evaluated, including apparent humidity, density, water retention capacity (WRC), and chemical characteristics such as Pb(II) concentration, cation exchange capacity (CEC), organic matter content, total oxidizable organic carbon, humic acid (HA), fulvic acid (FA), carbonates, sulfates, and phosphates. These determinations were conducted following the Colombian technical standard NTC 5167 [24]. Lead nitrate (Pb(NO3)2, 99%), sodium nitrate (NaNO3, 99%), and hydrochloric acid (HCl, 37%) were procured from Sigma-Aldrich. All chemicals were used as received, and deionized water was utilized throughout the experiments.

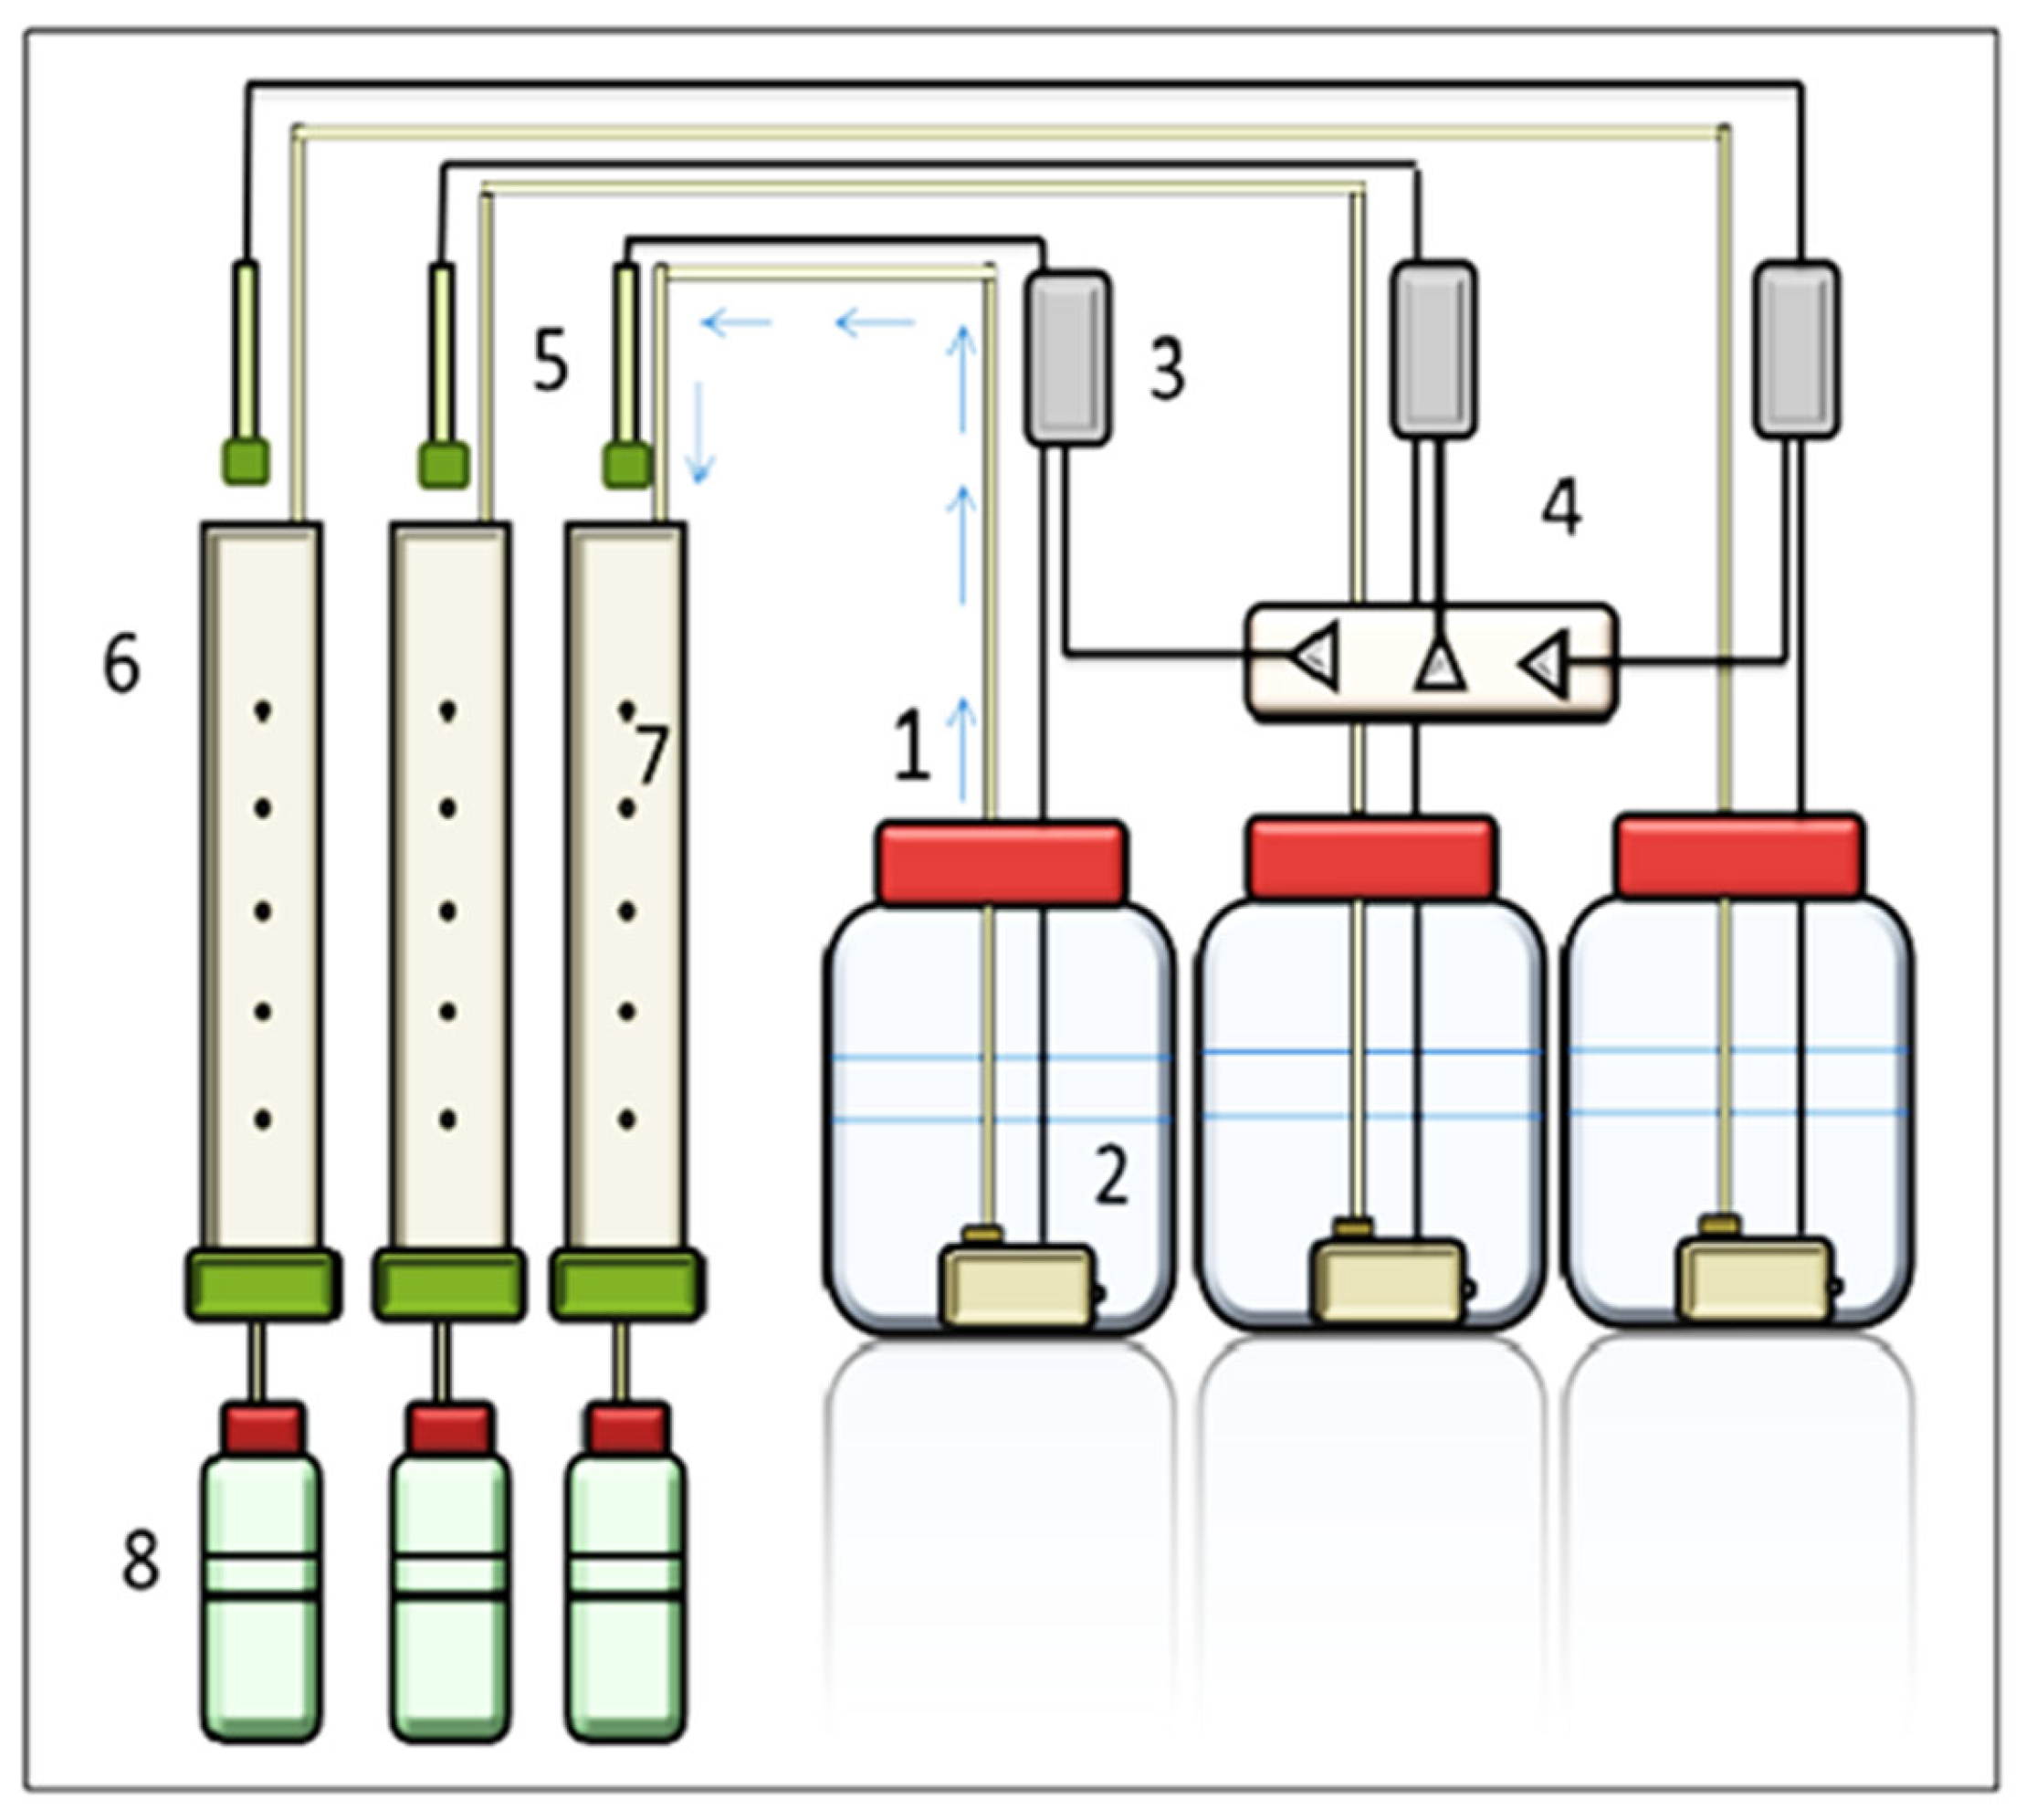
2.2. Leaching System

The leaching system (Figure 1) utilized in this study was constructed empirically at Valle University (Cali, Colombia). The system consisted of PVC leaching columns standing 60 cm tall with a diameter of 6.3 cm. Each column was equipped with five sampling points located at depths of 0, 10, 20, 30, and 40 cm, sealed to prevent mixing between soil and liquid within the system (see photograph of the setup in Figure S1, Supplementary Materials). To initiate the experiment, ASs were placed in the columns without applying packing pressure. Subsequently, the leaching solution necessary to achieve the soil’s water retention capacity was added. Following this, a defined quantity of Pb(II) was introduced into the system.
The lead was leached into the soil pores under the influence of a controlled leaching solution, which was regulated by an electronic system to maintain a constant leaching rate. All experiments were conducted until 1000 mL of leaching solution was collected in the leachate containers.

2.3. Determination of the Ionic Strength in the Pb (II) Leaching

The first experiment aimed to determine the impact of ionic strength on the leaching of Pb(II). In a column, 355 g of AS was deposited, and 1000 mL of NaNO3 solution ranging from 0.001 M to 3.0 M was introduced, along with 500 mg of Pb(II). The experiment was conducted using the leaching setup until 1000 mL of leaching solution was collected. The quantification of Pb(II) in the leaching solution was carried out using atomic absorption (AA) spectrophotometry (Perkin Elmer AAnalyst 100), with an external standard calibration curve at a resonance line of 217 nm. The soil’s lead retention capacity ( q P b ) was calculated using the following Equation (1).
q P b = m g i P b ( I I ) m g q P b ( I I ) g   s o i l
where m g I P b I I represents the initial amount of Pb(II) used in the experiment, and m g q P b I I signifies the quantity of Pb(II) quantified by AA after the leaching process. g soil denotes the quantity of soil used (355 g). Furthermore, soluble organic carbon was determined during the leaching process following the Colombian technical standard NTC 5403 [25].

2.4. Determination of pH in the Pb (II) Leaching

The investigation into the impact of pH and lead amount on Pb(II) leaching was conducted using the leaching setup illustrated in Figure 1. A column was filled with 355 g of AS containing 10% organic matter (OM), followed by the introduction of 1000 mL of NaNO3 solution at a concentration of 0.001 M adjusted to different pH levels (2, 7, and 12). Additionally, two different lead amount levels (1 and 500 mg Pb(II)) were evaluated. The leaching process continued until 1000 mL of leaching solution was collected.

2.5. Determination of pH and Organic Matter in the Spatiotemporal Distribution of Pb(II) Leaching

The leaching experiments were designed to evaluate the impact of organic matter (OM), Pb(II) quantity, pH, time, and distance on Pb(II) leaching dynamics. The effect of OM (1% and 10%) and Pb (II) quantity (1 mg and 500 mg) in the AS column was determined by an experimental design in factorial arrangement 2 × 2. Each column contained 355 g of AS with OM levels varying at 1% and 10%. Subsequently, 1000 mL of NaNO3 solution at 0.001 M was introduced, alongside 0.1 mL and 50 mL of Pb(II) solution at a concentration of 10,000 mg L1 (resulting in 1 and 500 mg of Pb(II)). The leaching process continued until 1000 mL of leachate was collected. The quantification of Pb(II) in the leachate was performed using atomic absorption (AA) spectrophotometry, following the methodology described in Section 2.3, to determine q P b . Additionally, to investigate the spatiotemporal distribution of Pb(II) in soils, AS samples (0.2 g each) were collected at various distances from the column (0, 10, 20, 30, and 40 cm) over increasing time intervals. These soil samples underwent digestion in HCl, and Pb(II) concentrations were quantified in milligrams of Pb(II) per gram of soil using AA spectrophotometry.

2.6. Statistical Analysis

The leaching of Pb(II) concentration was evaluated considering the simultaneous effects of two factors: pH, the amount of Pb(II), and time–distance on soil lead retention capacity (response variable). This investigation utilized a multilevel factorial experimental design and employed two-way ANOVA and response surface methodology to analyze the behavior of the response variable influenced by these factors. The relationship was modeled using a second-order polynomial equation (Equation (2)):
Y = β o + i = 1 k β i x i + i = 1 k β i i x i 2 + i = 1 k 1 j = 2 k β i j x i x j + ε
where x i , x j , … x k represent the factors influencing the response variable Y, the terms x i 2 , x j 2 , x k 2 denote the quadratic effects, while x i x j , x i x k , and x j x k represent the interaction effects. β o , β i , β i i , β i j , and ɛ, are the intercept term, the linear effect coefficient, the squared effect coefficient, the interaction coefficient, and the random error, respectively [26].

3. Results and Discussion

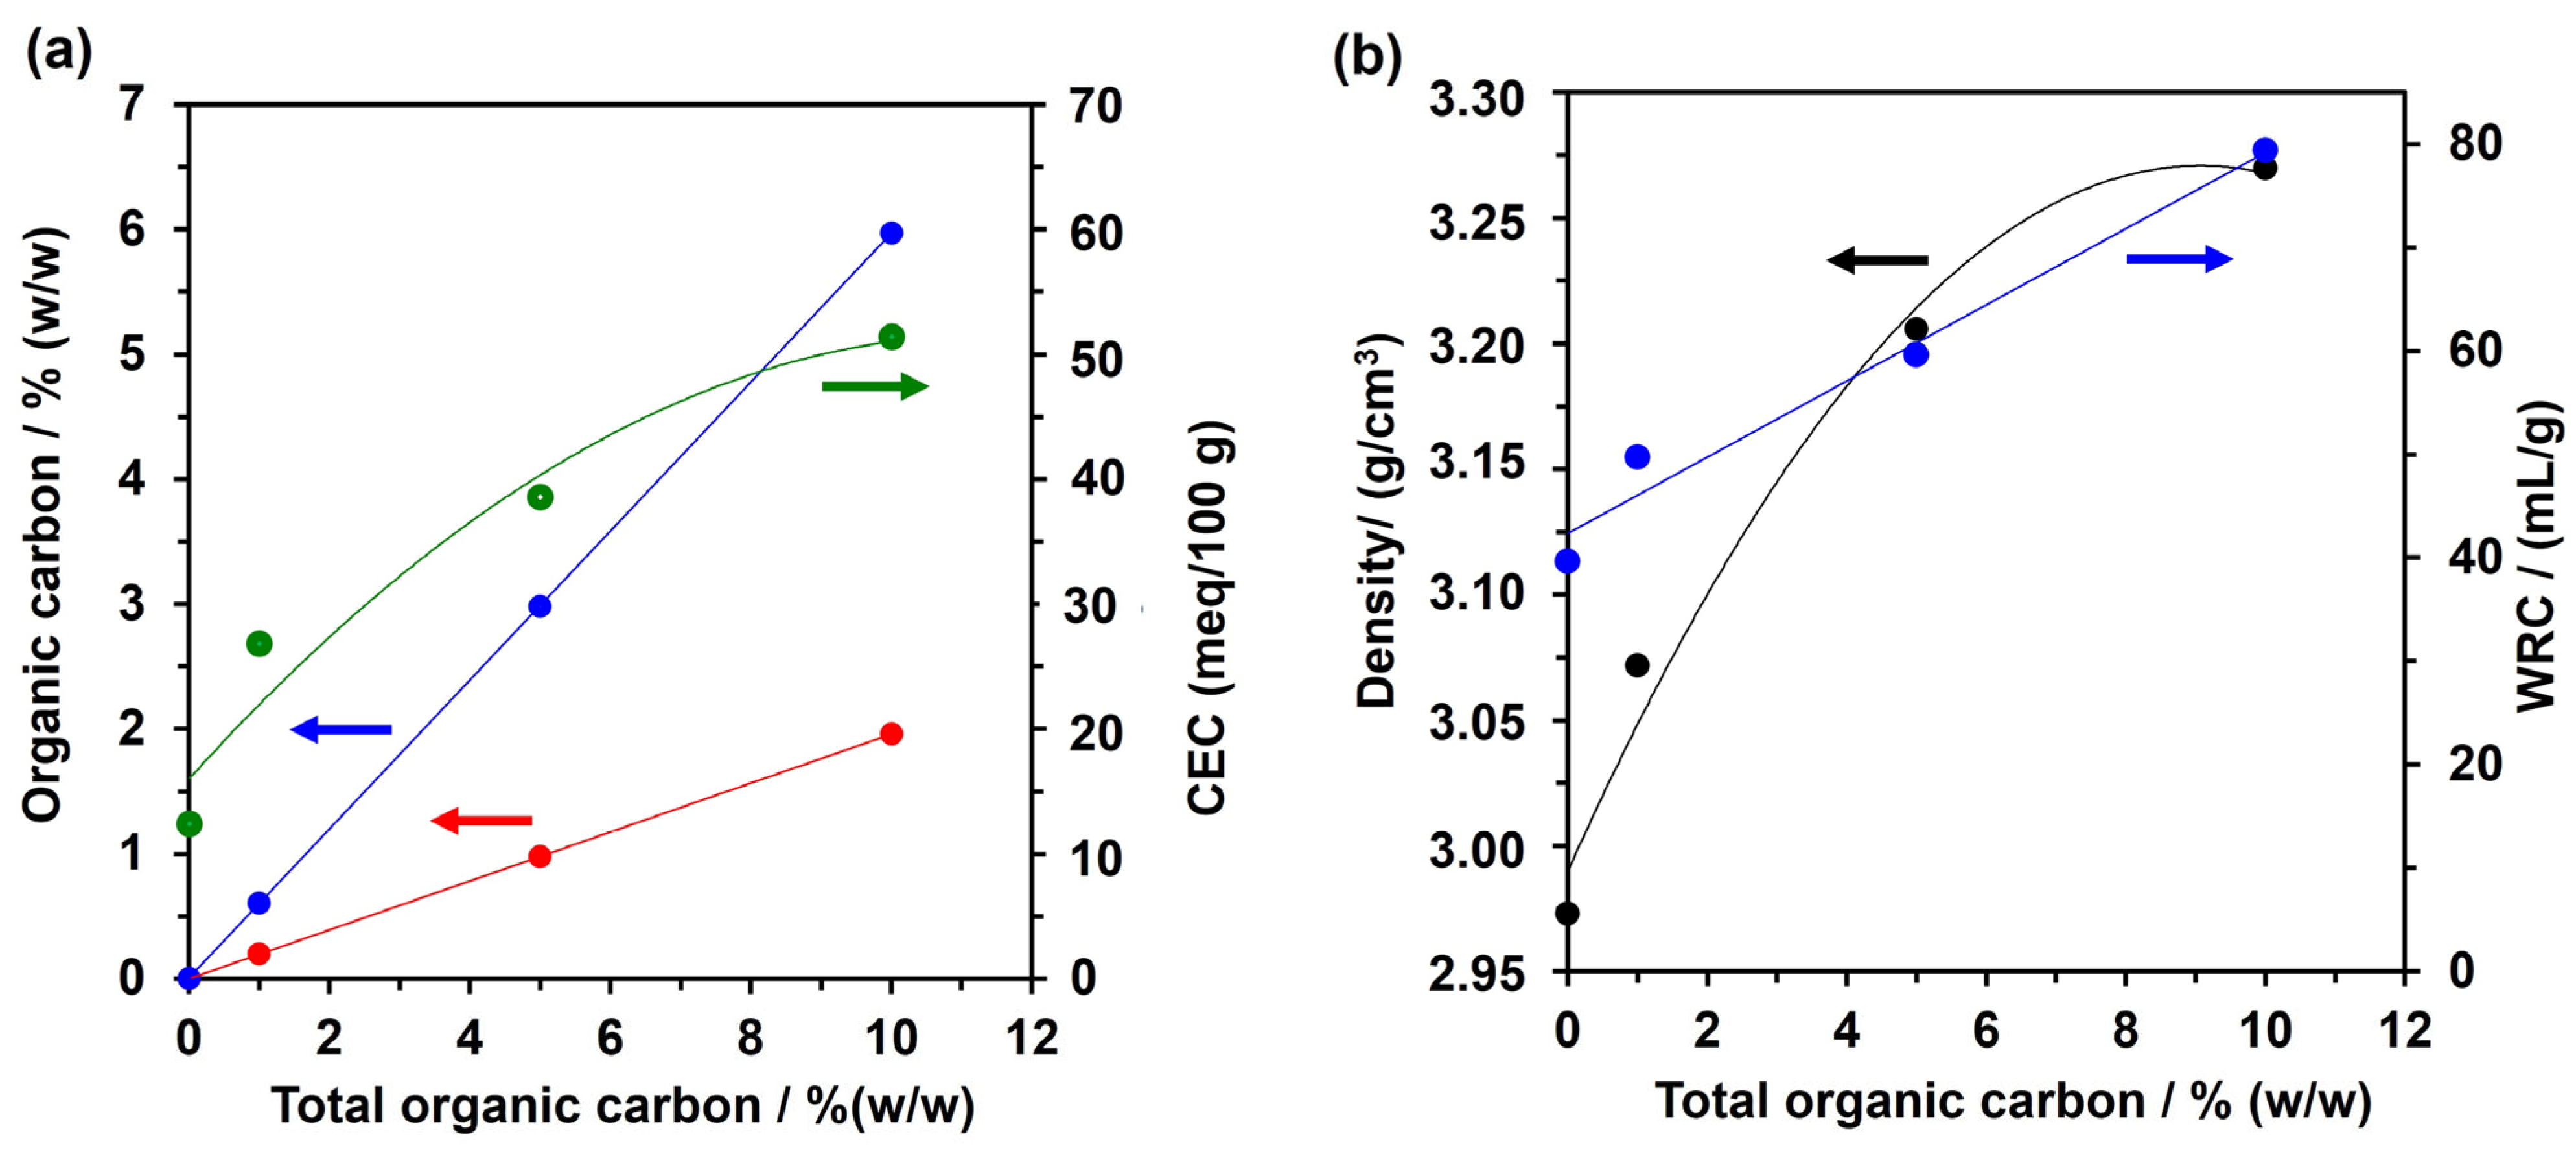
3.1. AS Characterization

To assess the impact of OM on Pb(II) leaching in soils, four soil samples with varying OM concentrations (0%, 1%, 5%, and 10%) were prepared using a mixture of bentonite, kaolinite, humus, and ground PVC. PVC was chosen as an inert material due to its minimal Pb(II) retention capacity (0.001 mg/g), allowing for soil dilution to evaluate the OM’s effect on Pb(II) leaching. The soils were characterized based on their organic carbon content, CEC, density, and WRC (Figure 2).
All measured parameters increase with the total organic carbon content. Given that the concentration of clays remains constant across the materials, the rise in these parameters is attributed to the OM concentration, HAs, and FAs, which increase linearly. Notably, FA concentrations exceed those of HAs in all four soils. FAs are soluble weak aliphatic and aromatic organic acids that remain soluble in water across all pH conditions [27]. The higher FA concentration suggests that soils with greater OM content may leach FAs in larger quantities. In contrast, both cation exchange capacity (CEC) and density exhibit a parabolic trend. CEC in soils is influenced by OM and clay concentrations [28]. However, as OM concentration increases, CEC does not increase linearly like FAs and HAs. This indicates that CEC reaches its maximum value with the humus used, implying that at higher concentrations, the mobility or retention of metallic cations through sorption and desorption processes on soil particles becomes limited. The maximum mobility is observed in soils containing 10% OM.

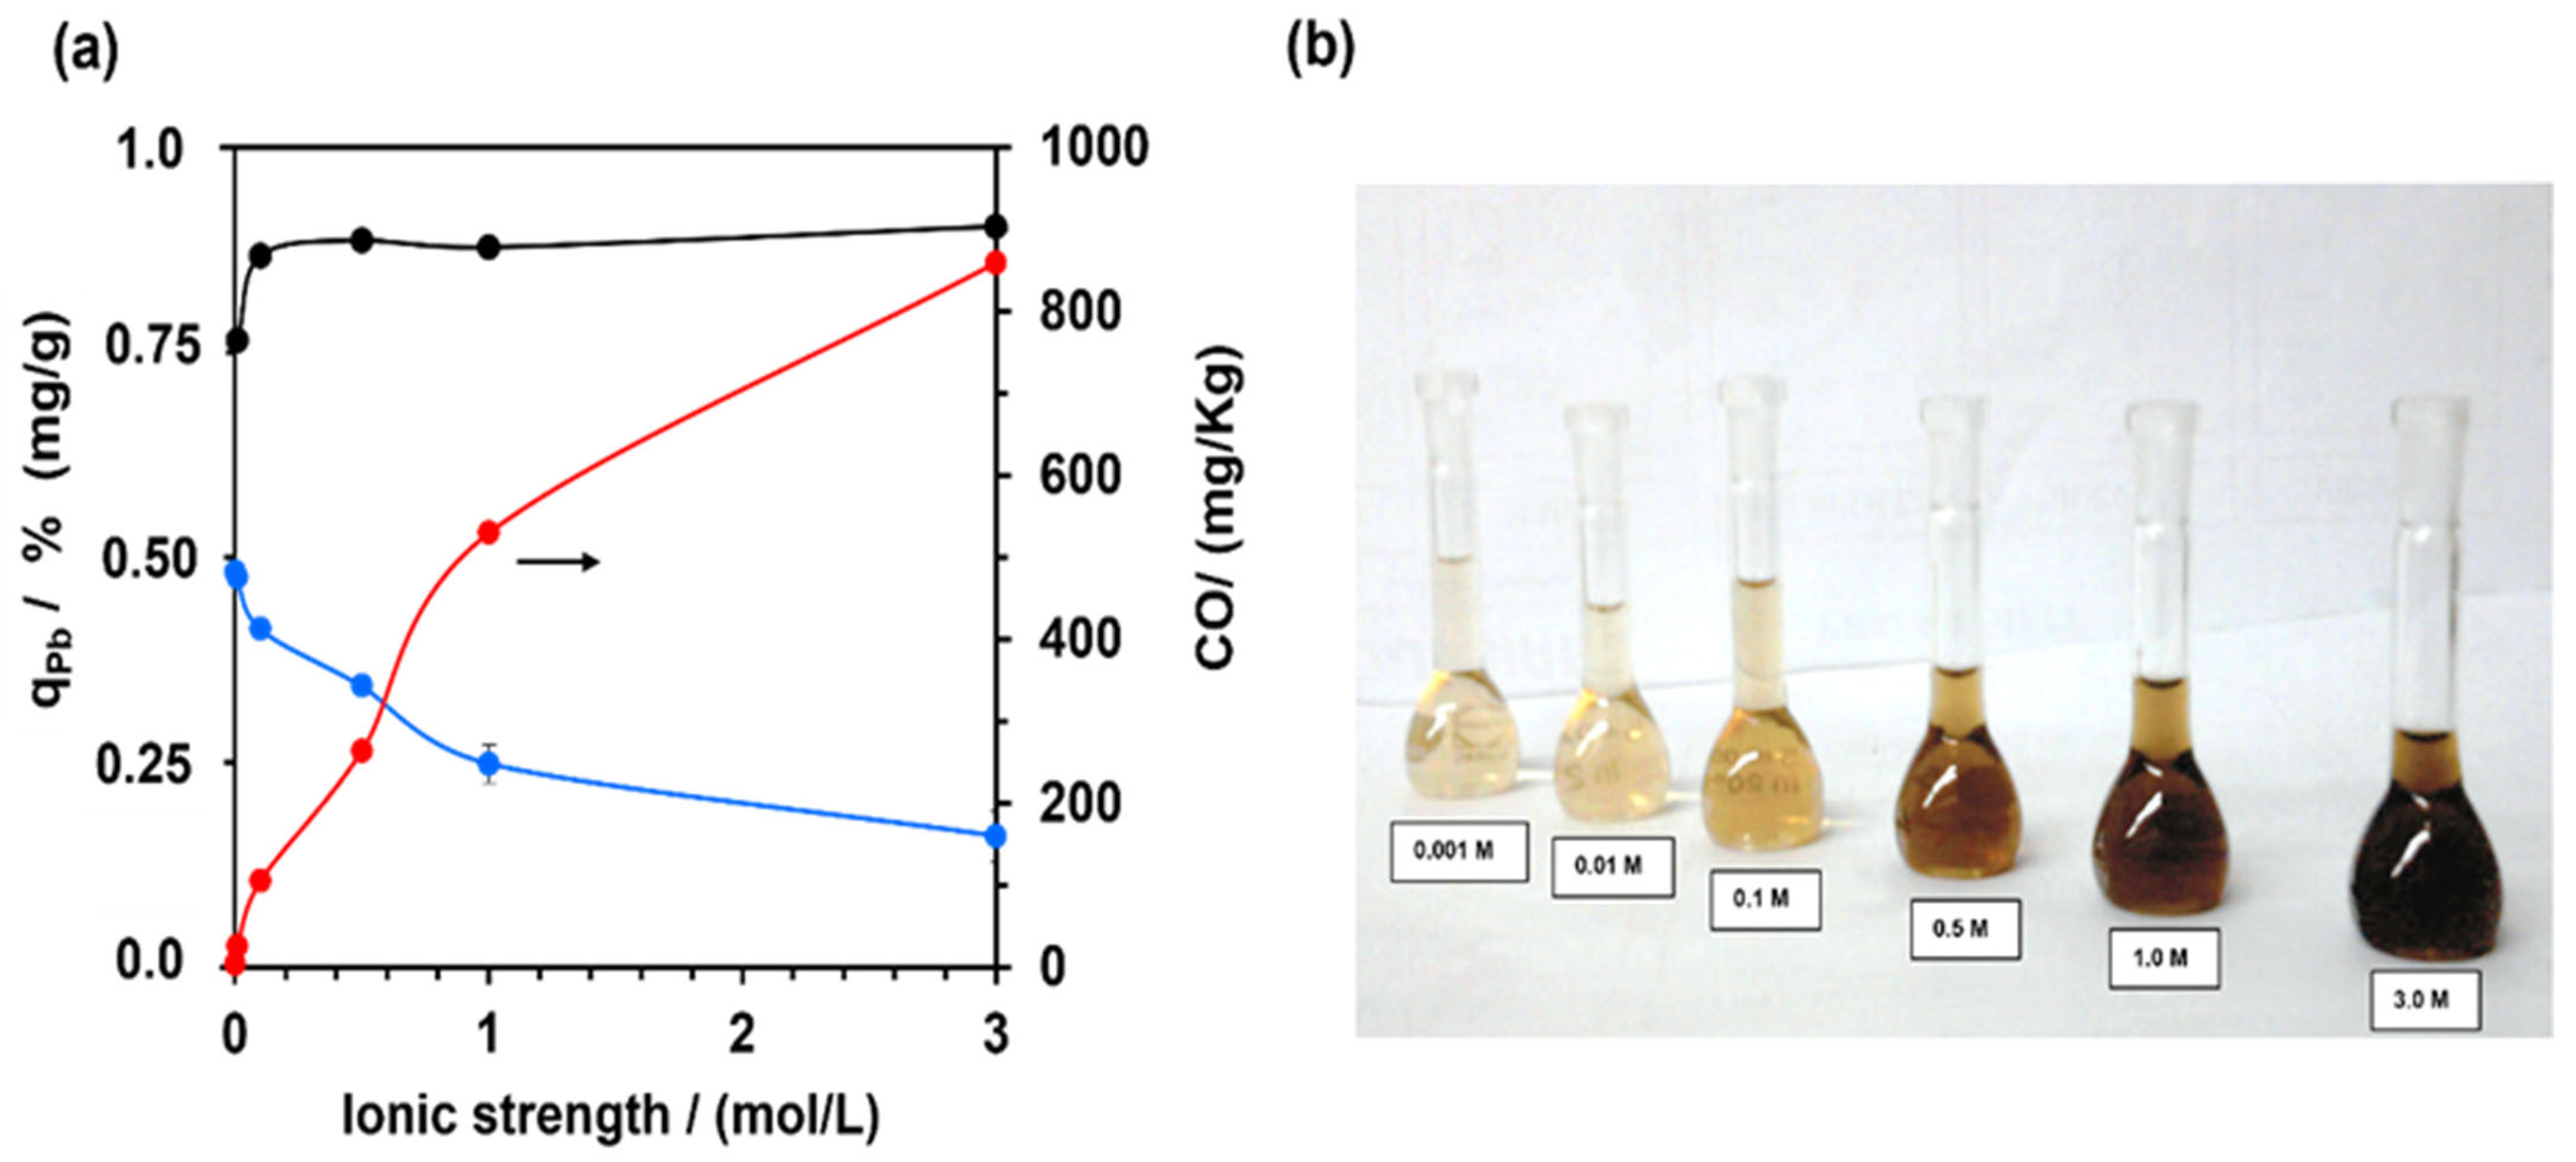
3.2. Pb (II) Leaching—Effect of the Ionic Strength

OM in soils can retain a significant amount of Pb(II) during leaching. However, the chemical interaction between the metal and organic compounds in ASs may be influenced by ionic strength. Therefore, we evaluated the effect of ionic strength (NaNO3) on Pb(II) retention capacity in ASs after 1 and 14 days of leaching, using soils with 10% OM (Figure 3a). Leaching time was controlled using a controlled leaching solution flux. The q P b after 1 day of leaching remained nearly constant as ionic strength increases. However, after 14 days of leaching, q P b decreased from 0.49 ± 0.01 mg/g to 0.20 ± 0.02 mg/g with increasing ionic strength from 0 to 3 mol L−1. This suggests that over a longer contact time, ionic strength exerts a slight effect on Pb(II) retention.
HAs and FAs contain a higher content of functional groups, including -COOH, -OH, and -NH2, among others. These, in combination with clays, create a negative charge layer on soil particles, facilitating favorable interactions with cations such as Pb(II) [29]. Consequently, metal retention in the 10% OM AS occurs primarily through favorable interactions with functional groups on soil particles, especially HAs and FAs. These acids act as anionic polyelectrolytes through various mechanisms, including electrostatic interactions, ligand exchange, hydrogen bonding, hydrophobic interactions, and van der Waals attractions [30]. According to the results, this favorable interaction is not affected within the first day of leaching at different ionic strengths. However, with increased contact time, the ionic strength promotes a synergistic effect: (i) the competitive interaction of Na(I) and Pb(II) with the negative charges on soil particles and (ii) the solubilization of organic carbon, reducing the concentration of sites available for interacting with Pb(II) in the soils. This effect has been demonstrated by previous studies, such as [31], which investigated the adsorption of lead in soil and showed that cations can affect the interactions between lead and the organic matter present in the soil.
On the other hand, a second effect occurs due to the increase in ionic strength, leading to an increase in the solubility of organic carbon. This results in an increase in the concentration of dissolved organic carbon (DOC) in the leachate, rising from 4.4 ± 0.1 mg/kg to 859.6 ± 3.1 mg/kg as the ionic strength increases from 0.001 M to 3.0 M (see Figure 3a). This is visually confirmed through digital photographs, as the tonality of the leachate becomes darker with the increase in ionic strength (Figure 3b). The DOC in the leachate is likely composed of FAs, which are soluble in both acidic and alkaline solutions [32]. These results are consistent with those obtained by our research group in a study of Pb(II) adsorption in soils with different OM content using the batch method [17]. In this study, it was proposed that organic carbon solubilization involves two chemical equilibria that affect lead soil retention (Equations (3) and (4)), which are described by the thermodynamic equilibrium constants, Equations (5) and (6), respectively.
P b ( a q ) 2 + + x ( S ) ( s ) P b ( S ) x ( x 2 ) ( s )
P b ( a q ) 2 + + x ( O C ) ( a q ) P b C O x x 2 a q
K P b ( S ) x ( x 2 ) = γ P b ( S ) x ( x 2 ) · [ P b S x x 2 ] γ P b 2 + · P b 2 + · γ S · [ S ] x
K P b ( C O ) x ( x 2 ) = γ P b ( C O ) x ( x 2 ) · [ P b C O x x 2 ] γ P b 2 + · P b 2 + · γ C O · [ C O ] x
where K P b ( S ) x ( x 2 ) and K P b ( C O ) x ( x 2 )   represent the thermodynamic equilibrium constants, γ is the activity coefficient of the chemical species, and [X] is the concentration of the species X (X = Pb2+ or (S) or P b S x x 2 ; or C O   or P b C O x x 2 ), where (S) is the interaction site in the soil, and (CO)− is the dissolved organic carbon. Thus, if the soluble metal–carbon equilibrium constant is significantly higher than the metal-interaction site equilibrium constant, i.e., K P b ( C O ) x ( x 2 ) K P b ( S ) x ( x 2 ) , it implies that metal–soluble organic carbon interactions drive the metal interactions, promoting lead leaching and reducing metal–soil interaction. However, the results demonstrate that with an increase in the soluble organic carbon concentration in the leachates, the metal retention capacity slightly decreases. This indicates that metal–soil interactions are more favorable than metal–soluble organic carbon interactions (i.e., K P b ( S ) x ( x 2 ) K P b ( C O ) x ( x 2 ) ). Therefore, an ionic strength of 0.01 mol/L, which showed the highest qPb values, was selected as the fixed value to evaluate the effect of OM and lead amount on qPb retention.

3.3. Spatiotemporal Distribution of Pb(II) in Soils

The leaching flow and distribution of heavy metals in soils depend on several factors, including pore size, chemical composition, and ionic strength, among others. These parameters affect the chemical interaction between the metal and soil particles, thereby modulating the leaching process [33]. To determine the distribution of Pb(II) in the prepared soils, we evaluated the spatiotemporal distribution in the 1% OM AS, using different pH values and 500 mg of Pb(II) (Figure 4). The data allowed us to construct a 3D surface and a Pareto chart as functions of time and the distance traveled by the heavy metals. It is observed that the 3D surface depends on the pH values. At pH 2 (Figure 4a), at low time values, Pb(II) shows the highest concentration at distances ranging from 0 to 10 cm within the first 20 h. However, as time increases, at approximately 120 h of leaching, the highest concentrations are found at 0 cm and 40 cm. The lead concentration at 0 cm decreases, while at 40 cm, it increases quadratically with time. This suggests that the leaching of the metal is rapid, and that lead is poorly retained by the 1% OM AS due to the low OM concentration. The 3D surface behavior changes significantly at pH 7 and 12. At pH 7, the distribution of Pb(II) is higher at a distance of 0 cm, and the concentration remains almost constant as time increases. Additionally, Pb(II) concentration decreases as the distance increases, with low concentrations found after a distance of 20 cm (<1.0 mg/kg).
At pH 12, the highest concentration of Pb(II) was observed at 0 and 10 cm, with lower concentrations at greater distances. Time did not significantly affect the distribution. According to the Pareto chart, the parameters influencing the distribution of Pb(II) vary with the pH of the leaching solution: at pH 2, it is the interaction between distance and time; at pH 7, it is distance; and at pH 12, it is the interaction between distance and distance, distance and time, and distance (p-value < 0.05) (Figure 4b,d,f). Similar behavior was observed at pH 7 using the soil with 10% OM AS (Figure 5a). However, the concentration of lead (Pb(II)) is notably higher due to the higher OM concentration, which retains lead in the first centimeters of soil depth. This behavior remains consistent as time increases, indicating that lead does not exhibit significant mobility in the soil. This aligns with the Pareto chart, which suggests that time is not a significant factor affecting lead leaching. However, distance and the interaction between distances do influence heavy metal leaching (Figure 5b). The experimental data allowed us to obtain a quadratic model that fits the surface response (Equation (7)). This model was evaluated using the determination coefficient (R2), which was close to 1 (R2 = 0.952) [34], indicating that the model is robust for predicting the q P b capacity of the tested soil as a function of distance and leaching time. The mathematical model is expressed by Equation (8).
Y = 24 , 027.4 167.137 x 1 1540.93 x 2 + 0.53134 x 1 2 + 2.97451 x 1 x 2
In this equation, Y represents the lead concentration, x 1 represents the leaching time, and x 2 represents the distance traveled by the heavy metal during the leaching process. Thus, Equation (7) allows the determination of the Pb(II) concentration as a function of both time and distance traveled.

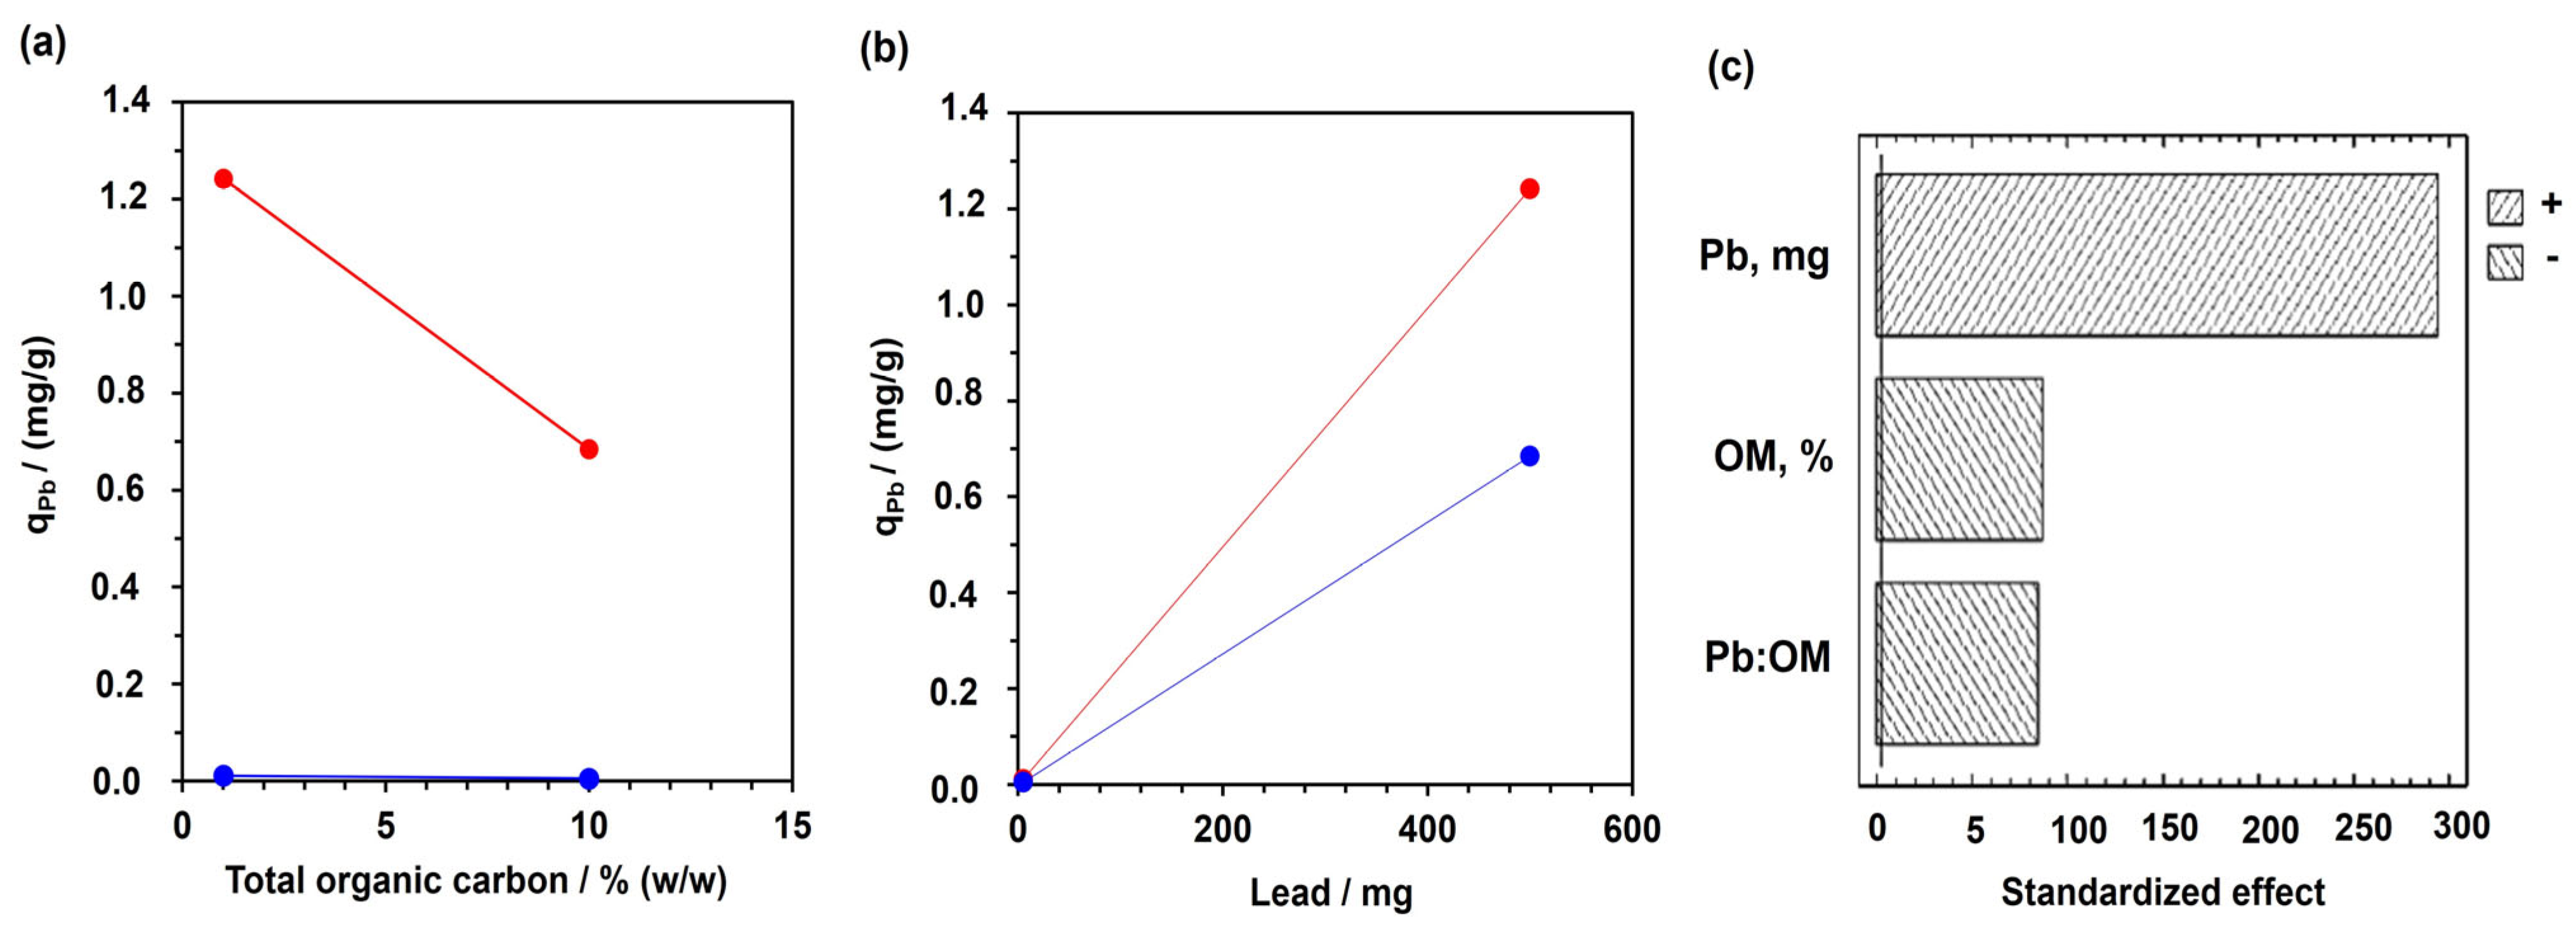
3.4. Pb (II) Leaching—Effect the Organic Matter and pH

Figure 6a,b show the q P b retention as a function of OM and the amount of lead, respectively. It is observed that qPb retention decreases as soil OM and Pb(II) amount increase. However, the Pareto chart (Figure 6c) indicates that the Pb(II) amount has a positive effect on q P b retention (p-value < 0.05), while soil OM % and the interaction between both parameters tested have a negative effect on qPb retention (p-value < 0.05). This suggests that higher OM in the soil likely increases soluble organic carbon, favoring CO—Pb(II) interactions and leaching. Thus, both soil OM concentration and Pb(II) amount are parameters that affect the leaching of Pb(II). Apart from OM % and the amount of lead, pH is a sensitive parameter that affects Pb(II) retention. It determines the lead speciation, influencing ion interactions with soil particles. Figure 7a,b display the response surface of q P b for the 10% OM AS at various pH values and different amounts of Pb(II).
The response surface shows a parabolic effect, where the highest q P b occurs at pH 7 with 500 mg of Pb(II). The results of the factor analysis showed statistical significance (p-value < 0.05). According to the Pareto chart based on two-way ANOVA, Pb(II) and pH had positive and negative effects on q P b , respectively (both with a p-value < 0.05). However, the interaction between the two factors (Pb:pH and pH:pH) did not significantly affect qPb (p-value < 0.05). The pH effect on q P b was analyzed using a Duncan test, which revealed three homogeneous groups when means were grouped. These groups followed the sequence: pH 12 < pH 2 < pH 7. This trend can be attributed to the lead speciation at different pH values. At pH 12, lead is found as Pb(OH)2, limiting its interaction with HAs and FAs present in the soil particles, thus explaining the lower q P b values. At pH 2, lead is found as the Pb(II) species, showing higher affinity for interacting with the anionic groups, increasing q P b values. However, due to the higher CEC capacity of the soil, the Pb(II) species could migrate to the soil particles, promoting the leaching of the cation. Additionally, the anionic groups on the HAs and FAs present in the soil particles are protonated, limiting their electrostatic interaction with the lead cation.
On the other hand, at pH 7, lead exists in equilibrium between Pb(II) and Pb(OH)+, which makes electrostatic interactions with anionic functional groups such as carboxyl and hydroxyl on the HAs and FAs more favorable [30]. As a result, the mobility of the lead cation is reduced through the soil particles, leading to an increase in qPb values. These results align with findings by a previous study [35], which evaluated lead absorption by humus modified with montmorillonite and found the highest adsorption results in the pH range of 5 to 6. The quadratic model fitting of the surface response shows an R2 value close to 1 (R2 = 0.997) [34], indicating that the model is robust in predicting the q P b capacity of the tested soil at different Pb(II) amounts and pH values. The mathematical model is expressed by Equation (8).
Y = 0.679975 + 0.296605 x 1 + 0.00157984 x 2 0.0212356 x 1 2 0.0000726781 x 1 x 2
where Y represents the q P b , x 1 represents the pH of the leaching solution, and x 2 represents the amount of lead used in the experimental process. Therefore, it is possible to predict q P b using the quadratic model as a function of both pH and the amount of lead added to the soil.

4. Conclusions

To evaluate the influence of OM, pH, and ionic strength, artificial soils (ASs) were successfully prepared using humus, clays, and PVC. OM, composed mainly of HAs and FAs, strongly influenced the leaching of Pb(II) in ASs through chemical equilibrium involving Pb(II) complexation with OM and dissolved organic carbon. Increasing ionic strength led to a decrease in q P b , thereby increasing Pb(II) leaching. Additionally, pH influenced Pb speciation, with q P b varying as pH 12 < pH 2 < pH 7. Thus, the spatiotemporal distribution of Pb(II) in soils exhibited diverse behaviors dependent on pH conditions. Moreover, this study developed mathematical quadratic equations to track Pb(II) behavior during various leaching scenarios. Considering the 3D surface profiles obtained, future research should apply these equations in different biogeochemical conditions.

Supplementary Materials

The following supporting information can be downloaded at: https://www.mdpi.com/article/10.3390/agronomy14071520/s1, Figure S1: Photograph of the setup used to evaluate the lead leaching in AS soils.

Author Contributions

A.F.C. Conceptualization, Visualization, Investigation, Formal analysis, and writing—review and editing. R.A.S.-A. Conceptualization, Investigation, Formal analysis, and Writing—review and editing. All authors have read and agreed to the published version of the manuscript.

Funding

This research has been funded by the Dirección General de Investigaciones of Universidad Santiago de Cali under call No. 01-2024.

Data Availability Statement

The original contributions presented in the study are included in the article/Supplementary Materials, and further inquiries can be directed to the corresponding authors.

Conflicts of Interest

The authors declare that they have no known competing financial interests or personal relationships that could have appeared to influence the work reported in this paper.

References

  1. Rashid, A.; Schutte, B.J.; Ulery, A.; Deyholos, M.K.; Sanogo, S.; Lehnhoff, E.A.; Beck, L. Heavy Metal Contamination in Agricultural Soil: Environmental Pollutants Affecting Crop Health. Agronomy 2023, 13, 1521. [Google Scholar] [CrossRef]
  2. Gimeno-Garcíaa, E.; Andreua, V.; Boluda, R. Heavy metals incidence in the application of inorganic fertilizers and pesticides to rice farming soils. Environ. Pollut. 1996, 92, 19–25. [Google Scholar] [CrossRef] [PubMed]
  3. Mar, S.S.; Okazaki, M.; Motobayashi, T. The influence of phosphate fertilizer application levels and cultivars on cadmium uptake by Komatsuna (Brassica rapa L. var. perviridis). Soil Sci. Plant Nutr. 2012, 58, 492–502. [Google Scholar] [CrossRef]
  4. Wei, B.; Yu, J.; Cao, Z.; Meng, M.; Yang, L.; Chen, Q. The Availability and Accumulation of Heavy Metals in Greenhouse Soils Associated with Intensive Fertilizer Application. Int. J. Environ. Res. Public Health 2020, 17, 5359. [Google Scholar] [CrossRef] [PubMed]
  5. Kumar, A.; Kumar, A.; Cabral-Pinto, M.M.S.; Chaturvedi, A.K.; Shabnam, A.A.; Subrahmanyam, G.; Mondal, R.; Gupta, D.K.; Malyan, S.K.; Kumar, S.S.; et al. Lead toxicity: Health hazards, influence on food chain, and sustainable remediation approaches. Int. J. Environ. Res. Public Health 2020, 17, 2179. [Google Scholar] [CrossRef] [PubMed]
  6. Chen, Q.; Wang, L.; Li, B.; He, S.; Li, Y.; He, Y.; Liang, X.; Zhan, F. Remediation of Cadmium and Lead in Mine Soil by Ameliorants and Its Impact on Maize (Zea mays L.) Cultivation. Agronomy 2024, 14, 372. [Google Scholar] [CrossRef]
  7. Wu, J.; Kim, H. Impacts of road salts on leaching behavior of lead contaminated soil. J. Hazard. Mater. 2017, 324, 291–297. [Google Scholar] [CrossRef] [PubMed]
  8. Charter, R.A.; Tabatabai, M.A.; Schafer, J.W. Metal contents of fertilizers marketed in Iowa. Commun. Soil Sci. Plant Anal. 1993, 24, 961–972. [Google Scholar] [CrossRef]
  9. Dijkstra, J.J.; Meeussen, J.C.; Comans, R.N. Leaching of heavy metals from contaminated soils: An experimental and modeling study. Environ. Sci. Technol. 2004, 38, 4390–4395. [Google Scholar] [CrossRef]
  10. Elnajdi, A.; Berland, A.; Haeft, J.; Dowling, C. Influence of Soil pH, Organic Matter, and Clay Content on Environmentally Available Lead in Soils: A Case Study in Muncie, Indiana, USA. Open J. Soil Sci. 2023, 13, 414–430. [Google Scholar] [CrossRef]
  11. González-Costa, J.J.; Reigosa, M.J.; Matías, J.M.; Fernandez-Covelo, E. Analysis of the importance of oxides and clays in Cd, Cr, Cu, Ni, Pb and Zn adsorption and retention with regression trees. PLoS ONE 2017, 12, e0168523. [Google Scholar] [CrossRef] [PubMed]
  12. Semenov, V.M.; Tulina, A.S.; Semenova, N.A.; Ivannikova, L.A. Humification and nonhumification pathways of the organic matter stabilization in soil: A review. Eurasian Soil Sci. 2013, 46, 355–368. [Google Scholar] [CrossRef]
  13. Khan, B.; Ullah, H.; Khan, S.; Aamir, M.; Khan, A.; Khan, W. Sources and contamination of heavy metals in sediments of Kabul River: The role of organic matter in metals retention and accumulation. Soil Sediment Contam. Int. J. 2016, 25, 891–904. [Google Scholar] [CrossRef]
  14. Wang, H.; Wang, C.X.; Wang, Z.J.; Cao, Z.H. Fractionation of heavy metals in surface sediments of Taihu Lake, East China. Environ. Geochem. Health 2004, 26, 303–309. [Google Scholar] [CrossRef] [PubMed]
  15. Nawab, J.; Khan, S.; Aamir, M.; Shamshad, I.; Qamar, Z.; Din, I.; Huang, Q. Organic amendments impact the availability of heavy metal (loid) s in mine-impacted soil and their phytoremediation by Penisitum americanum and Sorghum bicolor. Environ. Sci. Pollut. Res. 2016, 23, 2381–2390. [Google Scholar] [CrossRef] [PubMed]
  16. Parvin, A.; Moniruzzaman, M.; Hossain, M.K.; Saha, B.; Parvin, A.; Suchi, P.D.; Hoque, S. Chemical speciation and potential mobility of heavy metals in organic matter amended soil. Appl. Environ. Soil Sci. 2022, 2022, 2028860. [Google Scholar] [CrossRef]
  17. Sánchez-Andica, R.A.; Chamorro-Rengifo, A.F.; Páez-Melo, M.I. Assessment of the effect of organic matter on the retention of Pb+2 in artificial soils. Water Air Soil Pollut. 2021, 232, 426. [Google Scholar] [CrossRef]
  18. Liu, Y.; Molinari, S.; Dalconi, M.C.; Valentini, L.; Ricci, G.; Carrer, C.; Ferrari, G.; Artioli, G. The leaching behaviors of lead, zinc, and sulfate in pyrite ash contaminated soil: Mineralogical assessments and environmental implications. J. Environ. Chem. Eng. 2023, 11, 109687. [Google Scholar] [CrossRef]
  19. Sauvé, S.; McBride, M.; Hendershot, W. Soil Solution Speciation of Lead(II): Effects of Organic Matter and pH. Soil Sci. Soc. Am. J. 1998, 62, 618. [Google Scholar] [CrossRef]
  20. Mao, X.; Sun, J.; Shaghaleh, H.; Jiang, X.; Yu, H.; Zhai, S.; Hamoud, Y.A. Environmental assessment of soils and crops based on heavy metal risk analysis in Southeastern China. Agronomy 2023, 13, 1107. [Google Scholar] [CrossRef]
  21. Zhang, Y.; Zhu, C.; Liu, F.; Yuan, Y.; Wu, H.; Li, A. Effects of ionic strength on removal of toxic pollutants from aqueous media with multifarious adsorbents: A review. Sci. Total Environ. 2019, 646, 265–279. [Google Scholar] [CrossRef] [PubMed]
  22. Wang, S.; Li, W.; Yin, X.; Wang, N.; Yuan, S.; Yan, T.; Qu, S.; Yang, X.; Chen, D. Cd (II) adsorption on different modified rice straws under FTIR spectroscopy as influenced by Initial pH, Cd (II) concentration, and Ionic strength. Int. J. Environ. Res. Public Health 2019, 16, 4129. [Google Scholar] [CrossRef] [PubMed]
  23. Du, Y.J.; Wei, M.L.; Reddy, K.R.; Liu, Z.P.; Jin, F. Effect of acid rain pH on leaching behavior of cement stabilized lead-contaminated soil. J. Hazard. Mater. 2014, 271, 131–140. [Google Scholar] [CrossRef] [PubMed]
  24. Instituto Colombiano de Normas Técnicas, ICONTEC. 2011. Agricultural Industry Products. Organic Products Used as Fertilizers and Soil Amendments. (NTC 5167). Available online: https://tienda.icontec.org/gp-ntc-productos-para-la-industria-agricola-productos-organicos-usados-como-abonos-o-fertilizantes-y-enmiendas-o-acondicionadores-de-suelo-ntc5167-2022.html (accessed on 18 June 2024).
  25. Instituto Colombiano de Normas Técnicas, ICONTEC. 2011. Soil Quality. Determination of Organic Carbon. NTC 5403. Available online: https://tienda.icontec.org/gp-calidad-del-suelo-determinacion-del-carbono-organico-ntc5403-2021.html (accessed on 18 June 2024).
  26. Gutiérrez, P.H.; De la Vara, S.R. Análisis y Diseño de Experimentos, 3rd ed.; McGrawHill: Mexico City, Mexico, 2012. [Google Scholar]
  27. Ukalska-jaruga, A.; Bejger, R.; Debaene, G.; Smreczak, B. Characterization of soil organic matter individual fractions (fulvic acids, humic acids, and humins) by spectroscopic and electrochemical techniques in agricultural soils. Agronomy 2021, 11, 1067. [Google Scholar] [CrossRef]
  28. Yadav, M.; Kumar, D. Parameters of Soil Chemistry. In Applied Soil Chemistry; Ahamed, M.I., Ed.; Wiley: Beverly, MA, USA, 2021; pp. 197–214. [Google Scholar] [CrossRef]
  29. Ding, Y.; Liu, M.; Peng, S.; Li, J.; Liang, Y.; Shi, Z. Binding characteristics of heavy metals to humic acid before and after fractionation by ferrihydrite. Chemosphere 2019, 226, 140–148. [Google Scholar] [CrossRef] [PubMed]
  30. Islam, M.A.; Morton, D.W.; Johnson, B.B.; Angove, M.J. Adsorption of humic and fulvic acids onto a range of adsorbents in aqueous systems, and their effect on the adsorption of other species: A review. Sep. Purif. Technol. 2020, 247, 116949. [Google Scholar] [CrossRef]
  31. Yang, X.; Yang, S.; Yang, S.; Hu, J.; Tan, X.; Wang, X. Effect of pH, ionic strength and temperature on sorption of Pb (II) on NKF-6 zeolite studied by batch technique. J. Chem. Eng. 2011, 168, 86–93. [Google Scholar] [CrossRef]
  32. Lamar, R.T.; Olk, D.C.; Mayhew, L.; Bloom, P.R. A new standardized method for quantification of humic and fulvic acids in humic ores and commercial products. J. AOAC Int. 2014, 97, 721–730. [Google Scholar] [CrossRef]
  33. Cappuyns, V.; Swennen, R. The use of leaching tests to study the potential mobilization of heavy metals from soils and sediments: A comparison. Wat. Air Soil Poll. 2008, 191, 95–111. [Google Scholar] [CrossRef]
  34. Amini, M.; Younesi, H.; Bahramifar, N.; Lorestani, A.A.Z.; Ghorbani, F.; Daneshi, A.; Sharifzadeh, M. Application of response surface methodology for optimization of lead biosorption in an aqueous solution by Aspergillus niger. J. Hazard. Mater. 2008, 154, 694–702. [Google Scholar] [CrossRef]
  35. Jiang, K.; Liu, K.; Peng, Q.; Zhou, M. Adsorption of Pb (II) and Zn (II) ions on humus-like substances modified montmorillonite. Colloids Surf. A Physicochem. Eng. Asp. 2021, 631, 127706. [Google Scholar] [CrossRef]
Figure 1. Schematic diagram of the leaching system used in this study. The system includes: (1) leach solution container, (2) aquarium water pump, (3, 4, and 5) electronic system components, (6) PVC columns filled with materials, (7) sampling points, and (8) leachate containers.
Agronomy 14 01520 g001
Figure 2. Physicochemical characterization of ASs: (a) HA (), FA (), and CEC (). (b) Density (•) and WRC (). The arrow points to the axis with which the curve of each physicochemical parameter was constructed.
Agronomy 14 01520 g002
Figure 3. (a) Effect of the ionic strength on the Pb soil retention capacity after different leaching times (1 day (•) and 14 days ()), and soluble organic carbon () at various ionic strength concentrations in 10% OM AS. The arrow points to the axis with which the curve of each physicochemical parameter was constructed. (b) Digital photographs of leachate solutions after leaching experiments at different ionic strength concentrations for 14 days.
Agronomy 14 01520 g003
Figure 4. Three-dimensional response surface and Pareto chart of the Pb(II) soil concentration as a function of distance and time in 1% OM AS under different conditions: (a,b) pH 2 and 500 mg of Pb(II), (c,d) pH 7 and 500 mg of Pb(II), (e,f) pH 12 and 500 mg of Pb(II). In the Pareto chart, the symbols (+) and (−) indicate a positive and negative effect, respectively, of the factors on the Pb(II) soil concentration.
Agronomy 14 01520 g004
Figure 5. (a) Three-dimensional response surface and (b) Pareto chart of the Pb(II) soil concentration as a function of distance and time in 10% OM AS. The leaching was conducted at pH 7 and 500 mg of Pb(II). In the Pareto chart, the symbols (+) and (−) indicate a positive and negative effect, respectively, of the factors on the Pb(II) soil concentration.
Agronomy 14 01520 g005
Figure 6. (a,b) Interaction plots between OM and Pb(II) on the Pb(II) soil retention capacity. In (a), the lines illustrate the effect of Pb(II) amount (the slope) at each level of the OM factor. In (b), the lines illustrate the effect of OM (the slope) at each level of the Pb(II) amount factor. Additionally, red and blue lines indicate the curves for the high- and low-level factors, respectively: OM (high: 10%; low: 1%), and Pb(II) amount (high: 500 mg; low: 1 mg). (c) Pareto chart of the interaction between OM and Pb(II). In the Pareto chart, the symbols (+) and (−) indicate positive and negative effects, respectively, of the factors on the Pb(II) soil retention capacity.
Agronomy 14 01520 g006
Figure 7. (a) Three-dimensional response surface and (b) Pareto chart of the Pb(II) soil retention capacity as a function of pH and Pb(II) amount, using a 10% OM AS.
Agronomy 14 01520 g007
Table 1. Composition (in %) of the raw materials in the process of preparation of the four different ASs. PVC (polyvinyl chloride) was taken as inert matter.
OM 0%OM 1%OM 5%OM 10%
Humus (%)0.0012.4437.5078.55
Bentonite (%)10.5410.6510.5210.71
Kaolin (%)10.5410.6410.5210.71
PVC (%)78.9266.2641.460.00
Disclaimer/Publisher’s Note: The statements, opinions and data contained in all publications are solely those of the individual author(s) and contributor(s) and not of MDPI and/or the editor(s). MDPI and/or the editor(s) disclaim responsibility for any injury to people or property resulting from any ideas, methods, instructions or products referred to in the content.

