Article

Influence of Lateral Length and Residual Chlorine Concentration on Soil Nitrogen and Soil Enzyme Activities under Drip Irrigation with Secondary Sewage Effluent

1
College of Urban and Rural Construction, Shanxi Agricultural University, Taigu, Jinzhong 030801, China
2
China Institute of Water Resources and Hydropower Research, Beijing 100048, China
*
Author to whom correspondence should be addressed.
Agronomy 2024, 14(7), 1538; https://doi.org/10.3390/agronomy14071538
Submission received: 3 June 2024 / Revised: 4 July 2024 / Accepted: 12 July 2024 / Published: 15 July 2024
(This article belongs to the Section Water Use and Irrigation)

Abstract

:
Chlorination has been demonstrated to be an effective method for the prevention and reduction in emitter biological blockage in drip irrigation systems. The injected chlorine dose is generally determined by chlorine concentration at the terminal of the laterals which may lead to a high concentration of residual chlorine at the front of the system and bring detrimental impact to the soil environment and growth of crops, especially in large irrigation units with long laterals. A two-season experiment was undertaken to determine the effects of chlorine disinfection and lateral length on soil NO3-N, enzyme activities, and maize yield under wastewater drip irrigation. The experiments were constructed with lateral lengths ranging from 20 to 80 m and injection chlorine concentrations at the end of laterals ranging from 2 to 6 mg L−1. Lateral length had a major impact on enzyme activities in the partial growth stage, although the effects of lateral length and chlorine concentration on soil nitrogen content and maize yield were negligible. Enzyme activity and soil nitrogen concentration decreased throughout the lateral length as a result of chlorination. A higher detrimental impact on soil characteristics and maize yield is probably going to result from a high concentration of chlorine and a long lateral length mode. The maize yield peaked at L80 with a concentration of 2 mg L−1 chlorine, while it peaked at L40 with 6 mg L−1 chlorine concentration. A chlorination scheme with long lateral length and low chlorine concentration is recommended in consideration of maize yield and minimizing potential negative effects on the soil environment.

1. Introduction

Sewage effluent is increasingly being utilized for irrigation globally, especially in arid and semi-arid regions, owing to the restricted water resources [1,2,3]. Drip irrigation stands out as a highly dependable method for distributing wastewater effluent, yet the challenge of emitter blockage remains a significant hurdle in its management. Emitter blockage not only significantly lowers irrigation uniformity, but also imposes an impact on crops and hinders the widespread adoption of drip irrigation [4]. Chlorination is a crucial procedure to guarantee the security of drip irrigation systems that use sewage effluent [5]. The injection concentration and injection interval of the chlorination schemes suggested by researchers varied because of the variety of water quality characteristics and drip irrigation system operating settings [5,6,7]. Chlorine can come into direct contact with soil microorganisms, particularly those found in the rhizosphere. The risk of soil salinization increases when using chlorinated reclaimed water for irrigation, because chlorine generated via the oxidation process can be transformed into chloride ions [8]. Moreover, the deposition of chloride salts might affect the accumulation of nutrients, reducing soil fertility and causing adverse effects on crop growth, particularly in cases of repeated chlorination at high injection concentrations [8,9]. According to Ebrahimizadeh et al., when drip irrigation utilizing treated municipal effluent was used in the soil profile, variations in nitrogen concentration occurred in opposition to the variations in Cl concentration [10]. Remaining chlorine and other byproducts from the widespread use of disinfectants based on chlorine are released into the soil environment [11].
Biological characteristics of the soil may be the first to be impacted by disinfectants when treated wastewater reaches it [12]. Soil enzyme activity can be utilized as a wide indicator of the ecological activities of soil microbial communities, in addition to playing significant biochemical roles in the decomposition of organic matter and nutrient cycling in soil [13,14]. Soil phosphatase, an essential part of the soil phosphorus cycle, broke down organic phosphorus molecules to create phosphate that plants and microorganisms used [15]. It has been demonstrated that the amount of urease, which would convert urea into CO2 and NH3, was very sensitive to soil pollution [7,16]. Urease degrees have been a great indicator of soil nitrogen attention. The unavoidable consequence of the persistent use of disinfectants containing chlorine was environmental contamination [17,18]. According to Ma et al., Cl reduced the activities of both urease and phosphatase in red soils but boosted them in coastal saline soils [19]. Yang et al. mentioned that the prolonged application of chlorine-containing chemical fertilizers reduced the activities of catalase, urease, and alkaline phosphatase [20].
Crop growth will be impacted by the altered soil environment. Researchers have carried out studies on this topic. Chlorination can lower the yields and quality of crops that are susceptible to chlorine, such as potatoes and tobacco. It has been advised to avoid chlorination at the start of crop growth and to use chlorination mode with chlorine doses of 2–10 mg L−1 and intervals of 4–8 weeks [21]. It has been demonstrated that bacterial populations in irrigation water are immediately affected by chlorine dioxide disinfectants, even under low concentrations (about 0.25 mg/L), but not those in soil or spinach plants [22]. Chlorination is safe for crops that are moderately sensitive to chlorine, according to research by Hao et al., who also showed that injection durations of 0.5–3 h and chlorine injection doses of 1.3–8 mg L−1 had no discernible impact on enzyme activities [7].
The injected chlorine dose is generally determined by residual chlorine at the terminal of the lateral length [5,7]. A particular drip irrigation system covering a sizable area (thousands of acres) becomes more and more prevalent with the development of intensive agriculture in recent years in the desert area of Xinjiang, China [23]. The aforementioned management technique may result in a high residual chlorine content at the system’s front in large irrigation units with lengthy laterals, which would be detrimental to the environment and crop development. On the other hand, the uniformity of residual chlorine would be compromised by the degradation process brought on by chlorine’s interaction with irrigation water and pipelines. The residual chlorine concentration at different locations in the drip irrigation system may have different effects on the control of irrigation clogging, soil environment, and crop growth. Thus, it is still necessary to study the residual chlorine distribution characteristics under reclaimed water drip irrigation and the effect of chlorination practice on the soil–plant system, which will lead to further optimization of the chlorination mode.
To address the above issue, we hypothesized that changes in residual chlorine concentration along the lateral length would affect soil enzyme activities, plant uptake, and yield. To test this hypothesis, we collected soil and plant samples from an experimental field with three lateral lengths and two residual chlorine concentration management practices. The present study focuses on the effects of lateral length and chlorination practices on (1) the change in chlorine concentration along the lateral length and (2) the impact of chlorination on soil environment, maize nitrogen uptake, and yield and (3) seeks to propose a useful guide and appropriate application of a chlorination scheme for drip irrigation systems using wastewater effluent.

2. Materials and Methods

2.1. Experimental Field

The experiments were conducted at Shanxi Agricultural University in Taigu, Shanxi Province, China (37°25′ N, 112°36′ E, and 785 m above the sea level). The experimental area experiences a semi-arid climate with an average annual precipitation of 440 mm. The study area is mainly dominated with maize, and they have been irrigated by the groundwater before carrying out this experiment. The experimental soil was classified as clay loam [24], with a total nitrogen content of 0.945 g kg−1, an effective phosphorus content of 8.99 mg kg−1, an alkaline nitrogen content of 33.88 mg kg−1, and a pH value of 8.69. The average bulk density was 1.39 g cm−3, and the field capacity was 0.30 cm3 cm−3.

2.2. Experimental Arrangement

Field experiments of drip-irrigated maize were carried out for two seasons: from 10 July to 31 October in 2020 and from 28 April to 16 September in 2021. A 30 cm planting spacing and 50 cm row spacing were used for sowing maize. In both seasons, the two experimental factors that were taken into account were lateral length and chlorine concentration. The residual chlorine injection rates used were 2 and 6 mg L−1 (referred to as C2 and C6), and the dripline lengths were set at 20, 40, and 80 m (referred to as L20, L40, and L80). Three replications of a randomized entire block comprised the arrangement of the experiments. Consequently, 18 experimental plots were carried out. The driplines employed had a plain structure, with a 16 mm internal diameter, and a nominal discharge rate of 2.0 L h−1 was used. Each plot had two driplines positioned in the center of two neighboring rows of maize, each of which received one dripline for irrigation.
Using a water-driven adjustable proportional pump (Model 2504, Tefen Manufacture and Marketing Plastic Products, Nahsholim, Israel), liquid sodium hypochlorite (NaOCl) was injected into the allocated plots for each chlorination treatment during both seasons. The injected dose was calculated by keeping residual chlorine at the terminal of the laterals at a nearly constant rate. A chlorine meter (ExStick CL200, United States) was used to monitor the free chlorine residual rate in the effluent at the farthest emitter during the chlorine injection process at 10 min intervals. Based on the reading from the chlorine meter, the injection pump’s percentage was adjusted in order to maintain the intended free residual chlorine concentration.
Chlorine injection was administered at every irrigation event for all experimental treatments (Table 1). In the irrigation process, the water-fertilizer (chlorine)-water mode is used. This means that the irrigation system is stabilized for a minimum of 10 min before the chlorination treatment begins, and the reclaimed water irrigation is continued for a predetermined amount of time following the conclusion of the chlorination treatment.

2.3. Irrigation and Fertigation

For each treatment, a comparable watering and fertigation schedule was applied. The field capacity was used as the upper limit of irrigation when the average soil moisture inside the root zone dropped to 60% to 70% of the field capacity. The thickness of the moist layer is 40 cm at the seedling stage and 60 cm at the subsequent development stages. With this irrigation program, the complete irrigation in the 2020 and 2021 seasons was 70.3 mm and 90 mm, respectively. Before the wastewater was applied to the experimental plots, it was kept in a 40 m3 reservoir. A submersible pump with a capacity of 15 m3 h−1 and a lift of 36 m was used for the wastewater irrigation system. A disk filer with 120 meshes was installed upstream of the supply line and cleaned before every irrigation event. The inlet pressure is maintained at 0.1 Mpa during irrigation.
A total amount of 180 kg ha−1 nitrogen was applied in three applications in both seasons (Table 1). Urea nitrogen fertilizer was administered via drip irrigation systems with a water-driven adjustable proportional pump (Model 2504, Tefen Manufacture and Marketing Plastic Products, Nahsholim, Israel).

2.4. Water Physical and Biochemical Characteristics

The wastewater utilized in the experiment was provided by a sewage treatment plant, which mainly treated domestic sewage with an oxidation pond. To monitor changes in water quality, three sampling periods per season were conducted before each irrigation event using water from the reservoir. The wastewater’s physical and biochemical properties were measured, and the mean values and standard deviations of these measurements are presented in Table 2.

2.5. Soil, Plant, and Chlorine Sample Collection and Measurements

2.5.1. Soil Collection

In order to ascertain the fluctuations in enzyme activity and NO3-N content within the soil throughout the maize growth period, soil samples were extracted from the center of each plot at 20 cm intervals, utilizing a 5 cm diameter auger. The average soil enzyme activity and NO3-N content was estimated to be around 10 cm from the sampling point, which was perpendicular to the dripline. Soil samples were air-dried, crumbled, and then passed through a 2 mm screen before being analyzed.
In order to determine the soil enzyme activities and NO3-N contents along the lateral length, an auger (5 cm in diameter) was used to collect soil samples at depths of 0–100 cm with 20 cm intervals in a selected plot of each treatment at equal number (sample number = 8) along the lateral using at filling stage (after the third chlorination) and physiological maturity stage in 2020 and 2021.
Samples of 5 g of soil were extracted using 50 mL of 2 mol L−1 KCl, and a Smartchem 450 (AMS Alliance, France) was used to measure the NO3-N contents.
Urease and alkaline phosphatase activities were measured for soil samples ranging in depth from 0 to 40 cm using the methods outlined by Guan [25].

2.5.2. Plant Measurements

Aboveground plant biomass was routinely evaluated to investigate how the lateral length and chlorination methods affected the growth of maize. At harvest, the yield of maize was measured. Eight selected plant samples from each plot were obtained by routinely cutting the above-ground maize. Following their constant drying at 75 °C, the plant samples were weighed in order to obtain the aboveground plant biomass. Then, a Smartchem 450 (AMS Alliance, France) was used to quantify the total N content of the plant samples. The product of the N content and the biomass of aboveground plants was used to determine plant N absorption. Additionally, eight sites evenly placed throughout each plot’s two middle rows were used to harvest maize. Six plants in a row from each sampling location were utilized to calculate yield. The harvested maize was also used to calculate the components of maize yield, such as ear length, number of kernels per cob, barren ear tip, and weight of 100 seeds.

2.5.3. Chlorine Measurements

For each treatment, the total chlorination time was 2 h. Chlorine concentration tests were performed after 1 h of chlorine addition (assuming that the residual chlorine concentration at different locations of the system does not change with time). To investigate the chlorine concentration along the lateral length for drip irrigation system, eight water quality monitoring points were arranged along the lateral at equal intervals. A chlorine concentration test was carried out immediately after sampling (each sample and test takes about 4 min).

2.6. Statistical Analysis

The statistical software SPSS 19.0 (IBM, New York, NY, USA) was chosen to conduct the tests. To determine if the lateral length and chlorine concentration had a significant impact on soil enzyme activities, soil nitrogen content, and maize yield at the probability of 0.05, ANOVA (a two-way analysis of variance) with three replications was employed. All values of lateral length and chlorine content underwent Duncan’s multiple range testing.

3. Results and Discussion

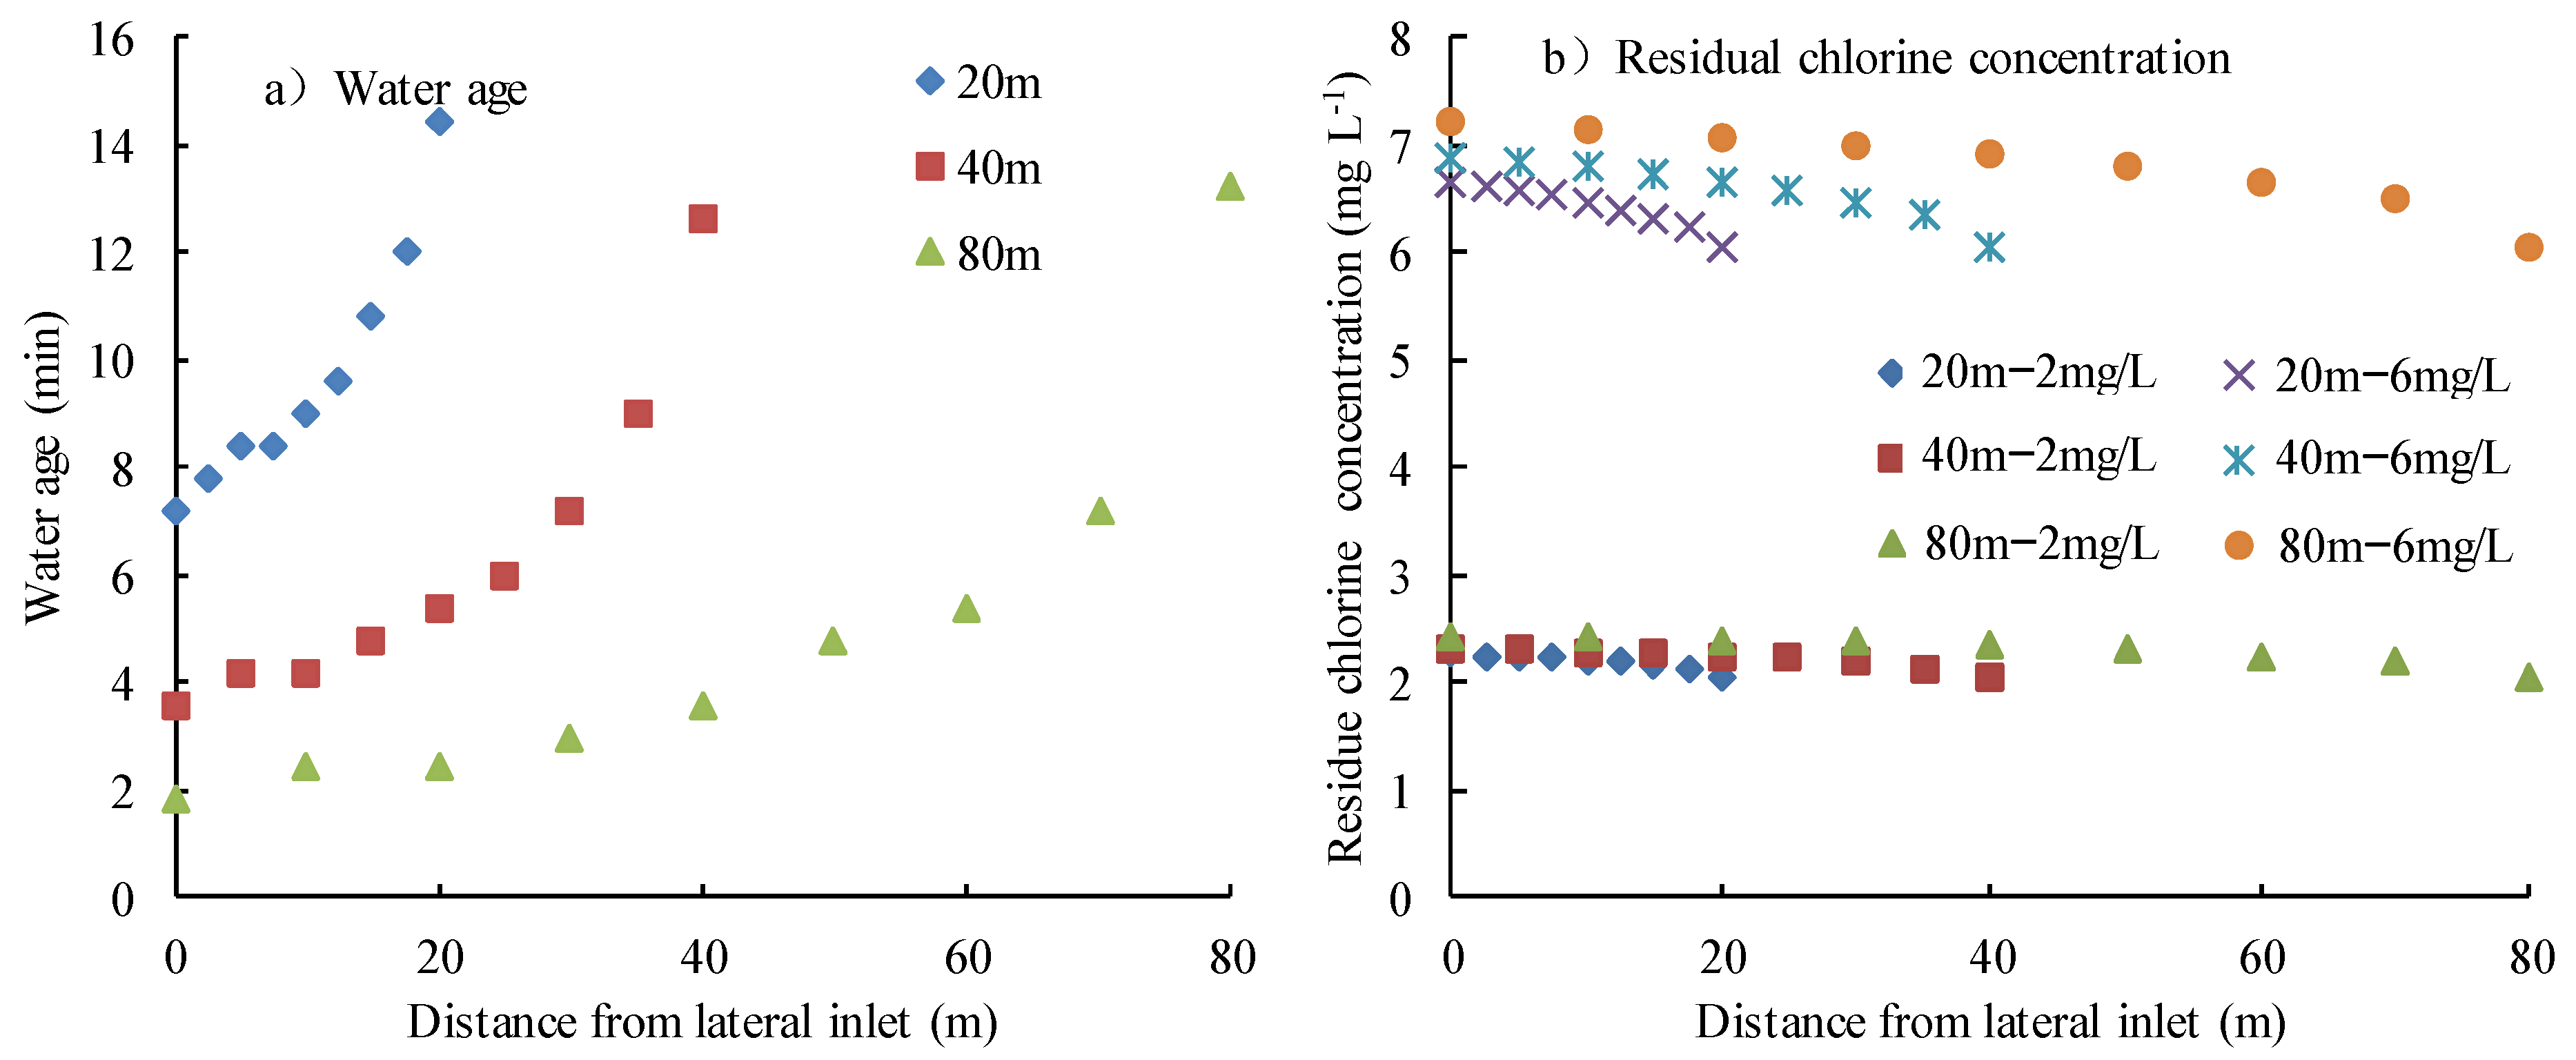
3.1. Distribution of Chlorine along Laterals

The water age of the pipeline nodes is considered as one of the crucial parameters for evaluating water quality in water supply distribution networks, closely correlated with the residual chlorine concentration. Water age is the time taken to move from the water source/chlorination point to a specific location in the network. Variations of water ages and residual chlorine concentrations along laterals with different chlorination concentrations are illustrated in Figure 1. The water age ranged from 7.2 to 14.4, 3.6 to 12.6, and 1.8 to 13.2 min for the L20, L40, and L80 treatments, respectively. Water age generally increased with the lateral distance from the entrance, especially in the second half of the lateral. The substantially lower flow velocity in the tail than that for head could be a reason for the result [26]. The water age at the end of lateral showed a tendency of first lowering and then increasing with the increase in lateral length. For example, the water age at the end of the lateral for L40 was 12.6 min, which was 12.5% and 4.5% lower than that for L20 and L80 treatment, respectively. However, the average water age showed a decreasing trend with the increasing lateral length. Compared with L20 treatment, the average water age for L40 and L80 decreased by 34.9% and 50.0%, respectively. The greater flow rate of pipelines with longer capillary length induced the lower water age.
Water age along the lateral determines the reaction time between chlorine and irrigation water and pipe wall, which is the key factor affecting the residual chlorine concentration in the drip irrigation network. As chlorine reacts with water and the pipe wall, the residual chlorine concentration showed a decreasing trend along the lateral length under different chlorine concentration conditions. The decay rate of the residual chlorine reduced with increasing chlorine concentration for the same lateral length. For example, the residual chlorine concentrations’ deviation rate along the lateral length was 19.61% and 19.57% for C2L80 and C6L80, respectively. The primary reason for the result is the higher bulk and wall coefficient for treatment with lower chlorine concentration [27]. For a given residual chlorine concentration, the difference of residual chlorine concentration along the lateral increased with the increase in lateral length. For example, the difference between maximum and minimum residual chlorine concentration was 0.60, 0.86, and 1.18 mg/L for the C6L20, C6L40, and C6L80 treatments, respectively. This was induced by the larger migration distance for longer lateral length [26].

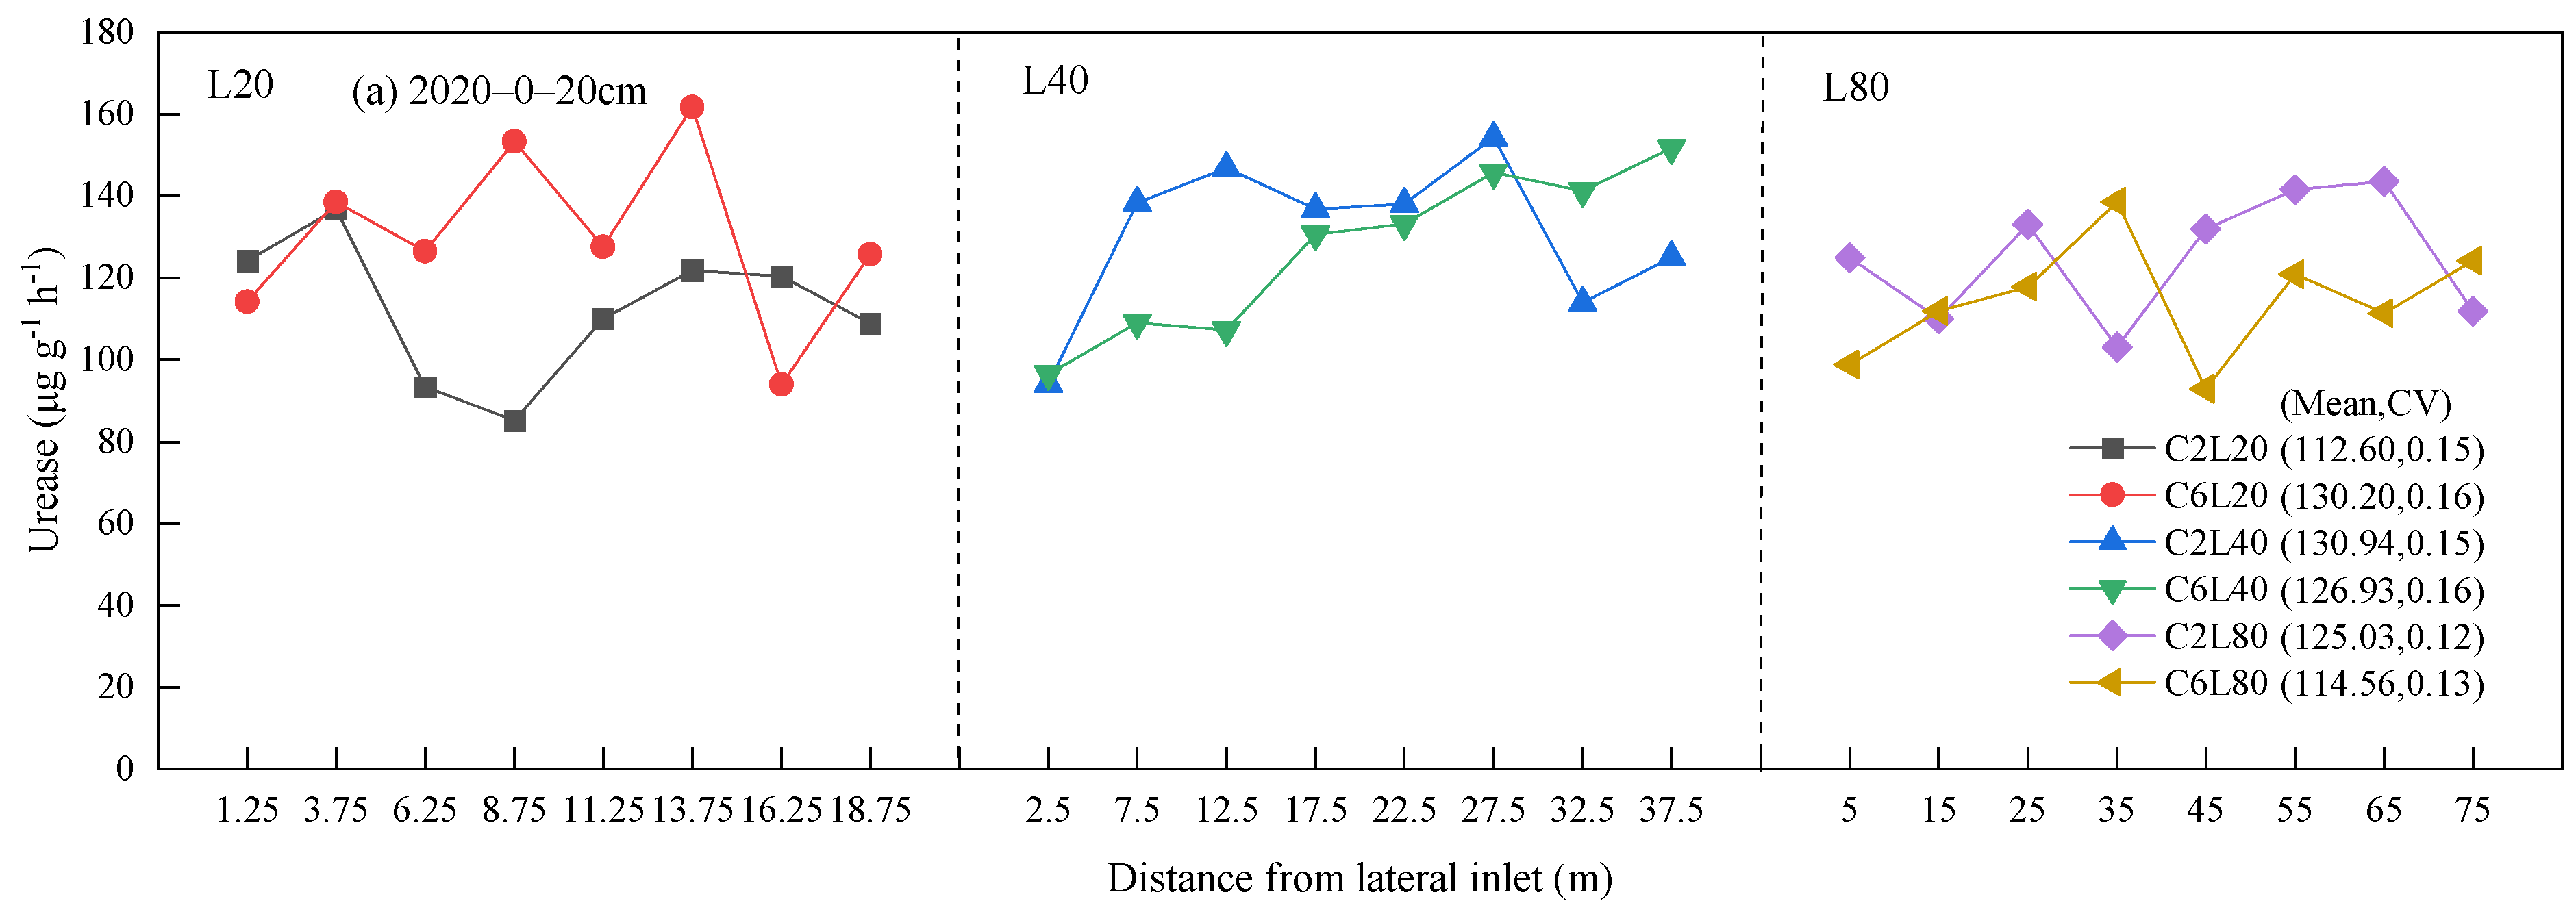
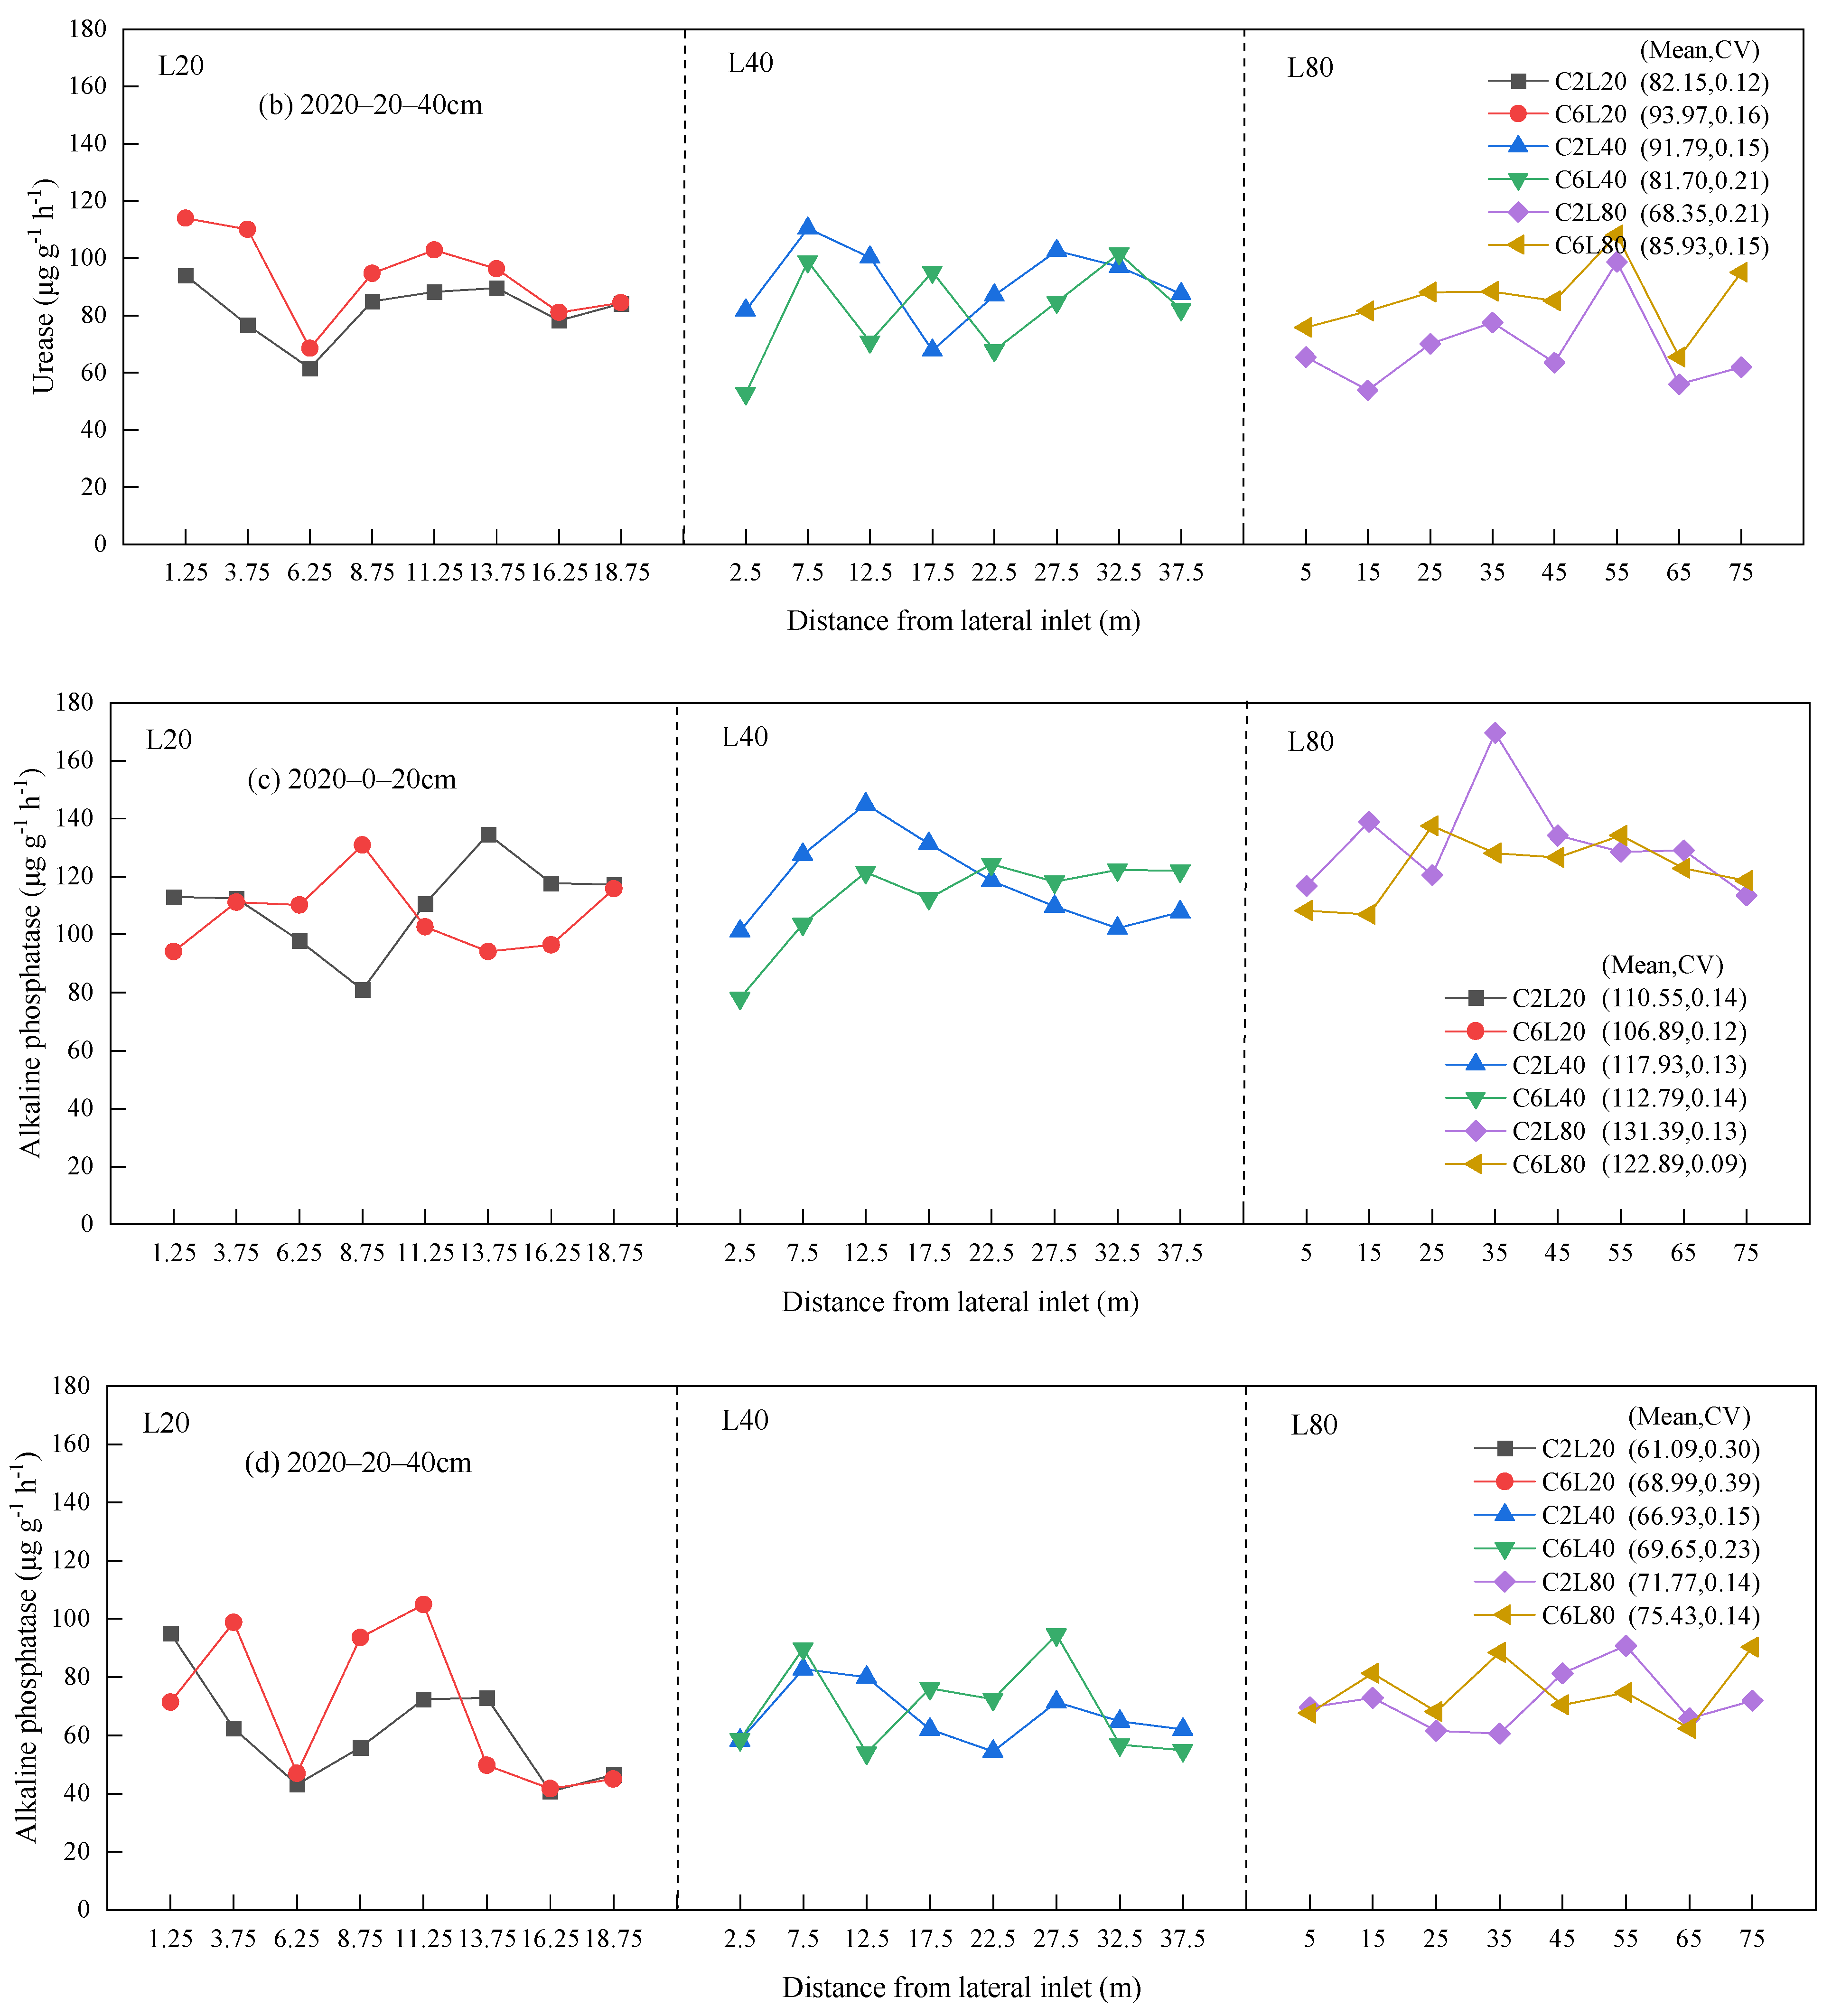
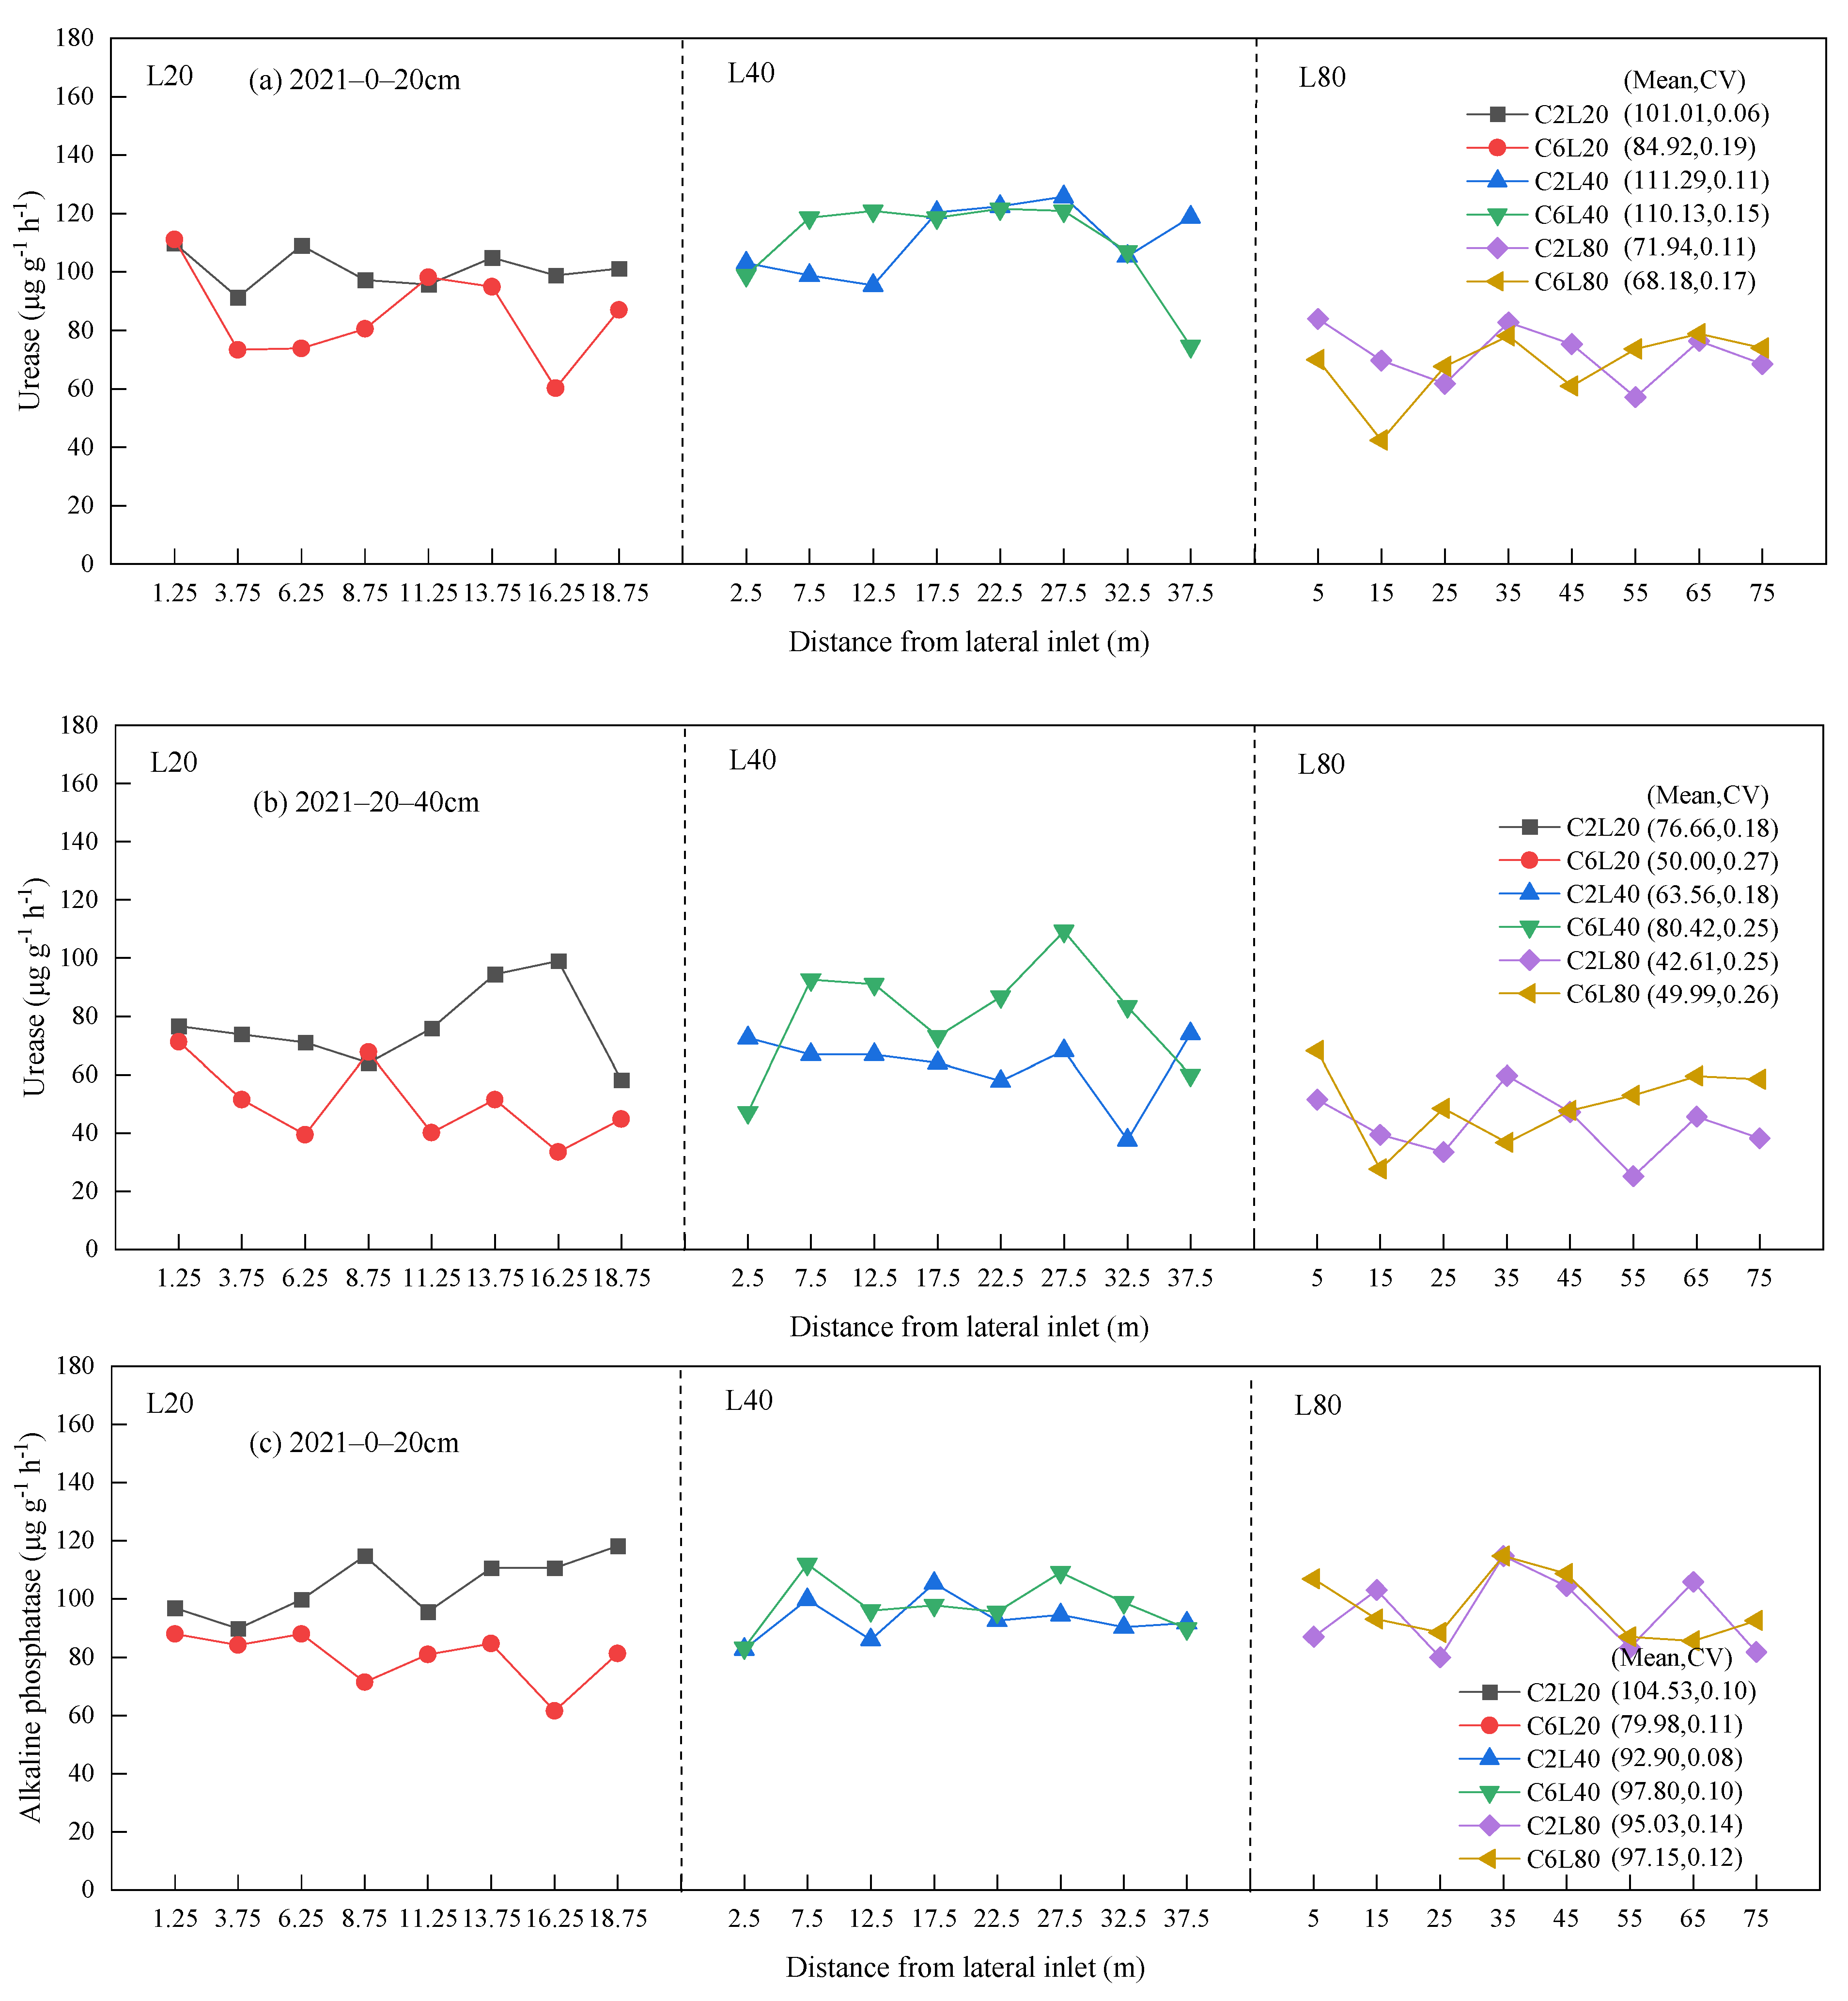
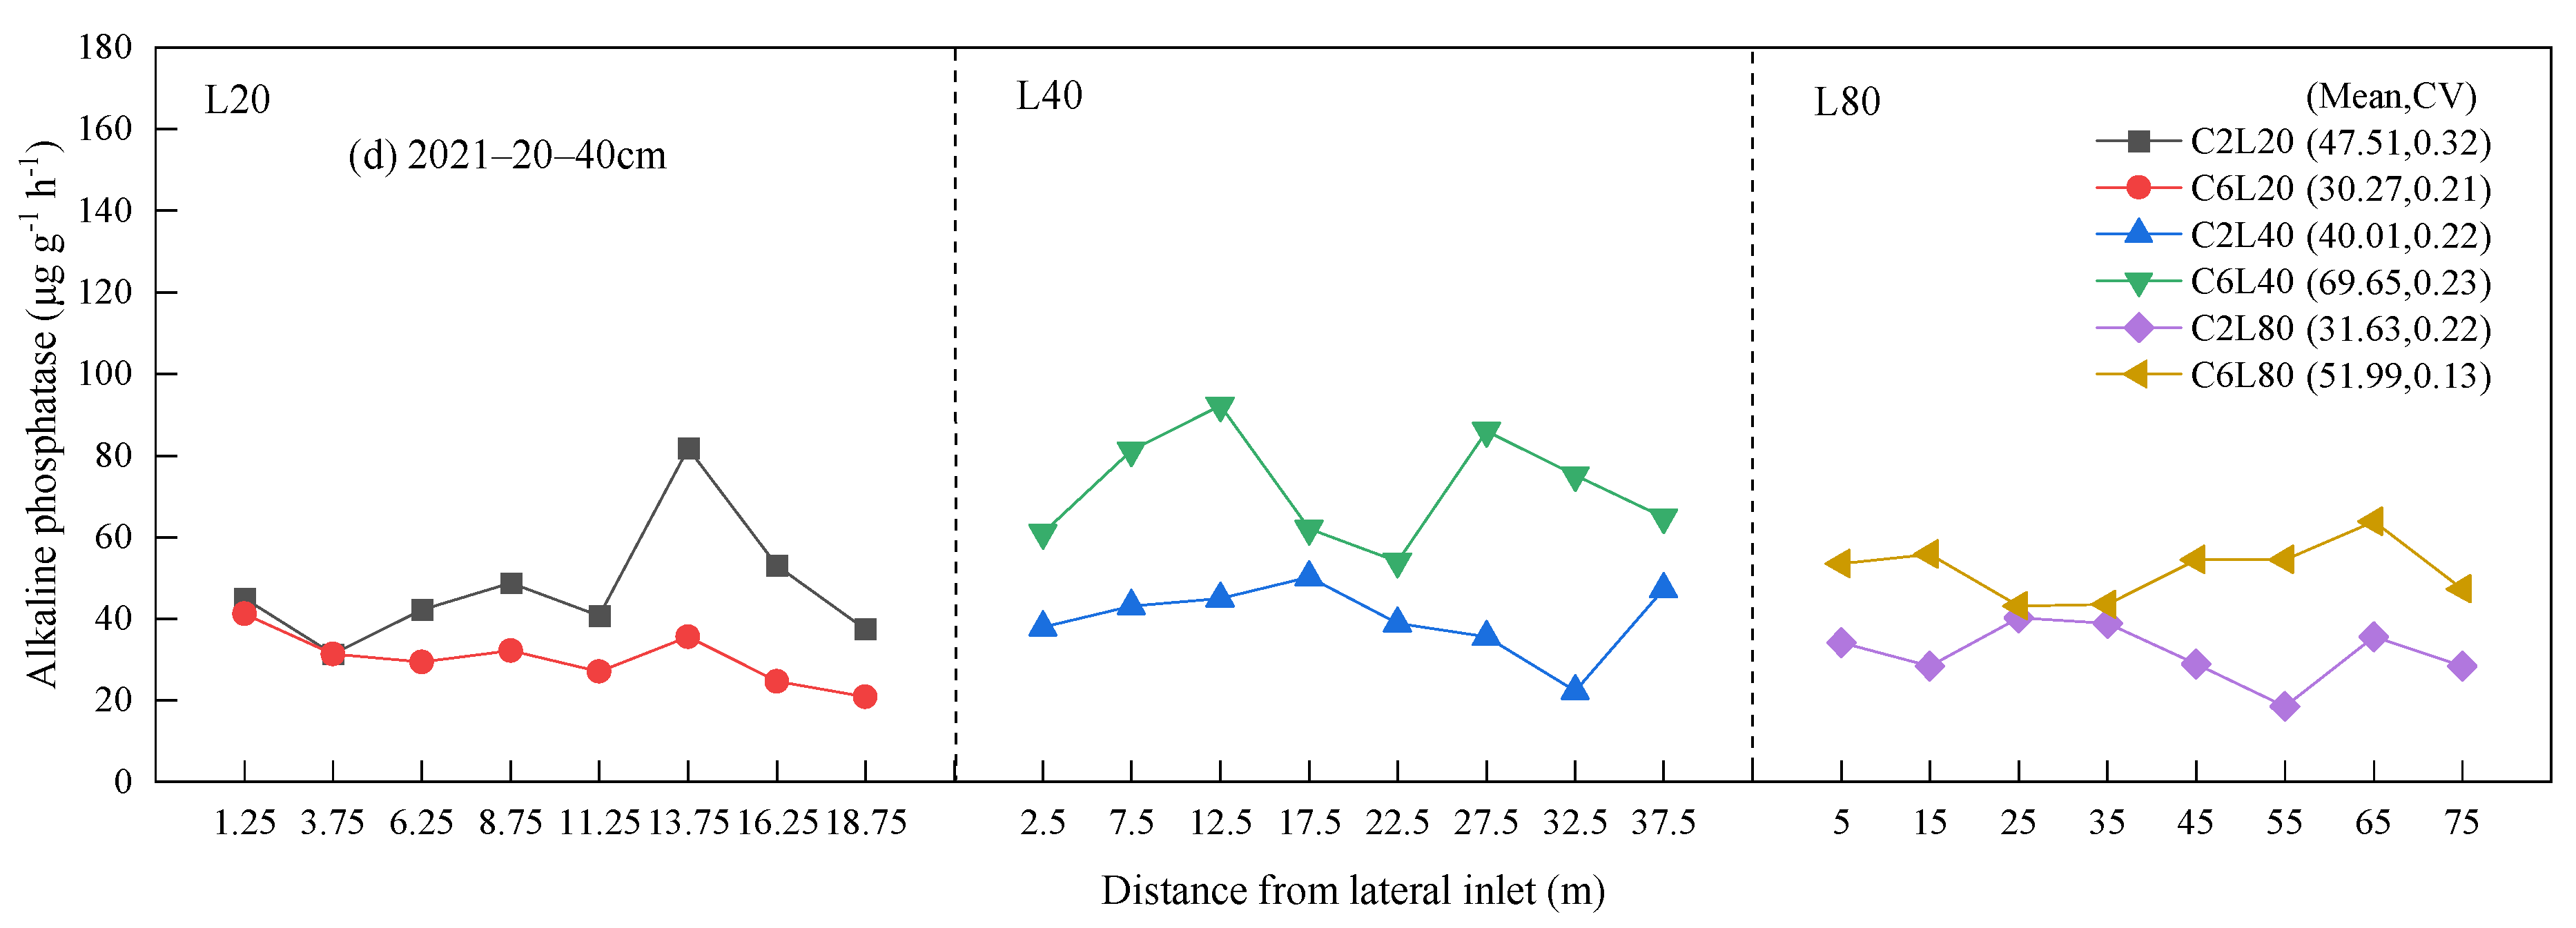
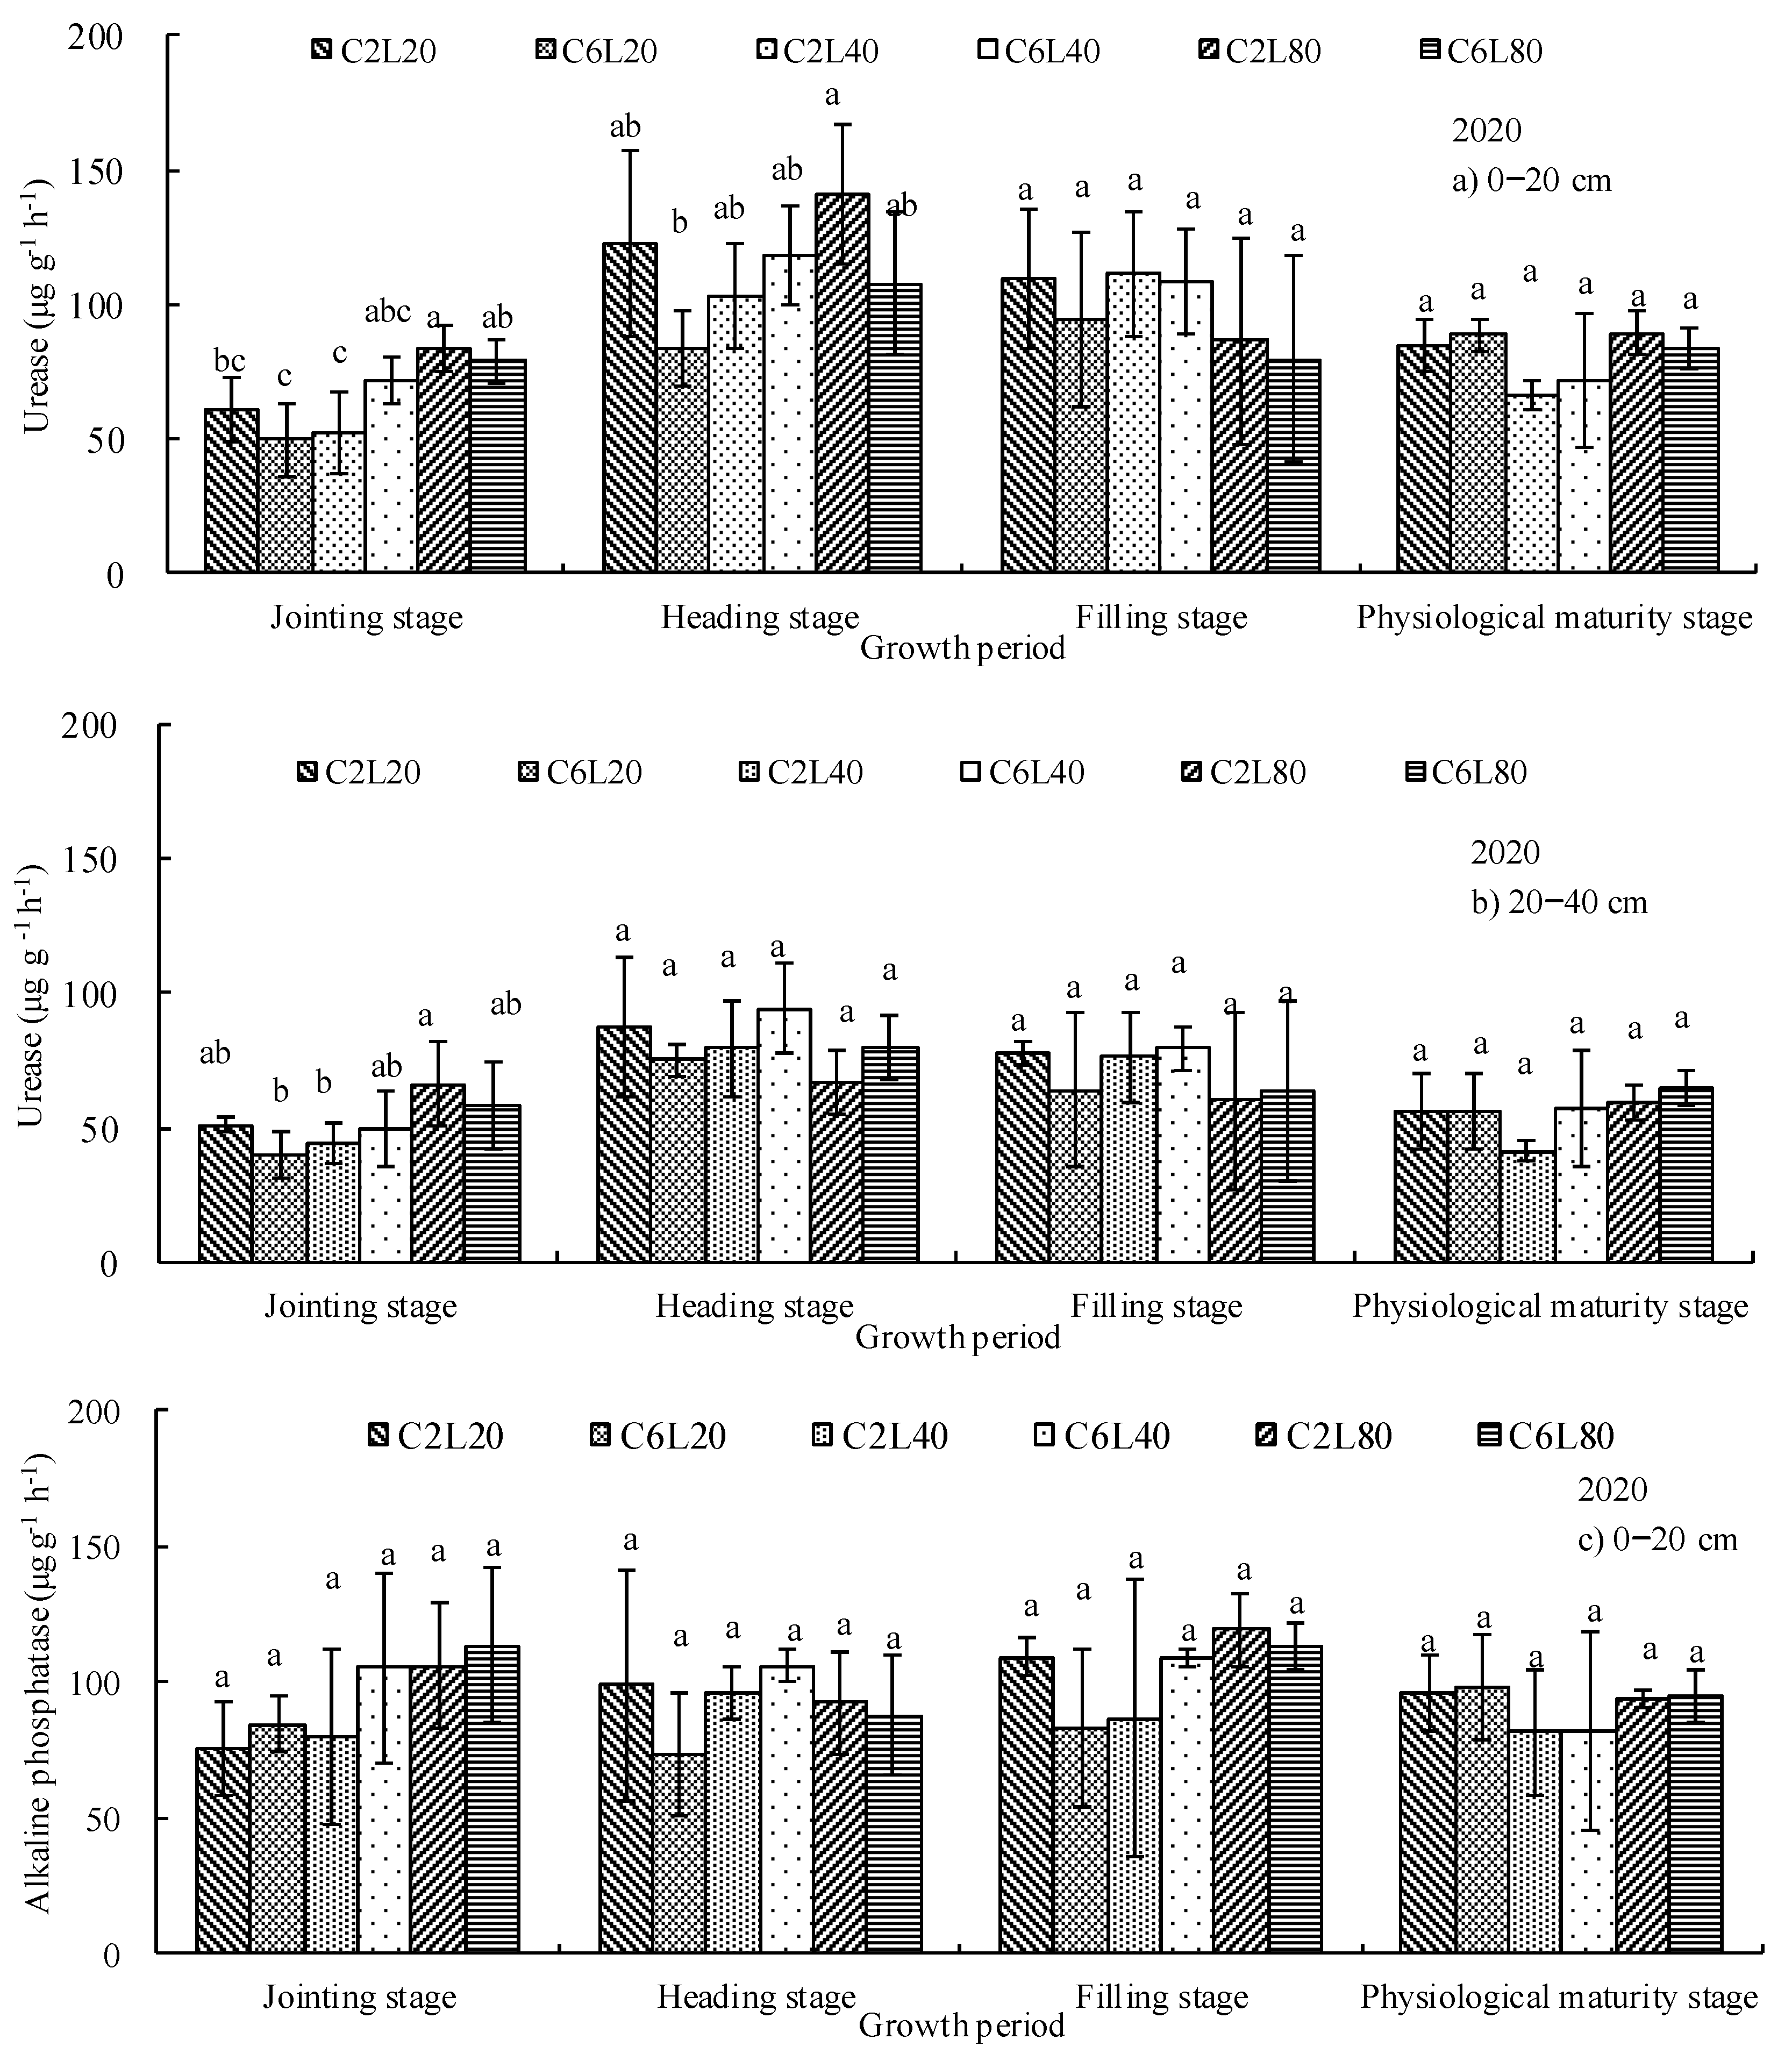
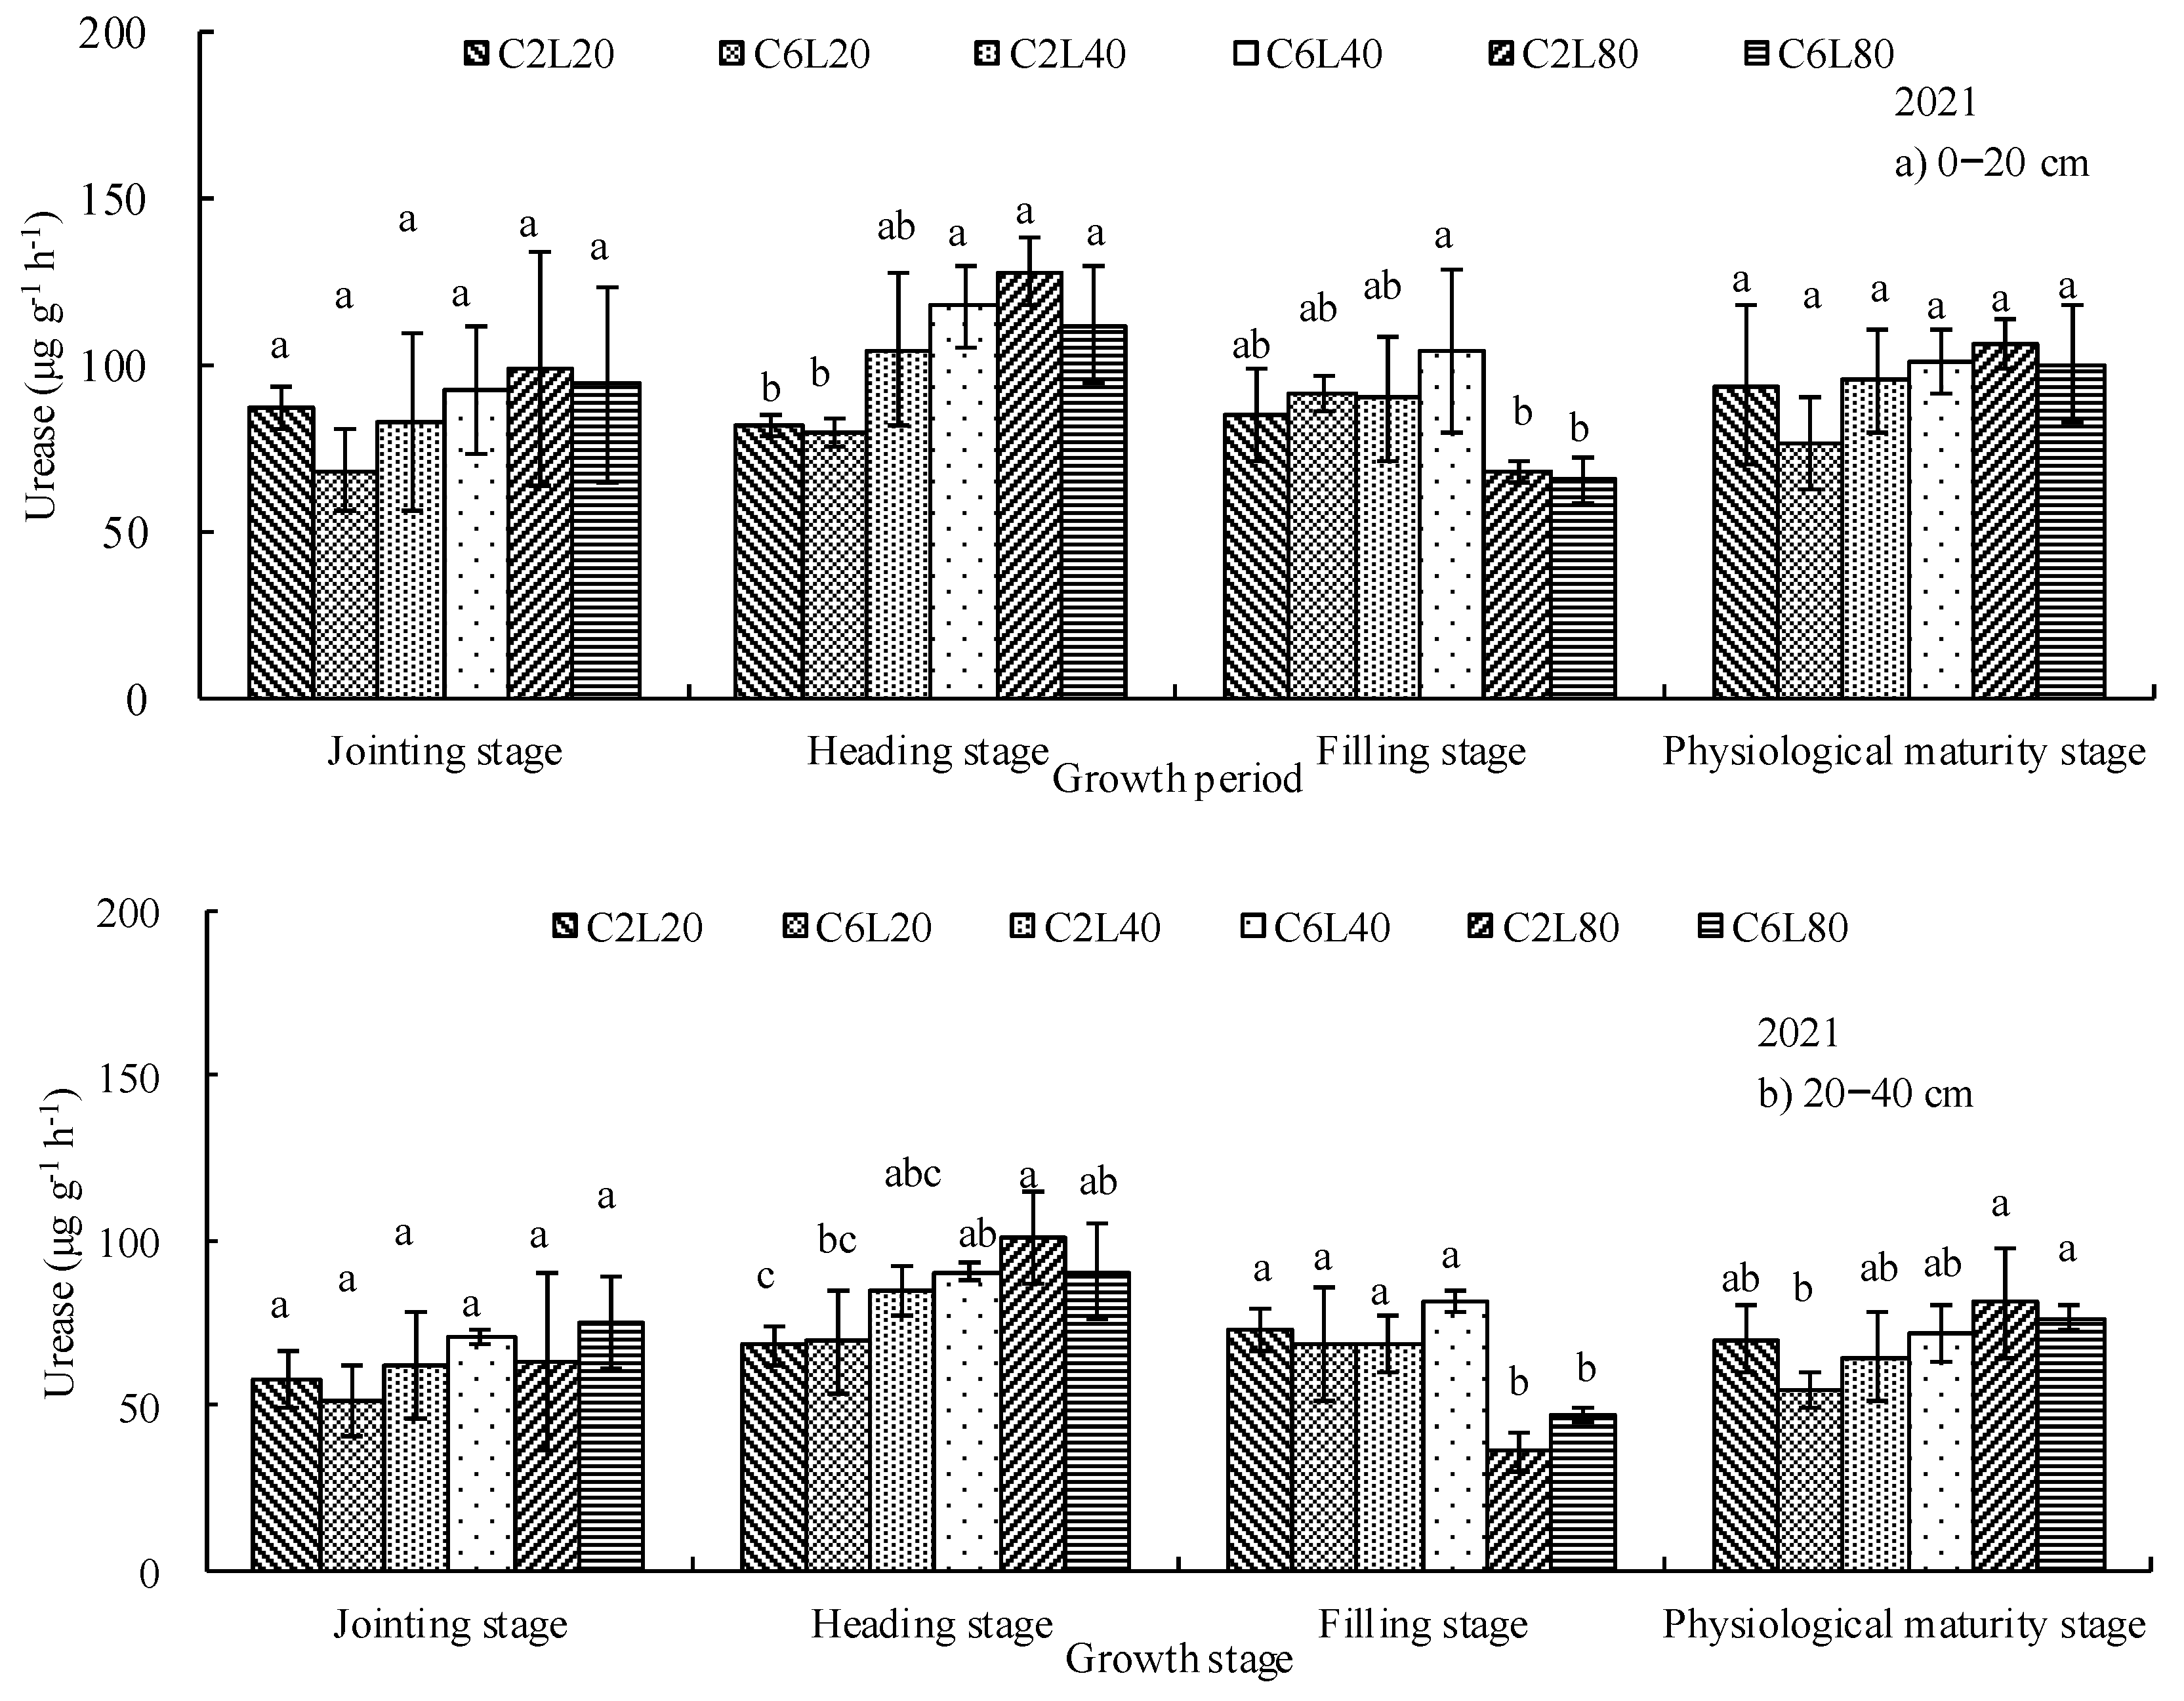
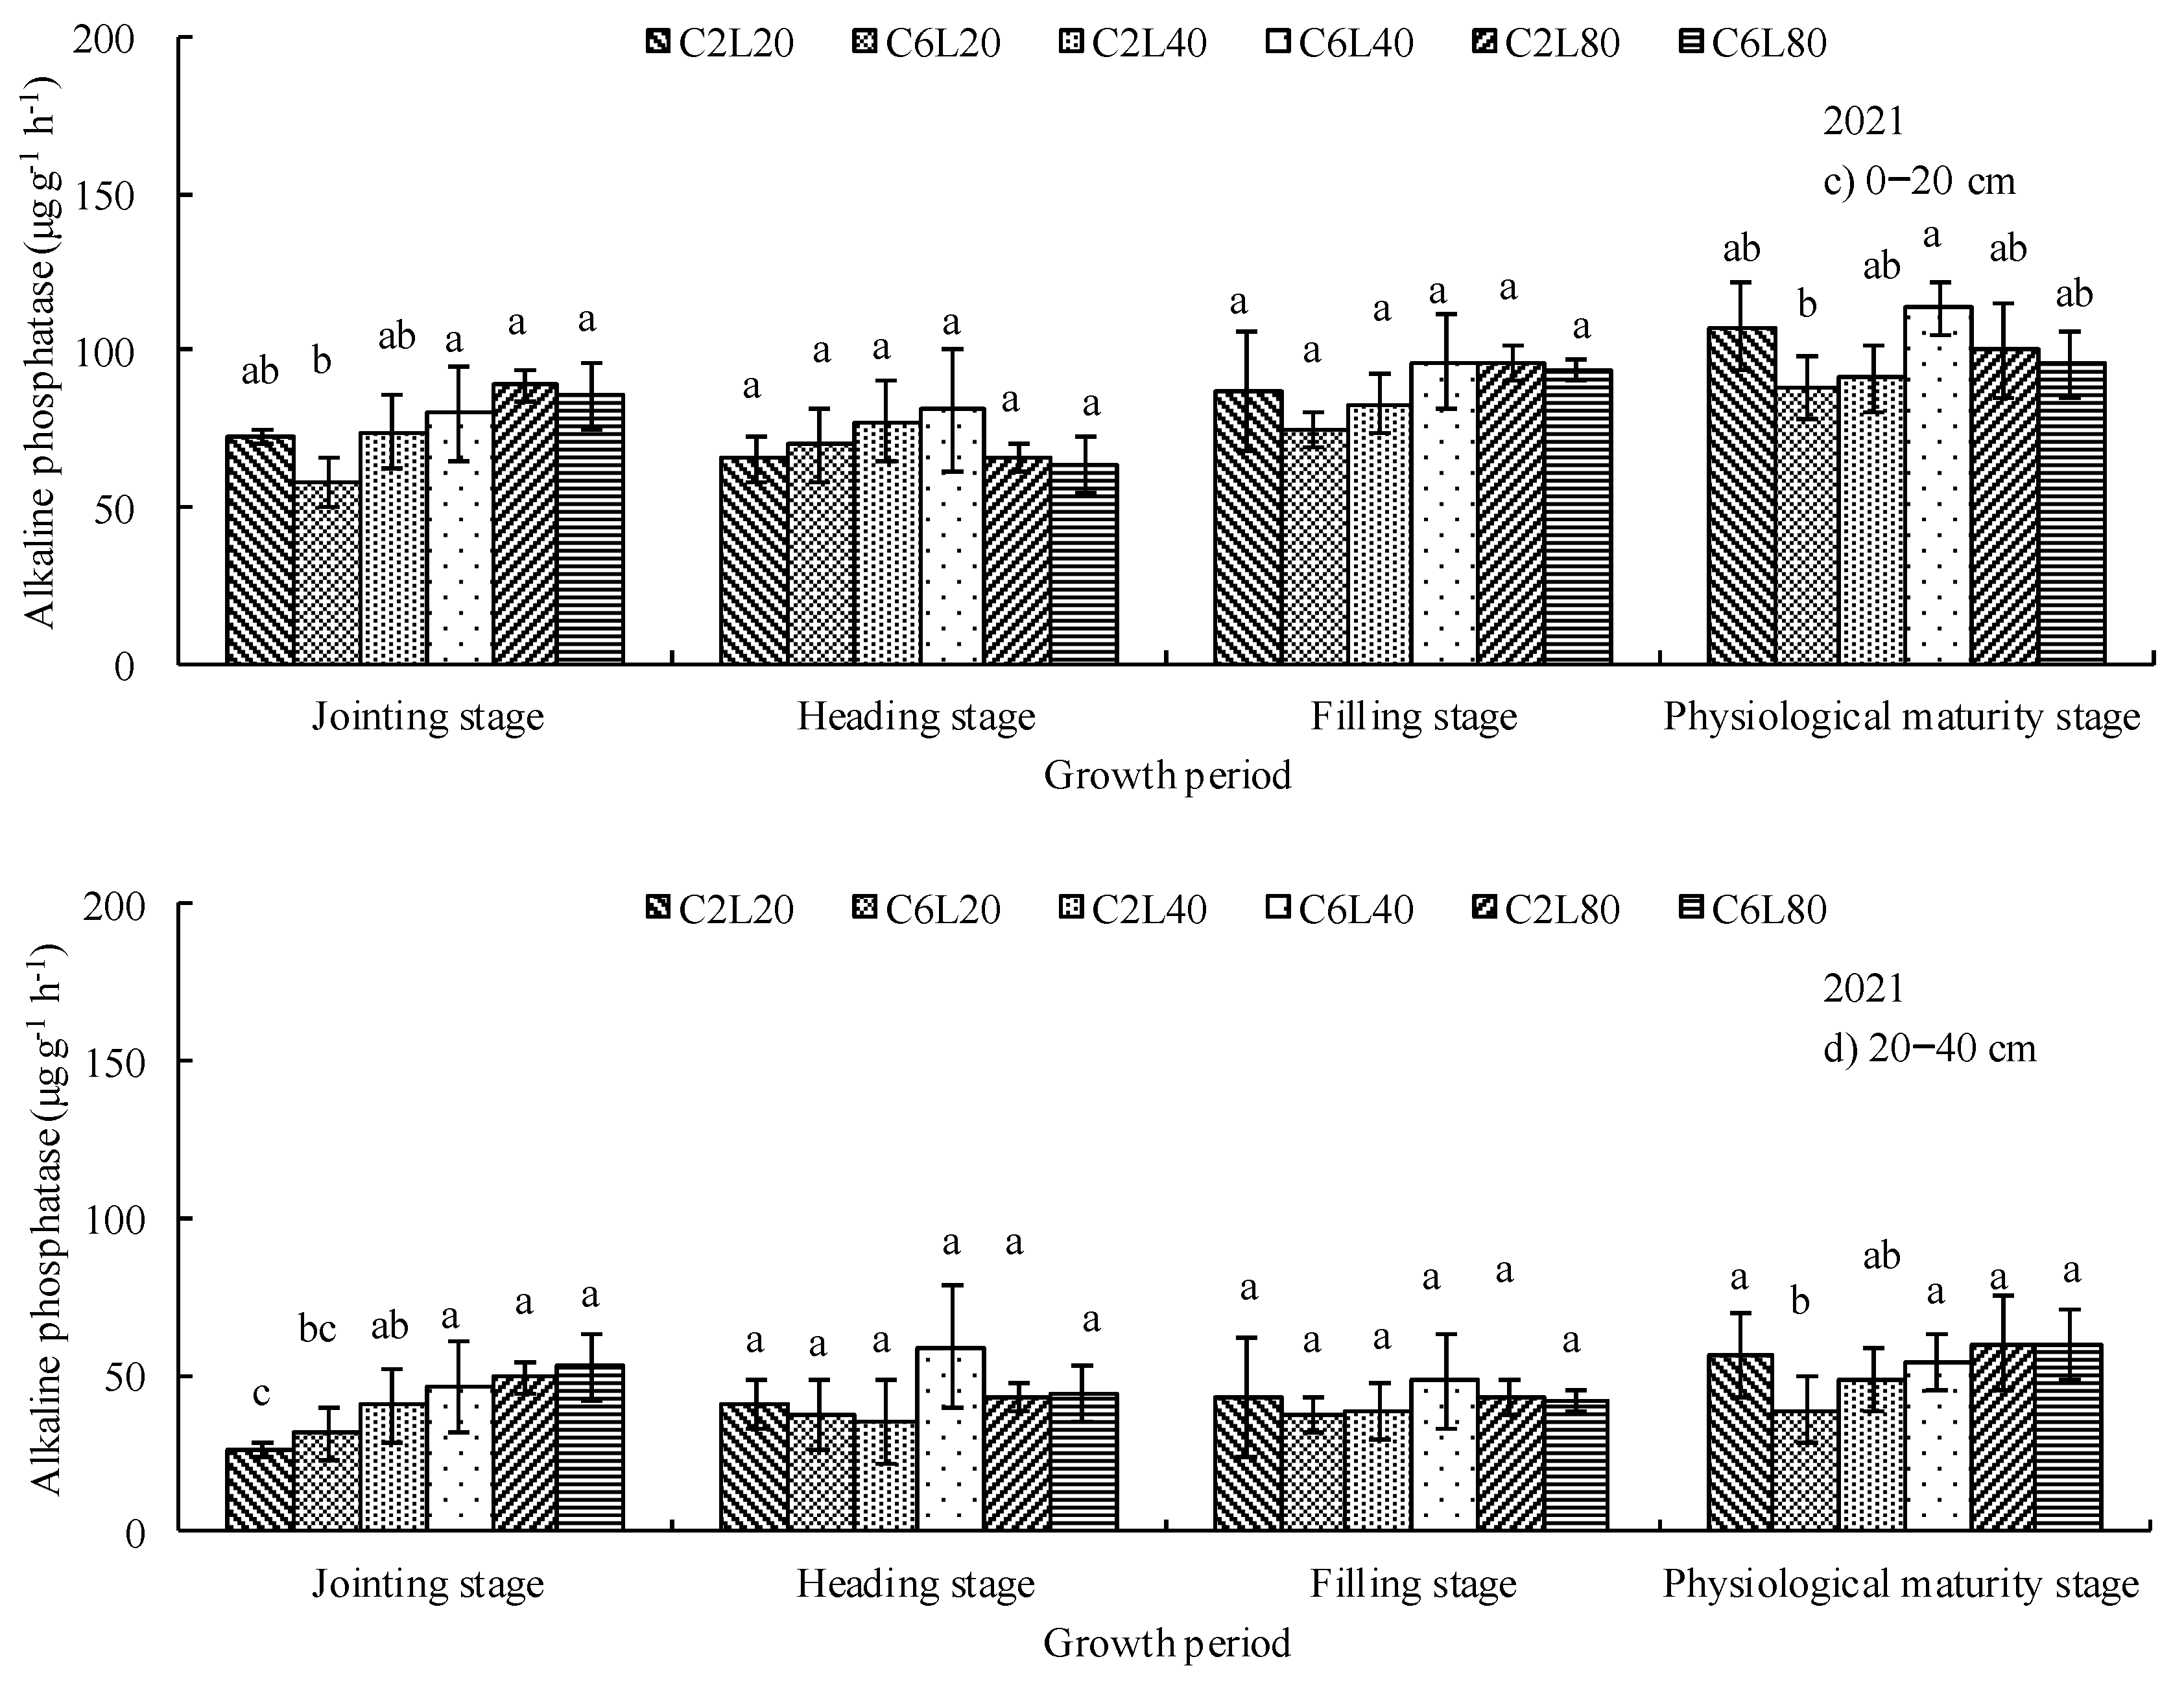
3.2. Distribution of Soil Urease and Alkaline Phosphatase Activities

The distribution of two important soil enzymes in 2020 and 2021 are shown in Figure 2 and Figure 3. The soil enzyme activities generally decreased as chlorine concentration increased. Compared with the treatments with 2 mg L−1 chlorine concentration, the soil urease and soil alkaline phosphatase activity for treatments with 6 mg L−1 chlorine concentration decreased by 5.9% and 3.0% in the 2021 season, respectively. Similar observations were reported that the chlorination scheme with a high concentration of chlorine is more likely to result in more detrimental impact on the soil [7,28]. The effects of the chlorine injected concentration and lateral length on soil enzyme activity was displayed in Table 3. The effects of chlorine concentration on the two soil enzymes activities were insignificant in both seasons. Lateral length had a greater impact on enzyme activity at various soil depths in maize growth stages than chlorine concentration. For example, lateral length had a substantial effect on urease activities at 0–40 cm depth on 23 July and 9 August in the 2021 season, whereas chlorine concentration had no significant impact on urease activities. Additionally, the ANOVA findings showed that lateral length had a greater impact on enzyme activities at more soil depths and growth stage in the 2021 season than that in the 2020 season (Table 3). For instance, in the 2020 season, lateral length only significantly affected urease activities at 0–40 cm depths during the jointing stage (30 August), whereas in the 2021 season, it significantly affected urease activities at 0–40 cm depths during the heading stage (23 July) and filling stage (9 August). These findings would suggest that as irrigation and chlorination were applied more often during the growth season, the impact of lateral length on enzyme activity increased. This is corresponding to the findings of Hao et al., who similarly showed that chlorination decreased soil enzyme activity and that the tendency of reduction grew worse as chlorination increased [7]. Similar to what we found, Yang et al. looked into the prolonged application of chemical chlorine fertilizer in a rice–wheat rotation system. They found that this altered the composition of soil microbiological community and decreased biological activities like urease, phosphatase, and catalase activity [20].
The change in soil enzyme activities within 0–40 cm depth along the lateral following the third chlorination in 2020 and 2021 are presented in Figure 4 and Figure 5. Under all conditions where chlorination injection was used, no discernible trend in soil enzyme activity was seen along the 20 m lateral. Nonetheless, in both seasons, there was a small increase in the upper layer soil (0–20 cm) enzyme activity for the L40 and L80 treatments with respect to the distance from the lateral entrance. It might be the consequence of the nonuniform chlorine content in the drip irrigation system. The residual chlorine concentration gradually decreased from the inlet as chlorine reacts with the wastewater and the pipe wall [26]. Treatment with longer lateral length generally produced lower soil urease activities. For example, the averaged 0–20 cm soil urease activities along the 80 m lateral length were 24.64% and 36.72% lower than that for L20 and L40 in the 2021 season, respectively. This agreed well with Hao et al., who concluded that the relatively higher chlorination concentration for the head of the lateral length would produce a greater negative effect [7]. This suggested that an obvious adverse effect of chlorination injection on soil enzyme activities was likely to have occurred in the area with a lateral length longer than 80 m. For a given lateral length, the CV of the soil enzyme activities showed a similar rising pattern with the chlorine injected concentration. For example, the CV values for urease activities were 0.19, 0.15, and 0.17 for C6L20, C6L40, and C6L80, respectively, while the CV values were 0.06, 0.11, and 0.11 for C2L20, C2L40, and C2L80 in the 2021 season. This also indicated that the chlorination scheme with high chlorine concentration is more likely to have more detrimental impacts on soil.
Comparing the enzyme activities after harvest with that prior to sowing, the results showed a different trend. In the 2020 season, the average urease activity at physiological maturity (31 October) was significantly lower than before sowing by 23.77%, while the alkaline phosphatase activity increased by 13.51%. At harvest in 2021, there was a 21.46% increase in alkaline phosphatase activities and a 27.75% increase in urease activities. To further highlight the effects of chlorination on enzyme activities, the average enzyme activities for each treatment at the filling stage (last chlorination) and physiological maturity in both seasons are compared in Figure 4 and Figure 5. For the 2020 season, the 0–40 cm layer soil urease and alkaline phosphatase activity at physiological maturity decreased by 19.10% and 15.47%, respectively, compared with the soil enzyme activities at the filling stage. Meanwhile, the urease and alkaline phosphatase activity at 0–40 cm increased by 12.93% and 16.84% in the 2021 season, respectively. This outcome might be explained by the precipitation from the last chlorination to harvest under our field circumstances. During the aforementioned time in 2020 and 2021, there was 0 and 117.6 mm of precipitation, respectively. Rainfall has the potential to somewhat offset the variations brought about by fertigation and water application [29,30]. Precipitation frequently causes Cl to move down to the subsurface, reducing the detrimental effect on soil enzyme activity [28,31]. Some studies have concluded that plant roots might gather and maintain beneficial microorganisms to mitigate chlorine stress [28]. The longer time between the last chlorination and the harvest date in 2021 (40 days) than that in 2020 (23 days) allowed for the recovery of the chlorine-induced decline in enzyme activity. Therefore, our study recommends that the interval between last chlorination and harvest could be extended appropriately.

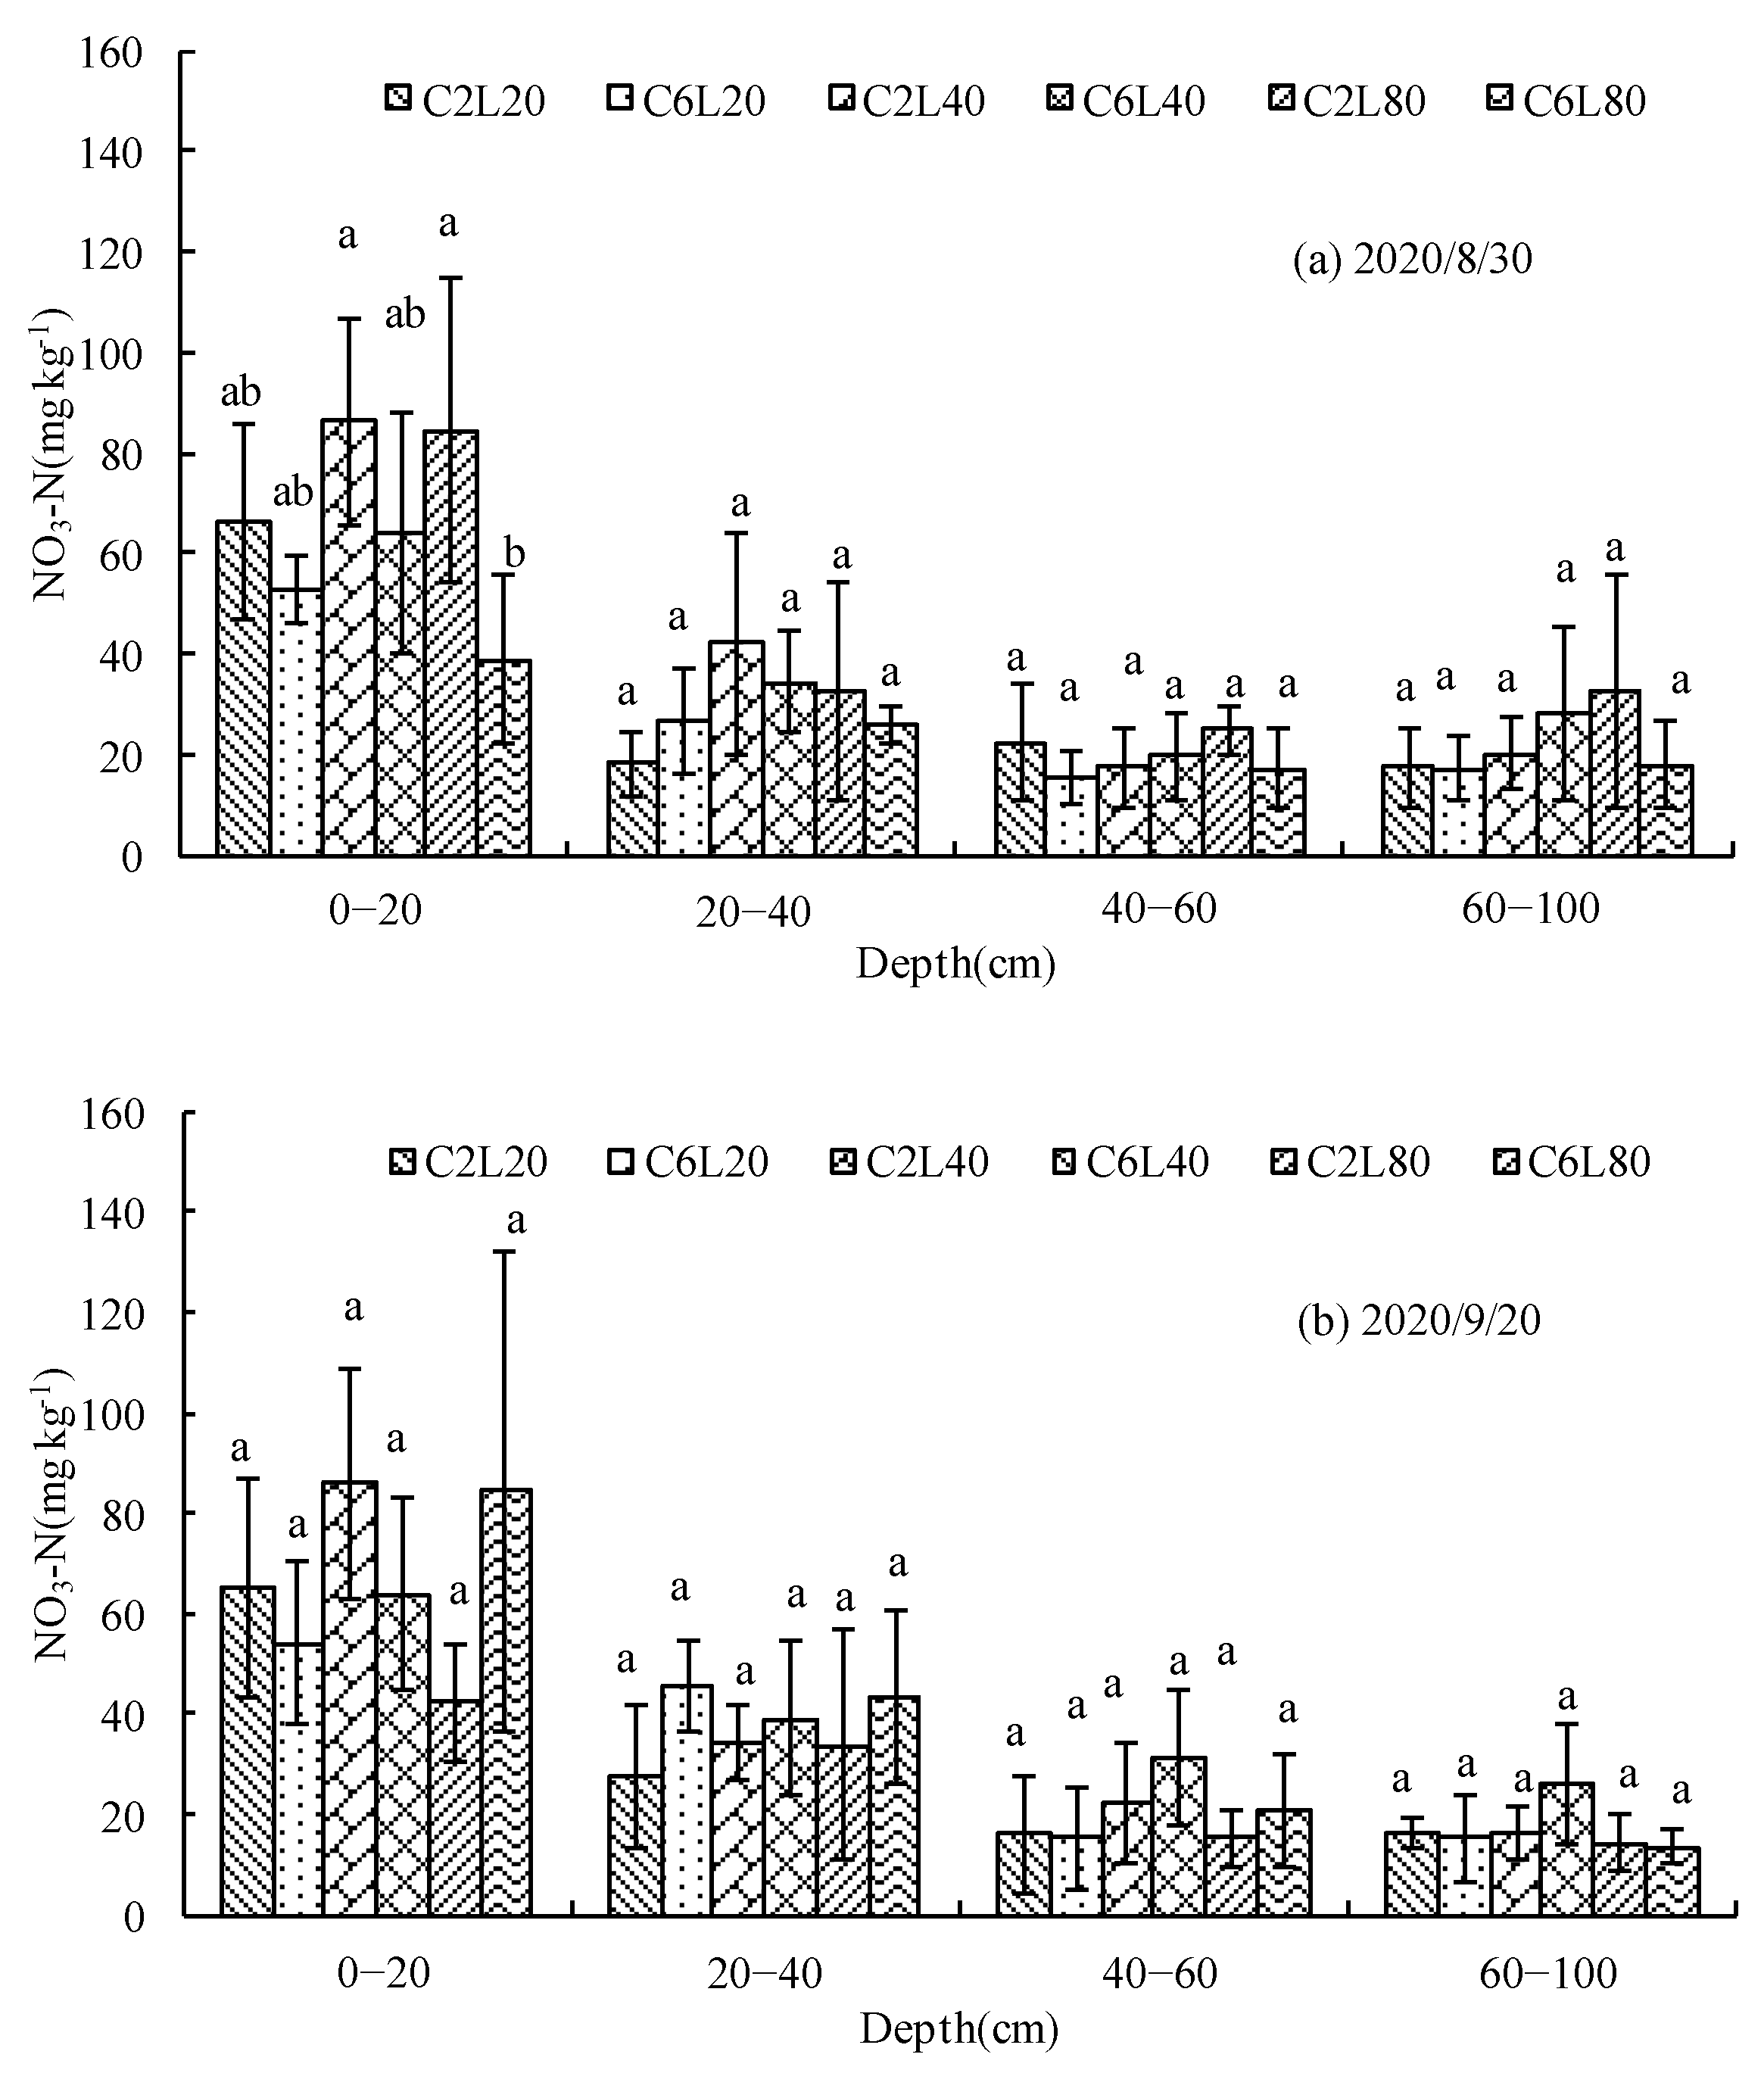
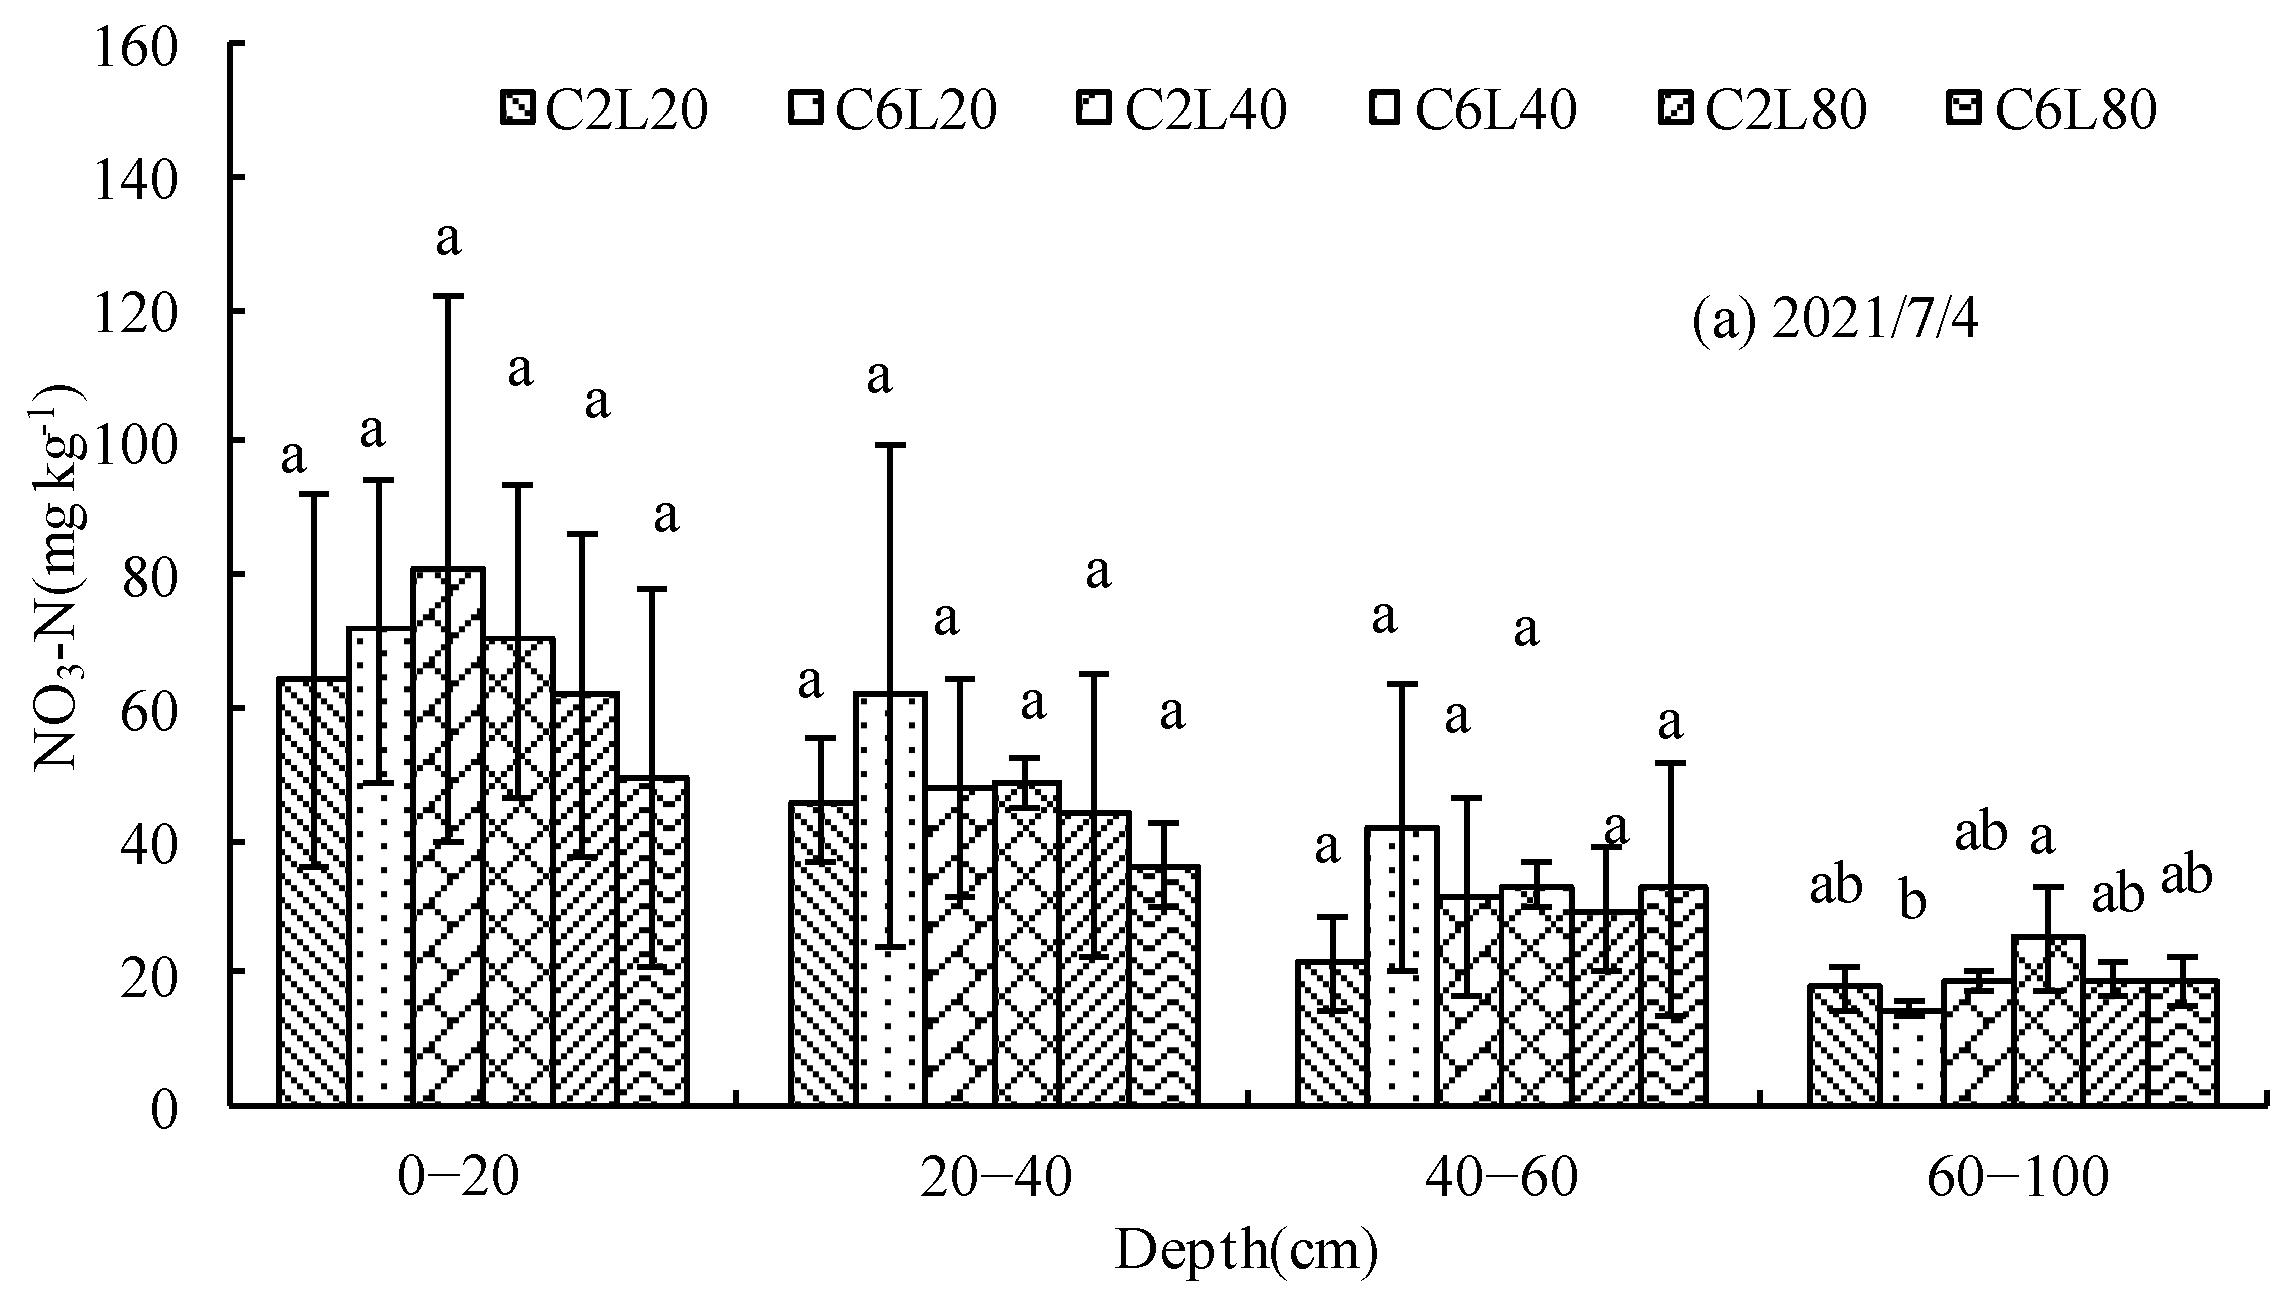
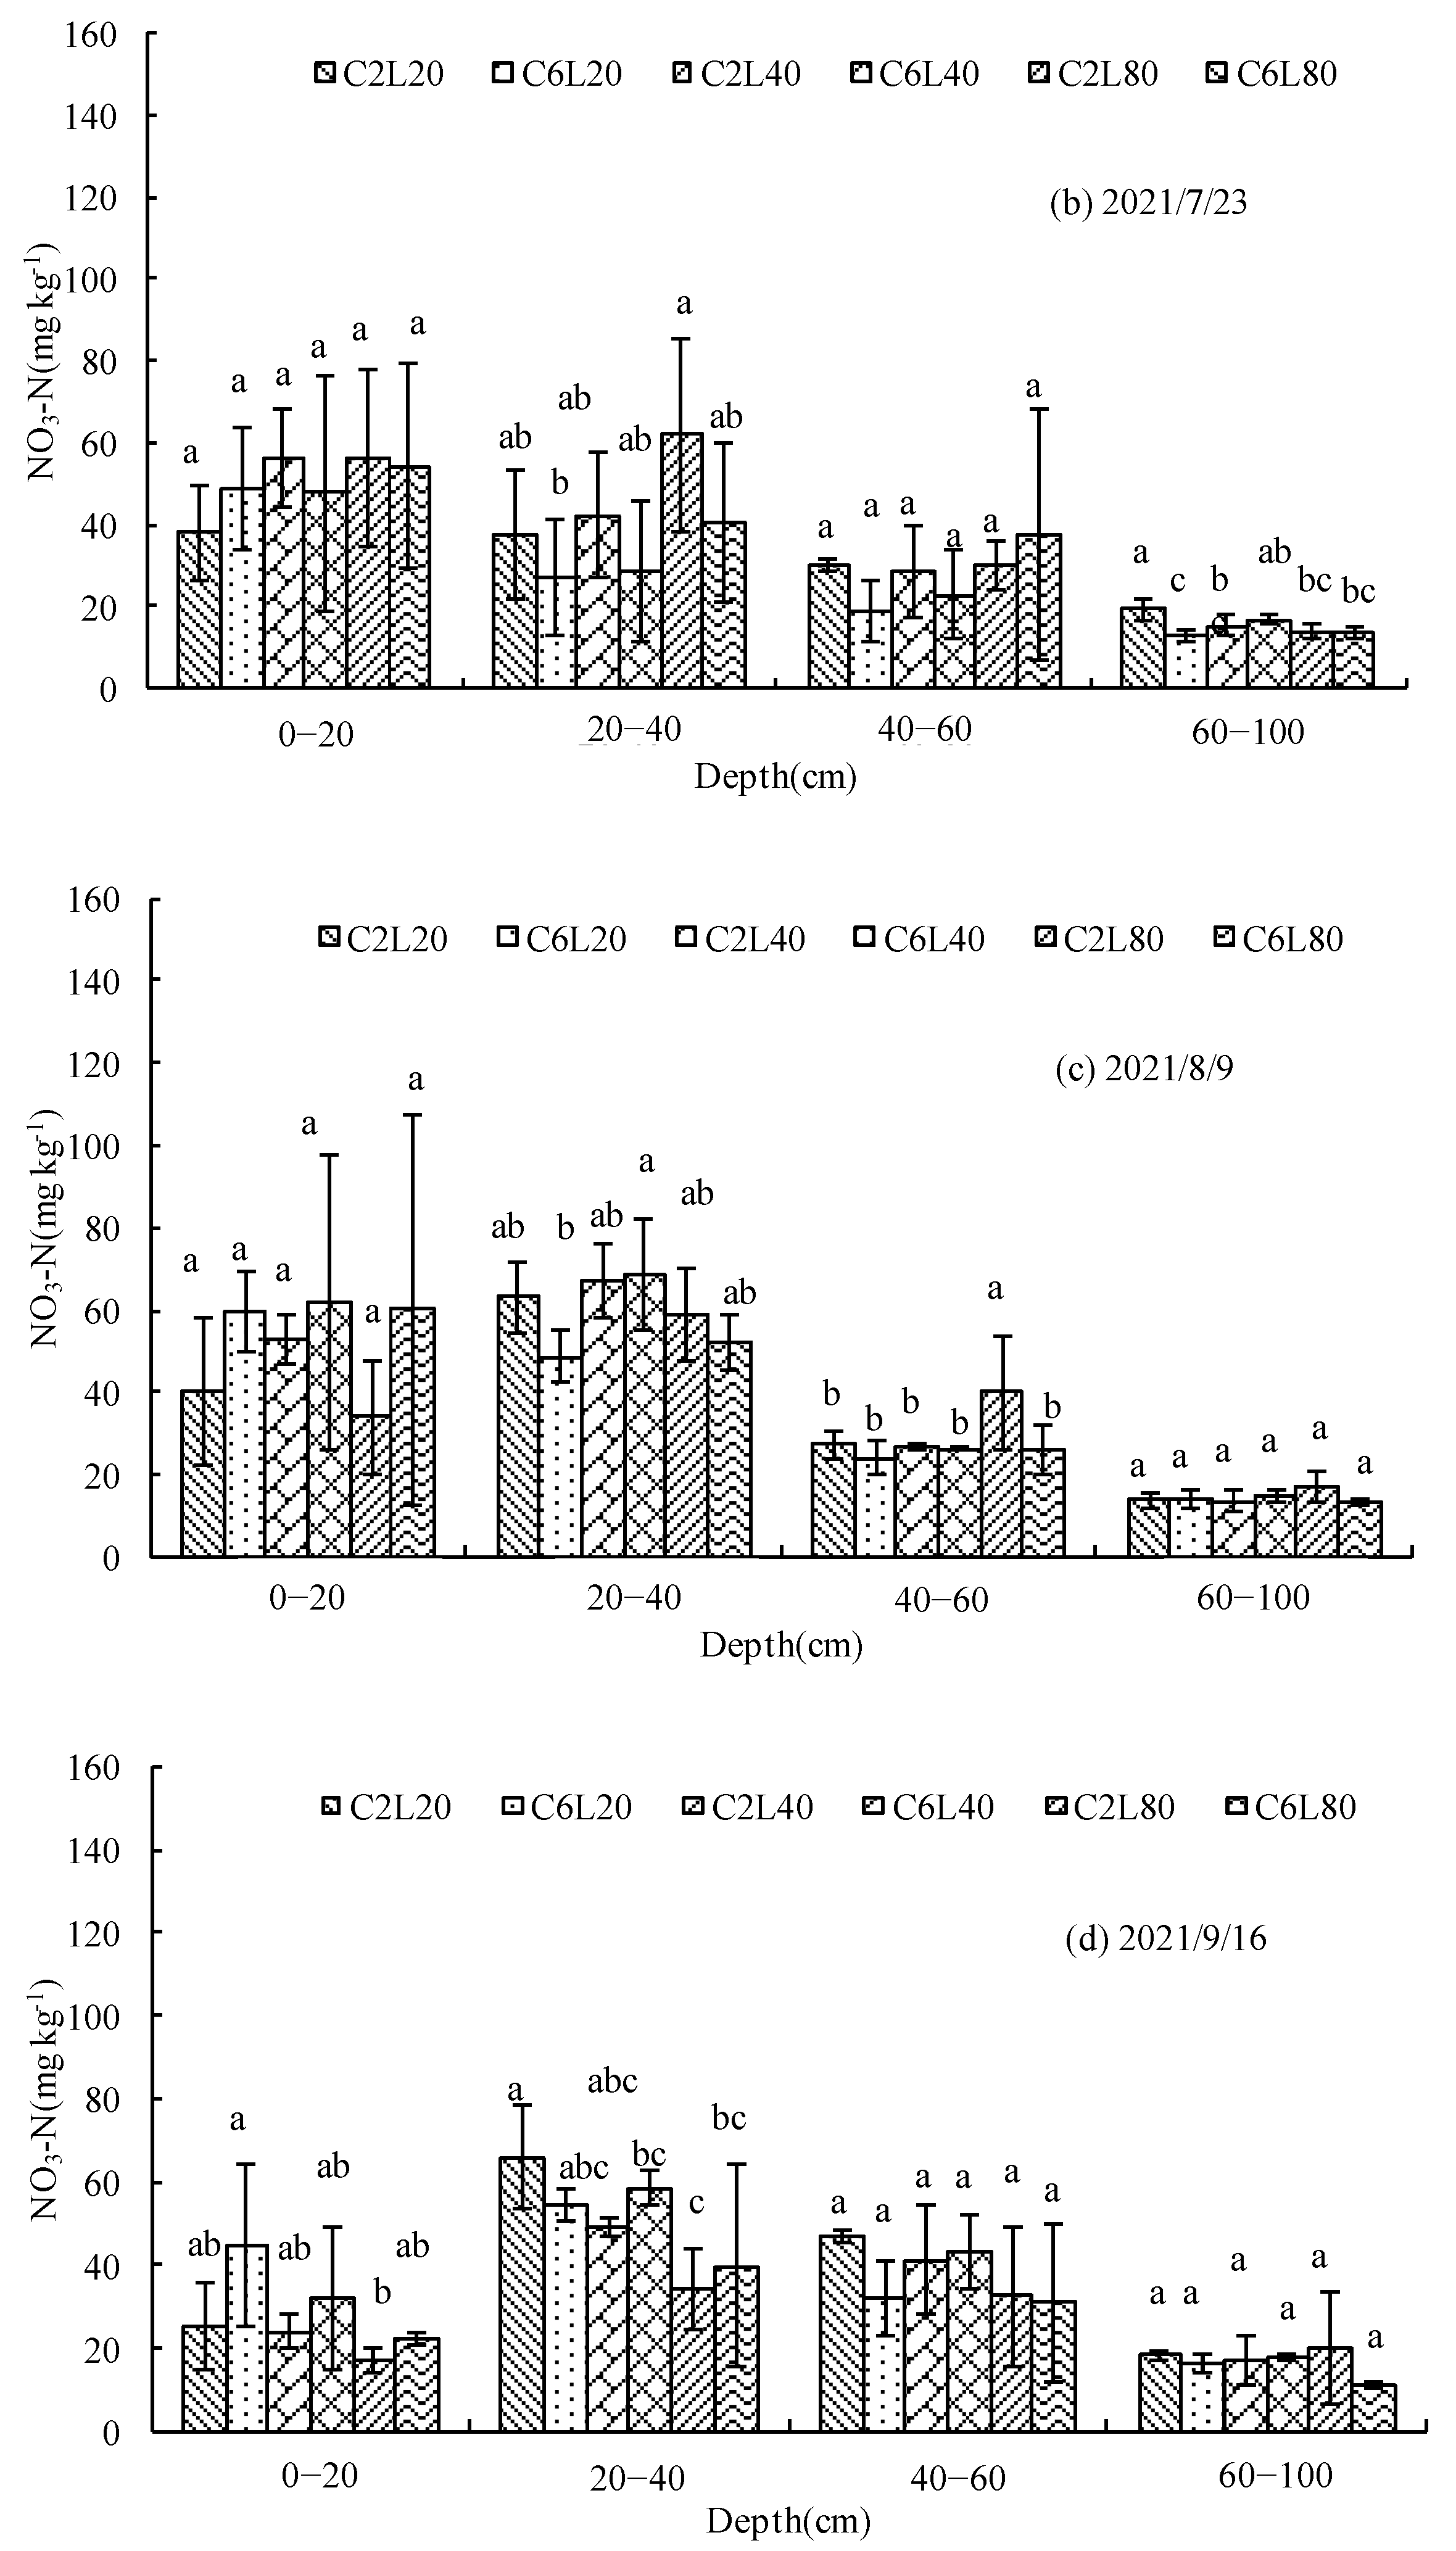
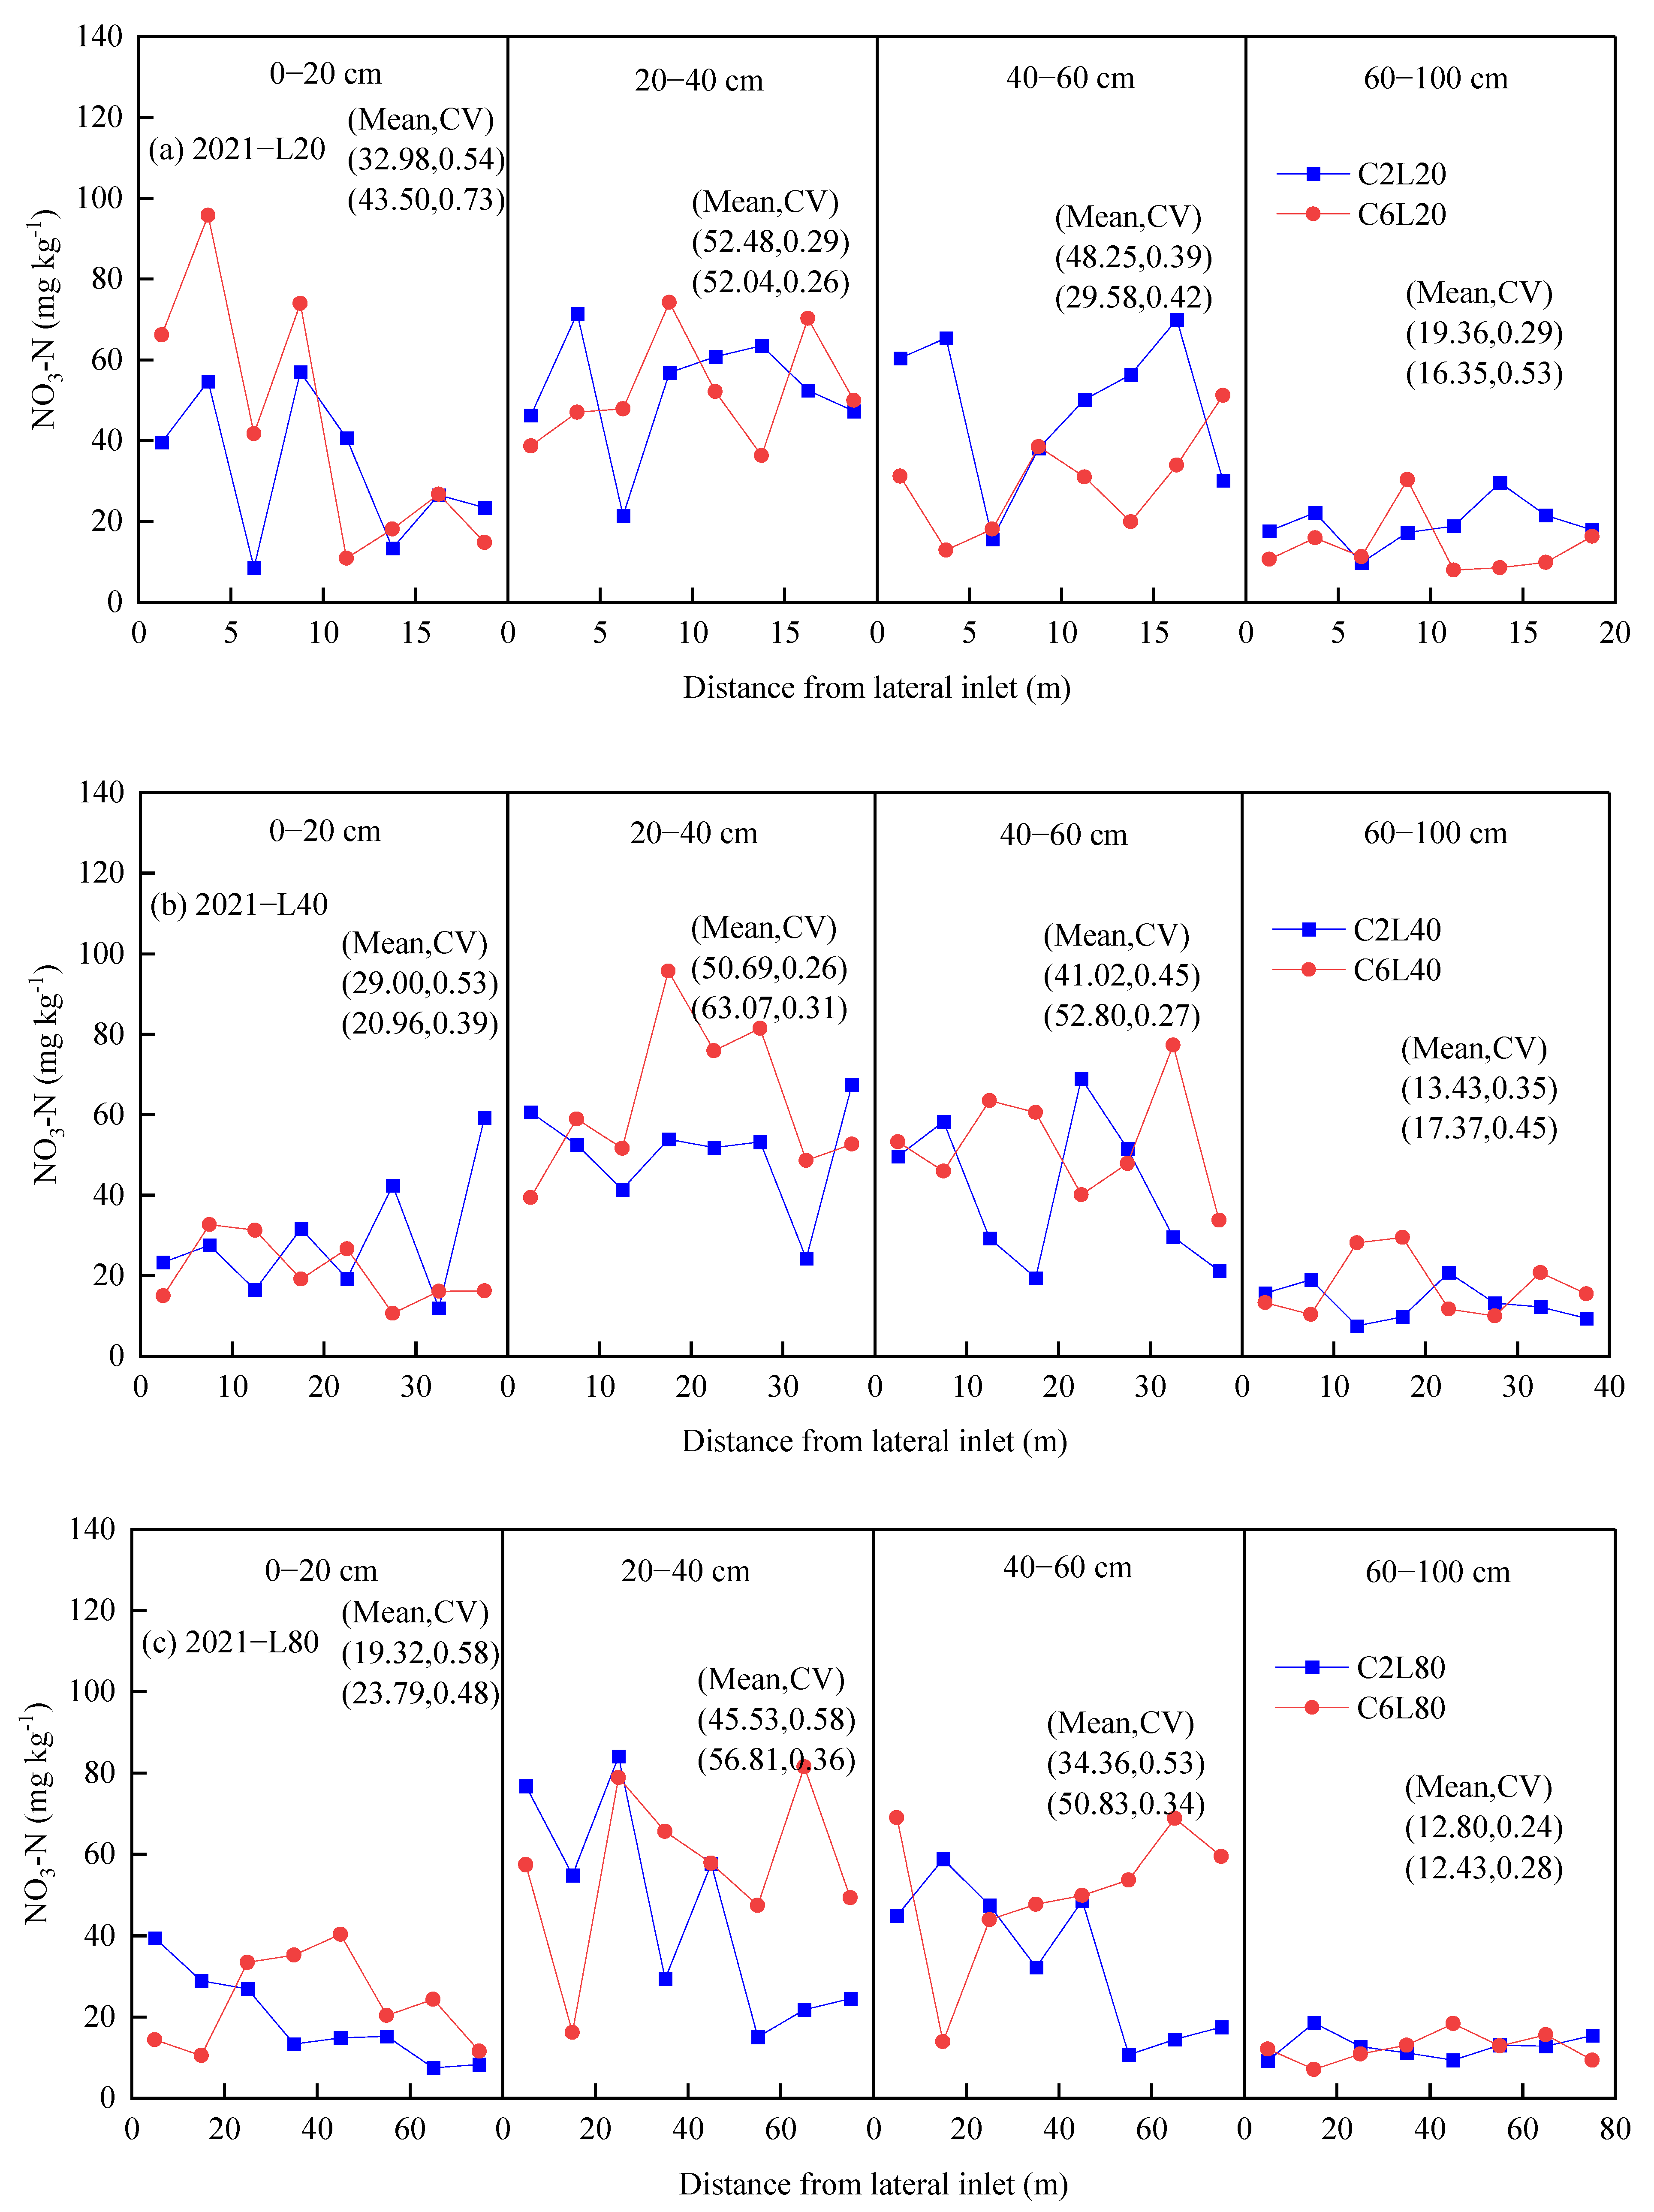
3.3. Distribution of NO3-N in Soil

The distribution of soil NO3-N in 2020 and 2021 are illustrated in Figure 6 and Figure 7. In the 2020 season, the NO3-N content for 0–20 cm and 20–40 cm at physiological maturity were much greater than that before planting by 97.40% and 110.90%, respectively. Contrary to the results of the 2020 experiment, the NO3-N content for 0–20 cm at physiological maturity was lower than that prior to sowing by 48.40% while the NO3-N contents for 20–40 cm and 40–60 cm were increased by 38.96% and 73.02% in 2021. Precipitation during the crop growth period should be taken into account when determining optimal chlorination regimes, as precipitation can somewhat offset the detrimental effects of chlorine on soil fertility and crop growth [7]. The quantity of full irrigation accounted for 24% (2020) and 48% (2021) of the seasonal precipitation in our tests. The result may have been caused by the significantly higher rainfall than irrigation amount during the two seasons. The nonuniformly distributed precipitation in the maize growing season may be another reason for the results. During the 2020 season, the rainfall events occurred mainly in the early growth stage (10 July to 28 August) with a total of 287.5 mm. Fertilization during the growth period (conducted on 28 August, 17 September, and 8 October) not only satisfied the NO3-N absorption by maize roots, but also supplemented NO3-N content in soil to a certain extent. In contrast to 2020 experiments, the rainfall events occurred mainly in the later growth stage (18 August to 17 September) with a total of 117.6 mm in 2021. Since NO3-N was generally unreactive in the soil and was prone to movement with water, high precipitation frequently caused NO3-N to leak from the topsoil [30]. The substantial variation in the NO3-N content in the 0–20 cm layer on 30 August and in the 20–40 cm soil layer on 11 October in the 2020 season was further validated with the LSD test (Figure 6). Moreover, the LSD test revealed a strong relationship between the chlorination and lateral length and the NO3-N content in the 20–40 cm depth on 23 July and 9 August in the 2021 season (Figure 7).
It can be seen that a larger chlorine concentration considerably increased NO3-N content in soil. The range of NO3-N content increases was strengthened as chlorination and fertigation was applied progressively during the growing season. For example, in the 2020 season, the NO3-N content in the 0–20 cm layer on 30 August (sample after first chlorination) was 79.12 and 52.02 mg kg−1 for the chlorination treatment with 2 mg L−1 and 6 mg L−1, respectively. However, the NO3-N content for the chlorination treatment with 6 mg L−1 was 42.42% higher than the chlorination treatment with 2 mg L−1 on October 11 (sample after third chlorine injection). According to the results of the ANOVA, injected chlorine concentration had a statistically significant impact on NO3-N content in the 0–20 cm layer during the 2020 season, while the chlorine concentration had an insignificant influence on NO3-N content at different soil depths in 2021 (Table 4). Chlorination reduced urease, catalase, and phosphatase activities, and prevented the soil from converting and absorbing nutrients [8,28]. The results also coincide with the findings of Li and Li’s earlier investigation, which indicated that chlorination increased nitrate accumulation in the upper soil layer [9].
The variation of soil NO3-N content in the 0–100 cm layer along the lateral at physiological maturity in the 2020 and 2021 seasons are presented in Figure 8 and Figure 9. During both seasons, shallow-soil (0–40 cm) NO3-N content decreased with increasing distance from the lateral entrance for most treatments. This finding might mostly be explained by the nonuniform chlorine concentration in the lateral. A similar occurrence was reported by Hao et al.; the relatively large residual chlorine concentration at the head of the pipe network inhibited crop nitrogen uptake, inducing soil nitrogen accumulation [7]. During the growing seasons, a higher residual chlorine concentration produced a larger CV value for the upper-layer soil NO3-N content along the lateral. For example, the CV values were 0.30 and 0.54 for the 0–20 cm layer soil NO3-N content for treatment with 2 mg L−1 residual chlorine concentration in 2020 and 2021, respectively, while the CV values were 0.37 and 0.73 for treatment with 6 mg L−1 residual chlorine concentration. This agreed well with Wang et al., who reported that the system with a longer length of lateral caused a larger fluctuation of the residual chlorine concentration under a given injected chlorination concentration [26]. The ANOVA results of the effect of chlorine concentration and lateral length on soil NO3-N content at varying depths in 2020 and 2021 are presented in Table 4. For both seasons, the influence of lateral length on soil NO3-N content was insignificant.

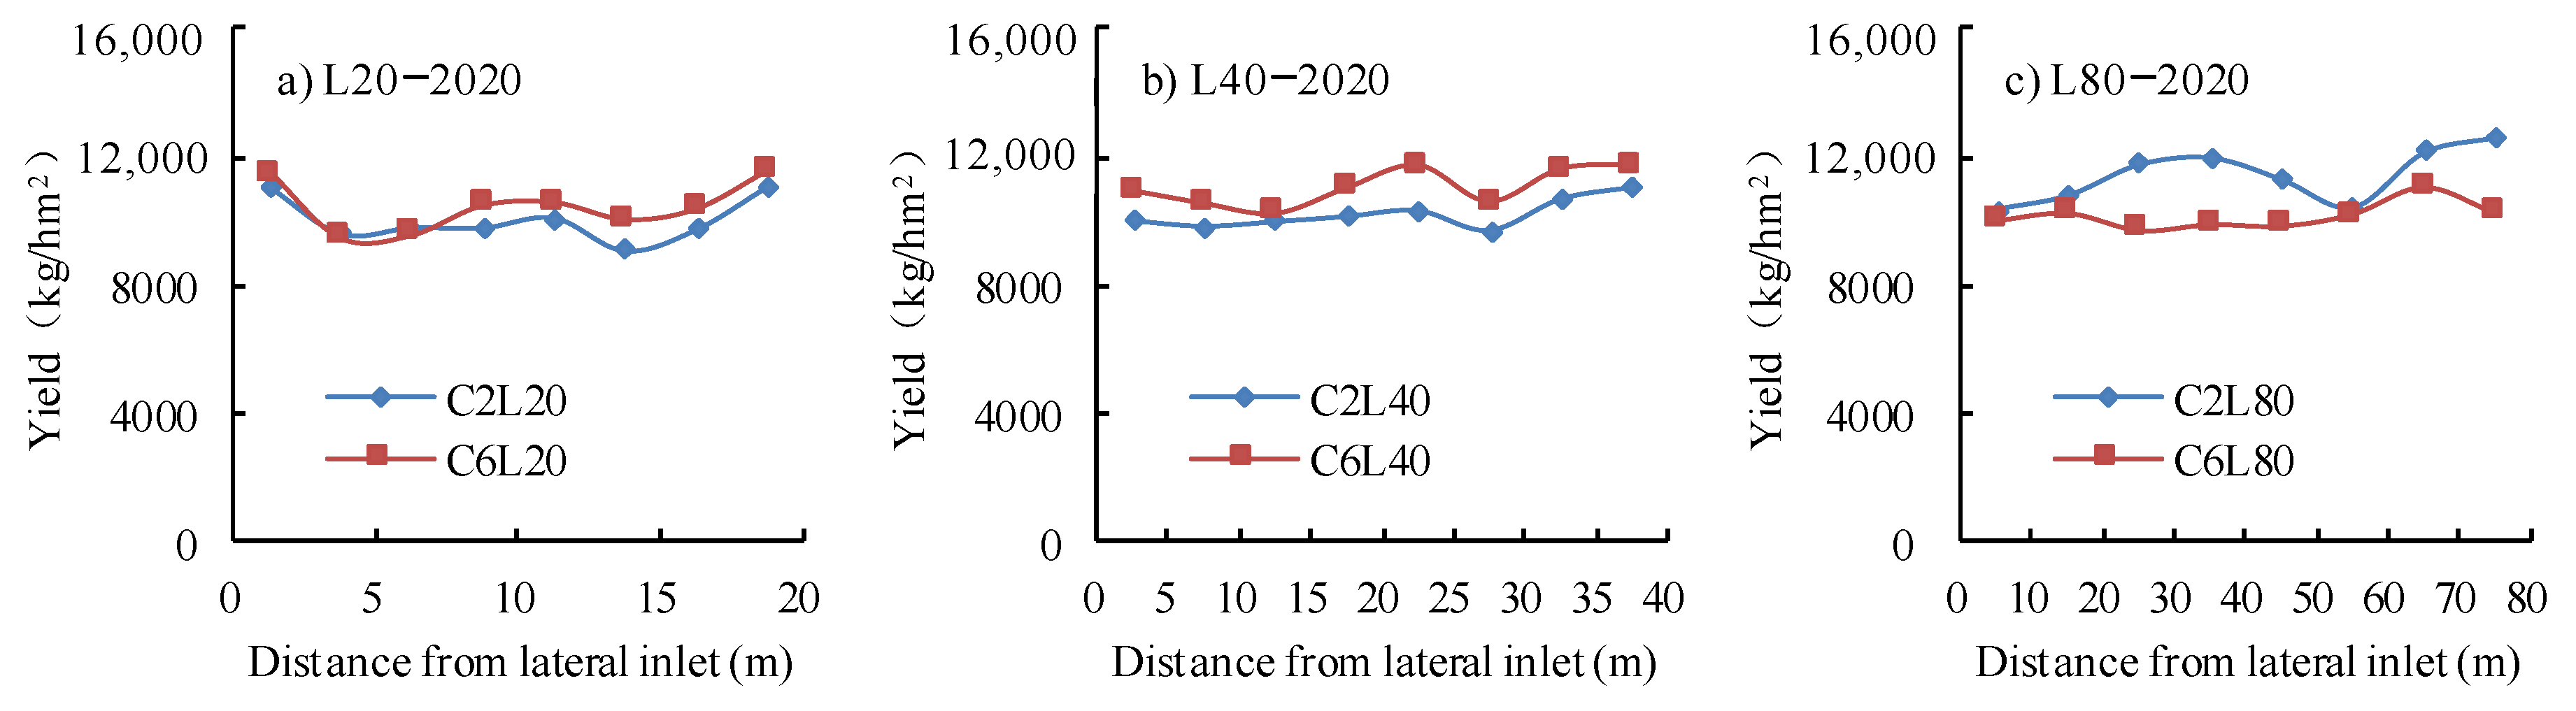
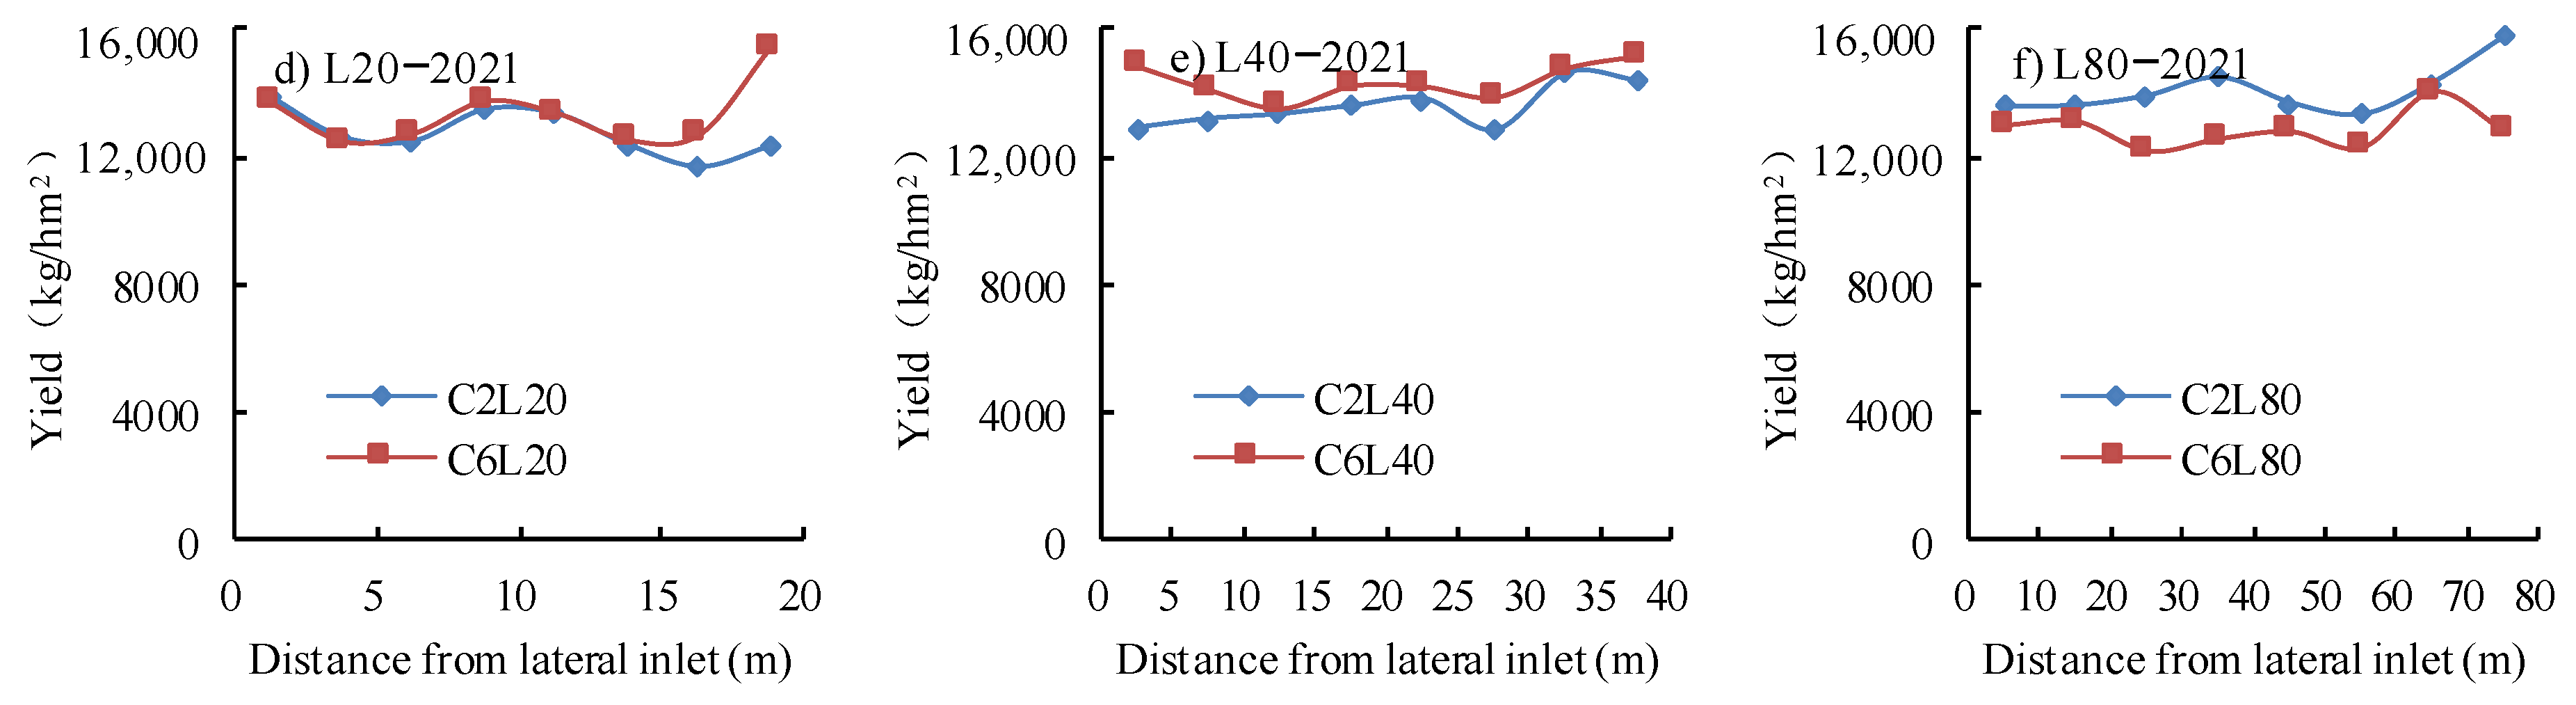
3.4. Nitrogen Uptake and Yield

The aboveground plant biomass, maize nitrogen uptake, and yield at maturity period are presented in Table 5 and Table 6. In both seasons, the nitrogen uptake and aboveground plant biomass were not significantly impacted by the concentration of chlorine or the length of the lateral. A larger chlorine injected concentration generally produced a smaller plant biomass and nitrogen uptake. For instance, the plant biomass and maize nitrogen uptake for treatments with 6 mg L−1 chlorine concentration were 2.1% and 3.6% lower than that for treatments with 2 mg L−1 in 2020, respectively. Generally, the nitrogen uptake and aboveground plant biomass increases first, then decreases with increasing lateral length. For example, the average nitrogen uptake was 243.7 kg ha−1 for L40 in 2021, which was 15.9% and 12.5% higher than that for L20 and L40. The ANOVA result indicates that the impact of chlorine dose and lateral length on the activity of the two enzymes was insignificant in both seasons.
The maize yield and yield determinants for both seasons are also summarized in Table 5 and Table 6. The maize yield ranged from 10,020.8 to 11,406.2 kg ha−1 and from 12,733.7 to 14,353.7 kg ha−1 in 2020 and 2021, respectively. The influence of chlorination concentration on the maize yield varied with lateral length in both seasons. For the L20 and L40 treatments, there was no discernible declining trend in yield with injections of chlorine content for both seasons. For instance, the average yield of 10,020.8 and 10,445.6 kg ha−1 was observed for the C2L20 and C6L20 in 2020, respectively, while the yields were 12,733.7 and 13,343.6 kg ha−1 in 2021. For the L80 treatment, however, a higher chlorine concentration caused a substantial decrease in yield. The yield of C6L80 was 11.1% and 8.6% lower than that of C2L80 in the 2020 and 2021 seasons, respectively (Table 5 and Table 6). According to the ANOVA, there was an insignificant impact of the chlorine concentration on both the yield and yield determinants during the two seasons. Li et al. observed similar outcomes and concluded that chlorination impeded the transformation process and soil nitrogen accumulation, decreasing nutrient uptake and tomato production [21]. Comparing the treatments with different lateral length, the yield of maize peaked at L80 with 2 mg L−1 chlorine concentration, whereas the yield peaked at L40 with 6 mg L−1 chlorine concentration. However, excessive chlorination may occur in the front of drip irrigation systems with long lateral length and high chlorine concentration, resulting in deterioration of the soil environment in some areas and a decrease in yield [26]. According to earlier research, plant damage increased with increasing residual chlorine levels [7,8,28]. Additionally, Lonigro et al. reported that lettuces irrigated with chlorine disinfectant water displayed typical stress symptoms, including lower crop yield, chlorosis, and leaf necrosis, particularly when the concentration of free chlorine exceeded 10.0 mg L−1 [32]. It can be seen that lateral length significant affected ear barren tip and kernel number per cob in the 2020 season, while lateral length had an insignificant statistical effect on maize yield and yield determinants in 2021 (Table 5 and Table 6). Although the effect of lateral length on the maize yield was insignificant (α = 0.05) in both seasons, the P value was lower than that of chlorine concentration, which indicated that lateral length had a more important influence on maize yield and yield determinants.
Average maize yield for all the treatments along the lateral is shown in Figure 10. The yield distribution coincided with soil urease and alkaline phosphatase activities along the lateral. For the L20 and L40 treatments, a slightly increasing yield along the lateral could probably be attributed to the uneven chlorination concentration. For the L80 treatments, however, the maize yield trended downward with distance from the lateral intake in both years. The lower nitrogen applied along the lateral could not fulfill the nitrogen requirements for maize growth, thus compensating to some extent for the differences resulting from the chlorination application. When the lateral length surpasses 80 m, the applied nitrogen and cumulative irrigation may become the primary factors influencing the yield [23]. This agreed well with Hao [33], who reported that a fluctuating increase in corn yield with the decrease in residual chlorine concentration along the lateral length.

4. Conclusions

In a semi-humid area of the North China Plain, a two-year field study was conducted to examine the effects of lateral length and chlorine injected dose on soil nitrogen, enzyme activity, and maize production. The research findings corroborated the subsequent conclusions:
(1) Chlorine concentration had an insignificant effect on soil enzyme and NO3-N content; however, the soil enzyme activities were notably influenced by lateral length. A greater lateral length resulted in noticeably lower soil enzyme activities along the lateral length, especially in the top soil layer. Chlorination inhibited maize nitrogen uptake and considerably increased NO3-N content in the soil. Generally, a higher residual chlorine concentration produced a larger CV value for the upper layer soil NO3-N content along the lateral length;
(2) The difference in maize yield between the different chlorine concentrations and lateral length was not statistically significant. The yield of maize peaked at L80 with 2 mg/L chlorine concentration, while maize yield peaked at L40 with 6 mg/L chlorine concentration. Long lateral length and high chlorine concentration mode is more likely to produce greater detrimental impacts on the soil and plants. In consideration of maize yield and minimizing the potential negative effect on the soil environment, the chlorination schemes with a dripline length of 80 m and a chlorine concentration of 2 mg L−1 are recommended.

Author Contributions

F.H.: Conceptualization, Formal analysis, Data curation, Writing-original draft preparation. Z.W.: Supervision, Writing-review and editing, Project administration. Z.Z.: Methodology, Literature search, Funding acquisition. All authors have read and agreed to the published version of the manuscript.

Funding

This study was financially supported by the Science and Technology Innovation Project of colleges and universities in Shanxi Province (grant no. 2021L126), the scientific research project of Shanxi Province Outstanding Doctor Work Award Fund (grant no. SXYBKY2018029), the science and technology Innovation Fund project of Shanxi Agricultural University (grant no. 2018YJ40), and the Shanxi Water Conservancy Science and Technology Research and Promotion Project (grant no. 2023GM40).

Data Availability Statement

The original contributions presented in the study are included in the article, and further inquiries can be directed to the corresponding author.

Conflicts of Interest

The authors declare no conflicts of interest.

References

  1. Seleiman, M.F.; Alotaibi, M.A.; Alhammad, B.A.; Alharbi, B.M.; Refay, Y.; Badawy, S.A. Effects of ZnO nanoparticles and biochar of rice straw and cow manure on characteristics of contaminated soil and sunflower productivity, oil quality, and heavy metals uptake. Agronomy 2020, 10, 790. [Google Scholar] [CrossRef]
  2. Singh, A. Soil salinization management for sustainable development: A review. J. Environ. Manag. 2021, 277, 111383. [Google Scholar] [CrossRef] [PubMed]
  3. Wang, M.; Chen, S.B.; Chen, L.; Wang, D.; Zhao, C.M. The responses of a soil bacterial community under saline stress are associated with Cd availability in long-term wastewater-irrigated field soil. Chemosphere 2019, 236, 124372. [Google Scholar] [CrossRef] [PubMed]
  4. Lequette, K.; Ait-Mouheb, N.; Adam, N.; Muffat-Jeandet, M.; Bru-Adan, A.; Wéry, N. Effects of the chlorination and pressure flushing of drippers fed by reclaimed wastewater on biofouling. Sci. Total Environ. 2021, 758, 143598. [Google Scholar] [CrossRef]
  5. Li, J.S.; Chen, L.; Li, Y.F.; Yin, J.F.; Zhang, H. Effects of chlorination schemes on clogging in drip emitters during applications of sewage effluent. Appl. Eng. Agric. 2010, 26, 565–578. [Google Scholar] [CrossRef]
  6. Dehghanisanij, H.; Yamamoto, T.; Ahmad, B.O.; Fujiyama, H.; Miyamoto, K. The effects of chlorine on emitter clogging induced by algae and protozoa and the performance of drip irrigation. Trans. ASAE 2005, 48, 519–527. [Google Scholar] [CrossRef]
  7. Hao, F.Z.; Li, J.S.; Wang, Z.; Li, Y.F. Influence of chlorine injection on soil enzyme activities and maize growth under drip irrigation with secondary sewage effluent. Irrig. Sci. 2018, 36, 363–379. [Google Scholar] [CrossRef]
  8. Li, Y.F.; Li, J.S.; Zhang, H. Effects of chlorination on soil chemical properties and nitrogen uptake for tomato drip irrigated with secondary sewage effluent. J. Integr. Agr. 2014, 13, 2049–2060. [Google Scholar] [CrossRef]
  9. Li, Y.F.; Li, J.S. Effect of chlorination on yield and nitrogen uptake of tomato and emitter clogging in a drip irrigation system with sewage effluent. Trans. CSAE 2010, 26, 18–24, (In Chinese with English Abstract). [Google Scholar]
  10. Ebrahimizadeh, M.A.; Amiri, M.J.; Eslamian, S.S. The effects of different water qualities and irrigation methods on soil chemical properties. Res. J. Environ. Sci. 2009, 3, 497–503. [Google Scholar]
  11. Lu, J.; Guo, J. Disinfection spreads antimicrobial resistance. Science 2021, 371, 474. [Google Scholar] [CrossRef] [PubMed]
  12. Agnelo, L.; Leonel, L.P.; Silva, N.B.; Candello, F.P.; Schneider, J.; Tonetti, A.L. Effects of wastewater disinfectants on the soil: Implications for soil microbial and chemical attributes. Sci. Total Environ. 2020, 706, 136007. [Google Scholar] [CrossRef]
  13. Adetunji, A.T.; Lewu, F.B.; Mulidzi, R.; Ncube, B. The biological activities of β-glucosidase, phosphatase and urease as soil quality indicators: A review. J. Soil Sci. Plant Nut. 2017, 17, 794–807. [Google Scholar] [CrossRef]
  14. Carrow, R.N.; Duncan, R.R.; Huck, M.T. Turfgrass and Landscape Irrigation Water Quality: Assessment and Management; CRC Press: Boca Raton, FL, USA, 2008. [Google Scholar]
  15. Qiu, Z.J.; Li, J.S.; Zhao, W.X. Effect of applying sewage effluent with subsurface drip irrigation on soil enzyme activities during the maize growing season. Irrig. Drain. 2017, 66, 723–737. [Google Scholar] [CrossRef]
  16. Zhang, Q.M.; Zhu, L.S.; Wang, J.; Xie, H.; Wang, J.H.; Wang, F.H.; Sun, F.X. Effects of fomesafen on soil enzyme activity, microbial population, and bacterial community composition. Environ. Monit. Assess. 2014, 186, 2801–2812. [Google Scholar] [CrossRef]
  17. Chu, W.; Fang, C.; Deng, Y.; Xu, Z. Intensified disinfection amid COVID-19 pandemic poses potential risks to water quality and safety. Environ. Sci. Technol. 2021, 55, 4084–4086. [Google Scholar] [CrossRef]
  18. Zhang, Z.Y.; Zhang, Q.; Lu, T.; Zhang, J.Y.; Sun, L.W.; Hu, B.L.; Hu, J.; Peñuelas, J.; Zhu, L.Z.; Qian, H.F. Residual chlorine disrupts the microbial communities and spreads antibiotic resistance in freshwater. J. Hazard. Mater. 2021, 423, 127152. [Google Scholar] [CrossRef] [PubMed]
  19. Ma, G.R.; Chen, M.C.; Li, C.J.; Shi, W.Y.; Feng, Q.B. Effects of Cl- on transformation of nitrogenous fertilizers, microbes and enzyme activities in soil. J. Zhejiang Agric. Univ. 1993, 19, 437–440. [Google Scholar]
  20. Yang, L.S.; Zhang, Y.T.; Huang, X.C.; Zhang, Y.Q.; Zhao, Y.N.; Shi, X.J. Effects of long-term application of chloride containing fertilizers on the biological fertility of purple soil under a rice-wheat rotation system. Sci. Agric. Sin. 2016, 49, 686–694. [Google Scholar]
  21. Li, J.S.; Li, Y.F.; Zhang, H. Tomato yield and quality and emitter clogging as effected by chlorination schemes of drip irrigation systems applying sewage effluent. J. Integr. Agric. 2012, 11, 1744–1754. [Google Scholar] [CrossRef]
  22. Truchado, P.; Gil, M.I.; Suslow, T.; Allende, A. Impact of chlorine dioxide disinfection of irrigation water on the epiphytic bacterial community of baby spinach and underlying soil. PLoS ONE 2018, 13, e0199291. [Google Scholar] [CrossRef] [PubMed]
  23. Lin, X.M.; Wang, Z.; Li, J.S. Identifying the factors dominating the spatial distribution of water and salt in soil and cotton yield under arid environments of drip irrigation with different lateral lengths. Agr. Water Manag. 2021, 250, 106834. [Google Scholar] [CrossRef]
  24. Shirazi, M.A.; Boersma, L. A unifying quantitative analysis of soil texture. Soil Sci. Soc. Am. J. 1984, 48, 142–147. [Google Scholar] [CrossRef]
  25. Guan, S.Y. Soil enzyme and Its Research Methods; Beijing Agriculture Press: Beijing, China, 1986. (In Chinese) [Google Scholar]
  26. Wang, Z.; Hao, F.Z.; Li, J.S.; Li, Y.F. Modeling of the residual chlorine distribution in drip irrigation system applying reclaimed water based on EPANET. T. Chin. Soc. Agric. Eng. 2020, 36, 99–106, (In Chinese with English Abstract). [Google Scholar]
  27. Hua, F.; West, J.R.; Barker, R.A.; Forster, C.F. Modelling of chlorine decay in municipal water supplies. Water Res. 1999, 33, 2735–2746. [Google Scholar] [CrossRef]
  28. Song, P.; Feng, G.; Brooks, J.; Zhou, B.; Zhou, H.X.; Zhao, Z.R.; Li, Y.K. Environmental risk of chlorine-controlled clogging in drip irrigation system using reclaimed water: The perspective of soil health. J. Clean. Prod. 2019, 232, 1452–1464. [Google Scholar] [CrossRef]
  29. Van Donk, S.J.; Petersen, J.L.; Davison, D.R. Effect of amount and timing of subsurface drip irrigation on corn yield. Irrig. Sci. 2013, 31, 599–609. [Google Scholar] [CrossRef]
  30. Wang, Z.; Li, J.S.; Li, Y.F. Effect of drip irrigation system uniformity and nitrogen applied on deep percolation and nitrate leaching during growing seasons of spring maize in semi-humid region. Irrig. Sci. 2014, 32, 221–236. [Google Scholar] [CrossRef]
  31. Chen, W.R.; He, Z.L.; Yang, X.E.; Mishra, S.; Stoffella, P.J. Chlorine nutrition of higher plants: Progress and perspectives. J. Plant Nutr. 2010, 33, 943–952. [Google Scholar] [CrossRef]
  32. Lonigro, A.; Montemurro, N.; Laera, G. Effects of residual disinfectant on soil and lettuce crop irrigated with chlorinated water. Sci. Total Environ. 2017, 584–585, 595–602. [Google Scholar] [CrossRef]
  33. Hao, F.Z. Effects of Chemical Injection on Emitter Clogging and Soil-Plant System under Drip Irrigation Applying Sewage Effluent; China Institute of Water Resources and Hydropower Research: Beijing, China, 2018. [Google Scholar]
Figure 1. Variations of water ages and residual chlorine concentrations along laterals with different chlorination concentrations.
Agronomy 14 01538 g001
Figure 2. Soil alkaline phosphatase activities along the lateral in 2020.
Agronomy 14 01538 g002aAgronomy 14 01538 g002b
Figure 3. Soil alkaline phosphatase activities along the lateral in 2021.
Agronomy 14 01538 g003aAgronomy 14 01538 g003b
Figure 4. Soil urease and alkaline phosphatase activities at various stages during the growing period in 2020. Note: The error bar represents one standard deviation (sample number = 3). Different letters indicate significant differences among treatments (p < 0.05).
Agronomy 14 01538 g004aAgronomy 14 01538 g004b
Figure 5. Soil urease and alkaline phosphatase activities at various stages during growing period in 2021. Note: The error bar represents one standard deviation (sample number = 3). Different letters indicate significant differences among treatments (p < 0.05).
Agronomy 14 01538 g005aAgronomy 14 01538 g005b
Figure 6. Soil NO3-N content for each treatment in 2020. The error bar represents one standard deviation (sample number = 3). Different letters indicate significant differences among treatments (p <0.05).
Agronomy 14 01538 g006aAgronomy 14 01538 g006b
Figure 7. Soil NO3-N content for each treatment in 2021. The error bar represents one standard deviation (sample number = 3). Different letters indicate significant differences among treatments (p < 0.05).
Agronomy 14 01538 g007aAgronomy 14 01538 g007b
Figure 8. Soil NO3-N content along the lateral in the 2020 season.
Agronomy 14 01538 g008
Figure 9. Soil NO3-N content along the lateral in the 2021 season.
Agronomy 14 01538 g009
Figure 10. Average maize yield along the lateral in the 2020 and 2021 seasons.
Agronomy 14 01538 g010aAgronomy 14 01538 g010b
Table 1. The schedule for irrigation, chlorination, and fertigation for the growing season of 2020 and 2021.
Number of Irrigation, Fertigation and Chlorination2020 2021 Fertilizer Applied (kg ha−1)
DateIrrigation (mm)ChlorinationDateIrrigation (mm)ChlorinationN
128-Aug.16.51-Jul.3060
217-Sep.3019-Jul.3060
38-Oct.23.87-Aug.3060
Total 70.3 90 180
Note: “√” represents chlorination operation.
Table 2. Wastewater physical and biochemical characteristics for 2020 and 2021 irrigation seasons.
ParameterUnitDuring Irrigation Season of 2020During Irrigation Season of 2021
AverageStandard DeviationAverageStandard Deviation
Chemical oxygen demandmg L−1449.1317.8592.9704.6
Total nitrogenmg L−122.25.018.22.2
Total phosphorousmg L−10.330.10.320.04
NO3-Nmg L−15.12.75.72.8
NH4-Nmg L−14.93.99.61.8
Table 3. Variance analysis of soil alkaline phosphatase and urease for treatments in 2020 and 2021.
LayerSource2020 2021
30 Aug.20 Sep.11 Oct.31 Oct.4 Jul.23 Jul.9 Aug.16 Sep.
Urease
0–20 cmChlorine concentrationNS (p = 0.851)NS (p = 0.088)NS (p = 0.606)NS (p = 0.816)NS (p = 0.691)NS (p = 0.807)NS (p = 0.398)NS (p = 0.419)
Lateral length**
(p = 0.006)
NS (p = 0.263)NS (p = 0.378)* (p = 0.046)NS (p = 0.408)** (p = 0.001)** (p = 0.009)NS (p = 0.156)
C×LNS (p = 0.097)NS (p = 0.096)NS (p = 0.948)NS (p = 0.691)NS (p = 0.609)NS (p = 0.229)NS (p = 0.599)NS (p = 0.455)
20–40 cmChlorine concentrationNS (p = 0.407)NS (p = 0.580)NS (p = 0.837)NS (p = 0.388)NS (p = 0.527)NS (p = 0.817)NS (p = 0.120)NS (p = 0.441)
Lateral length*
(p = 0.039)
NS (p = 0.481)NS (p = 0.471)NS (p = 0.478)NS (p = 0.241)** (p = 0.004)** (p = 0.000)NS (p = 0.055)
C×LNS (p = 0.422)NS (p = 0.405)NS (p = 0.753)NS (p = 0.729)NS (p = 0.559)NS (p = 0.492)NS (p = 0.212)NS (p = 0.230)
Alkaline phosphatase
0–20 cmChlorine concentrationNS (p = 0.278)NS (p = 0.554)NS (p = 0.780)NS (p = 0.912)NS (p = 0.407)NS (p = 0.717)NS (p = 0.945)NS (p = 0.924)
Lateral lengthNS (p = 0.182)NS (p = 0.538)NS (p = 0.344)NS (p = 0.440)NS (p = 0.007)NS (p = 0.120)NS (p = 0.139)NS (p = 0.739)
C×LNS (p = 0.797)NS (p = 0.445)NS (p = 0.282)NS (p = 0.999)NS (p = 0.240)NS (p = 0.859)NS (p = 0.176)NS (p = 0.030)
20–40 cmChlorine concentrationNS (p = 0.071)NS (p = 0.295)NS (p = 0.629)NS (p = 0.711)NS (p = 0.174)NS (p = 0.357)NS (p = 0.829)NS (p = 0.275)
Lateral lengthNS (p = 0.222)NS (p = 0.987)* (p = 0.019)NS (p = 0.207)** (p = 0.000)NS (p = 0.698)NS (p = 0.876)* (p = 0.046)
C×LNS (p = 0.626)NS (p = 0.265)NS (p = 0.285)NS (p = 0.941)NS (p = 0.941)NS (p = 0.349)NS (p = 0.440)NS (p = 0.053)
NS: Not significant at a probability level of 0.05; * significant at a probability level of 0.05; ** significant at a probability level of 0.01.
Table 4. Variance analysis of soil NO3-N for treatments during 2020 and 2021 seasons.
LayerSource20202021
30 Aug.20 Sep.11 Oct.31 Oct.4 Jul.23 Jul.9 Aug.16 Sep.
0–20 cmChlorine concentration* (p = 0.017)NS (p = 0.818)NS (p = 0.100)NS (p = 0.908)NS (p = 0.709)NS (p = 0.994)NS (p = 0.168)NS (p = 0.073)
Lateral lengthNS (p = 0.402)NS (p = 0.586)NS (p = 0.649)NS (p = 0.289)NS (p = 0.506)NS (p = 0.584)NS (p = 0.781)NS (p = 0.116)
C×LNS (p = 0.412)NS (p = 0.115)NS (p = 0.677)NS (p = 0.942)NS (p = 0.804)NS (p = 0.715)NS (p = 0.847)NS (p = 0.553)
20–40 cmChlorine concentrationNS (p = 0.769)NS (p = 0.159)NS (p = 0.523)NS (p = 0.754)NS (p = 0.734)NS (p = 0.093)NS (p = 0.170)NS (p = 0.851)
Lateral lengthNS (p = 0.194)NS (p = 0.966)NS (p = 0.126)NS (p = 0.761)NS (p = 0.495)NS (p = 0.181)NS (p = 0.080)* (p = 0.015)
C×LNS (p = 0.561)NS (p = 0.748)NS (p = 0.371)NS (p = 0.169)NS (p = 0.596)NS (p = 0.856)NS (p = 0.399)NS (p = 0.313)
40–60 cmChlorine concentrationNS (p = 0.306)NS (p = 0.362)NS (p = 0.301)NS (p = 0.463)NS (p = 0.231)NS (p = 0.644)NS (p = 0.090)NS (p = 0.438)
Lateral lengthNS (p = 0.840)NS (p = 0.231)NS (p = 0.405)NS (p = 0.883)NS (p = 0.986)NS (p = 0.499)NS (p = 0.137)NS (p = 0.374)
C×LNS (p = 0.508)NS (p = 0.741)NS (p = 0.984)NS (p = 0.611)NS (p = 0.465)NS (p = 0.534)NS (p = 0.227)NS (p = 0.533)
60–100 cmChlorine concentrationNS (p = 0.714)NS (p = 0.439)NS (p = 0.353)NS (p = 0.794)NS (p = 0.635)NS (p = 0.065)NS (p = 0.441)NS (p = 0.307)
Lateral lengthNS (p = 0.535)NS (p = 0.228)NS (p = 0.307)NS (p = 0.494)NS (p = 0.077)NS (p = 0.065)NS (p = 0.655)NS (p = 0.793)
C×LNS (p = 0.344)NS (p = 0.342)NS (p = 0.286)NS (p = 0.688)NS (p = 0.151)** (p = 0.010)NS (p = 0.169)NS (p = 0.372)
NS: Not significant at a probability level of 0.05; * significant at a probability level of 0.05; ** significant at a probability level of 0.01.
Table 5. Yield, yield components, and nitrogen uptake in 2020.
TreatmentEar Length (cm)Ear Barren Tip (cm)Kernal Number per Cob100-Seed Weight (g)Aboveground Plant Biomass (kg ha−1)Nitrogen Uptake
(kg ha−1)
Yield (kg ha−1)
C2L2018.9 a5.7 ab417 a22.3 b17,929.1 a181.0 a10,020.8 b
C6L2018.6 a5.9 a404 a21.1 b16,739.0 a165.9 a10,445.6 ab
C2L4019.4 a5.3 ab471 a22.5 ab16,968.9 a183.0 a10,193.7 ab
C6L4019.6 a4.8 b484 a23.4 a17,632.6 a187.5 a11,040.6 ab
C2L8019.6 a4.8 b492 a23.7 a18,212.6 a182.7 a11,406.2 a
C6L8019.1 a4.6 b476 a22.8 ab17,628.3 a173.4 a10,144.8 b
ANOVA
Chlorine concentrationNS (p = 0.421)NS (p = 0.590)NS (p = 0.823)NS (p = 0.513)NS (p = 0.685)NS (p = 0.444)NS (p = 0.991)
Lateral lengthNS (p = 0.087)* (p = 0.014)* (p = 0.032)* (p = 0.035)NS (p = 0.818)NS (p = 0.529)NS (p = 0.346)
C×LNS (p = 0.569)NS (p = 0.519)NS (p = 0.839)NS (p = 0.232)NS (p = 0.694)NS (p = 0.629)* (p = 0.032)
NS: Not significant at a probability level of 0.05; * significant at a probability level of 0.05. The values followed by the same letter in the column are not significantly different at a significance level of p < 0.05.
Table 6. Yield, yield components, and nitrogen uptake in 2021.
TreatmentEar Length (cm)Ear Barren Tip (cm)Kernal Number per Cob100-Seed Weight (g)Aboveground Plant Biomass (kg ha−1)Nitrogen Uptake
(kg ha−1)
Yield (kg ha−1)
C2L2020.8 ab3.1 a591 a31.5 a20,547.8 a210.9 a12,733.7 a
C6L2021.4 ab3.1 a603 a32.0 a20,368.9 a209.6 a13,343.6 a
C2L4020.9 ab2.9 a600 a32.7 a21,836.9 a242.6 a13,543.9 a
C6L4021.7 a2.7 a632 a32.5 a22,063.7 a244.7 a14,353.7 a
C2L8021.5 ab2.7 a633 a32.1 a21,355.9 a218.4 a14,057.5 a
C6L8020.6 b2.9 a587 a31.7 a20,855.0 a211.9 a12,849.5 a
ANOVA
Chlorine concentrationNS (p = 0.538)NS (p = 0.910)NS (p = 0.942)NS (p = 0.939)NS (p = 0.825)NS (p = 0.859)NS (p = 0.889)
Lateral lengthNS (p = 0.732)NS (p = 0.153)NS (p = 0.489)NS (p = 0.459)NS (p = 0.229)NS (p = 0.051)NS (p = 0.358)
C×L* (p = 0.026)NS (p = 0.510)NS (p = 0.064)NS (p = 0.772)NS (p = 0.906)NS (p = 0.947)NS (p = 0.230)
NS: Not significant at a probability level of 0.05; * significant at a probability level of 0.05. The values followed by the same letter in the column are not significantly different at a significance level of p < 0.05.
Disclaimer/Publisher’s Note: The statements, opinions and data contained in all publications are solely those of the individual author(s) and contributor(s) and not of MDPI and/or the editor(s). MDPI and/or the editor(s) disclaim responsibility for any injury to people or property resulting from any ideas, methods, instructions or products referred to in the content.

