Article

Effects of Muddy Water Infiltration on the Hydraulic Conductivity of Soils

1
State Key Laboratory of Eco-Hydraulics in Northwest Arid Region, Xi’an University of Technology, Xi’an 710048, China
2
School of Water Conservancy and Hydroelectric Power, Hebei University of Engineering, Handan 056038, China
*
Author to whom correspondence should be addressed.
Agronomy 2024, 14(7), 1545; https://doi.org/10.3390/agronomy14071545
Submission received: 1 June 2024 / Revised: 7 July 2024 / Accepted: 13 July 2024 / Published: 16 July 2024

Abstract

:
Despite the high sand content of Yellow River water in arid Northwest China, locals in the region opt to use muddy water to meet the demand for agricultural irrigation. Muddy water irrigation is a complex process and is still poorly understood. In this study, six sets of saturated soil column infiltration tests were designed, considering soil texture (silt loam, sandy loam, and sand) and muddy water sand content (3%, 6%, 9%, and 12%) as the influencing factors, with two sets of validation tests. Change in hydraulic conductivity (Kh), the average change rate of hydraulic conductivity (ΔK), and cumulative infiltration volume (I) were experimentally studied in the context of muddy water infiltration to respectively establish the separate functional models and developed to fit their relationship with time. The study results indicated that the hydraulic conductivity (Kh) decreased with increasing muddy water infiltration time. For silt loam and sandy loam, Kh stabilized at 0.0030 and 0.0109 cm/min, respectively, after 70 min of infiltration. In contrast, Kh in the saturated sandy soil column significantly declined throughout the muddy water infiltration, showing a 90.84% reduction after 90 min compared to the saturated hydraulic conductivity of the sandy soil. As the sand content of the muddy water increased from 3% to 12%, Kh decreased by 83.99%, 90.90%, 91.92%, and 92.21% for 3%, 6%, 9%, and 12% sand content, respectively, in the saturated sandy soil columns at the end of the infiltration period. The I values were 21.20, 9.29, 7.90, and 6.25 cm for 3%, 6%, 9%, and 12% sand content, respectively. The ΔK values were 0.0037, 0.0041, 0.0043, and 0.0044 cm/min2 for the respective sand contents, at an infiltration time of 80 min. The validation test demonstrated that the segmented function model accurately emulated the changes in hydraulic conductivity of sandy soil textures throughout the infiltration period. Results from this study provide a significant basis for understanding the mechanisms to hinder muddy water infiltration and to efficiently utilize muddy water for irrigation.

1. Introduction

Scarce precipitation [1,2,3,4] and acute water scarcity for use in agricultural irrigation [5,6,7,8] in arid Northwest China have constrained local agricultural development. Concentrated rainfall distribution and severe soil erosion in the region [9,10,11,12] have contributed toward making the Yellow River, which flows through the region, the river with the highest sand content in the world [13,14,15,16]. To meet the demand for agricultural irrigation and to make full use of available water resources, some farmers in the region have actively implemented muddy water irrigation. An in-depth study of muddy water infiltration will be of great theoretical value and practical significance for alleviating water scarcity, expanding irrigation yield and improving irrigation quality in areas utilizing muddy water irrigation.
Sediment deposition results in the formation of a dense layer or a physical soil crust on top of a field. A dense soil layer can alter soil structure, enhance soil aeration and porosity, and impact infiltration [17,18,19,20]. Moreover, dense layers can mitigate evaporation from agricultural soil surfaces, thereby decreasing water loss, optimizing water use efficiency, and enhancing crop yields [21,22]. Studies have been carried out to investigate the mechanics of muddy water infiltration [23]. Liu et al. [24] investigated the effects of different initial water contents on cumulative infiltration and nitrogen transport under muddy water conditions; Zhong et al. [25] discovered that the sand content had a noteworthy impact on infiltration, where cumulative infiltration and wetting front transport distance decreased as sand content increased; Nasirian et al. [26] found that using muddy water for field irrigation can prevent deep infiltration.
Hydraulic conductivity is an important hydraulic property of soil that influences various hydrological processes including infiltration, water redistribution, solute transport, and evaporation [27,28,29,30]. Various factors can alter soil structure and influence soil hydraulic conductivity, including tillage, mechanical compaction, organic amendments, and freeze–thaw cycles [31,32,33,34]. Therefore, studying the changing patterns of soil hydraulic conductivity under variable conditions is necessary for understanding soil function. Several new concepts and techniques are being applied to the study of hydraulic conductivity [35,36]. Dong et al. [37] applied organic amendments to soil and found that the saturated hydraulic conductivity was significantly higher in soil treated with straw decomposer than without. Ming et al. [38] found that permafrost water film lowered the hydraulic conductivity by about 20%. Based on the theory of capillary flow, they proposed a new model to predict permafrost hydraulic conductivity that accounted for the flow of the water film. Sun et al. [39] investigated how soil crust changes soil hydraulic conductivity characteristics and found that the saturated hydraulic conductivity of cyanobacteria, cyanobacteria–moss mixture, and moss crusts was 77%, 69%, and 61% less, respectively, than that of bare soil. Further, the relationship between saturated hydraulic conductivity and biological fungal crust permeability in the air-dry state could be fitted well with a positive logarithmic linear model.
Many studies [23,24,25] have been conducted to investigate the infiltration patterns of soil under muddy water irrigation conditions, but few studies have explored the impact of muddy water infiltration on hydraulic conductivity. In sum, this study carried out one-dimensional saturated soil column infiltration tests indoors under muddy water conditions to explore the variation in soil hydraulic conductivity based on different soil textures and muddy water sand contents. The conclusions drawn from this study contribute significantly to the vigorous development of muddy water irrigation.

2. Materials and Methods

2.1. Test Materials

Samples of three different soils with varying textures were utilized in the study. These samples were taken from the topsoil layer (0–30 cm) of agricultural lands located in Xi’an Baqiao (34°18′42″ N, 109°9′1″ E), the northern outskirts of Xi’an in Shaanxi Province (34°24′21″ N, 108°58′25″ E), and Wuzhong in Ningxia Province (38°1′50″ N, 106°12′31″ E). After collection, the air-dried soil specimens were sieved through a mesh (2 mm). The particle size distribution of the soil was analyzed using a Mastersizer 2000 laser particle size analyzer (Malvern Instruments, Malvern, UK), capable of measuring particles ranging from 0.02 to 2000 mm (Table 1).
The sediment employed for the infiltration test was sourced from the primary canal of the Jinghui irrigation area. This sediment was air-dried, sieved through a 1 mm mesh, and its particle composition was determined using a Mastersizer 2000 laser particle size analyzer (Table 1). Sediment physical and chemical properties were also tested and the results are shown in Table 2.

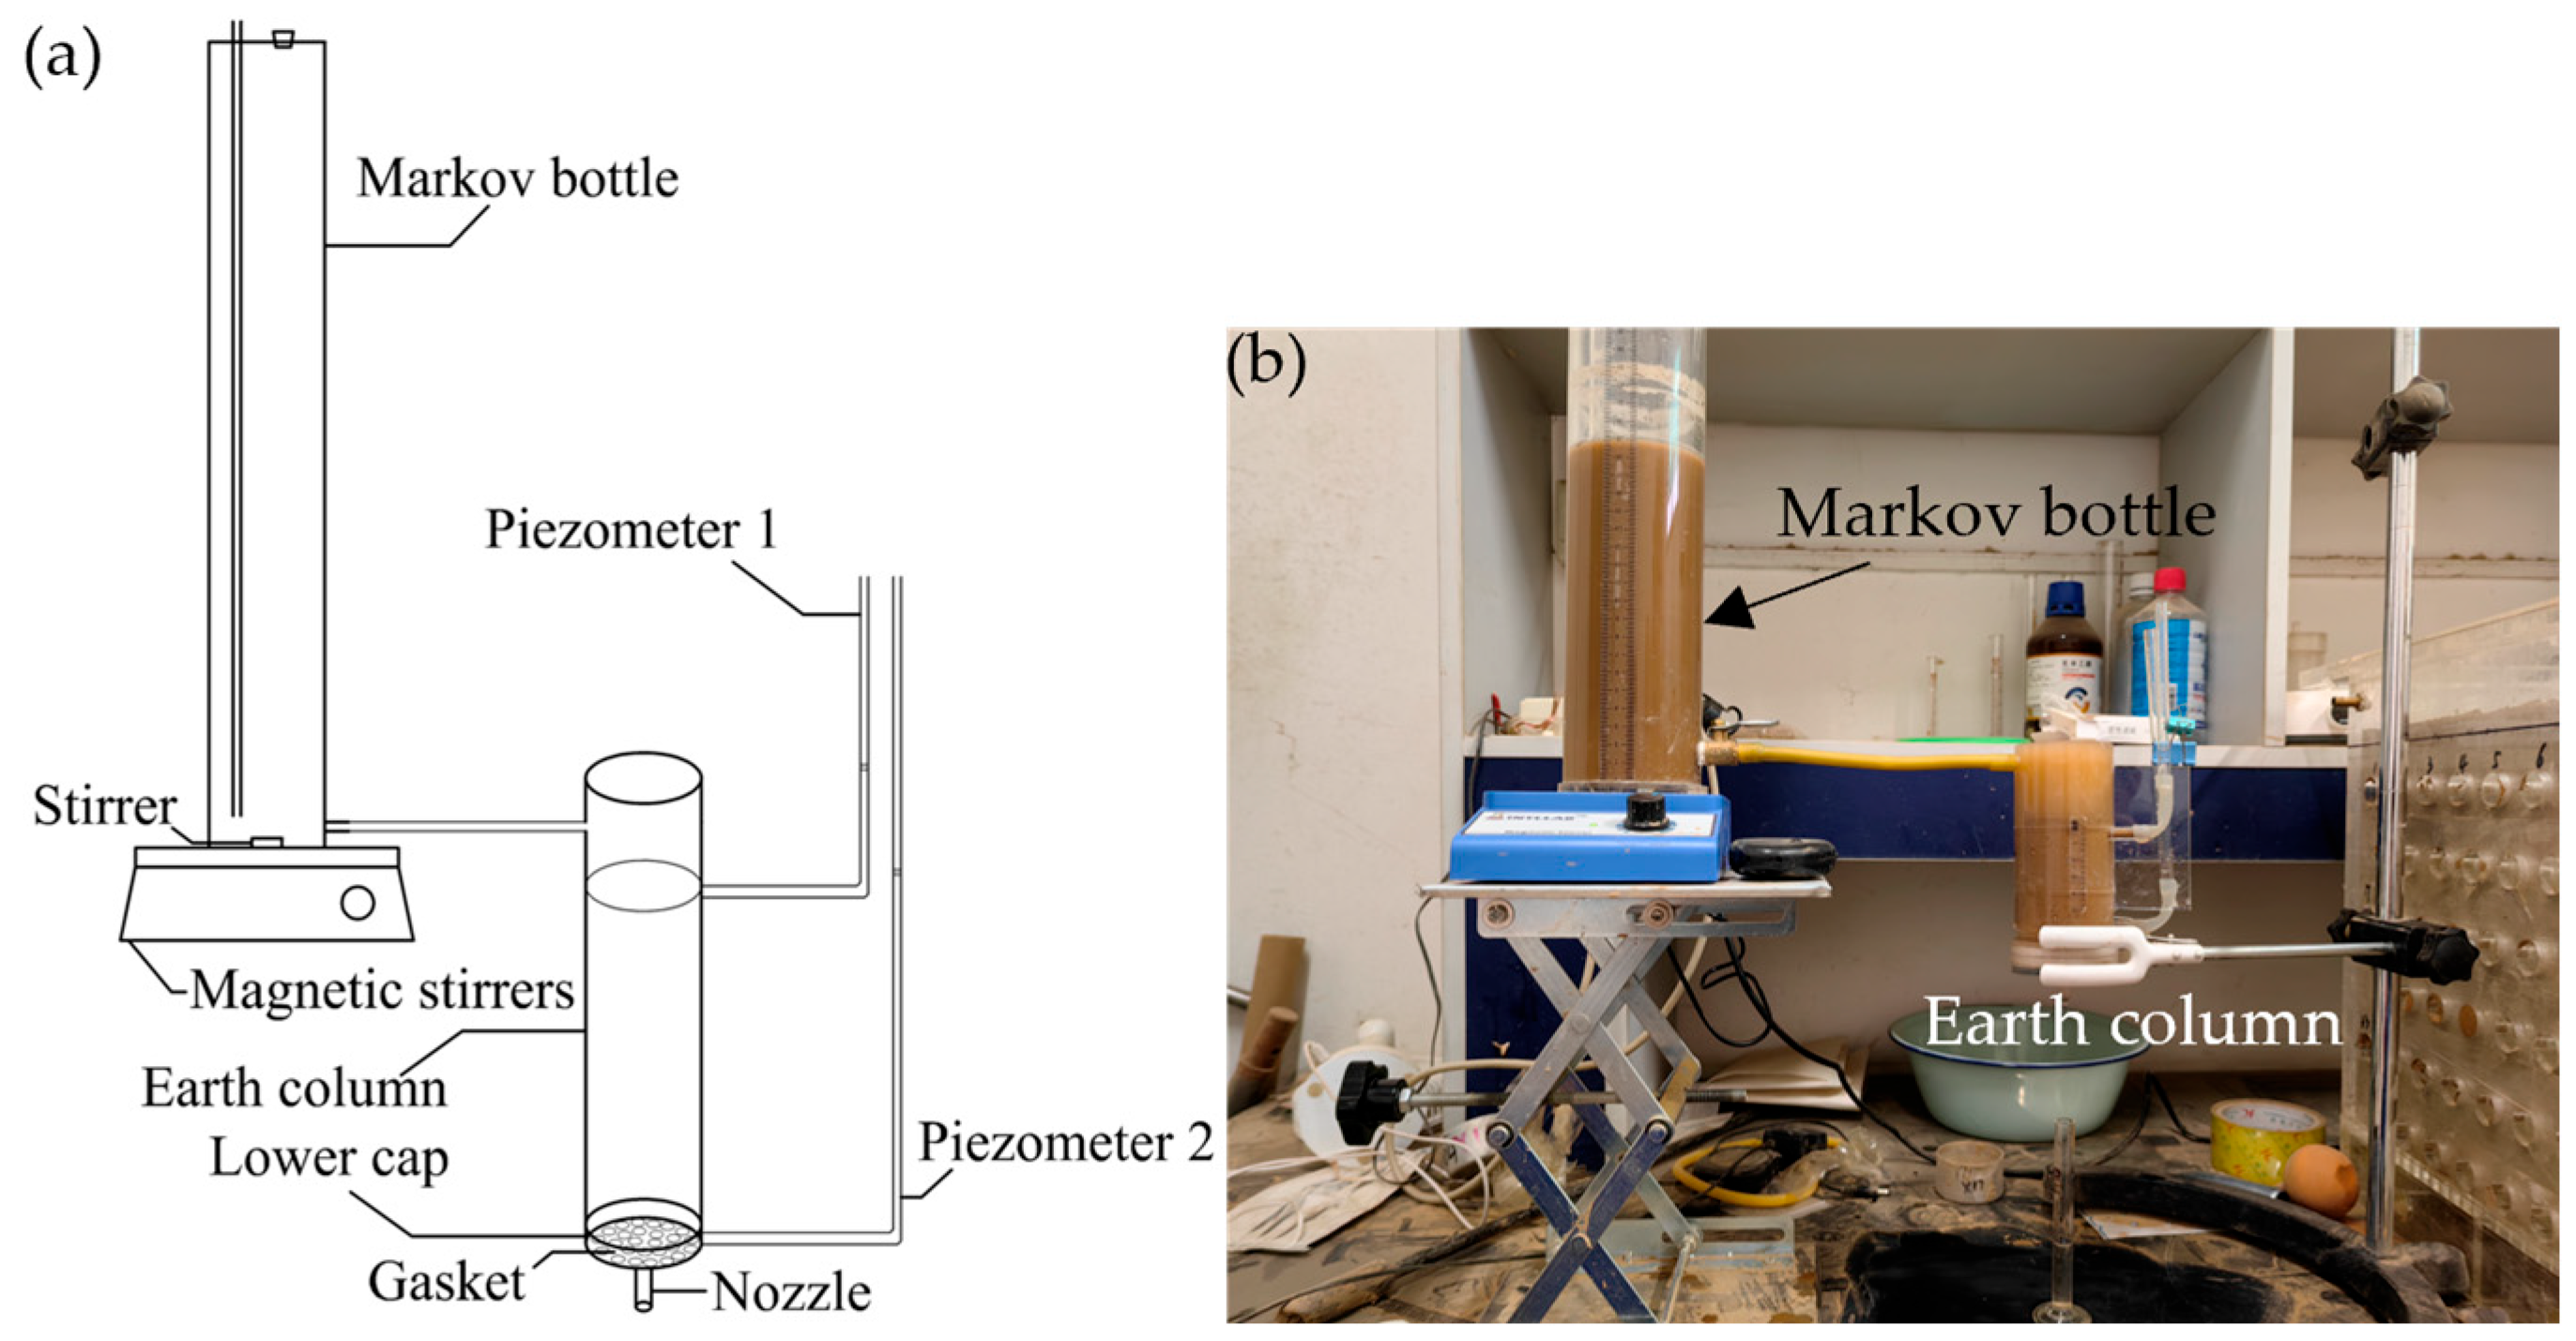
2.2. Test Setup and Methods

The necessary amount of sediment and deionized water was measured according to the sand content, then poured into a Markov bottle and stirred thoroughly to provide muddy water. The experiment was conducted in August 2023 at the State Key Laboratory of Eco-hydraulics in the Northwest Arid Region. The setup included a soil column made of plexiglass, with an inner diameter of 5 cm and a height of 13 cm, and a muddy water Markov bottle (Figure 1a). The soil column had a spacer at the bottom with openings for aeration, a pipe nozzle for water collection, and two piezometers to measure the head difference. Prior to testing, the soil layers were filled, reaching a height of 8 cm, with a filter paper at the bottom to prevent soil loss (Figure 1b). After saturating the soil for 12 h, infiltration testing was done.
Markov bottles made of Plexiglas with an inner diameter of 6 cm are used to hold the muddy water. A magnetic stirrer ensures that the sand content is homogenized. The penetration test is initially carried out with fresh water to eliminate interfering factors, followed by muddy water, with the amount of penetrated water measured at regular intervals.
As muddy water infiltrates, fine particles from the sediment enter the saturated soil column, blocking the pore spaces responsible for hydraulic conduction in the soil. Meanwhile, most of the sediment deposits on the soil surface, forming a dense sedimentary layer (Figure 2). These sediment behaviors cause continuous changes in soil hydraulic conductivity, ultimately resulting in a multilayered structural system with significantly different properties along the direction of hydraulic conduction. However, throughout the entire process, the infiltration of muddy water in the saturated soil column still satisfies Darcy’s law [40], i.e., the flow rate is proportional to the hydraulic slope drop:
q   = K h i A
where q is the infiltration rate, cm3·min−1; Kh is the hydraulic conductivity of soil, cm·min−1; i is the hydraulic gradient; and A is the cross-sectional area of the soil sample, cm2.
Since the Kh varies over time, the total outflow (Q(t)) per unit area after muddy water infiltration at time (T) is:
Q ( t ) = 0 T K h i dt
where Q(t) is the total amount of outflow after moment T min, cm3.
In a small time period (Δt), this can be treated as a steady-flow problem. Therefore, the flow rate per unit area in this small time period (Δt) is [41]:
Q ( t   + Δ t ) Q ( t ) Δ t = q
where Q(t + Δt) is the flow rate at time t, cm3; Q(t) is the flow rate before the time interval, cm3; Δt is the time interval, min; and the ratio of the two is the average flow rate during the time interval, which is approximated as the infiltration flow rate.

2.3. Experimental Design

To determine how muddy water infiltration varies in different soil textures, the test was divided into two parts: (1) Measurement of hydraulic conductivity (Kh) of saturated soil columns with different soil textures under muddy water conditions. The muddy water sand content was set at 6% (S = 6%), and there were three kinds of soil (silt loam, sandy loam, and sand, corresponding to the F1, F2, and T2 treatments, respectively). (2) Measurement of the Kh of saturated soil columns (sandy soil only) with different sand contents under muddy water conditions. Four levels of muddy water sand content were set up (S = 3%, 6%, 9%, and 12%, corresponding to T1, T2, T3, and T4 treatments, respectively), as were two groups of validation tests (S = 4% and 10%, corresponding to the T5 and T6 treatments), and each group was replicated three times. The specific scheme of the testing is shown in Table 3.

2.4. Analysis of Data

Data processing was performed using Excel 2021 software (Microsoft, Redmond, WA, USA), while SPSS 26 (IBM, Armonk, NY, USA) was used for curve fitting and analyzing data, and Origin 2022 (OriginLab, Northampton, MA, USA) was used for plotting. Significance was tested using one-way ANOVA.
To assess the model’s accuracy, the alignment between the model’s calculated values and the experiment’s measured values was analyzed using the statistical coefficient of determination (R2), root mean square error (RMSE), and the absolute value of relative error (AE). The respective formulas for calculating these are:
R 2 = i = 1 n ( M i N - i ) 2 i = 1 n ( N i N - i ) 2
RMSE = 1 n i = 1 n ( N i M ) 2
AE = M N i N i   ×   100 %
where n is the number of data points; Ni is the measured value; and M is the model-calculated value. Usually, as R2 approaches 1 and both RMSE and AE approach 0, it signifies a closer resemblance between measured and calculated values.

3. Results

3.1. Effect of Soil Texture on Hydraulic Conductivity

Under the muddy water conditions, the hydraulic conductivity of the saturated soil columns changed over time, as shown in Figure 3, and the saturated hydraulic conductivities (KS) of the three soil types (silt loam, sandy loam, and sand) started at 0.0034, 0.0124, and 0.3823 cm·min−1, respectively. As can be seen in Figure 3, the Kh of the three soils gradually decreased as infiltration proceeded. The Kh of sandy soil had the largest rate of change, with a highly significant decrease (p < 0.01) after 20 min of infiltration. This value was 81.45% lower than that of sand KS. By this 20 min mark, the silt contained in the muddy water had formed an obvious silt layer on the sandy soil surface, extending the infiltration pathways and retaining some of the silt in the soil column. This silt layer reduced the sandy soil pore space and thus reduced the infiltration capacity. After 20 min, the hydraulic conductivity decreased at a slower rate, reaching 0.0382 cm·min−1 after 90 min. Therefore, the hydraulic conductivity was reduced by 90.84% overall compared with sand KS.
The Kh of silt loam and sandy loam also decreased at a decelerating pace, but the overall change was gentle. In the first 5 min, the conductivities were reduced by 4.03% and 2.94%, respectively; then, after the first 20 min, they were reduced by 5.88% and 6.45%, respectively, compared with the initial KS. Both reduction rates were significantly smaller than that of the sandy soil; after 70 min, the Kh of the silt loam and sandy loam no longer changed, and they remained at 0.0030 and 0.0109 cm·min−1, respectively. After 90 min, the silt loam and sandy loam hydraulic conductivities had decreased 11.76% and 12.10% from their respective initial KS. The results in Table 4 show that the infiltration of turbid water has a significant impact on the permeability of the three soil types at 0 min, 20 min, and 90 min (α = 0.05). Additionally, significant variations are observed across different time points within each soil type (α = 0.05).

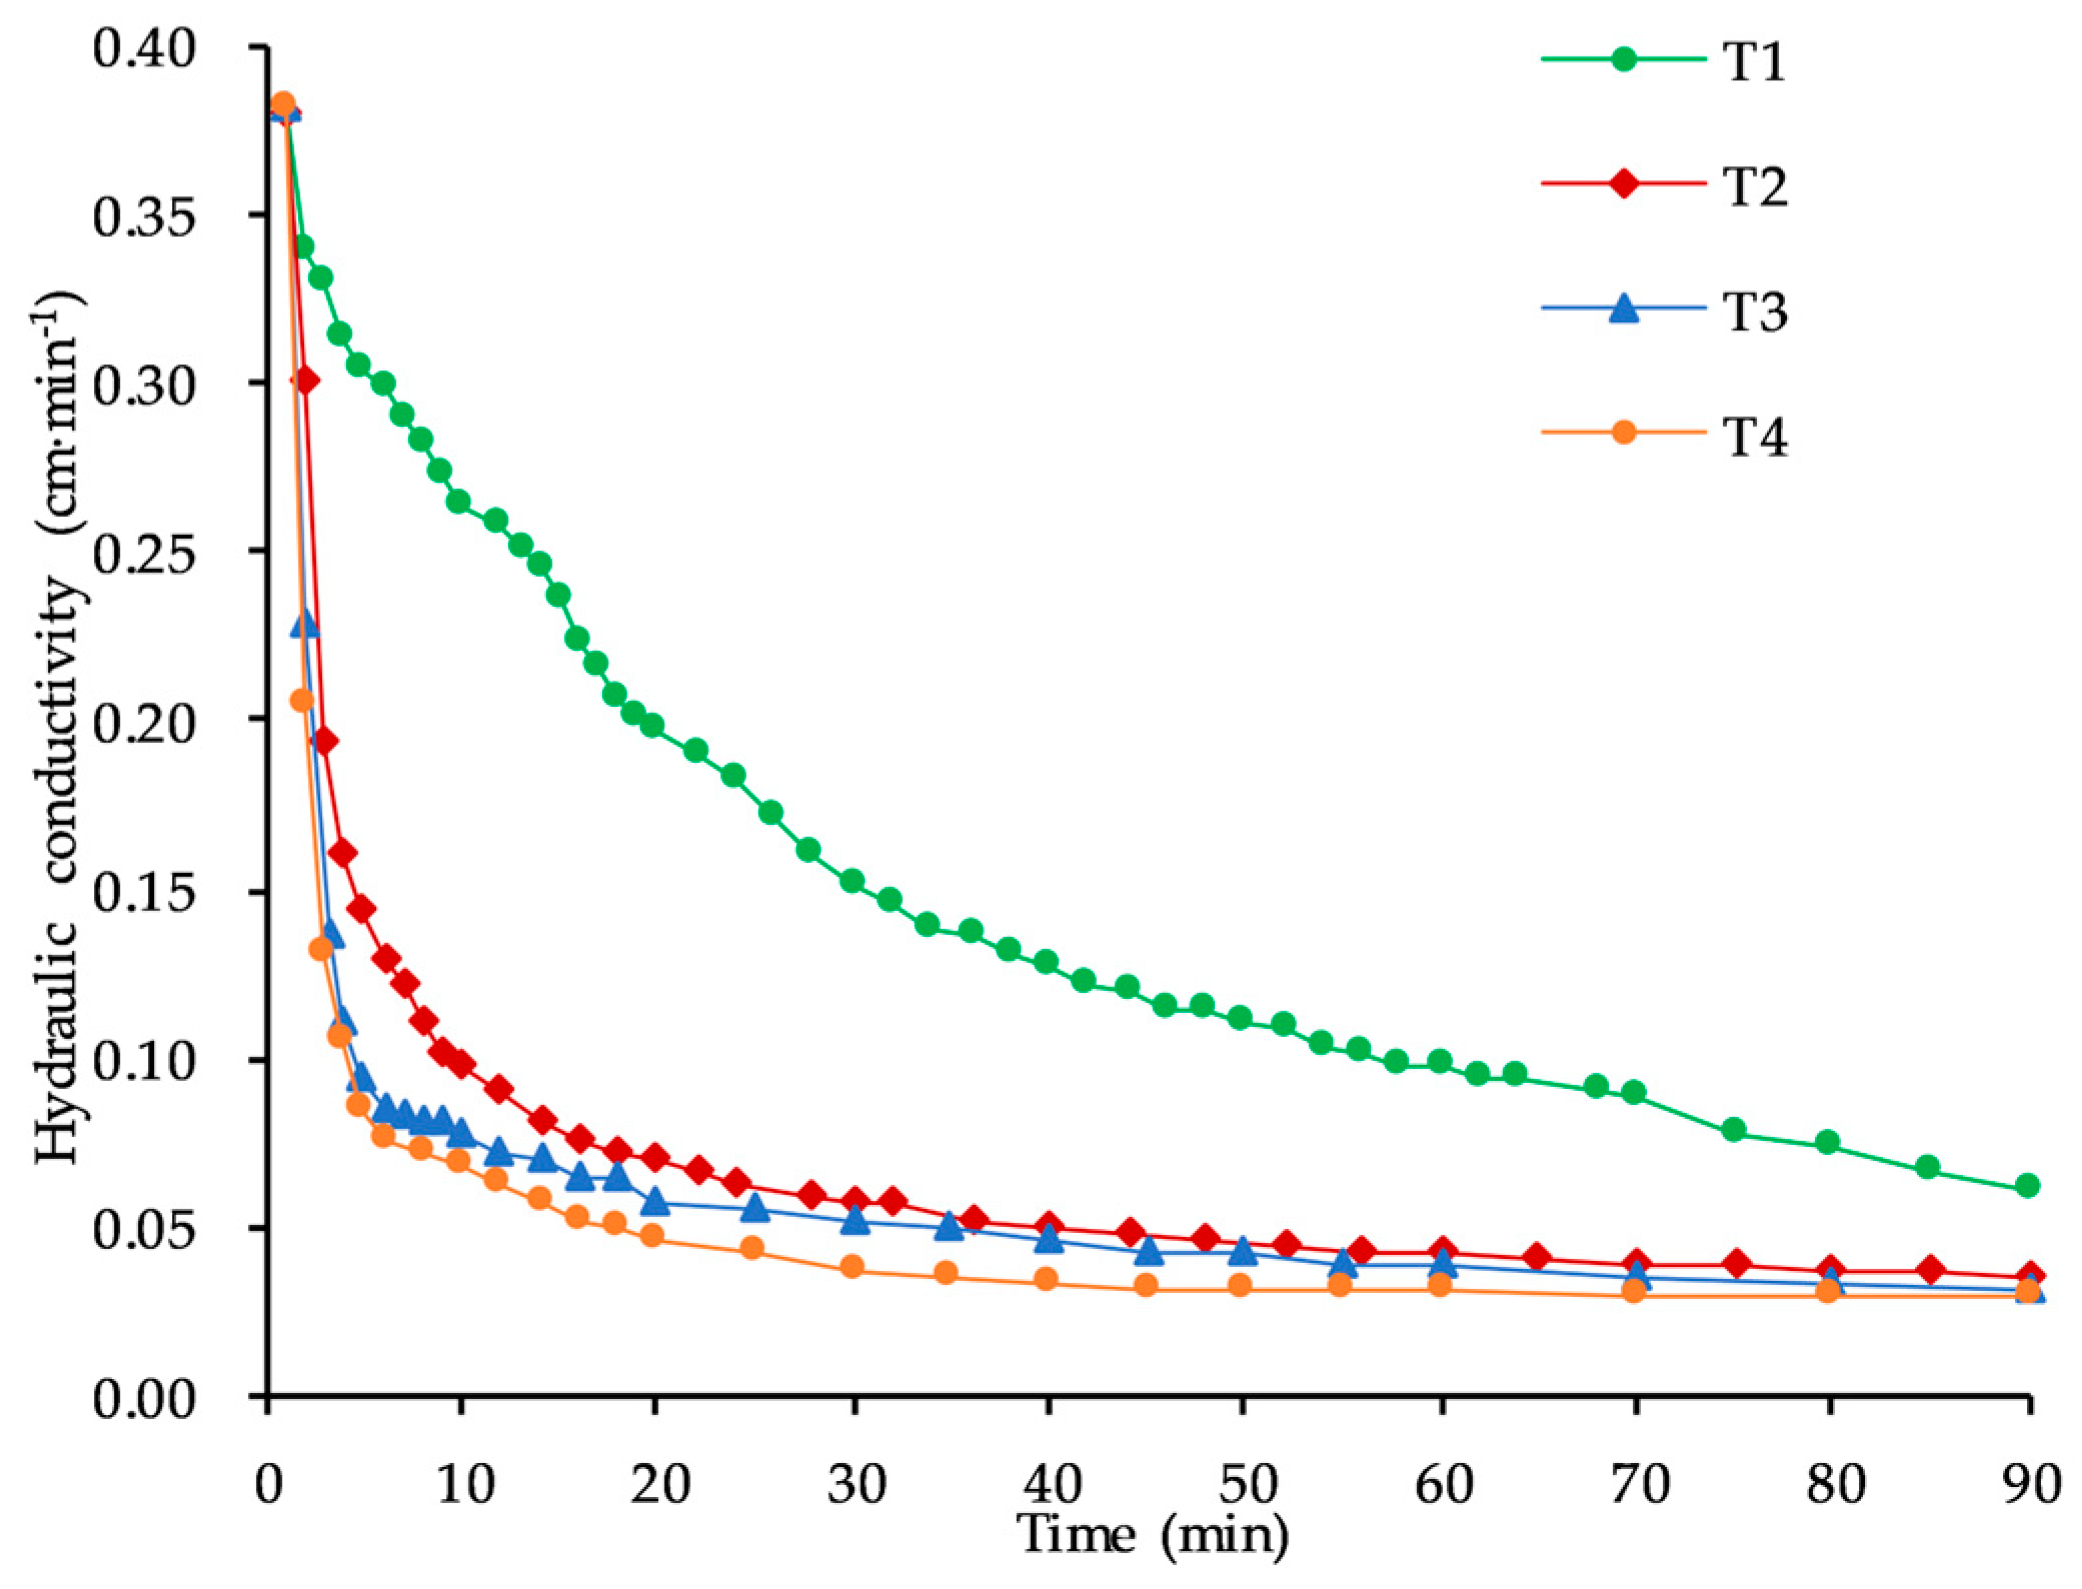
3.2. Effect of Muddy Water Sand Content on Hydraulic Conductivity

Changes in the hydraulic conductivity of the saturated sandy soil columns with different sand contents (S) in muddy water are shown in Figure 4. From Figure 4, it is evident that the hydraulic conductivity of each treatment gradually decreased as infiltration continued, and that the hydraulic conductivity (at the identical infiltration duration) decreased as the S increased. In the first 20 min of infiltration, the hydraulic conductivity values shrank rapidly, and the hydraulic conductivity values of each treatment, in order of increasing level of sand content, were 0.1976, 0.0705, 0.0580, and 0.0152 cm·min−1 at 20 min, which were 48.31%, 81.56%, 84.83%, and 87.84% less than the initial KS of the sandy soil, respectively. This difference indicates that when the muddy water sand content was 3%, the dense layer was slow to form during infiltration, but when the sand content was 6% or greater, the dense layer formed more rapidly on the surface of the soil, thus having a substantial impact on hindering the infiltration of water. Throughout the infiltration duration, the rate of decrease of hydraulic conductivity slowed, and the hydraulic conductivity values of each treatment, in order of increasing level of sand content, were 0.0612, 0.0348, 0.0309, and 0.0298 cm·min−1 at 90 min, which were 83.99%, 90.90%, 91.92%, and 92.21% less than the initial KS of the sandy soil, respectively. In sum, the values of different treatments began to converge after 90 min of infiltration.

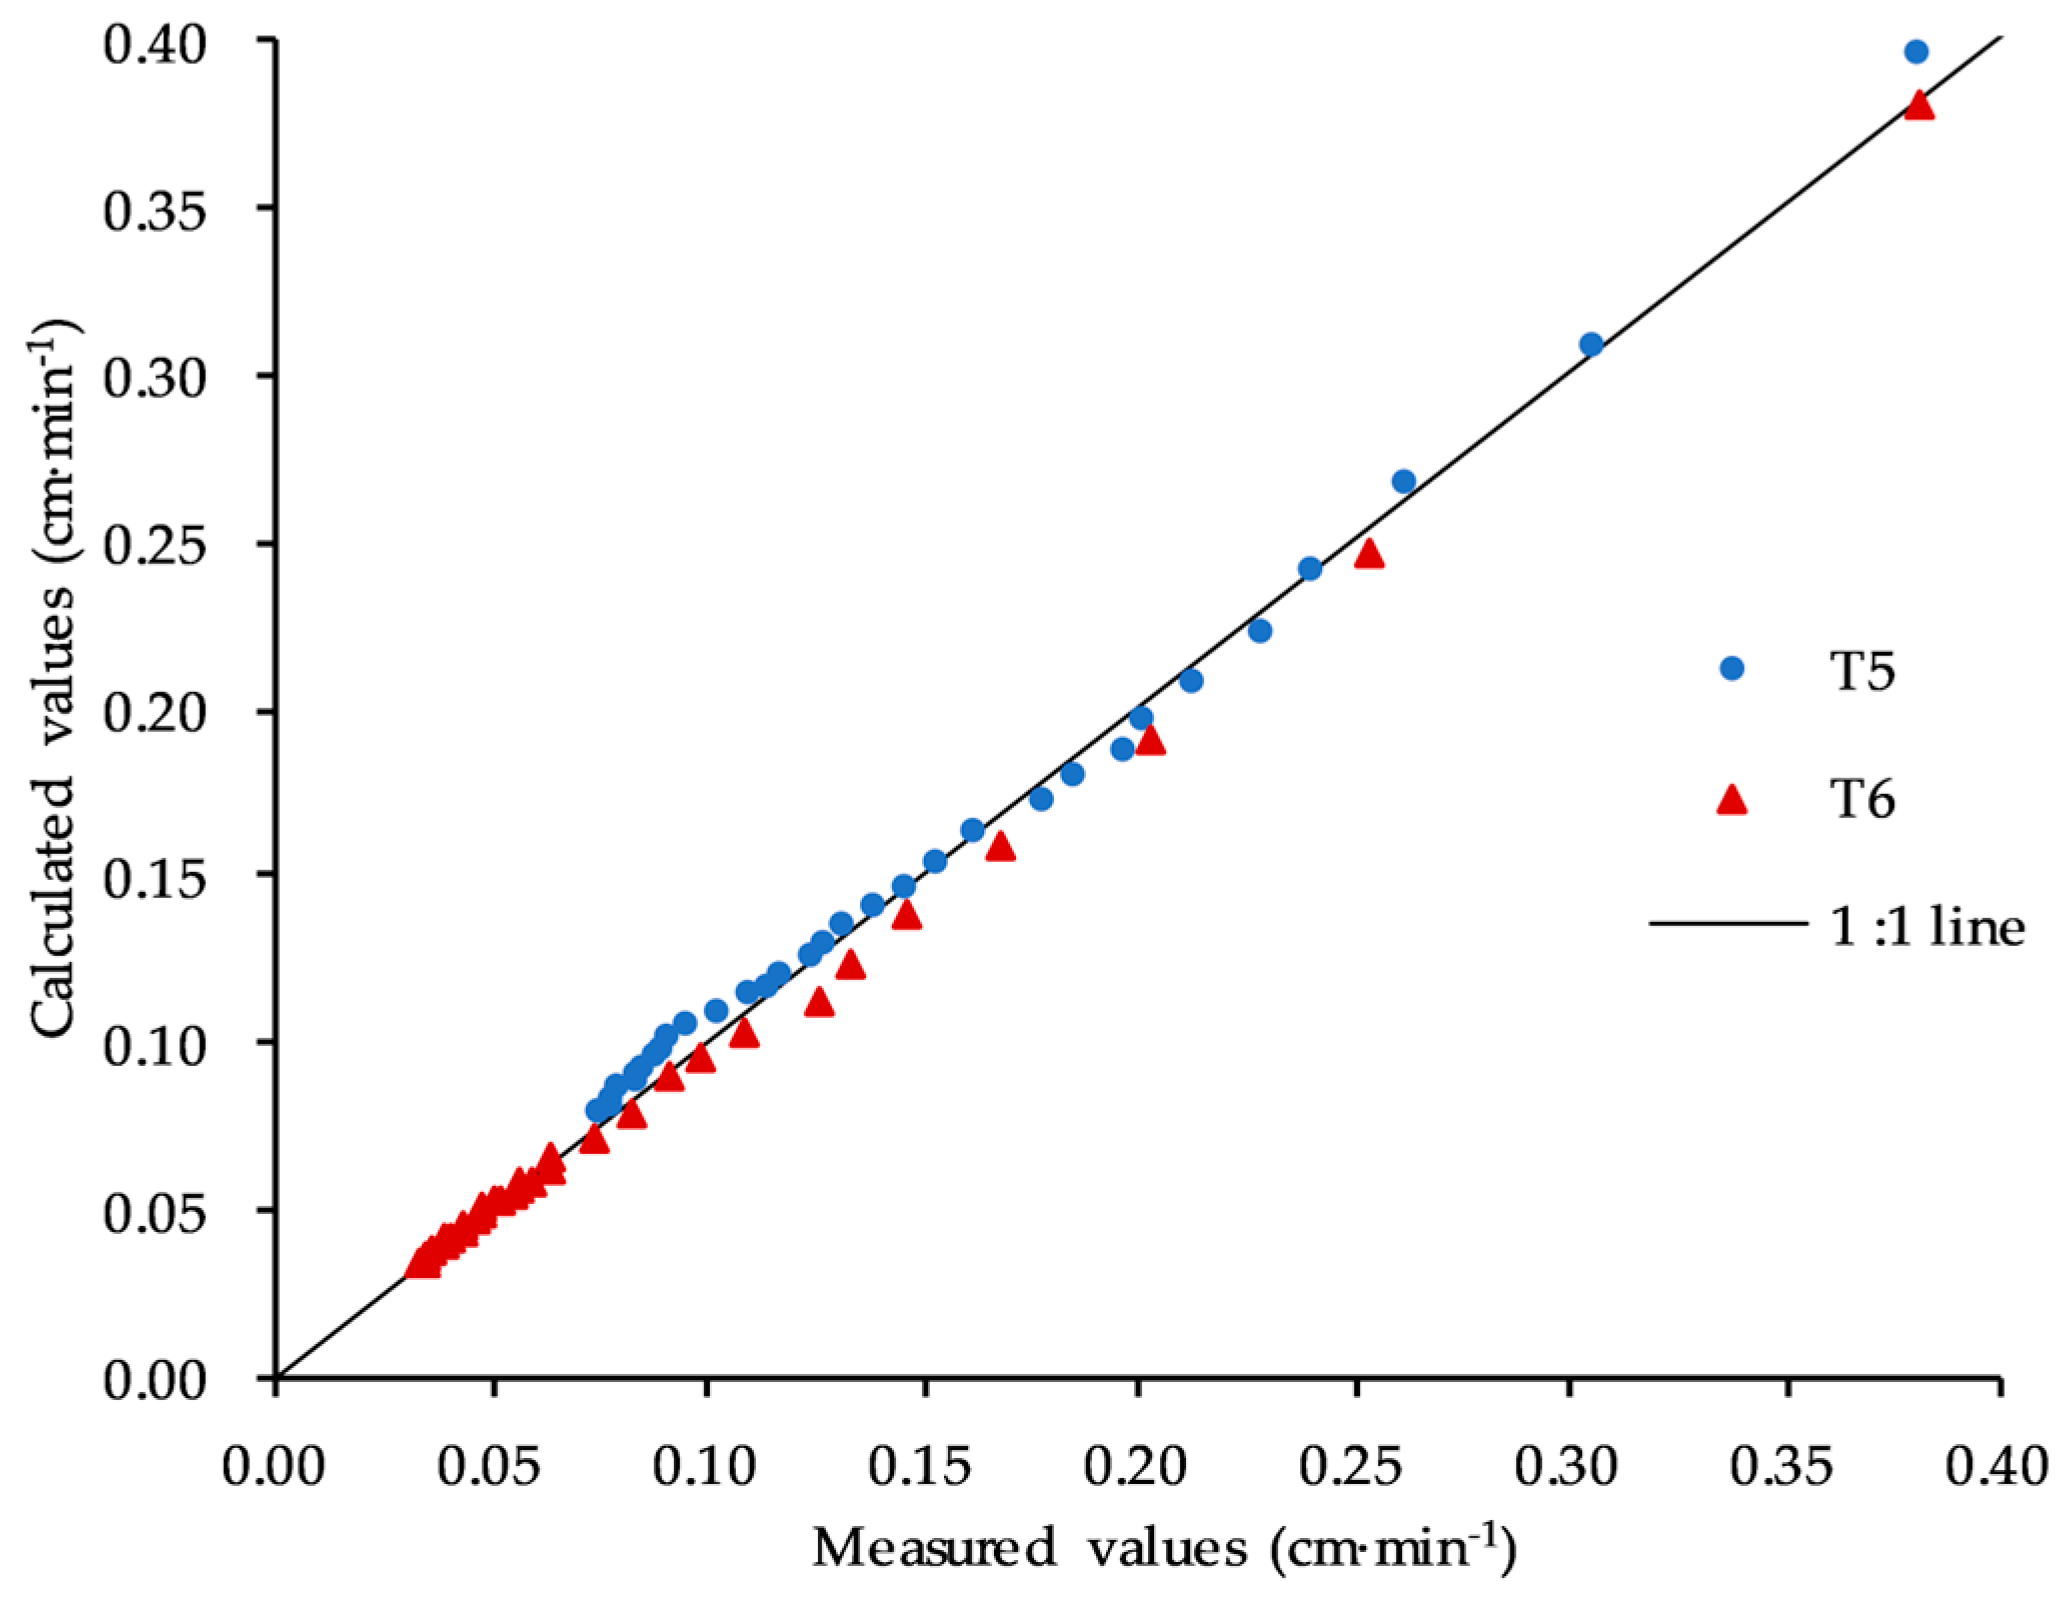
3.3. Simulation Analysis and Verification

Because the change in hydraulic conductivity values varied greatly before and after 20 min of infiltration, a segmented function was employed to accurately model the relationship between hydraulic conductivity change and infiltration duration. The segmentation function used was as follows:
K h = a t b , t 20   m i n c l n t + d , t > 20   m i n
where Kh is the hydraulic conductivity, cm·min−1; a and b are the fitting coefficients and fitting indices before 20 min, respectively; and c and d are the fitting coefficients and fitting intercepts after 20 min, respectively.
The results of fitting the hydraulic conductivity values over the infiltration duration are shown in Table 5. Here, R2 was above 0.90, and the RMSE value was below 0.8 cm·min−1, which indicates that the fitting effect was good and that the segmented function model performed well in simulating the change in hydraulic conductivity values in accordance with infiltration duration.
Throughout Table 5, the fitting parameters change very obviously with the sand content. In a certain range, the fitting parameters a, b, and d gradually decreased as sand content gradually increased, while the fitting coefficient c gradually increased after 20 min. Specifically, the sand content S increased from 3 to 12%, and the fitting coefficient decreased from 0.4005 to 0.3705 before 30 min, the fitting index decreased from −0.1965 to −0.6480 before 20 min, the fitting intercept decreased from 0.4430 to 0.0677 after 20 min, and the fitting coefficient increased from −0.0848 to −0.0090 after 20 min. The b and c fitting result values were less than 0, and the absolute values were recorded for the convenience of research. Analysis revealed that the relationships between a and |b| and sand content S conformed to the exponential and linear functions, respectively, while the fittings of |c| and d to the exponential relationship conformed to the power function relationship. As follows, the functional relationship was derived according to the process of variation of each fitted parameter with sand content S (Table 6).
Substituting the function model of the fitted parameters obtained from Table 4 into Equation (6), the model of hydraulic conductivity versus infiltration duration t and sand content S under different conditions of muddy water sand content was obtained as follows:
K h = 0.4136 e 0.0100 S t 0.0665 S 0.0925 , t 20   m i n 0.4138 S 1.5110 l n t + 1.6604 S 1.2830 , t > 20   m i n
The reliability of Equation (8) was verified by tests T5 and T6. The measured values of the tests and the calculated values of the model were compared and analyzed, and the results are shown in Figure 5. In Figure 5, the maximum AE between the model (Equation (8)) and the measured values were 12.54% and 9.50% (less than 15%), and the RMSEs were 0.0015 and 0.0008 cm·min−1 (T5 and T6), with a small overall error (less than 0.0020 cm·min−1). This indicates that the developed model effectively described the relationship of hydraulic conductivity Kh with infiltration duration t and with sand content S.

3.4. Effect of Muddy Water Sand Content on the Average Rate of Change of Hydraulic Conductivity

To explore the hydraulic conductivity dynamics more effectively, the average rate of change of hydraulic conductivity (ΔK) was investigated. The ΔK was defined as follows:
Δ K = K S K h t
where ΔK is the average rate of change of hydraulic conductivity, cm·min−2; and Kh is the value of hydraulic conductivity at the moment t. The greater the magnitude of ΔK, the more pronounced the change of hydraulic conductivity Kh.
Figure 6 shows the trend of the ΔK in accordance with infiltration duration. The ΔK gradually decreased as infiltration duration increased. In contrast, the ΔK increased as sand content increased, relative to the same infiltration duration. After 10 min of infiltration, the ΔK of each treatment (T1, T2, T3, and T4) were 0.0119, 0.0285, 0.0304, and 0.0314 cm·min−2, respectively. After 80 min of infiltration, the ΔK of each treatment basically stabilized, and the ΔK were 0.0037, 0.0041, 0.0043, and 0.0044 cm·min−2, respectively. At this time, the values of the ΔK were very similar across all treatments.
After analysis, the average rate of change of hydraulic conductivity at different sand contents showed a highly significant power function relationship with infiltration duration. The power function used was as follows:
Δ K   = p t q
where p and q are the fitting coefficient and fitting exponent of ΔK, respectively. The data shown in Figure 6 were fitted to Equation (10), and Table 5 shows the results of the specific fitting parameters of Equation (10). As can be observed from Table 7, the R2 exceeded 0.9, and the RMSE was under 0.0080 cm·min−2, both of which are good fitting results and indicate that the correlation with the power function model (Equation (10)) was significant.
In addition, the fitting coefficient of the average rate of change of hydraulic conductivity p gradually increased as sand content increased, and the sand content increased from 3% to 12%, while p increased from 0.0348 to 0.2272. At the same time, the fitting exponent q showed the opposite rule of change, with q decreasing from −0.4740 to −0.8840. The power function is known to be affected more by p than by q in the early stage, but when the infiltration duration t is large enough, the power function value is influenced increasingly by q. When the soil column water conductivity capacity was at its maximum, the saturated soil column surface did not have a dense layer. Therefore, when the muddy water first entered the soil column, the muddy water infiltration water flux peaked, and the sediment rapidly formed a dense layer on the surface of the soil column. The greater the sand content, the faster this process became and the larger the average change in hydraulic conductivity was, thus corresponding to the larger p-value. The thickness of the dense layer increased as muddy water infiltration continued, and the values of the average rate of change of hydraulic conductivity converged under different treatments as the values of hydraulic conductivity decreased and also converged.

3.5. Effect of Muddy Water Sand Content on Cumulative Infiltration

Cumulative infiltration (I) is defined as the total amount of water that has infiltrated into the soil per unit area of the surface at a given time after infiltration begins. The I volume of each treatment varied with time, as shown in Figure 7. At the onset of infiltration, the Kh was large, and so the I increased rapidly. This was especially true in the T1 treatment where the muddy water had low sand content, and the resulting dense layer had a weak influence on the Kh. During continued infiltration, sediment from the muddy water continuously accumulated onto the soil column’s surface, gradually thickening the dense layer. This layer subsequently acted as a barrier to water, leading to a reduction in infiltration rate. The I decreased as muddy water sand content increased. When the infiltration duration reached 90 min, the I of the T1, T4, T5, and T6 treatments were 21.20, 9.29, 7.90, and 6.25 cm, respectively, the latter of which were 56.18%, 62.74%, and 70.52% less than that of the T1 treatment, respectively. This indicates that the presence of a dense layer enhances the infiltration reduction effect and thereby greatly reduces the cumulative infiltration volume under different treatments of muddy water sand content, thus effectively preventing water infiltration to a certain extent. The greater the S of muddy water, the more obvious the seepage reduction effect and the smaller the cumulative infiltration amount.
Cumulative infiltration (I) and infiltration duration (t) were compared between different treatments, and a power function was found to describe the relationship [42]:
I = α t β
where α and β are the cumulative infiltration fit coefficient and cumulative infiltration fit index, respectively.
Table 8 shows the fitting results of the power function relationship between I and t for different treatments. The R2 exceeds 0.9, and the RMSE is below 1, which indicates that the fitting results are good and that the power function accurately captures the relationship between I and t. As the sand content increased from 3% to 12%, the fitting coefficient of cumulative infiltration α in the power function model decreased from 0.8810 to 0.5441, and the fitting exponent of cumulative infiltration β decreased from 0.7394 to 0.5426, respectively.

4. Discussion

This paper investigated the effect of muddy water sand content on hydraulic conductivity and the variation in cumulative infiltration volume under different sand contents by running an infiltration test of saturated soil columns under muddy water conditions. The Kh of soil is affected by pore morphology, soil structure, and other factors [42,43,44,45]. Unlike unsaturated flow, which is affected by capillarity and adsorption [46,47], soil hydraulic conductivity tends to be a constant value under saturation. In this study, as slurry water continued to infiltrate, a dense layer formed at the top boundary of the soil column, leading to a decrease in Kh from 0.3823 to 0.0382 cm/min (S = 6%) after 90 min. Soil crusts usually create a dense surface structure, reducing surface-layer porosity and consequently affecting hydraulic conductivity [48]. When crusts form on the soil surface, hydraulic conductivity changes [39,49]. Wang et al. [50] found that the saturated hydraulic conductivity of soil covered with biocrusts was reduced by 66% compared to bare soil.
As the sand content in the muddy water increased, the Kh of the sandy soil decreased to 0.1976, 0.0705, 0.0580, and 0.0152 cm/min at 20 min (with sand contents of 3%, 6%, 9%, and 12%, respectively). Generally, soil crusting induced by rainfall reduces hydraulic conductivity. Zambon et al. [51] found that soil crusts formed under high rainfall intensities (>56.7 mm·h−1) exhibit lower hydraulic conductivity compared to those formed under low rainfall intensities (<56.7 mm·h−1), influenced by factors such as crust thickness and porosity. These findings parallel the effects observed with varying sand content in muddy water on hydraulic conductivity.
There were variations in hydraulic conductivity changes during muddy water infiltration across different soil textures. In sandy soil, Kh decreased by 90.84% compared to KS after 90 min of infiltration, whereas in sandy loam and silt loam, the decrease was only 11.76% and 12.10%, respectively. Research indicates that crusts exert different impacts on various soil textures [52]. Qiu et al. [52] observed that biological crusts had a more significant effect on soil hydraulic conductivity in sandy soils compared to loamy soils. In sandy soils covered by cyanobacteria, cyanobacteria–moss mixtures, and moss crusts, KS decreased notably, whereas in loamy soils, the reductions were 49.0%, 68.7%, and 36.0%, respectively.
In the case of muddy water infiltration, as S increases, the Kh of sandy soil continuously decreases. At 90 min, the I values were 21.20, 9.29, 7.90, and 6.25 cm for sand contents of 3%, 6%, 9%, and 12%, respectively. The infiltration rate decreased with the duration of infiltration, a trend akin to the infiltration of muddy water under unsaturated conditions [25]. Liu et al. [24] demonstrated that the power function model effectively simulates the infiltration process of unsaturated muddy water. Similarly, in this study, the power function model proves highly suitable for simulating the infiltration process of saturated sandy soil columns under muddy water conditions.
This study is based on results from indoor saturated soil column infiltration tests with muddy water, which have inherent limitations compared to field conditions. Moreover, natural water infiltration processes involve more intricate unsaturated soil dynamics, necessitating further validation of the applicability of the findings from this study to such conditions.

5. Conclusions

In this study, saturated soil column muddy water infiltration tests were conducted to investigate the effects of soil texture (silt loam, sandy loam, and sandy soil) and muddy water sand content on soil hydraulic conductivity characteristics, and the following key conclusions were drawn:
(1) After 70 min of muddy water infiltration, the hydraulic conductivity (Kh) values of the silt loam and sandy loam decreased to 0.0030 and 0.0109 cm·min−1, respectively, and then stabilized. In contrast, the Kh of the sandy soil continued to decrease over time, albeit at a slowing rate.
(2) The Kh of the saturated sandy soil columns with different muddy water sand contents decreased as infiltration duration increased. At the same infiltration durations, Kh decreased with increasing muddy water sand content (S). In the first 20 min of infiltration, the Kh of each treatment decreased rapidly, and then the rate of change of Kh was reduced after 20 min. At 90 min of infiltration duration, the Kh values of each treatment began to converge.
(3) Segmented functions of power and logarithmic functions were used to fit the process of sand hydraulic conductivity values with infiltration duration for the first 20 min and for 20–90 min, respectively. Validation of the segmented function model used treatments with muddy water sand contents of 5% and 10%, respectively. The validation results demonstrate that the model has high reliability and accuracy.
(4) In the case of sand, the average rate of change of hydraulic conductivity (ΔK) of each treatment gradually decreased as infiltration duration increased, and the higher the S of muddy water, the higher the ΔK at a particular infiltration duration. The rates of change of hydraulic conductivity converged after 80 min. The ΔK showed a highly significant power function relationship at different sand contents and infiltration durations.
(5) The cumulative infiltration of the saturated sandy soil column increases over time, though the rate of increase diminishes. Cumulative infiltration and infiltration duration had a power function relationship. As the S increased, both the fitting coefficient of cumulative infiltration α and the fitting exponent of cumulative infiltration β of the power function model decreased. This study contributes to the development and application of muddy water irrigation theory.

Author Contributions

Conceptualization, L.F.; methodology, S.K. and Z.Y.; software, P.Z. and Z.Y.; validation, Q.W. and L.L.; formal analysis, S.K., P.Z., Q.F. and L.L.; investigation, L.F.; resources, L.F.; data curation, S.K., Z.Y., P.Z. and Q.F.; writing—original draft preparation, S.K.; writing—review and editing, S.K. and Q.W.; visualization, L.L.; supervision, Q.F.; project administration, L.F.; funding acquisition, L.F. and S.K. All authors have read and agreed to the published version of the manuscript.

Funding

This research was supported by the National Natural Science Foundation of China (52079105), the Science and Technology Planning Project of Shaanxi Provincial Department of Water Resources (2023SLKJ-2), and the Doctoral Dissertations Innovation Fund of Xi’an University of Technology (310-252072107).

Data Availability Statement

The original contributions presented in the study are included in the article; further inquiries can be directed to the corresponding author.

Conflicts of Interest

The authors declare that they have no conflicts of interest in this research.

References

  1. Albers, L.T.; Schyns, J.F.; Booij, M.J.; Zhuo, L. Blue Water Footprint Caps per Sub-Catchment to Mitigate Water Scarcity in a Large River Basin: The Case of the Yellow River in China. J. Hydrol. 2021, 603, 126992. [Google Scholar] [CrossRef]
  2. Zhao, X.; Xia, H.; Pan, L.; Song, H.; Niu, W.; Wang, R.; Li, R.; Bian, X.; Guo, Y.; Qin, Y. Drought Monitoring over Yellow River Basin from 2003–2019 Using Reconstructed MODIS Land Surface Temperature in Google Earth Engine. Remote Sens. 2021, 13, 3748. [Google Scholar] [CrossRef]
  3. Xie, M.; Ren, Z.; Li, Z.; Zhang, X.; Ma, X.; Li, P.; Shen, Z. Evolution of the Precipitation-Stream Runoff Relationship in Different Precipitation Scenarios in the Yellow River Basin. Urban Clim. 2023, 51, 101609. [Google Scholar] [CrossRef]
  4. Zhong, D.; Dong, Z.; Fu, G.; Bian, J.; Kong, F.; Wang, W.; Zhao, Y. Trend and Change Points of Streamflow in the Yellow River and Their Attributions. J. Water Clim. Chang. 2021, 12, 136–151. [Google Scholar] [CrossRef]
  5. Ye, Z.; Miao, P.; Li, N.; Wang, Y.; Meng, F.; Zhang, R.; Yin, S. Dynamic Relationship between Agricultural Water Use and the Agricultural Economy in the Inner Mongolia Section of the Yellow River Basin. Sustainability 2023, 15, 12979. [Google Scholar] [CrossRef]
  6. Zhang, F.; Jin, G.; Liu, G. Evaluation of Virtual Water Trade in the Yellow River Delta, China. Sci. Total Environ. 2021, 784, 147285. [Google Scholar] [CrossRef] [PubMed]
  7. Zhang, B.; Niu, N.; Li, H.; Tao, H.-W.; Wang, Z.-H. Mapping the Virtual Water Trade in Water-Scarce Basin: An Environmentally Extended Input-Output Analysis in the Yellow River Basin of China. Environ. Sci. Pollut. Res. 2023, 30, 118396–118409. [Google Scholar] [CrossRef] [PubMed]
  8. Lu, W.; Guo, X.; Liu, W.; Du, R.; Chi, S.; Zhou, B. Spatial-Temporal Dynamic Evolution and Influencing Factors of Green Efficiency of Agricultural Water Use in the Yellow River Basin, China. Water 2023, 15, 143. [Google Scholar] [CrossRef]
  9. Wang, K.; Zhou, J.; Tan, M.L.; Lu, P.; Xue, Z.; Liu, M.; Wang, X. Impacts of Vegetation Restoration on Soil Erosion in the Yellow River Basin, China. Catena 2024, 234, 107547. [Google Scholar] [CrossRef]
  10. Zhao, H.; Lin, Y.; Zhou, J.; Delang, C.O.; He, H. Simulation of Holocene Soil Erosion and Sediment Deposition Processes in the Yellow River Basin during the Holocene. Catena 2022, 219, 106600. [Google Scholar] [CrossRef]
  11. Xiao, Y.; Guo, B.; Lu, Y.; Zhang, R.; Zhang, D.; Zhen, X.; Chen, S.; Wu, H.; Wei, C.; Yang, L.; et al. Spatial-Temporal Evolution Patterns of Soil Erosion in the Yellow River Basin from 1990 to 2015: Impacts of Natural Factors and Land Use Change. Geomat. Nat. Hazards Risk 2021, 12, 103–122. [Google Scholar] [CrossRef]
  12. Zhao, H.; Zhang, F.; Yu, Z.; Li, J. Spatiotemporal Variation in Soil Degradation and Economic Damage Caused by Wind Erosion in Northwest China. J. Environ. Manag. 2022, 314, 115121. [Google Scholar] [CrossRef] [PubMed]
  13. Wang, S.; Wang, X. Changes in Water and Sediment Processes in the Yellow River and Their Responses to Ecological Protection during the Last Six Decades. Water 2023, 15, 2285. [Google Scholar] [CrossRef]
  14. Zhang, J.; Han, Y.; Wang, X.; Bian, H. Experimental Investigation of the Dynamic Characteristics of Treated Silt Using Lignin: Case Study of Yellow River Flood Basin. Int. J. Geomech. 2021, 21, 04021056. [Google Scholar] [CrossRef]
  15. Wang, Y.; Wang, Z.; Chen, Y.; Cao, T.; Yu, X.; Rui, P. Experimental Study on Bio-Treatment Effect of the Dredged Yellow River Silt Based on Soybean Urease Induced Calcium Carbonate Precipitation. J. Build. Eng. 2023, 75, 106943. [Google Scholar] [CrossRef]
  16. Wu, X.; Feng, X.; Fu, B.; Yin, S.; He, C. Managing Erosion and Deposition to Stabilize a Silt-Laden River. Sci. Total Environ. 2023, 881, 163444. [Google Scholar] [CrossRef] [PubMed]
  17. Jia, C.; Allinson, G.; Bai, X.; Gong, Z.; Li, X. Comparison of the Leaching Characteristics of Magnesium-Rich Dust-Polluted Soil in Northeast China Treated with PAM and Citric Acid. J. Soils Sediments 2023, 23, 2083–2095. [Google Scholar] [CrossRef]
  18. Cui, Z.; Huang, Z.; Luo, J.; Qiu, K.; Lopez-Vicente, M.; Wu, G.-L. Litter Cover Breaks Soil Water Repellency of Biocrusts, Enhancing Initial Soil Water Infiltration and Content in a Semi-Arid Sandy Land. Agric. Water Manag. 2021, 255, 107009. [Google Scholar] [CrossRef]
  19. Liao, Y.; Dong, L.; Li, A.; Lv, W.; Wu, J.; Zhang, H.; Bai, R.; Liu, Y.; Li, J.; Shangguan, Z.; et al. Soil Physicochemical Properties and Crusts Regulate the Soil Infiltration Capacity after Land-Use Conversions from Farmlands in Semiarid Areas. J. Hydrol. 2023, 626, 130283. [Google Scholar] [CrossRef]
  20. Sun, F.; Xiao, B.; Kidron, G.J. Towards the Influences of Three Types of Biocrusts on Soil Water in Drylands: Insights from Horizontal Infiltration and Soil Water Retention. Geoderma 2022, 428, 116136. [Google Scholar] [CrossRef]
  21. Atashpaz, B.; Khormali, F.; Malekzadeh, E.; Soleymanzadeh, M. Evaluating the Effect of Different Sequences of Biological Crusts on Loess Derived Soil Biophysiological Properties in the Semi-Arid Regions of Northern Iran. J. Soil Sci. Plant Nutr. 2023, 23, 6777–6787. [Google Scholar] [CrossRef]
  22. Negyesi, G.; Szabo, S.; Buro, B.; Mohammed, S.; Loki, J.; Rajkai, K.; Holb, I.J. Influence of Soil Moisture and Crust Formation on Soil Evaporation Rate: A Wind Tunnel Experiment in Hungary. Agronomy 2021, 11, 935. [Google Scholar] [CrossRef]
  23. Jiang, R.; Fei, L.; Kang, S. Water and Nitrogen Transport Characteristics of Single-Line Interference Infiltration under Film Hole Irrigation with Muddy Water and Fertilizer. J. Drain. Irrig. Mach. Eng. 2022, 40, 496–503. [Google Scholar] [CrossRef]
  24. Liu, L.; Fei, L.; Chen, L.; Hao, K.; Zhang, Q. Effects of Initial Soil Moisture Content on Soil Water and Nitrogen Transport under Muddy Water Film Hole Infiltration. Int. J. Agric. Biol. Eng. 2021, 14, 182–189. [Google Scholar] [CrossRef]
  25. Zhong, Y.; Fei, L.; Zhu, S.; He, J.; Kang, S. Effect of Sediment Concentration of Muddy Water on One-Dimensional Vertical Infiltration Characteristics and Dense Layer Formation Characteristics. Soils 2022, 54, 602–609. [Google Scholar] [CrossRef]
  26. Nasirian, A.; Maghrebi, M.F.; Mohtashami, A. Numerical and Experimental Assessment of Suspended Material Effects on Water Loss Reduction from Irrigation Channels. Iran. J. Sci. Technol.-Trans. Civ. Eng. 2022, 46, 2483–2493. [Google Scholar] [CrossRef]
  27. Rumynin, V.G.; Sindalovskiy, L.N.; Nikulenkov, A.M. Analytical Solutions for Flow and Advective Solute Transport in Unconfined Watershed Aquifers with Depth-Dependent Hydraulic Conductivity. J. Hydrol. 2021, 603, 127116. [Google Scholar] [CrossRef]
  28. Iden, S.C.; Blocher, J.R.; Diamantopoulos, E.; Durner, W. Capillary, Film, and Vapor Flow in Transient Bare Soil Evaporation (1): Identifiability Analysis of Hydraulic Conductivity in the Medium to Dry Moisture Range. Water Resour. Res. 2021, 57, e2020WR028513. [Google Scholar] [CrossRef]
  29. O’Keeffe, A.; Shrestha, D.; Dunkel, C.; Brooks, E.; Heinse, R. Modeling Moisture Redistribution from Selective Non-Uniform Application of Biochar on Palouse Hills. Agric. Water Manag. 2023, 277, 108026. [Google Scholar] [CrossRef]
  30. Rabouli, S.; Serre, M.; Dubois, V.; Gance, J.; Henine, H.; Molle, P.; Truffert, C.; Delgado-Gonzalez, L.; Clement, R. Spatialization of Saturated Hydraulic Conductivity Using the Bayesian Maximum Entropy Method: Application to Wastewater Infiltration Areas. Water Res. 2021, 204, 117607. [Google Scholar] [CrossRef]
  31. Obour, P.B.; Ugarte, C.M. A Meta-Analysis of the Impact of Traffic-Induced Compaction on Soil Physical Properties and Grain Yield. Soil Tillage Res. 2021, 211, 105019. [Google Scholar] [CrossRef]
  32. Chen, L.; Ming, F.; Zhang, X.; Wei, X.; Liu, Y. Comparison of the Hydraulic Conductivity between Saturated Frozen and Unsaturated Unfrozen Soils. Int. J. Heat Mass Transf. 2021, 165, 120718. [Google Scholar] [CrossRef]
  33. Ferreira, T.R.; Archilha, N.L.; Cassaro, F.A.M.; Pires, L.F. How Can Pore Characteristics of Soil Aggregates from Contrasting Tillage Systems Affect Their Intrinsic Permeability and Hydraulic Conductivity? Soil Tillage Res. 2023, 230, 105704. [Google Scholar] [CrossRef]
  34. Seyedsadr, S.; Sipek, V.; Jacka, L.; Snehota, M.; Beesley, L.; Pohorely, M.; Kovar, M.; Trakal, L. Biochar Considerably Increases the Easily Available Water and Nutrient Content in Low-Organic Soils Amended with Compost and Manure. Chemosphere 2022, 293, 133586. [Google Scholar] [CrossRef]
  35. Francos, N.; Chabrillat, S.; Tziolas, N.; Milewski, R.; Brell, M.; Samarinas, N.; Angelopoulou, T.; Tsakiridis, N.; Liakopoulos, V.; Ruhtz, T.; et al. Estimation of Water-Infiltration Rate in Mediterranean Sandy Soils Using Airborne Hyperspectral Sensors. Catena 2023, 233, 107476. [Google Scholar] [CrossRef]
  36. Tzimopoulos, C.; Papadopoulos, K.; Samarinas, N.; Papadopoulos, B.; Evangelides, C. Fuzzy Finite Elements Solution Describing Recession Flow in Unconfined Aquifers. Hydrology 2024, 11, 47. [Google Scholar] [CrossRef]
  37. Dong, L.; Zhang, W.; Xiong, Y.; Zou, J.; Huang, Q.; Xu, X.; Ren, P.; Huang, G. Impact of Short-Term Organic Amendments Incorporation on Soil Structure and Hydrology in Semiarid Agricultural Lands. Int. Soil Water Conserv. Res. 2022, 10, 457–469. [Google Scholar] [CrossRef]
  38. Ming, F.; Pei, W.; Zhang, M.; Chen, L. A Hydraulic Conductivity Model of Frozen Soils with the Consideration of Water Films. Eur. J. Soil Sci. 2022, 73, e13210. [Google Scholar] [CrossRef]
  39. Sun, F.; Xiao, B.; Kidron, G.J.; Heitman, J.L. Insights about Biocrust Effects on Soil Gas Transport and Aeration in Drylands: Permeability, Diffusivity, and Their Connection to Hydraulic Conductivity. Geoderma 2022, 427, 116137. [Google Scholar] [CrossRef]
  40. Freeze, R.A. Henry Darcy and the Fountains of Dijon. Groundwater 2010, 32, 23–30. [Google Scholar] [CrossRef]
  41. Mao, H.; Zhang, C.; He, T.; Gu, Y. Influences of Seepage of Muddy Water on the Permeability of Coarse-Grained Soil. Trans. Chin. Soc. Agric. Eng. 2022, 38, 140–150. [Google Scholar] [CrossRef]
  42. Kostiakov, A.N. On the Dynamics of the Coefficient of Water-Percolation in Soils and on the Necessity of Studying It from a Dynamic Point of View for Purposes of Amelioration. In Proceedings of the Transactions of 6th Committee International Society of Soil Science, Moscow, Russia, 1932; pp. 17–21. [Google Scholar]
  43. Wang, H.; Sun, H.; Huang, Z.; Ge, X. A Microstructural Investigation on Hydraulic Conductivity of Soft Clay. Bull. Eng. Geol. Environ. 2021, 80, 4067–4078. [Google Scholar] [CrossRef]
  44. Zheng, W.; Hu, X.; Tannant, D.D.; Zhou, B. Quantifying the Influence of Grain Morphology on Sand Hydraulic Conductivity: A Detailed Pore-Scale Study. Comput. Geotech. 2021, 135, 104147. [Google Scholar] [CrossRef]
  45. Wen, T.; Chen, X.; Luo, Y.; Shao, L.; Niu, G. Three-Dimensional Pore Structure Characteristics of Granite Residual Soil and Their Relationship with Hydraulic Properties under Different Particle Gradation by X-Ray Computed Tomography. J. Hydrol. 2023, 618, 129230. [Google Scholar] [CrossRef]
  46. Zhai, Q.; Rahardjo, H.; Satyanaga, A.; Zhu, Y.; Dai, G.; Zhao, X. Estimation of Wetting Hydraulic Conductivity Function for Unsaturated Sandy Soil. Eng. Geol. 2021, 285, 106034. [Google Scholar] [CrossRef]
  47. Ghanbarian, B. Unsaturated Hydraulic Conductivity in Dual-Porosity Soils: Percolation Theory. Soil Tillage Res. 2021, 212, 105061. [Google Scholar] [CrossRef]
  48. Sun, F.; Xiao, B.; Li, S.; Yu, X.; Kidron, G.J.; Heitman, J. Direct Evidence and Mechanism for Biocrusts-Induced Improvements in Pore Structure of Dryland Soil and the Hydrological Implications. J. Hydrol. 2023, 623, 129846. [Google Scholar] [CrossRef]
  49. Shi, W.; Pan, Y.; Zhang, Y.; Hu, R.; Wang, X. The Effect of Different Biocrusts on Soil Hydraulic Properties in the Tengger Desert, China. Geoderma 2023, 430, 116304. [Google Scholar] [CrossRef]
  50. Wang, Y.-B.; Huang, Z.; Qian, J.-X.; Li, T.; Luo, J.; Li, Z.; Qiu, K.; Lopez-Vicente, M.; Wu, G.-L. Freeze-Thaw Cycles Aggravated the Negative Effects of Moss-Biocrusts on Hydraulic Conductivity in Sandy Land. Catena 2021, 207, 105638. [Google Scholar] [CrossRef]
  51. Zambon, N.; Johannsen, L.L.; Strauss, P.; Dostal, T.; Zumr, D.; Cochrane, T.A.; Klik, A. Splash Erosion Affected by Initial Soil Moisture and Surface Conditions under Simulated Rainfall. Catena 2021, 196, 104827. [Google Scholar] [CrossRef]
  52. Qiu, D.; Xiao, B.; Kidron, G.J. Ecohydrological Influences of Biocrusts and Their Pathways in a Desert Steppe Ecosystem. Ecohydrology 2023, 16, e2581. [Google Scholar] [CrossRef]
Figure 1. Schematic diagram of experimental apparatus: (a) is a schematic diagram, while (b) is a photograph of the actual object.
Agronomy 14 01545 g001
Figure 2. Changes in soil structure after infiltration of muddy water.
Agronomy 14 01545 g002
Figure 3. Hydraulic conductivity curves under different soil textures. The left y-axis corresponds to the F1 and F2 curves, and the right y-axis corresponds to the T2 curve.
Agronomy 14 01545 g003
Figure 4. Curves of hydraulic conductivity under different sand contents.
Agronomy 14 01545 g004
Figure 5. Measured and calculated values of hydraulic conductivity.
Agronomy 14 01545 g005
Figure 6. Trend in average rate of change of hydraulic conductivity.
Agronomy 14 01545 g006
Figure 7. Change in cumulative infiltration over time for each treatment.
Agronomy 14 01545 g007
Table 1. Properties of test materials.
MaterialParticle Composition/%TextureOrganic Matter/(g·kg−1)Bulk Density (g·cm−3)
<0.002 mm0.002~<0.02 mm0.02~2 mm
Soil9.4653.6636.88Silt loam7.241.35
4.8721.2173.92Sandy loam7.641.40
1.046.5092.46Sand11.861.76
Sediment in muddy water4.2242.1453.64
Table 2. Physical and chemical properties of sediment.
ItemSediment Characteristic
Physical PropertiesChemical Properties
Median Diameter/mmCoefficient of UniformityMean Diameter/mmNa+/
(g·kg−1)
Ca2+/
(g·kg−1)
pHOrganic Matter
/(g·kg−1)
Values0.02310.410.0290.190.057.504.32
Table 3. Experimental program.
TreatmentSoil TextureSand Content/%Note
F1Silt loam6Soil texture
F2Sandy loam
T2Sand
T1Sandy soil3Sand content
T26
T39
T412
T5Sandy soil4Verification tests
T610
Table 4. One-way ANOVA results.
Soil TextureAverage Values/
(cm·min−1)
Coefficients of Variation/%p-Values of Sources of VariationLeast Significant Difference Values/
(cm·min−1)
Significant
Difference
Sandy soil0 min0.38230.070.00 *0.00100*
20 min0.07090.42*
30 min0.03821.05*
Silt loam0 min0.00341.620.00 *0.00018*
20 min0.00320.95*
30 min0.00301.17*
Sandy loam0 min0.01241.620.00 *0.00003*
20 min0.01160.95*
30 min0.01091.17*
Note: The significance of the p-value was tested at the 0.05 level of significance. Multiple comparisons were conducted using the Tukey test, with ‘*’ indicating significance tested at the 0.05 level.
Table 5. Fitting parameters of hydraulic conductivity and infiltration duration for each treatment.
TreatmentSand Content/%abR2RMSEcdR2RMSE
T130.4005−0.19650.91500.7764−0.08480.44300.98560.0300
T260.3951−0.61020.98000.2129−0.02140.13020.97940.0016
T390.3716−0.73900.94450.1472−0.01930.11760.99100.0006
T4120.3705−0.81820.95770.1256−0.00900.06770.90420.0001
Note: The fitting process for a and b used the portion of Equation (7) where t ≤ 20 min, while c and d used the portion of Equation (7) where t > 20 min.
Table 6. Relationship of each fitting parameters as a function of sand content.
Fitting ParameterFitting FunctionR2RMSE
a a = 0.4136 e 0.0100 S 0.88320.0054
b b = 0.0665 S + 0.0925 0.86610.1012
c c = 0.4138 S 1.5110 0.98020.0056
d d = 1.6604 S 1.2830 0.97490.0320
Table 7. Fitting parameters of change in average rate of change of hydraulic conductivity (ΔK) and infiltration duration (t) for each treatment.
TreatmentSand Content/%pqR2RMSE
T130.0348−0.47400.97630.0007
T260.1968−0.86100.98420.0027
T390.2200−0.88200.93150.0079
T4120.2272−0.88400.94950.0075
Table 8. Fitting parameters of cumulative infiltration and infiltration duration for each treatment.
TreatmentSand Content/%αβR2RMSE
T130.88100.73940.98590.9884
T260.64320.62300.95210.4972
T390.63270.55640.98930.0758
T4120.54410.54260.98810.0723
Disclaimer/Publisher’s Note: The statements, opinions and data contained in all publications are solely those of the individual author(s) and contributor(s) and not of MDPI and/or the editor(s). MDPI and/or the editor(s) disclaim responsibility for any injury to people or property resulting from any ideas, methods, instructions or products referred to in the content.

