
Ecophysiological Recovery of Micropropagated Olive Cultivars: Field Research in an Irrigated Super-High-Density Orchard

Abstract
:1. Introduction
2. Material and Methods
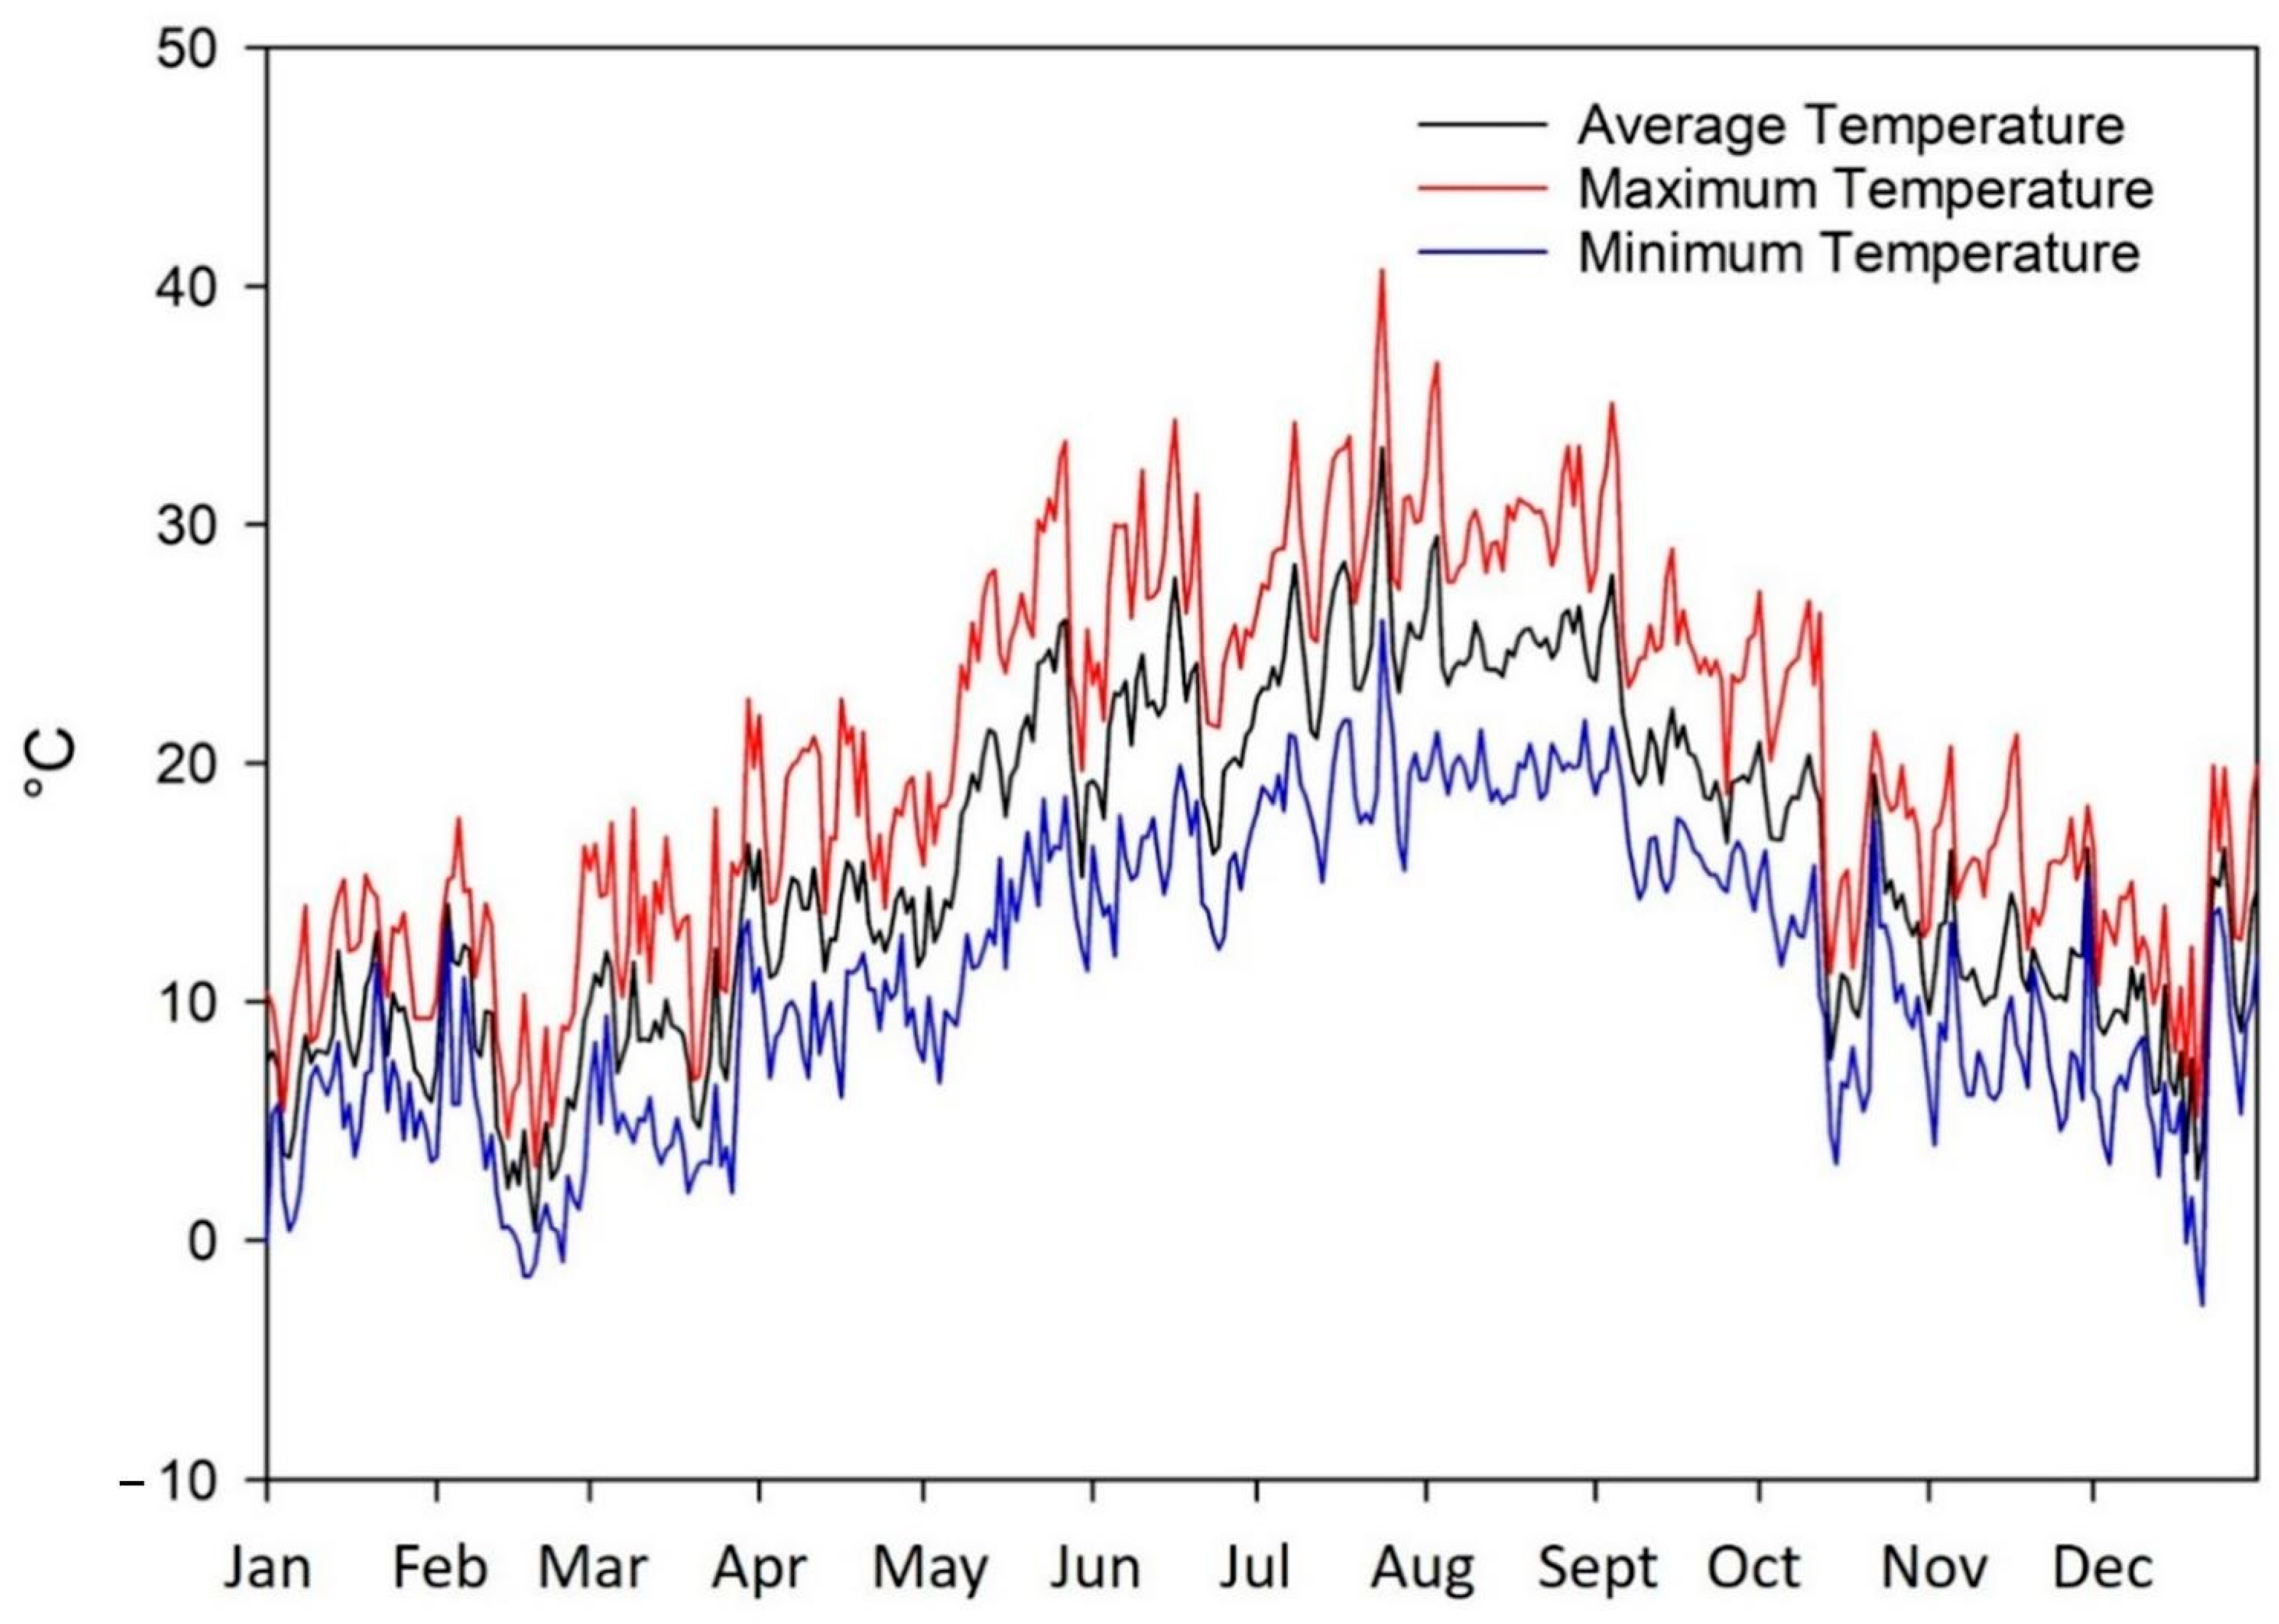
2.1. Site and Climatic Conditions
2.2. Plant Material and Experimental Design
2.3. Agro-Climatic Parameters
2.4. Irrigation and Crop Management
2.5. Ecophysiological Parameters
2.6. Statistical Analysis
3. Results
3.1. Agrometeorological Data and Irrigation
3.2. Interactions
3.3. Ecophysiological Recovery
3.3.1. ‘Arbequina’
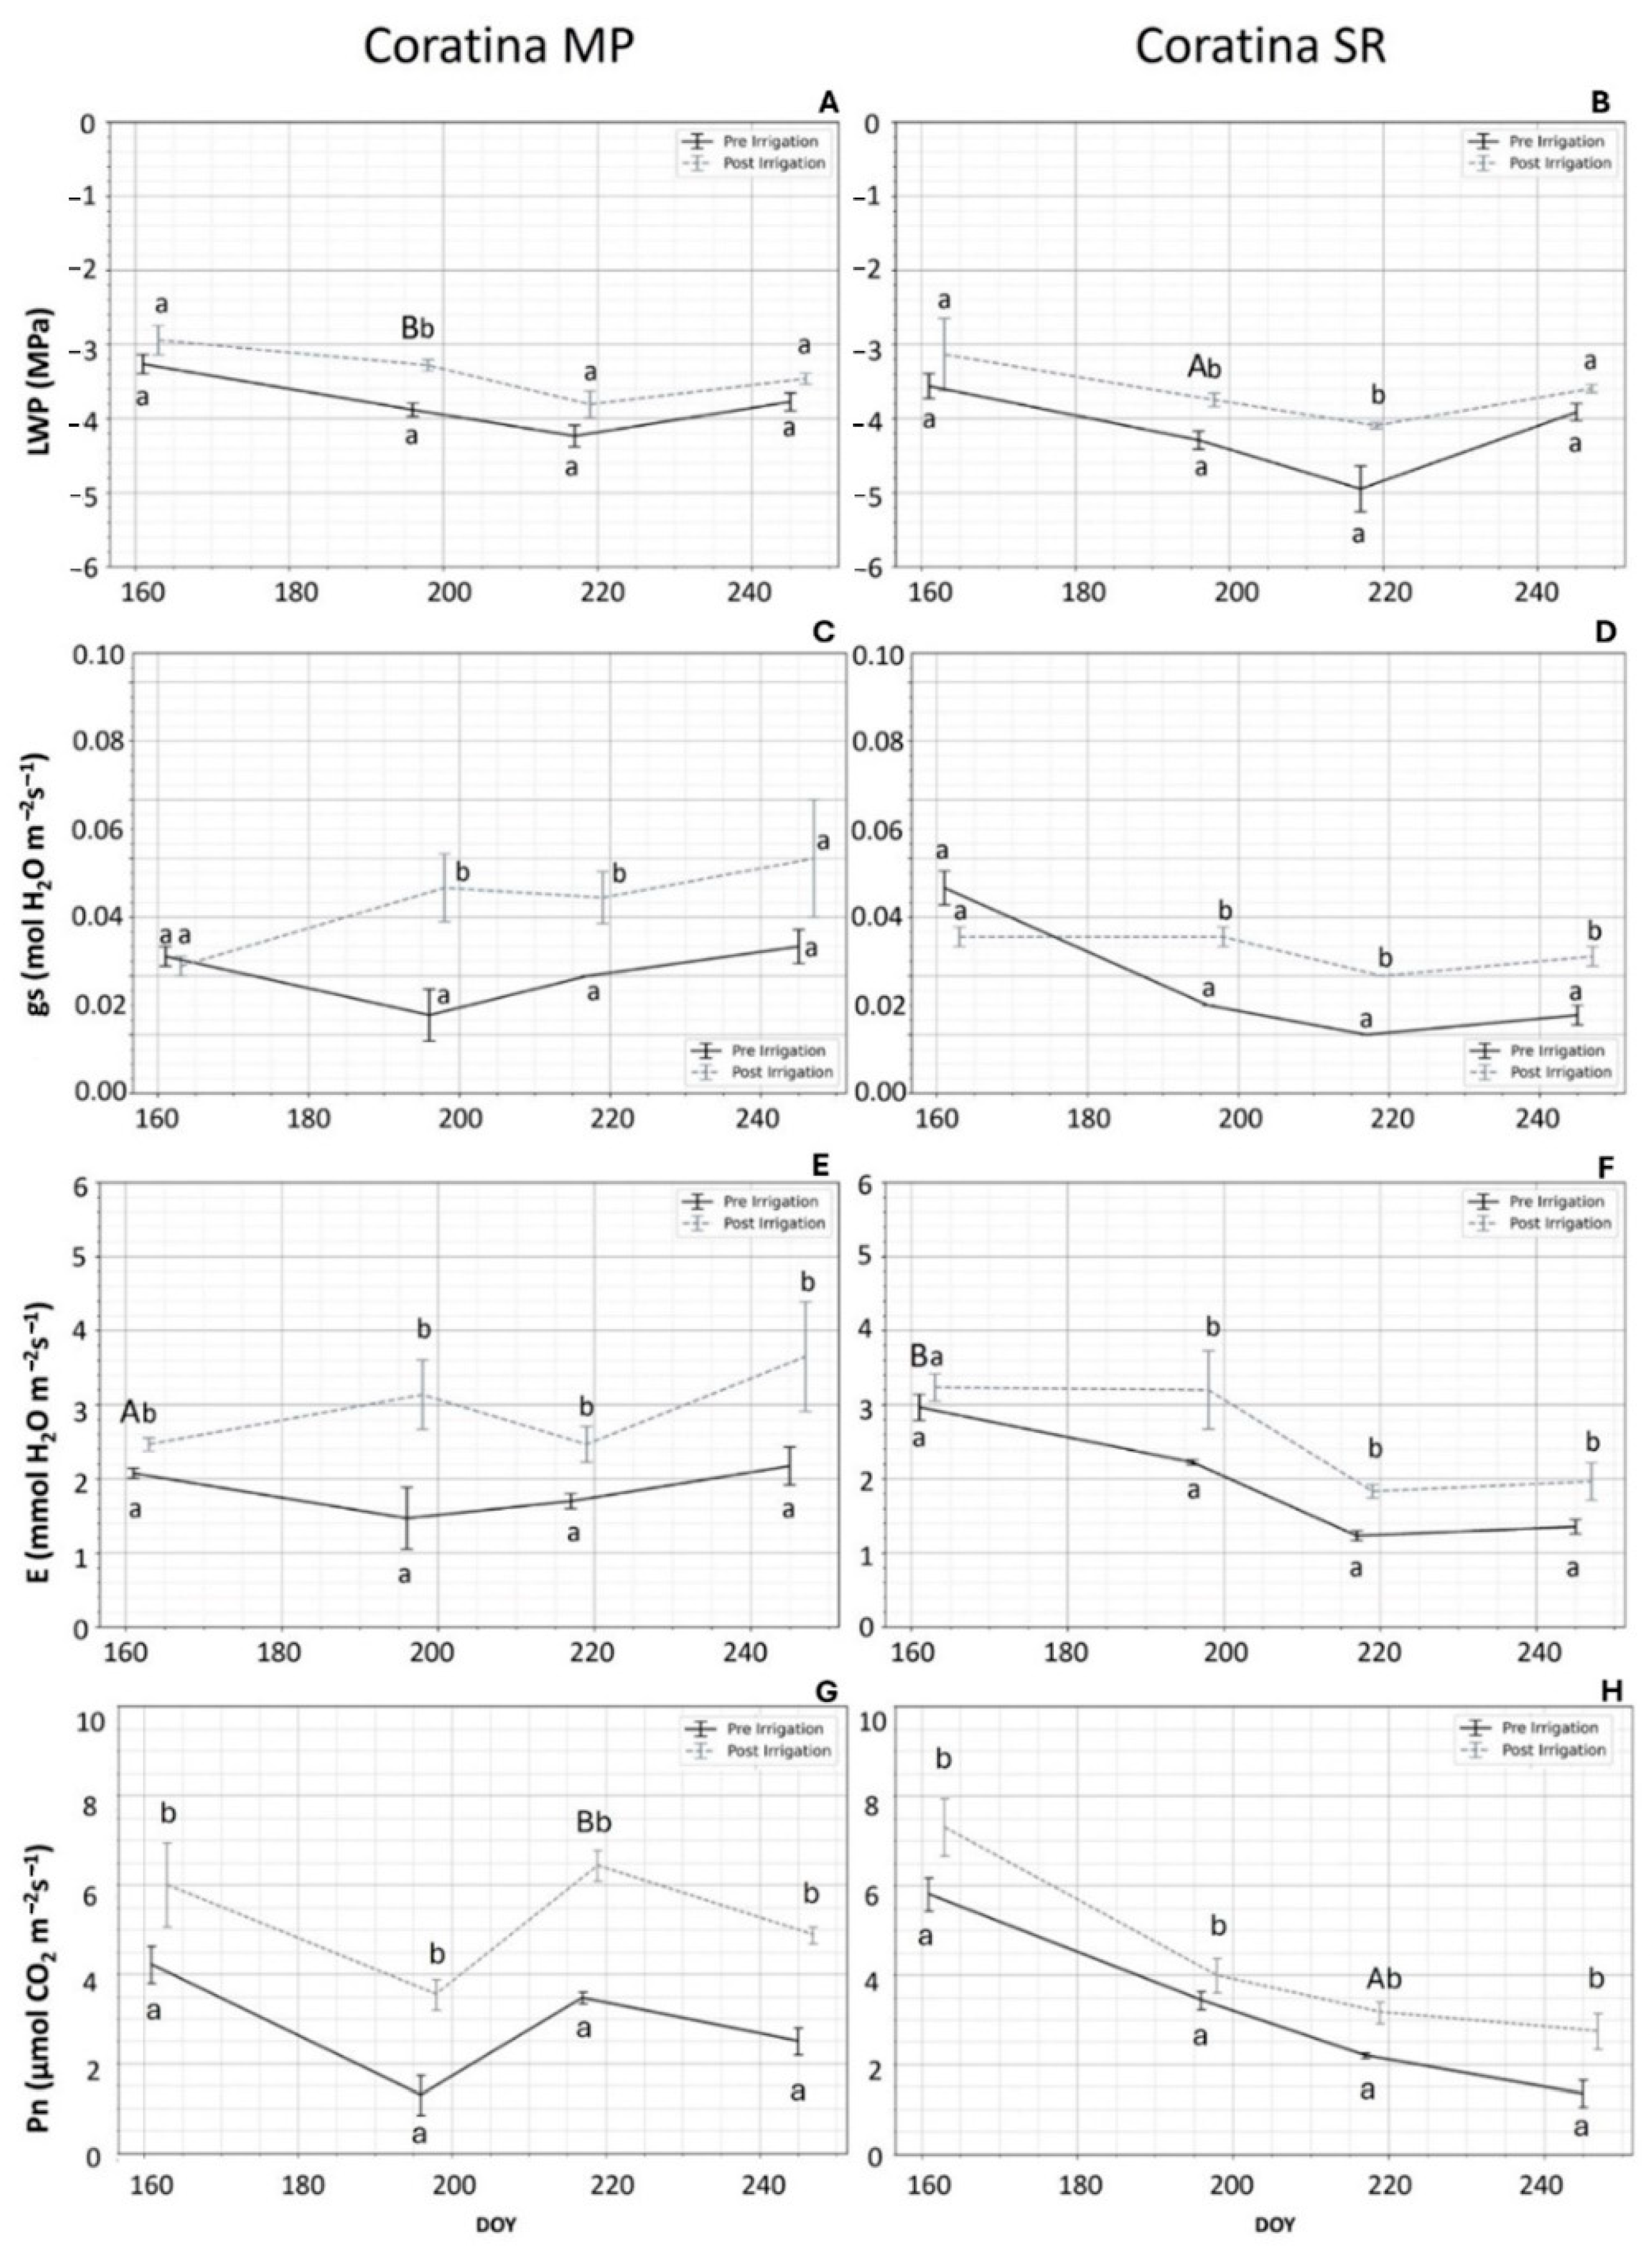
3.3.2. ‘Coratina’
3.3.3. ‘Frantoio’
3.3.4. ‘Urano’
3.4. Correlations
4. Discussion
4.1. ‘Arbequina’
4.2. ‘Coratina’
4.3. ‘Frantoio’
4.4. ‘Urano’
5. Conclusions
Author Contributions
Funding
Data Availability Statement
Conflicts of Interest
References
- Garofalo, S.P.; Giannico, V.; Costanza, L.; Alhajj Ali, S.; Camposeo, S.; Lopriore, G.; Pedrero Salcedo, F.; Vivaldi, G.A. Prediction of Stem Water Potential in Olive Orchards Using High-Resolution Planet Satellite Images and Machine Learning Techniques. Agronomy 2024, 14, 1. [Google Scholar] [CrossRef]
- Scharwies, J.D.; Dinneny, J.R. Water Transport, Perception, and Response in Plants. J. Plant Res. 2019, 132, 311–324. [Google Scholar] [CrossRef] [PubMed]
- Garofalo, S.P.; Intrigliolo, D.S.; Camposeo, S.; Alhajj Ali, S.; Tedone, L.; Lopriore, G.; De Mastro, G.; Vivaldi, G.A. Agronomic Responses of Grapevines to an Irrigation Scheduling Approach Based on Continuous Monitoring of Soil Water Content. Agronomy 2023, 13, 2821. [Google Scholar] [CrossRef]
- Carr, M.K.V. The Water Relations and Irrigation Requirements of Olive (Olea europaea L.): A Review. Exp. Agric. 2013, 49, 597–639. [Google Scholar] [CrossRef]
- Sofo, A.; Manfreda, S.; Fiorentino, M.; Dichio, B.; Xiloyannis, C. The Olive Tree: A Paradigm for Drought Tolerance in Mediterranean Climates. Hydrol. Earth Syst. Sci. 2008, 12, 293–301. [Google Scholar] [CrossRef]
- Garofalo, S.P.; Giannico, V.; Lorente, B.; García, A.J.G.; Vivaldi, G.A.; Thameur, A.; Salcedo, F.P. Predicting Carob Tree Physiological Parameters under Different Irrigation Systems Using Random Forest and Planet Satellite Images. Front. Plant Sci. 2024, 15, 1302435. [Google Scholar] [CrossRef] [PubMed]
- Ahumada-Orellana, L.E.; Ortega-Farías, S.; Searles, P.S. Olive Oil Quality Response to Irrigation Cut-off Strategies in a Super-High Density Orchard. Agric. Water Manag. 2018, 202, 81–88. [Google Scholar] [CrossRef]
- Kaniewski, D.; Marriner, N.; Morhange, C.; Khater, C.; Terral, J.F.; Besnard, G.; Otto, T.; Luce, F.; Couillebault, Q.; Tsitsou, L.; et al. Climate Change Threatens Olive Oil Production in the Levant. Nat. Plants 2023, 9, 219–227. [Google Scholar] [CrossRef] [PubMed]
- Villalobos, F.J.; López-Bernal, Á.; García-Tejera, O.; Testi, L. Is Olive Crop Modelling Ready to Assess the Impacts of Global Change? Front. Plant Sci. 2023, 14, 1249793. [Google Scholar] [CrossRef] [PubMed]
- Pulighe, G. Trapped in The Past: The Decline of Italian Olive Groves in the Face of Traditional Visions and Policies, Emerging Challenges and Innovation. Agric. Rural Stud. 2023, 1, 0007. [Google Scholar] [CrossRef]
- Elloumi, O.; Benmoussa, H.; Ben Ammar, F.; Mohamed, A.; Abichou, M.; Ben Mimoun, M.; Ghrab, M. Olive Growing in Arid Area: Further Challenges from Climate Change. J. Oasis Agric. Sustain. Dev. 2022, 4, 169–173. [Google Scholar] [CrossRef]
- Miller, C.A. Incorporating Sustainability into Climate Change Adaptation; Elsevier: Amsterdam, The Netherlands, 2017; Volume 1, ISBN 9780128046777. [Google Scholar]
- Tataranni, G.; Santarcangelo, M.; Sofo, A.; Xiloyannis, C.; Tyerman, S.D.; Dichio, B. Correlations between Morpho-Anatomical Changes and Radial Hydraulic Conductivity in Roots of Olive Trees under Water Deficit and Rewatering. Tree Physiol. 2015, 35, 1356–1365. [Google Scholar] [CrossRef] [PubMed]
- Masmoudi, C.C.; Ayachi, M.M.; Gouia, M.; Laabidi, F.; Reguaya, S.B.; Amor, A.O.; Bousnina, M. Water Relations of Olive Trees Cultivated under Deficit Irrigation Regimes. Sci. Hortic. 2010, 125, 573–578. [Google Scholar] [CrossRef]
- D’Andria, R.; Lavini, A.; Alvino, A.; Tognetti, R. Effects of Deficit Irrigation on Water Relations of Olive Trees (Olea europaea L. Cultivars Frantoio and Leccino). Acta Hortic. 2008, 792, 217–223. [Google Scholar] [CrossRef]
- Ahumada-Orellana, L.; Ortega-Farías, S.; Poblete-Echeverría, C.; Searles, P.S. Estimation of Stomatal Conductance and Stem Water Potential Threshold Values for Water Stress in Olive Trees (Cv. Arbequina). Irrig. Sci. 2019, 37, 461–467. [Google Scholar] [CrossRef]
- Ahumada-Orellana, L.; Ortega-Farias, S.; Searles, P.S.; Zúñiga, M. Leaf Gas Exchange, Water Status, and Oil Yield Responses to Rewatering after Irrigation Cut-off Periods in a Superintensive Drip-Irrigated Olive (Cv. Arbequina) Orchard. Irrig. Sci. 2023, 41, 557–570. [Google Scholar] [CrossRef]
- Fernández, J.E. Understanding Olive Adaptation to Abiotic Stresses as a Tool to Increase Crop Performance. Environ. Exp. Bot. 2014, 103, 158–179. [Google Scholar] [CrossRef]
- Miserere, A.; Cecilia Rousseaux, M.; Ploschuk, E.L.; Magdalena Brizuela, M.; Curcio, M.H.; Zabaleta, R.; Searles, P.S. Effects of Prolonged Elevated Temperature on Leaf Gas Exchange and Other Leaf Traits in Young Olive Trees. Tree Physiol. 2021, 41, 254–268. [Google Scholar] [CrossRef] [PubMed]
- Iglesias, M.A.; Rousseaux, M.C.; Agüero Alcaras, L.M.; Hamze, L.; Searles, P.S. Influence of Deficit Irrigation and Warming on Plant Water Status during the Late Winter and Spring in Young Olive Trees. Agric. Water Manag. 2023, 275, 108030. [Google Scholar] [CrossRef]
- Diaz-Espejo, A.; Fernández, J.E.; Torres-Ruiz, J.M.; Rodriguez-Dominguez, C.M.; Perez-Martin, A.; Hernandez-Santana, V. The Olive Tree under Water Stress; Academic Press: Cambridge, MA, USA, 2018; ISBN 9780128131640. [Google Scholar]
- Valdés-Gómez, H.; Guajardo, A.; Jara-Rojas, F.; Acevedo-Opazo, C.; Taylor, J.A. Study of the Within-Plant Spatial Variability of Stomatal Conductance on a Young ‘Arbequina’ Olive Orchard under Drip-Irrigated and Semi-Arid Conditions. Idesia 2015, 33, 43–48. [Google Scholar] [CrossRef]
- Proietti, P.; Nasini, L.; Ilarioni, L. Photosynthetic Behavior of Spanish Arbequina and Italian Maurino Olive (Olea europaea L.) Cultivars under Super-Intensive Grove Conditions. Photosynthetica 2012, 50, 239–246. [Google Scholar] [CrossRef]
- Vitagliano, C.; Sebastiani, L. Physiological and Biochemical Remarks on Environmental Stress in Olive (Olea europaea L.). Acta Hortic. 2002, 586, 435–441. [Google Scholar] [CrossRef]
- López-Bernal, Á.; García-Tejera, O.; Vega, V.A.; Hidalgo, J.C.; Testi, L.; Orgaz, F.; Villalobos, F.J. Using Sap Flow Measurements to Estimate Net Assimilation in Olive Trees under Different Irrigation Regimes. Irrig. Sci. 2015, 33, 357–366. [Google Scholar] [CrossRef]
- Massenti, R.; Ioppolo, A.; Veneziani, G.; Selvaggini, R.; Servili, M.; Lo Bianco, R.; Caruso, T. Low Tree Vigor, Free Palmette Training Form, and High Planting Density Increase Olive and Oil Yield Efficiency in Dry, Sloping Areas of Mediterranean Regions. Horticulturae 2022, 8, 817. [Google Scholar] [CrossRef]
- Rufat, J.; Romero-Aroca, A.J.; Arbones, A.; Villar, J.M.; Hermoso, J.F.; Pascual, M. Mechanical Harvesting and Irrigation Strategy Responses on ‘Arbequina’ Olive Oil Quality. Horttechnology 2018, 28, 607–614. [Google Scholar] [CrossRef]
- Gómez-del-Campo, M. Summer Deficit-Irrigation Strategies in a Hedgerow Olive Orchard Cv. “Arbequina”: Effect on Fruit Characteristics and Yield. Irrig. Sci. 2013, 31, 259–269. [Google Scholar] [CrossRef]
- Camposeo, S.; Vivaldi, G.A.; Russo, G.; Melucci, F.M. Intensification in Olive Growing Reduces Global Warming Potential under Both Integrated and Organic Farming. Sustainability 2022, 14, 6389. [Google Scholar] [CrossRef]
- Trentacoste, E.R.; Connor, D.J.; Gómez-Del-campo, M. Response of Oil Production and Quality to Hedgerow Design in Super-High-Density Olive Cv. Arbequina Orchards. Agronomy 2021, 11, 1632. [Google Scholar] [CrossRef]
- Trentacoste, E.R.; Connor, D.J.; Gómez-del-Campo, M. Effect of Row Spacing on Vegetative Structure, Fruit Characteristics and Oil Productivity of N-S and E-W Oriented Olive Hedgerows. Sci. Hortic. 2015, 193, 240–248. [Google Scholar] [CrossRef]
- Trentacoste, E.R.; Connor, D.J.; Gómez-del-Campo, M. Row Orientation: Applications to Productivity and Design of Hedgerows in Horticultural and Olive Orchards. Sci. Hortic. 2015, 187, 15–29. [Google Scholar] [CrossRef]
- Connor, D.J.; Gómez-del-Campo, M. Simulation of Oil Productivity and Quality of N-S Oriented Olive Hedgerow Orchards in Response to Structure and Interception of Radiation. Sci. Hortic. 2013, 150, 92–99. [Google Scholar] [CrossRef]
- Saponari, M.; Boscia, D.; Martelli, G.P. Xylella Fastidiosa, a New Phytosanitary Threat for Olive Crops. Acta Hortic. 2018, 1199, 251–254. [Google Scholar] [CrossRef]
- Saponari, M.; Loconsole, G.; Cornara, D.; Yokomi, R.K.; De Stradis, A.; Boscia, D.; Bosco, D.; Martelli, G.P.; Krugner, R.; Porcelli, F. Infectivity and Transmission of Xylella fastidiosa by Philaenus spumarius (Hemiptera: Aphrophoridae) in Apulia, Italy. J. Econ. Entomol. 2014, 107, 1316–1319. [Google Scholar] [CrossRef] [PubMed]
- Camposeo, S.; Vivaldi, G.A.; Montemurro, C.; Fanelli, V.; Canal, M.C. Lecciana, a New Low-Vigour Olive Cultivar Suitable for Super High Density Orchards and for Nutraceutical Evoo Production. Agronomy 2021, 11, 2154. [Google Scholar] [CrossRef]
- Proietti, P.; Nasini, L.; Reale, L.; Caruso, T.; Ferranti, F. Productive and Vegetative Behavior of Olive Cultivars in Super High-Density Olive Grove. Sci. Agric. 2015, 72, 20–27. [Google Scholar] [CrossRef]
- Tous, J.; Romero, A.; Hermoso, J.F.; Msallem, M.; Larbi, A. Olive Orchard Design and Mechanization: Present and Future. Acta Hortic. 2014, 1057, 231–246. [Google Scholar] [CrossRef]
- Maldera, F.; Carone, V.; Castellarnau, I.I.; Vivaldi, G.A.; Camposeo, S. Available PAR, Growth and Yield of a Super High-Density Almond Orchard Are Influenced by Different Row Orientations. Agronomy 2023, 13, 874. [Google Scholar] [CrossRef]
- Montesinos, Á.; Maldera, F.; Thorp, G.T.; Rubio-Cabetas, M.J. Scion–Rootstock Combination Determines Pruning Responses in Young Almond Trees. HortScience 2024, 59, 1–7. [Google Scholar] [CrossRef]
- Casanova-Gascón, J.; Figueras-Panillo, M.; Iglesias-Castellarnau, I.; Martín-Ramos, P. Comparison of SHD and Open-Center Training Systems in Almond Tree Orchards cv. ‘Soleta’. Agronomy 2019, 9, 874. [Google Scholar] [CrossRef]
- Martín-Tornero, E.; Fernández, A.; Pérez-Rodriguez, J.M.; Durán-Merás, I.; Prieto, M.H.; Martín-Vertedor, D. Non-Destructive Fluorescence Spectroscopy as a Tool for Discriminating Between Olive Oils According to Agronomic Practices and for Assessing Quality Parameters. Food Anal. Methods 2022, 15, 253–265. [Google Scholar] [CrossRef]
- Antónia Nunes, M.; Páscoa, R.N.M.J.; Alves, R.C.; Costa, A.S.G.; Bessada, S.; Oliveira, M.B.P.P. Fourier Transform near Infrared Spectroscopy as a Tool to Discriminate Olive Wastes: The Case of Monocultivar Pomaces. Waste Manag. 2020, 103, 378–387. [Google Scholar] [CrossRef] [PubMed]
- Camposeo, S.; Stellacci, A.M.; Romero Trigueros, C.; Alhajj Ali, S.; Vivaldi, G.A. Different Suitability of Olive Cultivars Resistant to Xylella Fastidiosa to the Super-Intensive Planting System. Agronomy 2022, 12, 3157. [Google Scholar] [CrossRef]
- Neri, D.; Cioccolanti, T.; Zuccherelli, G.; Navacchi, O.; Giorgi, V.; Lodolini, E.M. Micropropagation Effects on Juvenile Traits, Flower Differentiation, and Tree Architecture in Young Olive Trees. Agronomy 2020, 10, 1742. [Google Scholar] [CrossRef]
- Avidan, B.; Birger, R.; Abed-El-Hadi, F.; Salmon, O.; Hekster, O.; Friedman, Y.; Lavee, S. Adopting Vigorous Olive Cultivars to High Density Hedgerow Cultivation by Soil Applications of Uniconazol, a Gibberellin Synthesis Inhibitor. Span. J. Agric. Res. 2011, 9, 821. [Google Scholar] [CrossRef]
- Marín, J.A.; Castillo, M.; García, E.; Andreu, P. Field Performance of Grafted Fruit-Tree Rootstocks Was Not Affected by Micropropagation. Acta Hortic. 2003, 616, 295–299. [Google Scholar] [CrossRef]
- Bekir Erol, A.; İbrahim Halil, H.; Birgül, D.D. Propagation of Fruit Trees. In Recent Headways in Pomology; Iksad Publishing House: Ankara, Turkey, 2021; pp. 55–92. ISBN 978-625-7562-09-6. [Google Scholar]
- Albrecht, U.; Bodaghi, S.; Meyering, B.; Bowman, K.D. Influence of Rootstock Propagation Method on Traits of Grafted Sweet Orange Trees. HortScience 2020, 55, 729–737. [Google Scholar] [CrossRef]
- Luiz, A.; De Souza, K.; Schuch, M.W.; Camargo, S.S. Does Propagation Method Affect the Eld Performance of Peach Trees? Semin. Ciênc. Agrár. 2017, 38, 2815–2821. [Google Scholar] [CrossRef]
- Lambardi, M.; National, I.; Jain, S.M. Micropropagation of Gerbera (Gerbera jamesonii Bolus). In Protocols for Micropropagation of Selected Economically-Important Horticultural Plants; Humana Press: Totowa, NJ, USA, 2013; Volume 994, pp. 305–316. [Google Scholar] [CrossRef]
- Binet, M.N.; Lemoine, M.C.; Martin, C.; Chambon, C.; Gianinazzi, S. Micropropagation of Olive (Olea europaea L.) and Application of Mycorrhiza to Improve Plantlet Establishment. Vitr. Cell. Dev. Biol.-Plant 2007, 43, 473–478. [Google Scholar] [CrossRef]
- Regni, L.; Micheli, M.; Del Pino, A.M.; Palmerini, C.A.; D’Amato, R.; Facchin, S.L.; Famiani, F.; Peruzzi, A.; Mairech, H.; Proietti, P. The First Evidence of the Beneficial Effects of Se-Supplementation on in Vitro Cultivated Olive Tree Explants. Plants 2021, 10, 1630. [Google Scholar] [CrossRef] [PubMed]
- Regni, L.; Facchin, S.L.; da Silva, D.F.; De Cesaris, M.; Famiani, F.; Proietti, P.; Micheli, M. Neem Oil to Reduce Zeatin Use and Optimize the Rooting Phase in Olea europaea L. Micropropagation. Plants 2023, 12, 576. [Google Scholar] [CrossRef] [PubMed]
- Díaz-Rueda, P.; Cantos-Barragán, M.; Colmenero-Flores, J.M. Growth Quality and Development of Olive Plants Cultured in Vitro under Different Illumination Regimes. Plants 2021, 10, 2214. [Google Scholar] [CrossRef] [PubMed]
- Mirzaei, L.; Yadollahi, A.; Kermani, M.J.; Naderpour, M.; Zeinanloo, A.A.; Farsi, M.; Davoodi, D. Evaluation of Genetic Stability in Olive Callus-Induced and Meristem-Induced Shoots Using Flow Cytometry and Amplified Fragment Length Polymorphism Techniques. Plant Methods 2021, 17, 31. [Google Scholar] [CrossRef] [PubMed]
- Rugini, E.; Cristofori, V.; Silvestri, C. Genetic Improvement of Olive (Olea europaea L.) by Conventional and in Vitro Biotechnology Methods. Biotechnol. Adv. 2016, 34, 687–696. [Google Scholar] [CrossRef] [PubMed]
- Garcia-Ferriz, L.; Ghorbel, R.R.; Mari, A.; Belaj, M.Y.A.; Trujillo, I. Micropropagation from Adult Olive Trees. Acta Hortic. 2002, 586, 879–882. [Google Scholar] [CrossRef]
- Lambardi, M.; Rugini, E. Micropropagation of Olive (Olea europaea L.). In Micropropagation of Woody Trees and Fruits; Springer: Dordrecht, The Netherlands, 2003; pp. 621–646. [Google Scholar] [CrossRef]
- Lodolini, E.M.; Tarragoni, A.; Cioccolanti, T.; Pollastri, L.; Neri, D. Architectural Characteristics of Six Olive Cultivars with Respect to Their Suitability for High Density Orchards. Acta Hortic. 2017, 1160, 127–134. [Google Scholar] [CrossRef]
- Lavee, S. Biennial Bearing in Olive (Olea europaea). Ann. Ser. Hist. Nat. 2007, 17, 101. [Google Scholar]
- Maldera, F.; Costanza, L.; Vivaldi, G.A. Micropropagation Affects Tree Architecture of Two Olive Cultivars: A Field Evaluation. Acta Hortic. 2024, in press. [Google Scholar]
- INC Nuts & Dried Fruits Statistical Yearbook 2020/2021; INC International Nut and Dried Fruit Council: Tarragona, Spain, 2021; pp. 1–78.
- Strack, T.; Schmidt, D.; Stoll, M. Impact of Steep Slope Management System and Row Orientation on Canopy Microclimate. Comparing Terraces to Downslope Vineyards. Agric. For. Meteorol. 2021, 307, 108515. [Google Scholar] [CrossRef]
- Camposeo, S.; Vivaldi, G.A.; Gattullo, C.E. Ripening Indices and Harvesting Times of Different Olive Cultivars for Continuous Harvest. Sci. Hortic. 2013, 151, 1–10. [Google Scholar] [CrossRef]
- Sanz-Cortés, F.; Martinez-Calvo, J.; Badenes, M.L.; Bleiholder, H.; Hack, H.; Llacer, G.; Meier, U. Phenological Growth Stages of Olive Trees (Olea europaea). Ann. Appl. Biol. 2002, 140, 151–157. [Google Scholar] [CrossRef]
- Ortega-Farías, S.; López-Olivari, R. Validation of a Two-Layer Model to Estimate Latent Heat Flux and Evapotranspiration in a Drip-Irrigated Olive Orchard. Am. Soc. Agric. Biol. Eng. 2012, 55, 1169–1178. [Google Scholar] [CrossRef]
- Abidi, W.; Akrimi, R.; Gouiaa, M. Mitigating Drought Stress by Plant-Derived Biostimulant in Arbequina Olive (Olea europeae L.) Cultivar Conducted in Super High Density. Acta Physiol. Plant. 2023, 45, 132. [Google Scholar] [CrossRef]
- Niinemets, Ü.; Keenan, T. Photosynthetic Responses to Stress in Mediterranean Evergreens: Mechanisms and Models. Environ. Exp. Bot. 2014, 103, 24–41. [Google Scholar] [CrossRef]
- Proietti, P.; Famiani, F. Diurnal and Seasonal Changes in Photosynthetic Characteristics in Differnet Olive Cultivars. Photosynthetica 2002, 40, 171–176. [Google Scholar] [CrossRef]
- Godini, A.; Vivaldi, G.A.; Camposeo, S. Olive Cultivars Field-Tested in Super-High-Density System in Southern Italy. Calif. Agric. 2011, 65, 39–40. [Google Scholar] [CrossRef]


| LWP | gs | E | Pn | |
|---|---|---|---|---|
| R | *** | *** | *** | *** |
| cv | *** | n.s. | ** | n.s. |
| PM | * | * | n.s. | n.s. |
| R × cv | n.s. | n.s. | n.s. | n.s. |
| R × PM | n.s. | n.s. | n.s. | n.s. |
| cv × PM | * | n.s. | n.s. | n.s. |
| R × cv × PM | n.s. | n.s. | n.s. | n.s. |
| Cultivar | Propagation | gs vs. Pn | gs vs. LWP | E vs. LWP |
|---|---|---|---|---|
| ‘Arbequina’ | Micropropagated | 0.38 | 0.20 | 0.31 |
| Self-rooted | 0.33 | 0.25 | 0.26 | |
| ‘Coratina’ | Micropropagated | 0.22 | 0.20 | 0.34 |
| Self-rooted | 0.63 *** | 0.66 *** | 0.56 ** | |
| ‘Frantoio’ | Micropropagated | 0.73 *** | 0.44 * | 0.18 |
| Self-rooted | 0.87 *** | 0.53 ** | 0.64 *** | |
| ‘Urano’ | Micropropagated | 0.62 ** | 0.54 ** | 0.42 * |
| Self-rooted | 0.45 * | 0.21 | 0.12 |
Disclaimer/Publisher’s Note: The statements, opinions and data contained in all publications are solely those of the individual author(s) and contributor(s) and not of MDPI and/or the editor(s). MDPI and/or the editor(s) disclaim responsibility for any injury to people or property resulting from any ideas, methods, instructions or products referred to in the content. |
© 2024 by the authors. Licensee MDPI, Basel, Switzerland. This article is an open access article distributed under the terms and conditions of the Creative Commons Attribution (CC BY) license (https://creativecommons.org/licenses/by/4.0/).
Share and Cite
Maldera, F.; Garofalo, S.P.; Camposeo, S. Ecophysiological Recovery of Micropropagated Olive Cultivars: Field Research in an Irrigated Super-High-Density Orchard. Agronomy 2024, 14, 1560. https://doi.org/10.3390/agronomy14071560
Maldera F, Garofalo SP, Camposeo S. Ecophysiological Recovery of Micropropagated Olive Cultivars: Field Research in an Irrigated Super-High-Density Orchard. Agronomy. 2024; 14(7):1560. https://doi.org/10.3390/agronomy14071560
Chicago/Turabian StyleMaldera, Francesco, Simone Pietro Garofalo, and Salvatore Camposeo. 2024. "Ecophysiological Recovery of Micropropagated Olive Cultivars: Field Research in an Irrigated Super-High-Density Orchard" Agronomy 14, no. 7: 1560. https://doi.org/10.3390/agronomy14071560