Article

Self-Incompatibility and Pollination Efficiency in Coffea canephora Using Fluorescence Microscopy

by
Adriele Nunes Rodrigues Silva
1,
Rodrigo Barros Rocha
2,3,*,
Alexsandro Lara Teixeira
2,3,
Marcelo Curitiba Espindula
2,3,
Fábio Luiz Partelli
4 and
Eveline Teixeira Caixeta
2,5
1
Graduate Program in Regional Development and Environment (PGDRA), Federal University of Rondônia, Porto Velho 76801-974, RO, Brazil
2
Brazilian Agricultural Research Corporation (EMBRAPA Coffee), Brasília 70770-901, DF, Brazil
3
Instituto Capixaba de Pesquisa, Assistência Técnica e Extensão Rural (INCAPER), Vitória 29052-010, ES, Brazil
4
Department of Agricultural and Biological Sciences, Centro Universitário Norte do Espírito Santo (CEUNES), Federal University of Espírito Santo (UFES), São Mateus 29932-900, ES, Brazil
5
Coffee Biotechnology Laboratory (BIOAGRO), Federal University of Viçosa, Viçosa 36570-900, MG, Brazil
*
Author to whom correspondence should be addressed.
Agronomy 2024, 14(7), 1564; https://doi.org/10.3390/agronomy14071564
Submission received: 31 May 2024 / Revised: 8 July 2024 / Accepted: 9 July 2024 / Published: 18 July 2024
(This article belongs to the Section Crop Breeding and Genetics)

Abstract

:
In nature, the ability to avoid self-fertilization has evolved to prevent the deleterious effects of inbreeding. However, under cultivation conditions, self-incompatibility can reduce the pollination efficiency of Coffea canephora. The objective of this study was to characterize the self-incompatibility expression of the most cultivated genotypes in Western Amazonia, to improve the management of this coffee plant. In vitro pollinations were conducted among 45 genotypes, and the development of pollen tubes was evaluated using fluorescence microscopy. Pollination efficiency was evaluated considering the allelic variability within a breeding population from an ideal condition of maximum genetic variability. Based on the compatibility response, the genotypes were organized into six groups: group I (24.4%), group II (31.1%), group III (24.4%), group IV (2.2%), group V (2.2%), and group VI (15.6%). The lower frequencies of groups IV, V, and VI were associated with the lower frequency of the rarest allelic forms in this breeding population (p = 0.36, q = 0.26, r = 0.29, and s = 0.10). The correspondence between allelic and genotypic frequencies indicates that this population is in Hardy–Weinberg equilibrium (HWE) for this trait. Considering the cultivation of 2 to 10 clones, the population studied showed intermediate pollination efficiency between an ideal HWE population with p = q = r = s = 0.25 and a population with the rarest allelic forms (p = 0.48, q = 0.32, r = 0.19, s = 0.01). Efficiency estimates were stabilized from the cultivation of five clones, indicating that cultivating a minimum number of clones should be considered. Theoretically, maximum pollination efficiency is achieved by representing all alleles in equal proportions, whereas in practice, farmers should ensure the cultivation of plants from different compatibility groups, without significant imbalances.

1. Introduction

Coffee cultivation is a highly significant agricultural activity in tropical regions worldwide, providing employment and income for millions of people [1]. Of the 130 known coffee species [2], only two are commercially cultivated and represent approximately 99% of global production. The species Coffea arabica L. accounts for the majority of production (56%), while Coffea canephora L. Pierre ex A. Froehner makes up the remaining 44%; both species are vulnerable to climate change [3,4]. Coffee cultivation not only sustains local economies but also plays a crucial role in the exports of various countries. C. canephora stands out for its adaptation to tropical regions, significant genetic diversity, and high production potential [5,6,7].
The advancement in coffee production in Western Amazonia can be understood through the progress of this activity in its main production region. For the 2024 harvest in the state of Rondônia, 3.1 million bags are expected, with an average yield of 51 bags per hectare, produced in an area 80% smaller than in 2001 [8].
Coffee cultivation in this region is characterized by the growth of hybrid plants, featuring traits from the Conilon and Robusta botanical varieties [9]. The Conilon variety, originating from regions close to sea level on the African continent, is known for its smaller size, higher susceptibility to pests and diseases, and greater tolerance to water scarcity [10,11]. In contrast, the Robusta variety, also from equatorial forest regions in Africa, is characterized by its larger size, lower tolerance to water deficits, and higher resistance to pests and diseases. This coffee plantation originated in the 1980s, when seeds of the Conilon botanical variety were introduced by the farmers themselves, and seeds of the Robusta botanical variety were distributed by Embrapa [12].
From this genetic base, the farmers themselves initiated a selection process that led to the widely cultivated clones [13]. Although these genetic materials are intensively cultivated, many aspects, such as plant compatibility, remain unknown. Understood as a physiological mechanism that prevents self-pollination, C. canephora is characterized by gametophytic self-incompatibility, where the interaction between the pistil tissues and pollen grains occurs, and they must not share the same allele. In this species, self-incompatibility is determined by a single gene with multiple alleles (S gene) [11].
The incompatibility of C. canephora was originally reported in the 1960s, when Devreux et al. (1959) observed the cessation of pollen tube growth [14]. Subsequently, Conagin and Mendes (1961) and Berthaud (1980) found evidence that self-incompatibility is controlled by the action of a single multiallelic gene [15,16]. Lashermes et al. (1996) identified molecular markers associated with this trait through the development of double-haploid populations, demonstrating that pollen tube development can be observed using fluorescence microscopy [17]. Nowak et al. (2011) characterized the polymorphism of this gene in other Coffea species [18]. De Franceschi et al. (2012) showed that incompatibility is due to the interaction of specific glycoproteins in the stigma of the flower and pollen grains [19]. Asquini et al. (2011) and Vieira et al. (2021) observed that the cessation of pollen tube growth is mediated by the action of ribonucleases, which degrade ribosomal RNA [20,21]. More recently, Moraes et al. (2018) identified tester plants for three compatibility groups [22]. Souza et al. (2021) detailed in vitro pollination methods associated with fluorescence microscopy for compatibility diagnosis [23]. Depolo et al. (2022) expanded the known genetic variability by identifying tester plants for new compatibility groups [24].
Surveys in the field show that the genotypes GJ8 and GJ25 are present in 89% of the plantations, while the clone GJ3 is in approximately 80% of the properties in Western Amazonia. Following this, the clone P50 is cultivated in 64% of the properties, and the genotypes GJ5, SK80, and SK41 are present in 41%, 36%, and 29% of the properties, respectively [13]. More recently, the intermediate-cycle genotypes R22, LB10, and AS2, along with the early-cycle clone LB15, have been joining this group of genotypes selected by the coffee growers themselves and intensively cultivated. In addition to the genetic materials selected by farmers, there are cultivars adapted to the conditions of Western Amazonia, which differ due to their hybrid traits and the individualized characterization of each genotype [6,9]. These previously characterized cultivars were used as tester plants in compatibility diagnosis.
Higher occurrences of peaberry beans and lower yields are associated with lower pollination efficiency. In this species, the natural occurrence of peaberry beans happens due to the pollination of only one of the two ovary chambers, resulting in fertilized beans with a rounded shape [25,26]. In clonal coffee farming, planting incompatible genotypes can compromise both productivity and grain quality due to lower pollination efficiency and an increased incidence of peaberry beans [27].
The objective of this study was to characterize the self-incompatibility expression of the most cultivated genotypes in Western Amazonia using in vitro pollination methods and fluorescence microscopy, aiming towards the improved cultivation of this coffee plant.

2. Material and Methods

2.1. Tester Plants and Breeding Population

The breeding population consisted of forty-two genotypes cultivated in the public domain in the Western Amazon, along with three accessions from the Embrapa Germplasm Bank (Table 1). Genotypes BRS 1216, BRS 2299, and BRS 3193 were used as tester plants for compatibility groups I, II, and III, respectively, while genotypes R1, R309, and R160 served as tester plants for compatibility groups IV, V, and VI, respectively [24].

2.2. In Vitro Pollination

In vitro pollination involves the laboratory transfer of pollen grains from donor plants to the stigmata of recipient plants. At the Embrapa Rondônia experimental field in Porto Velho, RO, hybridization plots were monitored daily from January 2022 to December 2023. During this period, in vitro pollination procedures were conducted on six different occasions: 17 June 2022, 21 July 2022, and 25 August 2022, 12 June 2023, 28 July 2023, and 22 August 2023, totaling 335 diagnoses (Table 2).
Pollen grain viability tests were performed in a 10% sucrose solution by immersing the anthers in 5.0 mL of 10% sucrose solution in Eppendorf tubes. Pollen grain germination was evaluated after 60 min in a Petri dish using a stereoscopic microscope (50×), with the germination rate estimated from the average of three counts. Pollen grains with a germination rate higher than 60% were considered viable for pollination.
Inflorescences were collected in gearbox-type containers the day before anthesis and transported to the Embrapa Rondônia Tissue Culture Laboratory. Anthers and petals were removed from receptive inflorescences, with their peduncle immersed in the culture medium (water, 30% sucrose, 6% bacteriological agar). Inflorescences from donor plants with closed buds had their peduncle immersed in the same culture medium. Finally, all containers were sealed with plastic film and kept in a growth chamber at 26 ± 1 °C with a photoperiod of 16 h (50 μmol.m−2.s−1).
On the day of anthesis, pollen grains were collected from donor flowers by scraping the dehiscent anthers with a scalpel. Approximately 18 anthers were scraped, and then the scalpel blade with pollen grains was gently rubbed onto one of the tips of the bifid stigma, allowing the pollen grains to adhere to the stigma.

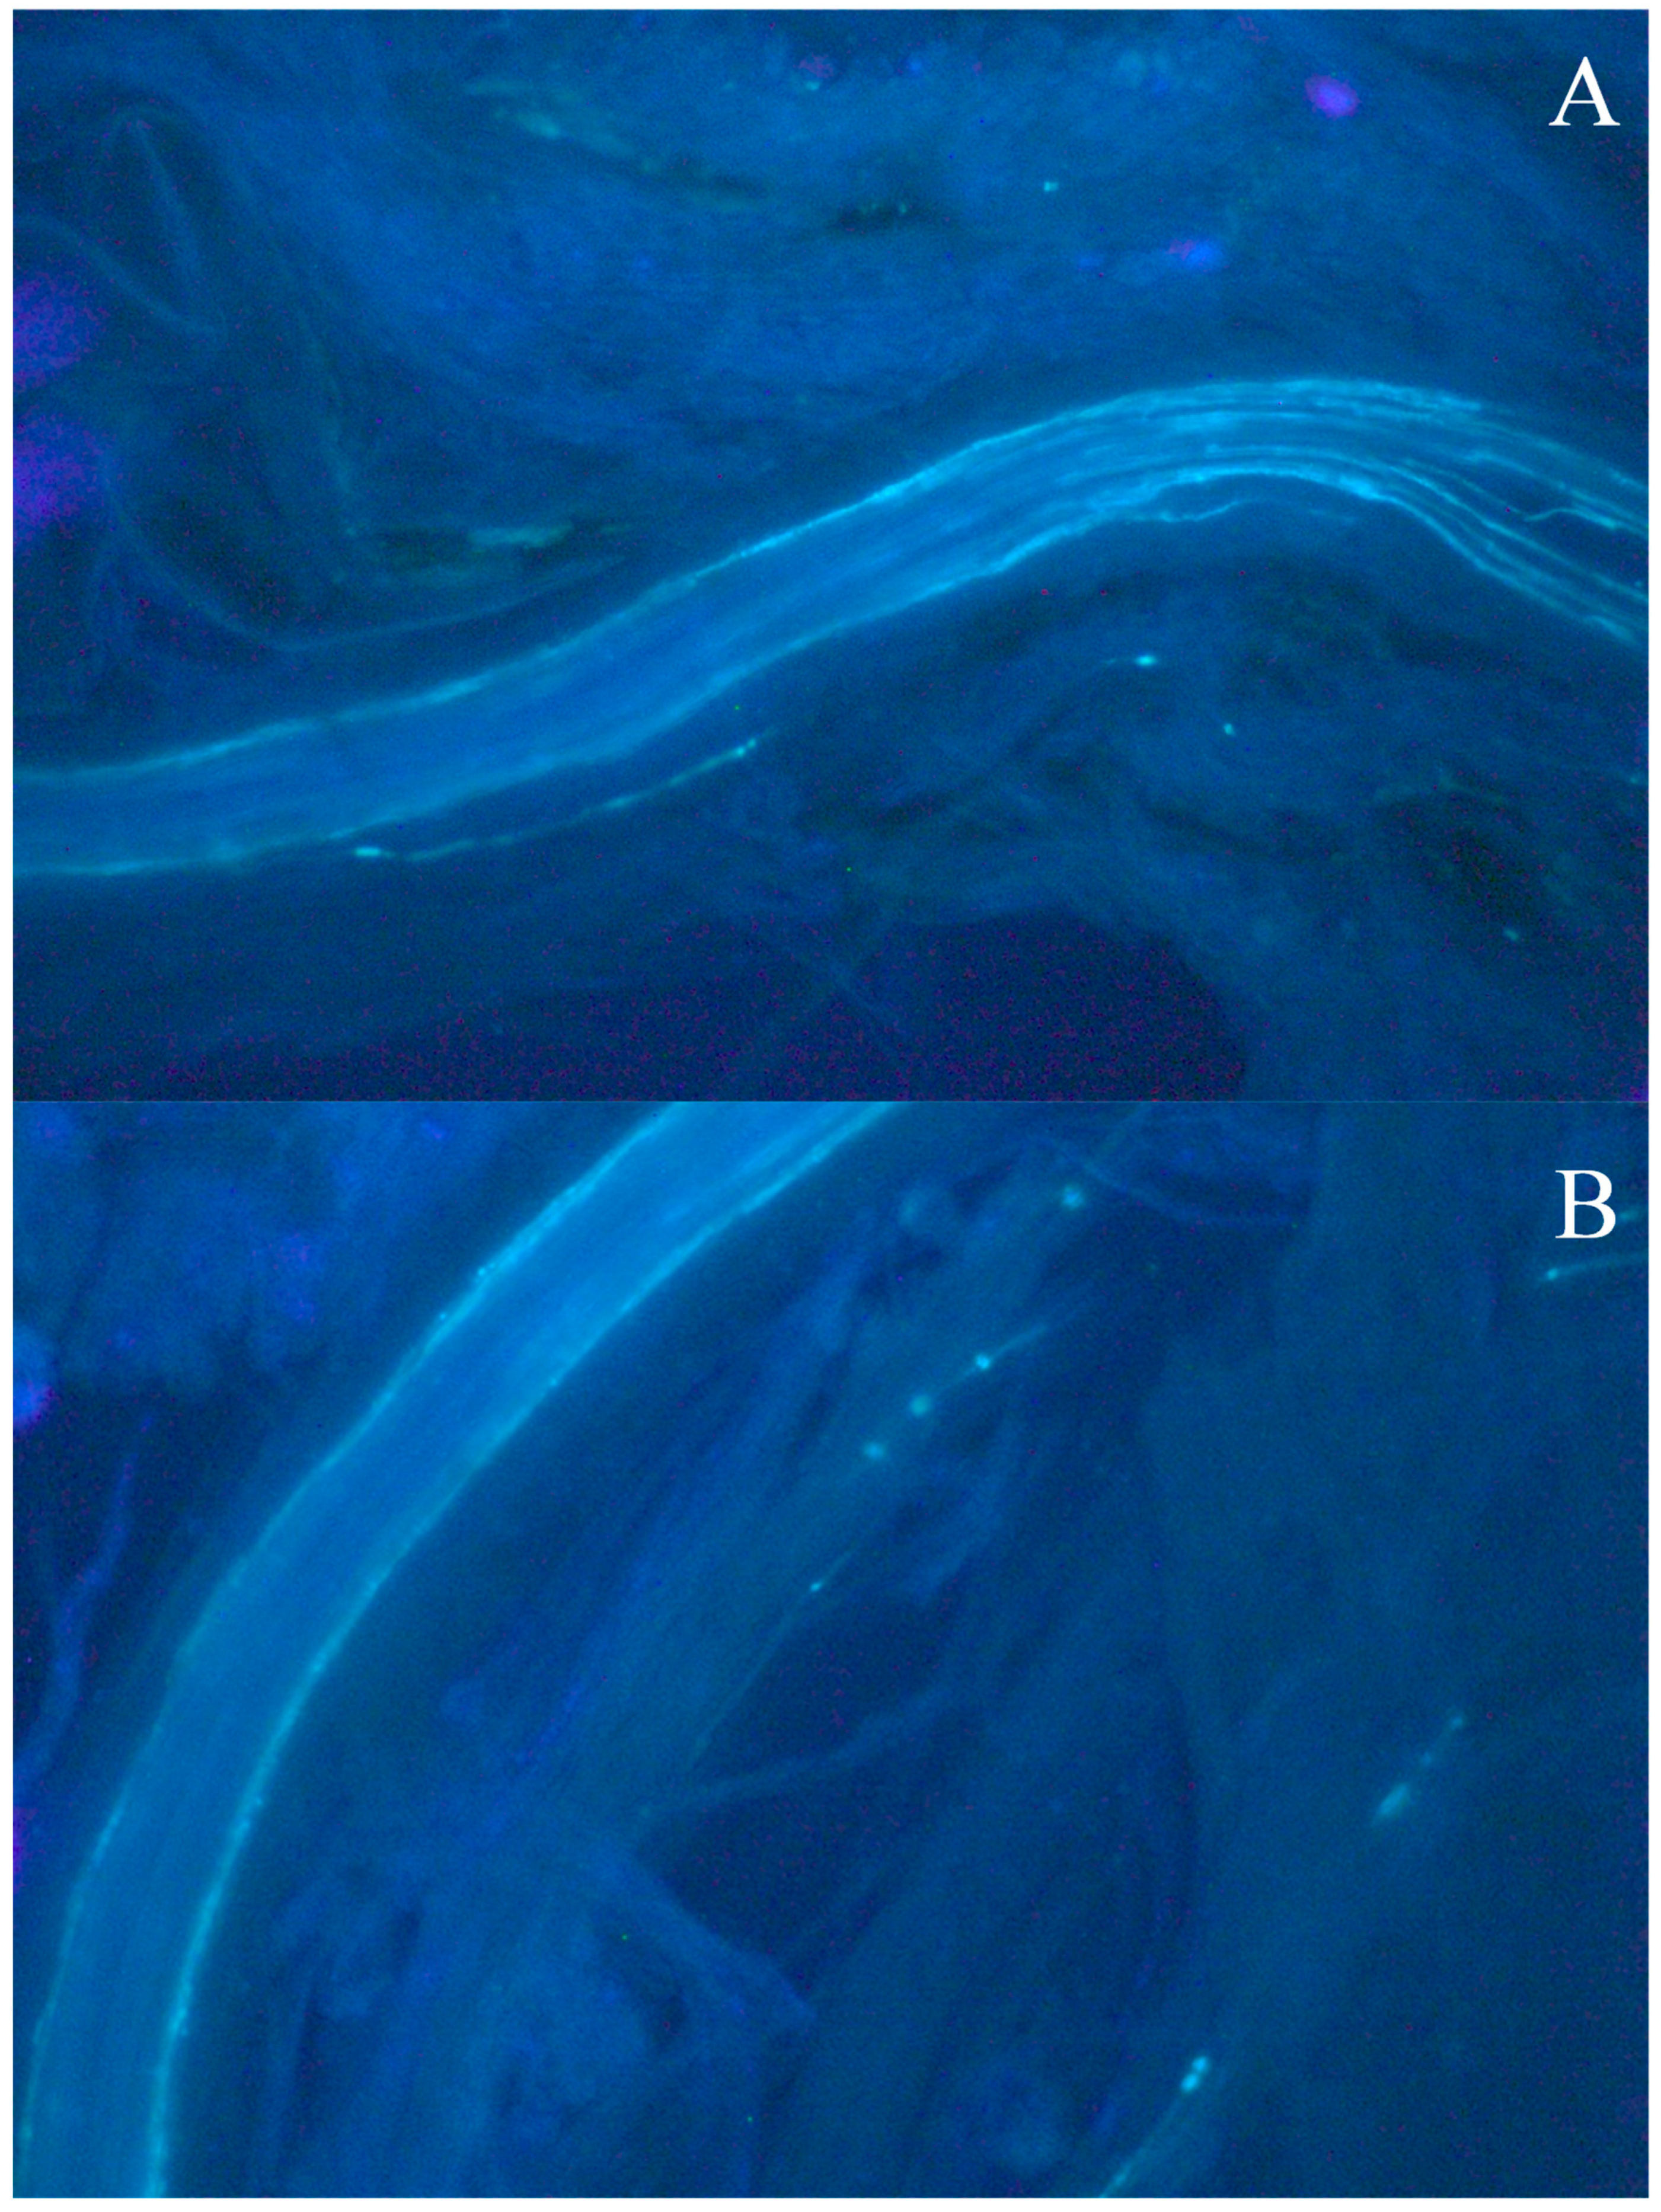
2.3. Fluorescence Microscopy

The compatibility diagnosis was carried out by observing the pollen tubes in the pistils of compatible plants. Thirty-six h after pollination, the stigmata were stored at 5 °C in 10 mL penicillin vials containing FAA solution (10% formaldehyde, 10% glacial acetic acid, and 80% ethanol).
For slide preparation, the pistils were removed from the FAA, washed with distilled water, and immersed in 1N sodium hydroxide (NaOH) for 2 h. After this period, the stigmata were washed again with distilled water and stained for 12 h using 1% aniline blue dye, prepared in a 0.1 M K2HPO4 solution.
After the softening and staining steps, the coverslip was gently pressed onto ten pistils arranged on a slide. Visualization was performed using a Leica DM2500 microscope model (Wetzlar, Germany) equipped with a photodocumentation system. The visualization was conducted at magnifications of 100 and 200 times, counting the number of pistils that showed developed pollen tubes (Figure 1 and Figure 2).
Ten pistils were visualized in each diagnosis, with cross-pollinations considered to be compatible when developed pollen tubes were observed in the style of the recipient flowers. The success rate was estimated based on the ratio of the number of observed slides to the number of slides with developed pollen tubes.
In vitro pollination enables precise control over pollen grain transfer, thereby avoiding false positive diagnoses, which arise from contamination and erroneously conclude compatibility between two genotypes. Conversely, false negative errors may occur when procedural mishaps prevent pollen tube development. Souza et al., in 2021 [23], observed error rates of 5% with the observation of ten stigmata per slide, as conducted in this evaluation.

2.4. Allelic and Genotypic Frequencies

Self-incompatibility can be understood as a pre-zygotic mechanism that influences the fertility of pollen grains, preventing any allelic form from becoming fixed in the population and ensuring that individuals are heterozygous for this gene [28]. To interpret the genotypic and allelic frequencies, the frequencies p, q, r, and s were considered in relation to the allelic forms S1, S2, S3, and S4, as follows:
P (S1S1) = p2 = 0 (incompatible pollination);
P (S1S2) = 2pq;
P (S1S3) = 2pr;
P (S1S4) = 2ps;
P (S2S2) = q2 = 0 (incompatible pollination);
P (S2S3) = 2qr;
P (S2S4) = 2qs;
P (S3S3) = r2 = 0 (incompatible pollination);
P (S3S4) = 2rs;
P (S4S4) = s2 = 0 (incompatible pollination).
The probabilities of occurrence of the genotypes were as follows:
P S 1 S 2 = 2 p q 1 p 2 q 2 r 2   ;   P S 1 S 3 = 2 p r 1 p 2 q 2 r 2 ;   P S 2 S 3 = 2 q r 1 p 2 q 2 r 2 P S 1 S 4 = 2 p s 1 p 2 q 2 r 2 ;   P S 2 S 4 = 2 q s 1 p 2 q 2 r 2 ;   P S 3 S 4 = 2 r s 1 p 2 q 2 r 2

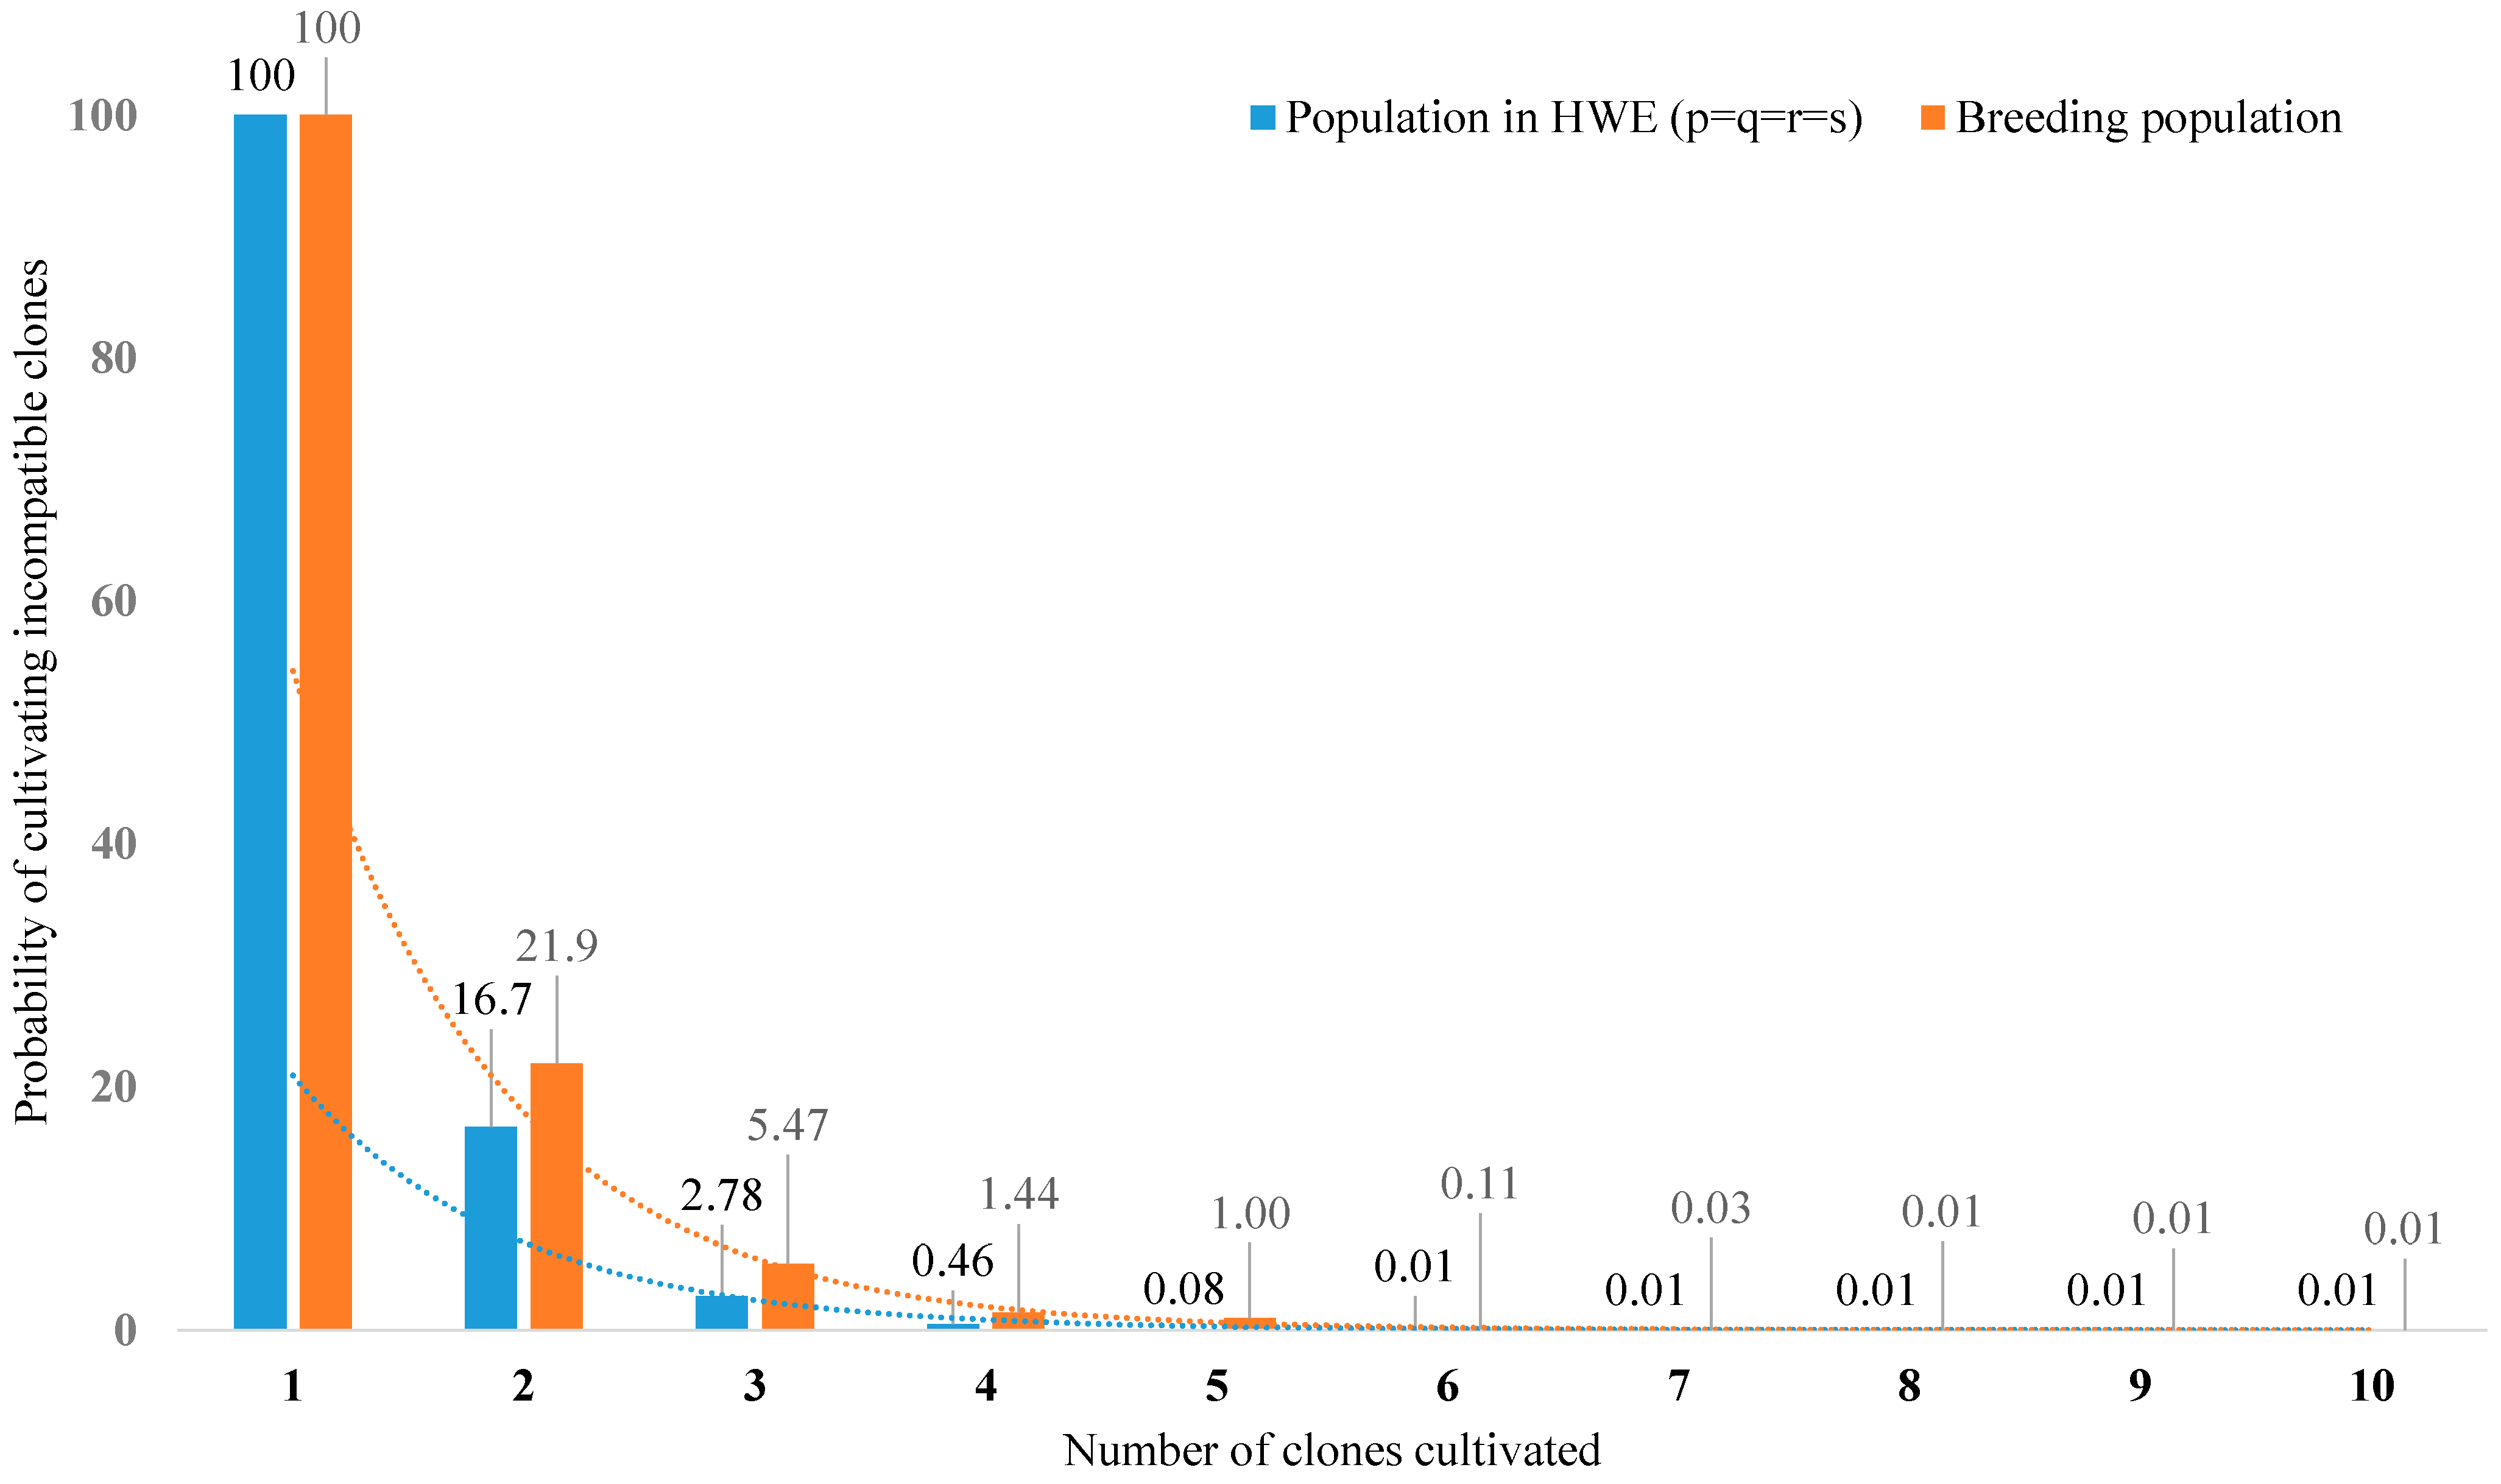
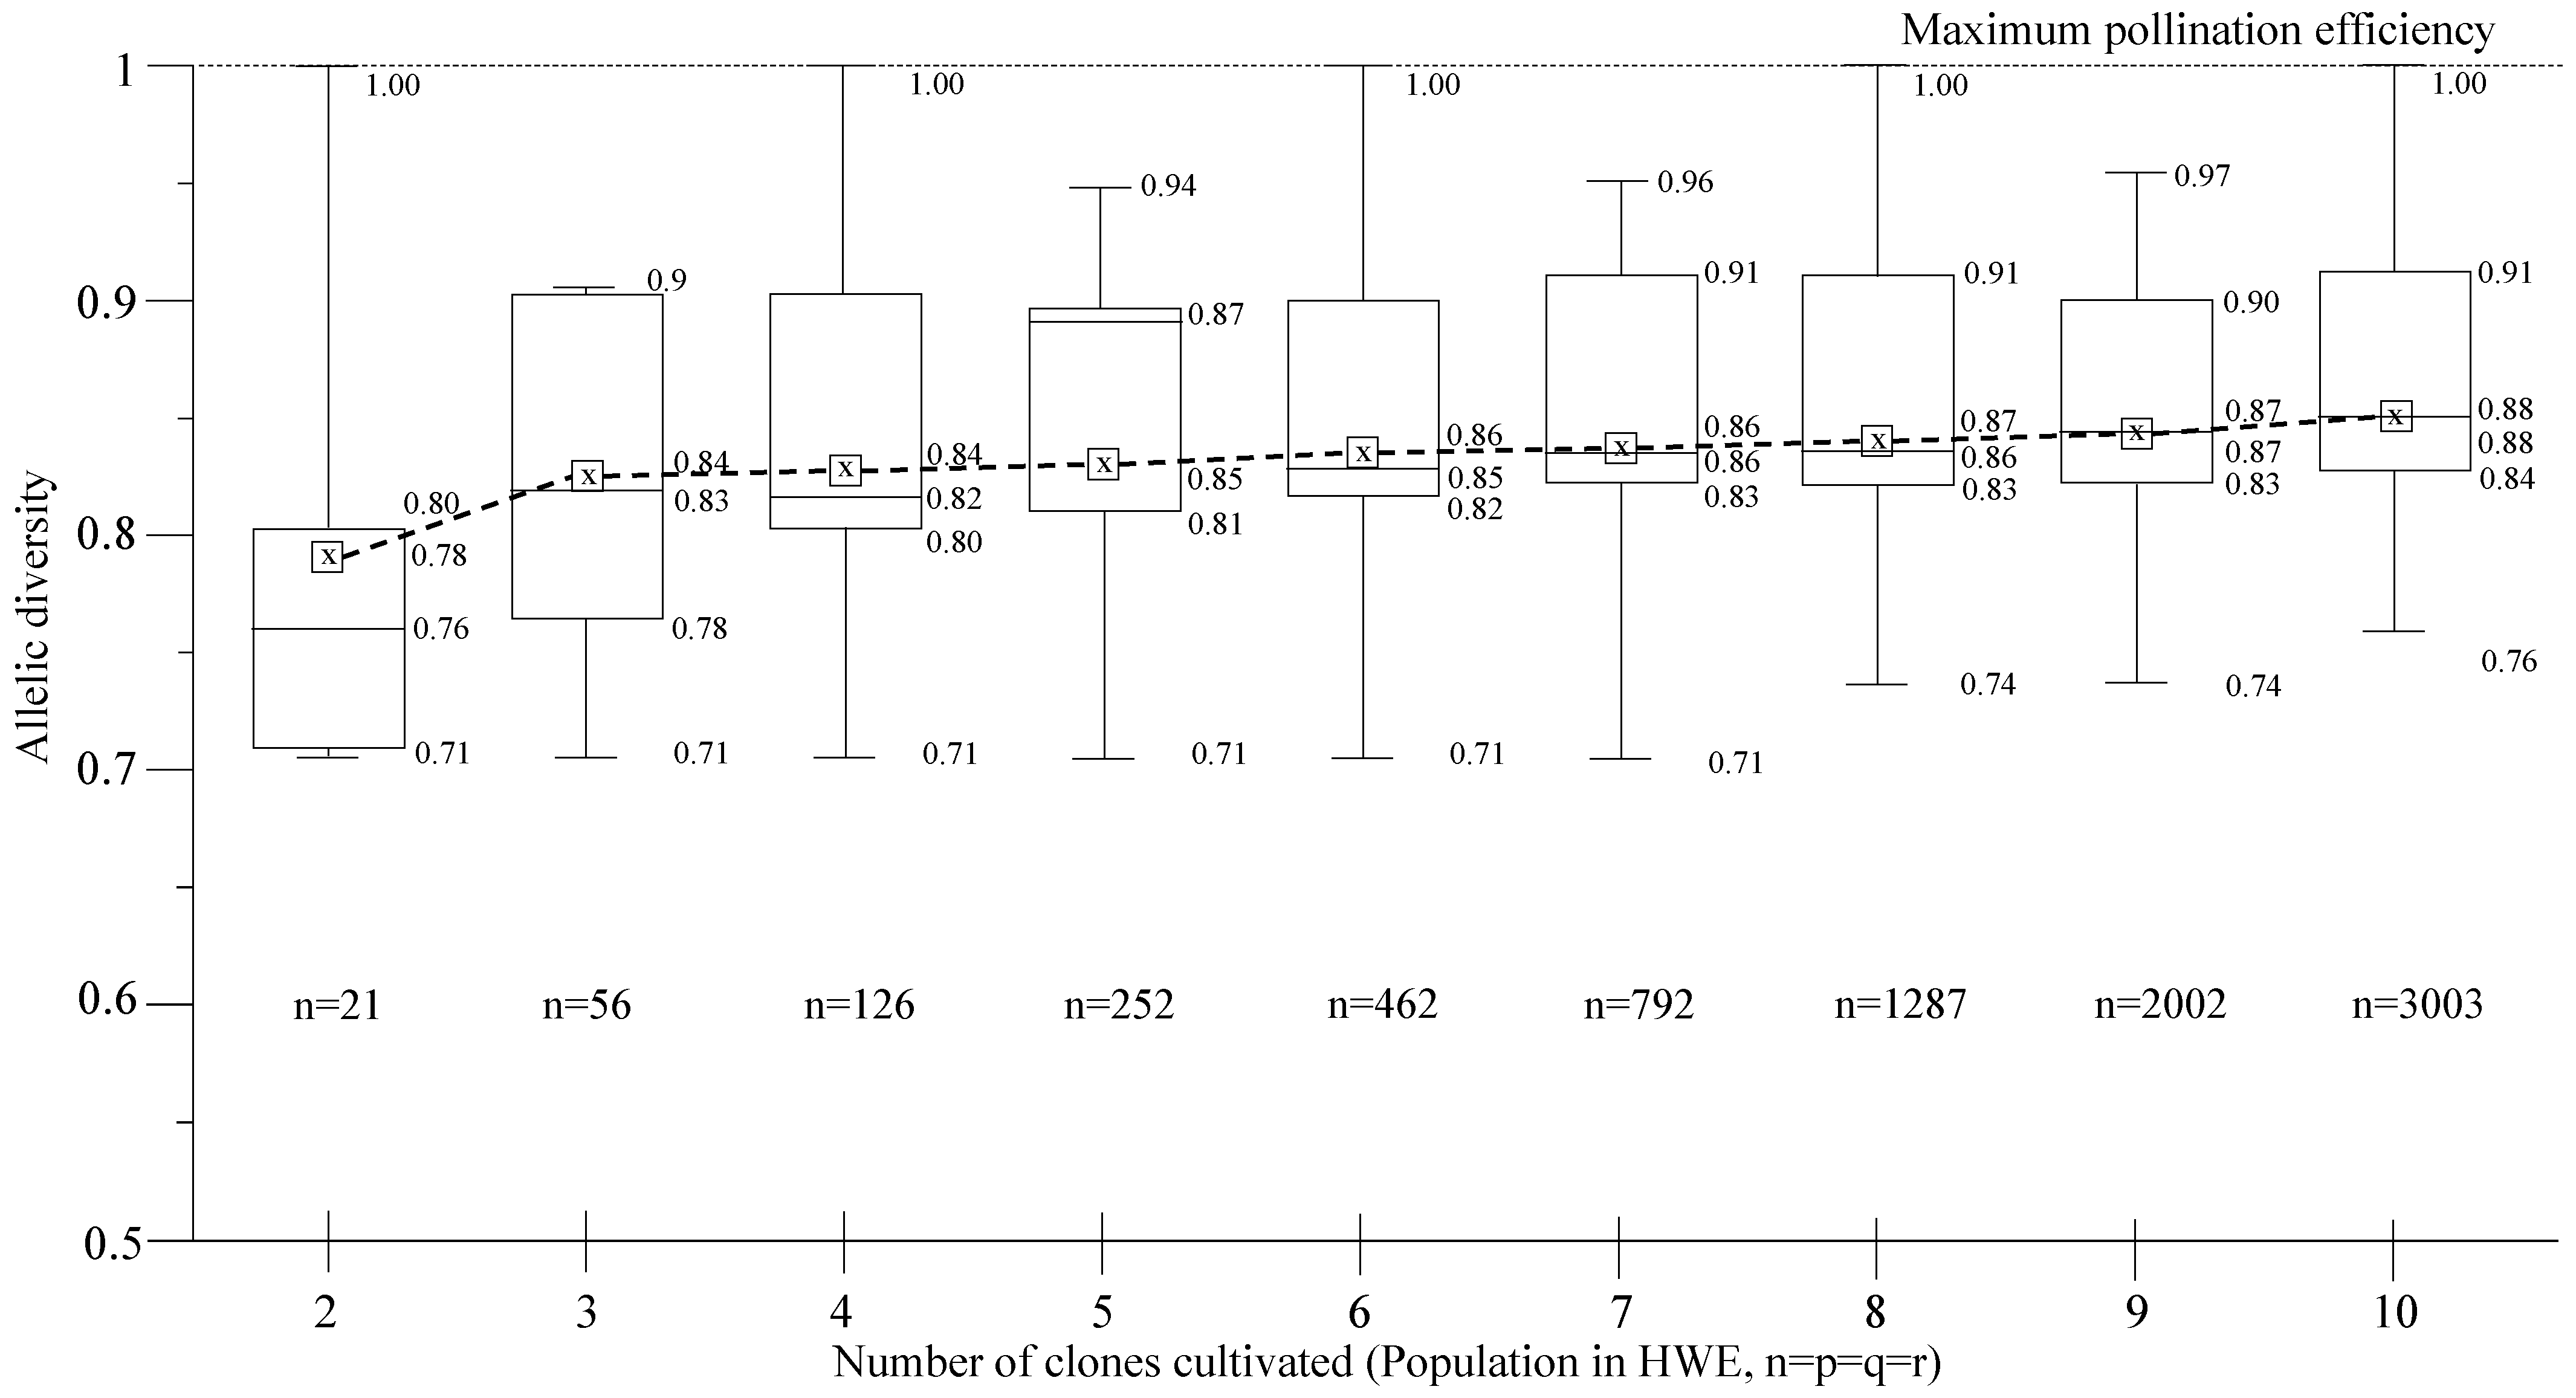
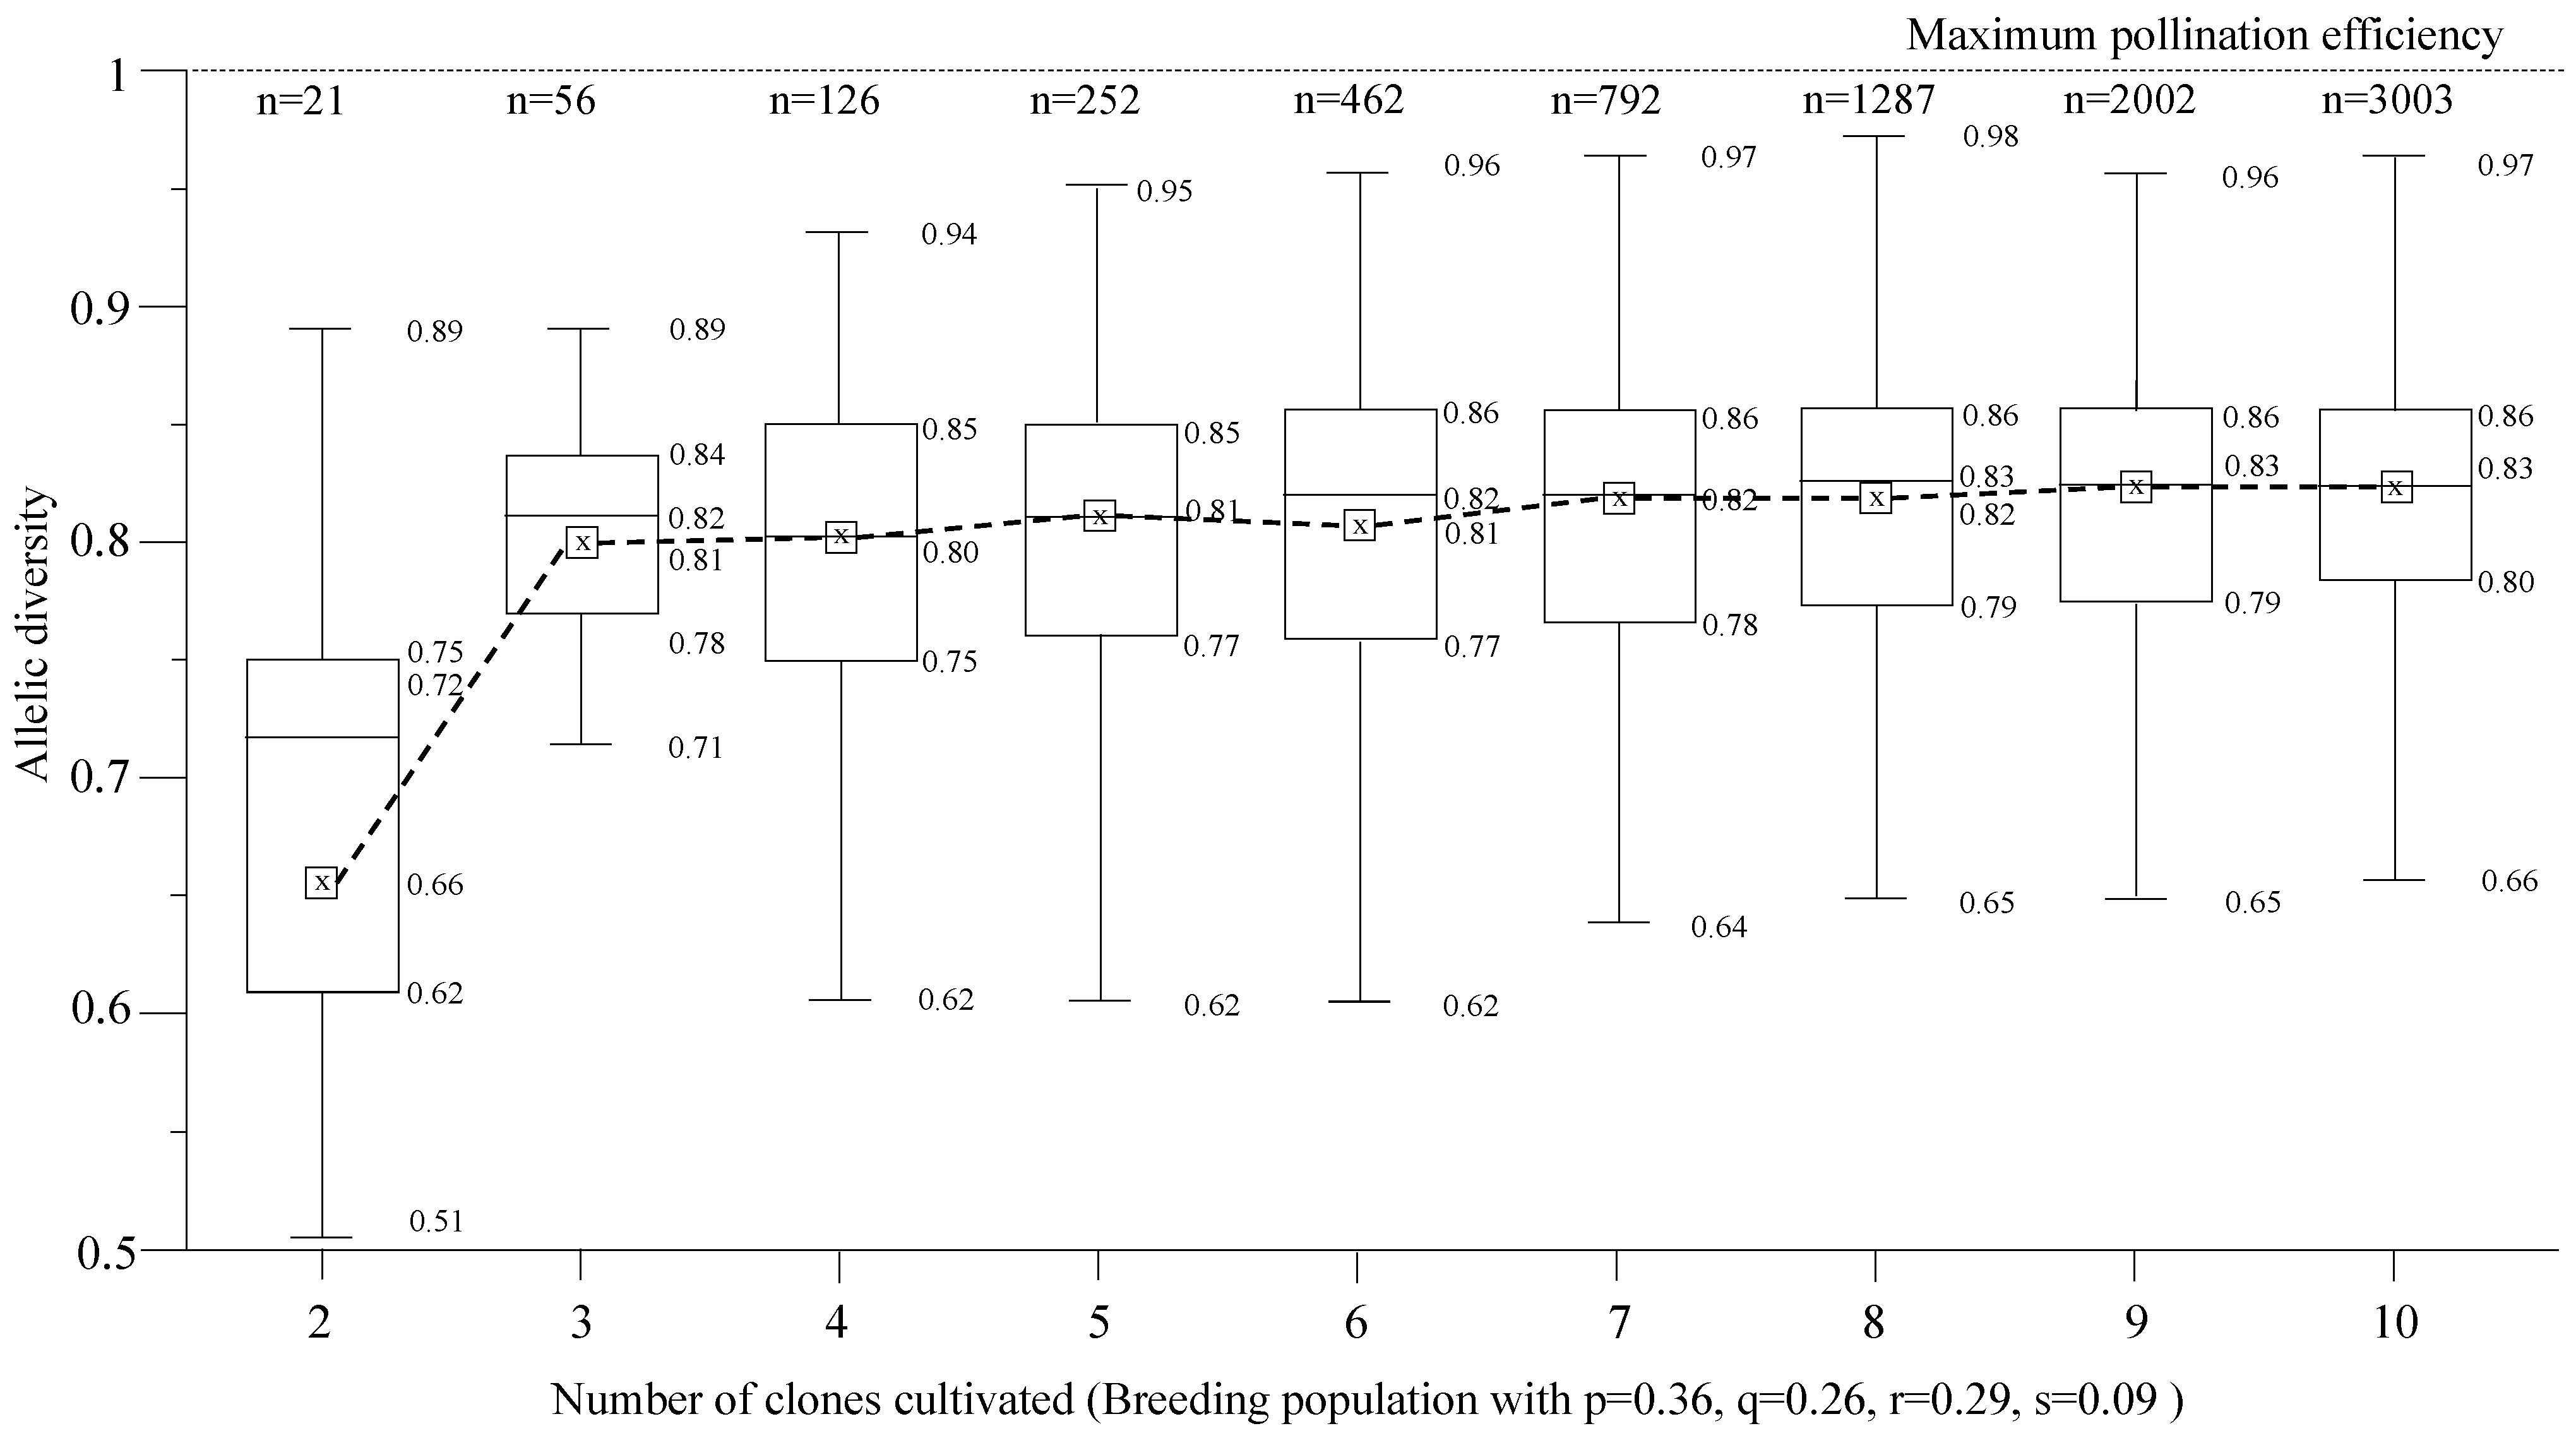
2.5. Pollination Efficiency

The maximum pollination efficiency occurs when the four known alleles have the same frequency in the population (p = q = r = s = 0.25). Considering that, under this ideal condition, the variance of allelic frequencies is equal to zero (and that the further the deviation from this condition, the greater the variance between allelic frequencies), pollination efficiency was quantified as follows:
E = 1 ( f i f ¯ ) 2 n 1
where E : pollination efficiency, f i : frequency of the i-th allele Si, f ¯ : average of allele frequencies, and n : number of alleles.

3. Results and Discussion

The summarized results of 335 hybridizations show that approximately 80% of the genotypes were grouped into compatibility groups I, II, and III, with frequencies of 24.4%, 31.1%, and 24.4%, respectively (Table 2 and Table 3). A smaller percentage of genotypes (20%) were grouped into groups IV, V, and VI.
The characterization of self-incompatibility becomes more complex as the number of evaluated genotypes increases. Regarding the number of clones evaluated in this study, there are 990 possible ways to combine 45 genotypes in pairs. The use of previously characterized tester plants allows for the reduction in the number of hybridizations to the number of evaluated genotypes multiplied by the number of tester plants [23].
In the evaluation of new cultivars, Moraes et al. (2018) identified three compatibility groups (I, II, III) associated with three alleles (S1, S2, and S3). This variability was expanded in a subsequent study, where the characterization of a germplasm bank with 80 accessions identified three new compatibility groups [24]. In this study, groups IV, V, and VI, associated with the S4 allele, showed higher frequencies in coffee plants of the Robusta botanical variety. The lower frequency of these groups observed in this work seems to be associated with the genetic diversity of hybrid genotypes, with traits of the Conilon and Robusta botanical varieties.
The success rate estimated from the comparison between the number of compatible diagnoses (225) and the total number of hybridizations (335) was 67% (Table 2). Depolo et al. (2022) [24] and Souza et al. (2021) [23] observed success rate ranges from 41.7% to 80%, respectively. Several factors can limit the development of pollen tubes, such as the viability of pollen grains, the viability of floral structures maintained in vitro, climatic conditions, and the skill of the technician performing the directed pollination.
In vitro pollination in a sterile environment avoids false positive errors caused by pollen grain contamination. However, false negative errors, caused by procedural failures, can occur. The percentage of false negative errors (FN = 16%) observed in this study was higher than the percentages observed by Depolo et al. (2022) [24] and Souza et al. (2021) [23] (Table 2).
The principles of Mendelian genetics are fundamental for establishing an association between the diagnosis of pollen tube development and the classification into compatibility groups. Considering denominations previously presented [22], the genotype of group VI was designated as S1S4 based on the higher frequency of the S1 allele (Table 4). The correspondence of allele and genotype frequencies indicates that the breeding population is in Hardy–Weinberg equilibrium, according to the chi-squared test at a 5% probability level. Comprising 45 genotypes from 16 origins, the population evaluated in this study represents the most cultivated materials in Western Amazonia (Table 1). This correspondence suggests that the selection practiced on these genotypes for better agronomic performance had a minimal effect on changing the allele frequencies of this trait (Table 4).
The ability to avoid self-fertilization has evolved as an important trait in natural populations, contributing to reducing the deleterious effects of inbreeding and increasing genetic variability. However, in cultivation conditions, self-incompatibility can limit pollination efficiency due to the low allelic diversity for this trait. The S gene is considered to be a neutral gene with reproductive success inversely proportional to its frequency [18]. In other words, individuals carrying less common allelic forms of this gene benefit from a greater availability of pollen donor plants, while the fertility rate of individuals with more frequent alleles in the population is lower.
Maximum pollination efficiency is achieved in a plantation when there are viable pollen grains for fertilization. This ideal condition is attained by the presence of all known allelic forms and in equal frequencies (p = q = r = s = 0.25). Although achieving this ideal condition in practice is challenging, plantations should be planned considering the representation of plants from different compatibility groups, in order to favor plant fertilization and fruit production.
The probability of cultivating non-compatible plants depends on both the allelic diversity of the S gene and the number of genotypes cultivated. Figure 3 compares a population in Hardy–Weinberg equilibrium (HWE) with equal allelic frequencies (p = q = r = s) with the breeding population evaluated in this study, where p = 0.36, q = 0.26, r = 0.29, and s = 0.10, considering the probability of randomly selecting non-compatible genotypes.
Lower probabilities of randomly cultivating non-compatible plants are observed with an increase in the number of cultivated plants. Cultivating a single clone does not produce fruits, due to the inability of this species to self-pollinate, and cultivating two or three genotypes presents significant probabilities of cultivating randomly selected non-compatible plants.
The breeding population evaluated in this study showed higher probabilities of cultivating non-compatible clones compared to the theoretical population with maximum allelic diversity. This probability decreases drastically with the cultivation of five or more genotypes, indicating that cultivating a small number of clones can decisively limit plants’ pollination.
Large-scale cultivation of the clones GJ8, GJ25, GJ3, AS2, P50, and LB15 has been carried out for many years in Western Amazonia across thousands of hectares, without presenting problems of fruit set and filling. More recently, clones R22, LB10, GJ8, GJ25, LB15, and AS2 have been widely cultivated in the region.
The pollination efficiency values for all possible combinations in the cultivation of 2 to 10 clones is shown in Figure 4. While the cultivation of 2 clones is associated with 21 distinct combinations, the cultivation of 10 clones is associated with 3003 unique combinations (Figure 4). In this interpretation, three different scenarios were considered: (A) a population in Hardy–Weinberg equilibrium (HWE) with p = q = r = s = 0.25, (B) a population with a rarer allelic form (S4 = 0.01), and (C) a population with the allelic frequencies observed in this study (Figure 5).
In this interpretation, pollination efficiency was quantified by the deviation of the breeding population from the ideal population with maximum genetic variability, which presents all known allelic forms in equal proportions. Pollination efficiency, defined by the unit subtracted from the standard deviation of allelic frequencies, is inversely proportional to the predominance of one allele over the others, with its upper limit equal to 1 and lower limit equal to 0.50, in a population where only one of the four allelic forms predominates.
Considering the cultivation of 2 to 10 clones in the plantation, the population in Hardy–Weinberg equilibrium (HWE) showed pollination efficiency averages ranging from 0.78 to 0.88, while the population with the rarer allelic form showed estimates ranging from 0.66 to 0.77. The population studied in this work showed intermediate behavior between these two populations, with estimates ranging from 0.66 to 0.83 (Figure 4). All three populations showed stability from the cultivation of five clones in the plantation.
Theoretically, maximum pollination efficiency is achieved by representing all alleles in equal proportions. In practice, farmers must ensure the cultivation of plants from different compatibility groups, without major imbalances. In this context, the minimum number of clones to be cultivated is one of the main considerations. The cultivation of 5 to 9 clones with the representation of at least three compatibility groups has shown good results in the field.
In this scenario of clones selected by farmers themselves and cultivated across thousands of hectares, self-incompatibility is an important issue for the safety of coffee farming. In the past, farmers took on this risk. Still in the 1980s, Ferrão et al. (2019) [27] reported productivity problems associated with the cultivation of a single clone or a few non-compatible clones.
From this initiative, however, arose an agricultural activity of great importance for Western Amazonia. While the clones GJ8, GJ25, GJ5, GJ3, and P50 were cultivated together on a large scale in the 2000s, more recently, the clones GJ8, GJ25, AS2, LB15, and R22 have been cultivated together. Based on the results of this study, we can infer that, in the 1980s, clones from compatibility groups I, II, and V predominated in the field at frequencies of 20%, 60%, and 20%, respectively, in comparison with the clones cultivated more recently, where compatibility groups I, II, III, and IV predominate at frequencies of 20%, 40%, 20%, and 20%, respectively. This indicates an increase in the genetic variability of this trait over the years.
In this context, the greatest risk for cultivation arises from relying on a small number of cultivated plants. Beyond the efficiency of pollination, challenges include unsynchronized flowering among few clones and a higher incidence of undesirable traits specific to certain clones within the plantation [23,27].

4. Conclusions

Based on the pollen tube development response, the genotypes were grouped into six groups: group I (24.4%), group II (31.1%), group III (24.4%), group IV (2.2%), group V (2.2%), and group VI (15.6%). The lower frequency of groups IV, V, and VI is associated with the lower frequency of the rarest allelic form in this population. The correspondence between allelic and genotypic frequencies indicates that selection practiced for better agronomic performance did not reduce variability for this trait. The breeding population exhibited intermediate behavior between a theoretical population of maximum genetic diversity and a population with a rare allelic form. Efficiency estimates stabilized with the cultivation of five clones, indicating that cultivating a minimum number of clones should be considered. The greatest risk for cultivation is associated with the cultivation of a small number of clones, and in practice, the farmer should ensure the cultivation of plants from different compatibility groups without significant imbalances.

Author Contributions

Conceptualization, R.B.R.; methodology, A.N.R.S. and R.B.R.; validation, M.C.E. and F.L.P.; formal analysis, R.B.R.; investigation, A.N.R.S. and R.B.R.; resources, A.L.T.; data curation, A.N.R.S.; writing—original draft preparation, R.B.R.; writing—review and editing, E.T.C., F.L.P. and M.C.E.; supervision, R.B.R.; project administration, A.L.T.; funding acquisition, A.L.T. All authors have read and agreed to the published version of the manuscript.

Funding

The authors thank the Conselho Nacional de Desenvolvimento Científico e Tecnológico (CNPq) and the Coordenação de Aperfeiçoamento de Pessoal de Nível Superior (CAPES) for the scholarship granted, and the Secretaria Estadual de Desenvolvimento Econômico, government of the state of Rondônia, and Consórcio Pesquisa Café for funding.

Data Availability Statement

The original contributions presented in the study are included in the article, further inquiries can be directed to the corresponding author.

Conflicts of Interest

Author Rodrigo Barros Rocha, Alexsandro Lara Teixeira, Marcelo Curitiba Espindula and Eveline Teixeira Caixeta were employed by the company Brazilian Agricultural Research Corporation (EMBRAPA Coffee). The remaining authors declare that the research was conducted in the absence of any commercial or financial relationships that could be construed as a potential conflict of interest.

References

  1. Akpertey, A.; Anim-Kwapong, E.; Adu-Gyamfi, P.K.K.; Ofori, A. Genetic variability for vigor and yield of robusta coffee (Coffea canephora) clones in Ghana. Heliyon 2022, 8, e10192. [Google Scholar] [CrossRef] [PubMed]
  2. Davis, A.P.; Rakotonasolo, F. Six new species of coffee (Coffea) from northern Madagascar. Kew Bull. 2021, 76, 497–511. [Google Scholar] [CrossRef]
  3. Salvador, H.P.; Berilli, A.P.C.G.; Rodrigues, W.P.; Mazzafera, P.; Partelli, F.L. A climate change perspective on the selection, development, and management of Coffea canephora genotypes. In Advances in Botanical Research; Elsevier: Amsterdam, The Netherlands, 2024; ISSN 0065-2296. [Google Scholar] [CrossRef]
  4. Charrier, A.; Berthaud, J. Principles and methods in coffee plant breeding: Coffea canephora Pierre. In Coffee: Agronomy; Clarke, R.J., Macrae, R., Eds.; Elsevier: London, UK, 1988; Volume 4, pp. 167–197. [Google Scholar]
  5. Partelli, F.L.; Silva, F.A.; Covre, A.M.; Oliosi, G.; Correa, C.C.G.; Viana, A.P. Adaptability and stability of Coffea canephora to dynamic environments using the Bayesian approach. Sci. Rep. 2022, 12, 11608. [Google Scholar] [CrossRef] [PubMed]
  6. Rocha, R.B.; Teixeira, A.L.; Ramalho, A.R.; Espindula, M.C.; Lunz, A.M.P.; Souza, F.F. Coffea canephora breeding: Estimated and achieved gains from selection in the Western Amazon, Brazil. Ciência Rural 2021, 51, e20200713. [Google Scholar] [CrossRef]
  7. Alkimin, E.R.; Caixeta, E.T.; Sousa, T.V.; Resende, M.D.V.; Silva, F.L.; Sakiyama, N.S.; Zambolim, L. Selective efficiency of genome-wide selection in Coffea canephora breeding. Tree Genet. Genomes 2020, 16, 41. [Google Scholar] [CrossRef]
  8. CONAB: Companhia Nacional de Abastecimento. Acompanhamento da Safra Brasileira de Café. In Primeiro Levantamento—Safra 2024; CONAB: Companhia Nacional de Abastecimento: Porto Velho, RO, Brazil, 2024; Volume 1, pp. 1–60. [Google Scholar]
  9. Teixeira, A.L.; Rocha, R.B.; Espindula, M.C.; Ramalho, A.R.; Vieira Júnior, J.R.; Alves, E.A.; Lunz, A.M.P.; de França Souza, F.; Costa, J.N.M.; Fernandes, C.F. Amazonian Robustas—New Coffea canephora coffee cultivars for the Western Brazilian Amazon. Crop Breed. Appl. Biotechnol. 2020, 20, e323420318. [Google Scholar] [CrossRef]
  10. Montagnon, C.; Leroy, T.; Cilas, C.; Legnaté, H.; Charrier, A. Heterozygous genotypes are efficient testers for assessing between-population combining ability in the reciprocal recurrent selection of Coffea canephora. Euphytica 2008, 160, 101–110. [Google Scholar] [CrossRef]
  11. Berthaud, J.; Charrier, A. Genetic resources of Coffea. In Coffee—Agronomy; Clarck, R.J., Macrae, R., Eds.; Elsevier Applied Science: London, UK, 1985; pp. 1–40. [Google Scholar]
  12. Oliveira, L.N.L.; Rocha, R.B.; Ferreira, F.M.; Spinelli, V.M.; Ramalho, A.R.; Teixeira, A.L. Selection of Coffea canephora parents from the botanical varieties conilon and robusta for the production of intervarietal hybrids. Ciência Rural. 2018, 48, e20170444. [Google Scholar] [CrossRef]
  13. Espindula, M.C.; Dalazen, J.R.; Rocha, R.B.; Teixeira, A.L.; Diocleciano, J.M.; Dias, J.R.M.; Schmidt, R.; Lima, P.P.; Lima, G.M.; Gama, W. Robustas Amazônicos os cafeeiros cultivados em Rondônia, 1st ed.; Embrapa: Brasília, DF, Brazil, 2022; 144p. [Google Scholar]
  14. Devreux M, Vallaeys G, Pochet P, Gilles A Recherches sur l’autosterilité du caféier robusta (Coffea canephora Pierre). Série Sci. 1959, 78, 1–44.
  15. Conagin, C.H.T.M.; Mendes, A.J.T. Pesquisas citológicas e genéticas em três espécies de Coffea: Auto-incompatibilidade em Coffea canephora Pierre ex Froehner. Bragantia 1961, 20, 787–804. [Google Scholar] [CrossRef]
  16. Berthaud, J. L’incompatibilité chez Coffea canephora: Méthode de test et déterminisme génétique. Café Cacao Thé 1980, 24, 267–274. [Google Scholar]
  17. Lashermes, P.; Couturon, E.; Moreau, N.; Paillard, M.; Louarn, J. Inheritance and genetic mapping of self-incompatibility in Coffea canephora Pierre. Theor. Appl. Genet. 1996, 93, 458–462. [Google Scholar] [CrossRef] [PubMed]
  18. Nowak, M.D.; Davis, A.P.; Anthony, F.; Yoder, A.D. Expression and trans-specific polymorphism of self-incompatibility RNases in Coffea (Rubiaceae). PLoS ONE 2011, 6, e21019. [Google Scholar] [CrossRef] [PubMed]
  19. De Franceschi, P.; Dondini, L.; Sanzol, J. Molecular bases and evolutionary dynamics of self-incompatibility in the Pyrinae (Rosaceae). J. Exp. Bot. 2012, 63, 4015–4032. [Google Scholar] [CrossRef] [PubMed]
  20. Asquini, E.; Gerdol, M.; Gasperini, D.; Igic, B.; Graziosi, G.; Pallavicini, A. S-RNase-like sequences in styles of Coffea (Rubiaceae): Evidence for S-RNase based gametophytic self-incompatibility? Trop. Plant Biol. 2011, 4, 237–249. [Google Scholar] [CrossRef]
  21. Vieira, J.; Pimenta, J.; Gomes, A.; Laia, J.; Rocha, S.; Heitzler, P.; Vieira, C.P. The identification of the Rosa S-locus and implications on the evolution of the Rosaceae gametophytic self-incompatibility systems. Sci. Rep. 2021, 11, 3710. [Google Scholar] [CrossRef] [PubMed]
  22. Moraes, M.S.; Teixeira, A.L.; Ramalho, A.R.; Espindula, M.C.; Ferrão, M.A.G.; Rocha, R.B. Characterization of gametophytic self-incompatibility of superior clones of Coffea canephora. Genet. Mol. Res. 2018, 17, gmr16039876. [Google Scholar] [CrossRef]
  23. Souza, C.A.; Rocha, R.B.; Santos, M.R.A.; Lopes, T.A.; Teixeira, A.L.; Espindula, M.C. In vitro pollination and fluorescence microscopy for characterization of gametophytic self-incompatibility of Coffea canephora Pierre ex A. Froehner. Crop Breed. Appl. Biotechnol. 2021, 21, e37692142. [Google Scholar] [CrossRef]
  24. Depolo, R.P.; Rocha, R.B.; Souza, C.A.; Santos, M.R.A.; Espindula, M.C.; Teixeira, A.L. Expression of self-incompatibility in Coffea canephora genotypes grown in the western Amazon. Pesqui. Agropecuária Bras. 2022, 57, e03031. [Google Scholar] [CrossRef]
  25. Silva, L.O.E.; Rodrigues, M.J.L.; Ferreira, M.F.S.; Almeida, R.N.; Ramalho, J.C.; Rakocevic, M.; Partelli, F.L. Modifications in floral morphology of Coffea spp. genotypes at two distinct elevations. Flora 2024, 310, 152443. [Google Scholar] [CrossRef]
  26. Santos, M.M.; Oliveira, M.G.; Cassol, D.; Rodrigues, W.P.; Falqueto, A.R.; Ramalho, J.C.; Partelli, F.L. Genotypic diversity of Coffea canephora cv. Conilon identified through leaf morpho and eco-physiological traits. Sci. Hortic. 2024, 324, 112603. [Google Scholar] [CrossRef]
  27. Ferrão, M.A.G.; Souza, E.M.R.; Fonseca, A.F.A.; Ferrão, R.G. Self-incompatibility and Sustainable Production of Conilon Coffee. In Conilon Coffee, 3rd ed.; Updated and Expanded; Ferrão, R.G., Fonseca, A.F.A., Ferrão, M.A.G., Muner, L.H., Eds.; Vitória, ES, Brazil, 2019; pp. 203–221. Available online: https://biblioteca.incaper.es.gov.br/ (accessed on 8 January 2024).
  28. Falconer, D.S.; Mackay, T.F.C. Introduction to Quantitative Genetics, 4th ed.; Longmans Green: Harlow, Essex, UK, 1996; 464p. [Google Scholar]
Figure 1. Pollen tubes developed inside a compatible stigma evaluated using fluorescence microscopy 36 h after in vitro pollination ((A): 200×, (B): 400×).
Agronomy 14 01564 g001
Figure 2. Styles and stigmata evaluated using fluorescence microscopy 36 h after in vitro pollination, showing no pollen tube development (200×). Images (A,B) show incompatible stigmas from different plants.
Agronomy 14 01564 g002
Figure 3. Probability of cultivating randomly chosen incompatible clones as a function of the number of cultivated plants, contrasting two populations: (i) a theoretical population in Hardy–Weinberg equilibrium with equal allelic frequencies (p = q = r = s), and (ii) a breeding population with p = 0.36, q = 0.26, r = 0.29, and s = 0.09.
Agronomy 14 01564 g003
Figure 4. Pollination efficiency interpreted in a boxplot highlighting the mean, median, maximum, minimum, and the first and third quartiles considering a theoretical population in Hardy–Weinberg equilibrium with equal allelic frequencies (p = q =r = s).
Agronomy 14 01564 g004
Figure 5. Pollination efficiency interpreted in a boxplot highlighting the mean, median, maximum, minimum, and the first and third quartiles considering (i) a breeding population with p = 0.48, q = 0.32, r = 0.19, and s = 0.01, and (ii) a breeding population with p = 0.36, q = 0.26, r = 0.29, and s = 0.09.
Agronomy 14 01564 g005aAgronomy 14 01564 g005b
Table 1. List of studied genotypes in relation to their compatibility, sourced from the Embrapa Germplasm Bank and clones cultivated in the public domain in Western Amazonia, Brazil.
nGenotypeOriginnGenotypeOrigin
1AR106Aldinei Raasch 724LB10Laerte Braun 5
2AS1Ademar Schmidt 225LB12Laerte Braun 5
3AS10Ademar Schmidt 226LB15Laerte Braun 5
4AS12Ademar Schmidt 227LB160Laerte Braun 5
5AS2Ademar Schmidt 228LB20Laerte Braun 5
6AS5Ademar Schmidt 229LB33Laerte Braun 5
7AS7Ademar Schmidt 230LB68Laerte Braun 5
8BAG24Embrapa 131LB80Laerte Braun 5
9BAG27Embrapa 132LB88Laerte Braun 5
10BAG28Embrapa 133N13Nivaldo Ferreira 6
11BG180Adilson Berger 334N16Nivaldo Ferreira 6
12CA1Carlos Alves Silva 435N32Nivaldo Ferreira 6
13GB1Gilberto Boon 236N7Nivaldo Ferreira 6
14GB4Gilberto Boon 237N8[G8]Nivaldo Ferreira 6
15GB7Gilberto Boon 238P50Valdecir Piske 2
16GJ2Geraldo Jacomini 539R152Ronaldo G Oliveira 2
17GJ20Geraldo Jacomini 540R22Ronaldo Vitoriano 2
18GJ25Geraldo Jacomini 541SK244Sergio Kalk 6
19GJ3Geraldo Jacomini 542SK41Sergio Kalk 6
20GJ30Geraldo Jacomini 543SK80Sergio Kalk 6
21GJ5Geraldo Jacomini 544VP156Valdecir Piske 2
22GJ8Geraldo Jacomini 545WP6Wanderley Peter 6
23L1Alcides Rosa 3
1 Ouro Preto do Oeste—RO, 2 Alta Floresta do Oeste—RO, 3 Rolim de Moura—RO, 4 Novo Horizonte do Oeste—RO, 5 Nova Brasilândia do Oeste—RO, 6 Cacoal—RO, 7 São Miguel do Guaporé—RO.
Table 2. Diagnosis of pollen tube development conducted among the 45 most cultivated clones in the Western Amazon, evaluated in the municipality of Porto Velho, Rondônia, Brazil. Each observation refers to the diagnosis of a slide with 10 stigmata, totaling 335 slides evaluated.
nGenotypeCNCFNGroupp(FN)nGenotypeCNCFNGroupp(FN)
1AR106512III0.0524LB10524III<0.01
2AS1521VI<0.0125LB12513II0.05
3AS10514VI0.0526LB15510III0.05
4AS12510VI0.0527LB160514I0.05
5AS2510III0.0528LB20512II0.05
6AS5511II0.0529LB33511III0.05
7AS7511II0.0530LB68512II0.05
8BAG24512II0.0531LB80520II<0.01
9BAG27511I0.0532LB88510III0.05
10BAG28510III0.0533N13511III0.05
11BG180510VI0.0534N16510VI0.05
12CA1531VI<0.0135N32530I<0.01
13GB1511I0.0536N7521I<0.01
14GB4512II0.0537N8[G8]510II0.05
15GB7513I0.0538P50511II0.05
16GJ2521I<0.0139R152511III0.05
17GJ20510III0.0540R22520IV<0.01
18GJ25510II0.0541SK244510I0.05
19GJ3511V0.0542SK41512II0.05
20GJ30520I<0.0143SK80513II0.05
21GJ5511II0.0544VP156511VI0.05
22GJ8512I0.0545WP6522I<0.01
23L1511III0.05
Note—n: ordinal numbering, C: compatible, NC: not compatible, FN: false negative, Group: compatibility groups identified by Roman numerals, I, II, III, IV, V, VI; p(FN): false negative probability considering a 5% error rate in each diagnosis.
Table 3. Clustering of the 45 most cultivated clones in the Western Amazon according to the development of pollen tubes in compatibility groups identified by Roman numerals: I, II, III, IV, V, and VI.
nIIIIIIIVVVI
S1S2S1S3S2S3S(2,3)S4S(2,3)S4S1S4
1BAG27BAG24AR106R22GJ3AS1
2GB1AS5AS2 AS10
3GB7AS7BAG28 AS12
4GJ2GB4GJ20 BG180
5GJ8GJ5L1 CA1
6GJ30GJ25LB10 N16
7LB160LB12LB15 VP156
8N7LB20LB33
9N32LB68LB88
10SK244LB80N13
11WP6N8[G8]R152
12 P50
13 SK41
14 SK80
Total111411117
%24.4431.1124.442.222.2215.57
Table 4. Allelic and genotypic frequencies, observed and expected values, and chi-squared test results for assessing the null hypothesis that the breeding population is in Hardy–Weinberg equilibrium.
AllelesAllelic FrequencyGroupsGenotypesGenotypic FrequencyExpected Value
S10.36IP(S1S2)0.2511.44
S20.26IIP(S1S3)0.2912.93
S30.29IIIP(S2S3)0.219.30
S40.10IVP(S2S4)0.073.22
VP(S3S4)0.083.64
VIP(S1S4)0.104.48
GroupsOEO-E(O-E)2(O-E)2/E
I1111.44−0.440.190.02
II1412.931.071.140.09
III119.301.702.910.31
IV13.22−2.224.921.53
V13.64−2.646.961.91
VI74.482.526.371.42
χ 2 5.28 NS
O: observed value, E: expected value, χ 2 : chi-squared test, NS: not significant.
Disclaimer/Publisher’s Note: The statements, opinions and data contained in all publications are solely those of the individual author(s) and contributor(s) and not of MDPI and/or the editor(s). MDPI and/or the editor(s) disclaim responsibility for any injury to people or property resulting from any ideas, methods, instructions or products referred to in the content.

