Article

A Spatial Risk Analysis of Springtime Daily Minimum Surface Air Temperature Values for Vineyard Site Selection: Applications to Pinot noir Grapevines throughout the Willamette Valley American Viticultural Area

1
Northwest Wine Studies Center, Chemeketa Community College, Salem, OR 97304, USA
2
Department of General and Organic Viticulture, Hochschule Geisenheim University, Von-Lade-Strasse 1, 65366 Geisenheim, Germany
*
Author to whom correspondence should be addressed.
Agronomy 2024, 14(7), 1566; https://doi.org/10.3390/agronomy14071566
Submission received: 30 May 2024 / Revised: 21 June 2024 / Accepted: 15 July 2024 / Published: 18 July 2024
(This article belongs to the Section Horticultural and Floricultural Crops)

Abstract

:
This study introduced the application of concepts and methods from extreme value theory (EVT) to estimate the probability that daily minimum temperatures exceed springtime critical temperature thresholds for Pinot noir buds and young shoots as a function of springtime phenology. The springtime frost risk estimates were computed spatially for Pinot noir throughout the Willamette Valley (WV) American Viticultural Area (AVA) using a gridded dataset of historical daily minimum surface air temperature data. EVT-based springtime frost risk maps can inform vineyard-management operations by identifying those locations throughout a wine region with a low risk for any cold injury where remedial action is likely not necessary when there is a forecasted frost event. Frost risk estimates were computed for 1991–2021 and 1991–2022 to examine a potentially changed risk profile for springtime frost events throughout the WV AVA due to the April 2022 advective frost event. The April 2022 advective frost event influenced the risk profile throughout the AVA such that an event of its magnitude is now modelled to occur more frequently. The EVT-based risk analysis can be readily updated each year as new data become available. While spatially varying budbreak calculations facilitated computation of the spring frost risk estimates, the EVT approach profiled in this study does not necessarily depend on potentially uncertain predetermined budbreak date estimates. Gridded maps of extreme daily minimum temperature exceedances, reclassified relative to the springtime phenology critical temperature thresholds for Pinot noir, were readily combined with a ripening potential map to identify optimal areas for vineyard site selection throughout the WV AVA. When simultaneously evaluating Pinot noir ripening potential with springtime frost risk using historical data, the limiting factor for vineyard site selection throughout the WV AVA was frost risk, not ripening potential. The study approach is also applicable for other winegrape-growing regions, assessments of winter freeze risk and summertime heatwaves, and with non-gridded observed temperature datasets.

1. Introduction

Spring frost events that occur after budbreak can reduce grapevine yield and quality. Many winegrowing regions across the globe experience spring frost damage [1,2,3]. While presumed to be relatively infrequent [4], frost damage frequency was estimated to be approximately 1 in 6 years, 1 in 4 years, and 1 every 2 years for the Luxembourgish (Luxembourg), Chamapagne (France), and Michigan (United States) winegrowing regions, respectively [2]. Average frost damage yield reduction was estimated to be 39% for the Luxembourgish winegrowing region [2]. In 2003, yield was reduced by approximately 50% in Champagne due to frost damage [5]. Control measures for spring frosts include, for example, heaters, over-vine sprinklers, wind machines, grow tubes, floor management, variety selection, delayed and double pruning, and site selection [6,7].
Several factors influence vineyard site evaluation and selection, including latitude, elevation, slope, aspect, air drainage, site history, soil characteristics, land use, and climate [8,9,10,11,12,13,14,15]. While many of these characteristics may vary spatially throughout a vineyard, a common barrier to successful vineyard site evaluations is the lack of site-specific weather and climate data [8]. Among the factors relevant to vineyard site evaluation, climate, in particular temperature, is critical [8]. Climate considerations likely involve surface air temperature data evaluations of heat accumulation to assess grapevine cultivar ripening potential [16,17,18,19,20,21], estimations of growing season length [9,10,11,12,13,14,15], sunlight reception [8,9,12,13,14,15], and water availability [8,9,10,11,12,13,14,15], and risk assessments of extreme minimum, and possibly also maximum, surface air temperature values [8,9,10,12,13,15]. Evaluating the extreme climatology of fall, winter, and spring minimum surface air temperature values supports vineyard site-selection decision making to minimize grapevine cold damage [22].
Cold hardiness (Hc) is a time varying measure of the grapevine’s capacity to withstand freezing temperatures during the dormant season [22,23,24]. Its values vary not only at the boundaries of the growing and dormant seasons due to acclimation and deacclimation processes, but also midwinter due to temperature variations [22,23,24]. Time series plots of cold hardiness data display a predictable seasonal trend with Hc low in the fall and spring and at a maximum midwinter when temperature values are at a minimum [22,23,24]. Cold hardiness varies with species, cultivar, phenology, temperature, photoperiod, moisture content, nutrition, physiological age, and plant organ [22,25]. Bud cold hardiness, also referred to as LT50, is defined as the lethal temperature value for fifty percent of the tested buds. Gardea [25] reported bud cold hardiness values for Vitis vinifera L. cv. Pinot noir for the spring phenological stages of woolly bud, budbreak, first leaf, second leaf, and fourth leaf, including critical temperature values associated with no injury [6,26,27,28]. Ferguson et al. [22] underscored the importance of knowing when and where cold damage may occur and to develop vineyards at locations less prone to cold damage.
The 13,876 km2 WV AVA of northwestern Oregon in the United States is a Pinot noir-growing region that is prone to potential cold damage [29,30,31,32]. For example, advective frosts impacted the WV AVA the week of 10–17 April 2022 [33,34]. Cold damage extent was highly dependent upon phenology at the time of the frosts, which was estimated to vary from woolly bud to 1st leaf (E-L stage 3 to 7 [28]) depending upon location [34]. The frost, combined with the warm and dry March, potentially early budbreak for some locations throughout the AVA, and cold and wet mid to late April, was estimated to be a low probability event with a recurrence interval of approximately 30 to 50 years [33]. The April 2022 frost event underscored the need to better understand, spatially, the potential risks of extreme daily minimum surface air temperature values for vineyard site evaluation and selection throughout the WV AVA [34]. It also emphasized the need to examine any potential changes to the risk profile for extreme daily minimum surface air temperature values throughout the AVA given its estimated low occurrence probability [33,35,36].
Frost risk is commonly quantified utilizing graphs and tables of calculated probabilities for the last spring day when temperature values fall below fixed thresholds based on historical observations at the site [33,37,38,39,40]. Site specific freeze normals are usually provided at 10%, 20%, 30%, 40%, 50%, 60%, 70%, 80%, and 90% probability levels for 16 °F, 20 °F, 24 °F, 28 °F, 32 °F, and 36 °F [41]. They are limited in that their calculated probabilities are for the last day of a spring frost event for a fixed temperature threshold. While freeze normals are commonly available spatially, typically for the 50% probability level [33,42], these data are limited in their capacity to support a risk analysis relative to the no injury, injury, and LT50 spring phenology critical temperature values [6,25,26,27]. Rather than assign a probability to a last day of spring [2,43], for a fixed temperature threshold [33,37,38,39,40], this study assigns annual exceedance probabilities to daily minimum surface air temperature values for predetermined springtime date windows which may or may not experience a frost event in any given year and that account and accommodate for variable springtime phenology on an annual basis.
Mean and extreme climatology are important for vineyard site evaluation and selection affecting grape yield, composition, and wine quality [44]. Our current study applies concepts and methods from EVT [45,46] to directly compute the annual exceedance probability for daily minimum surface air temperature on a spatial basis throughout the WV AVA using gridded temperature observations located within and surrounding the AVA. The analysis of extremes involves the study of the tails of the distribution of a process and the application of EVT assigns probabilities to events whose values are unusually large, or small, and that may be beyond the observed record [47]. By employing EVT for the springtime frost risk analysis, any necessary extrapolation beyond the data was credible [47]. Maps of gridded pointwise return levels, which are estimates of extreme quantiles from the fitted EVT models [47], reclassified relative to the critical temperature thresholds associated with Pinot noir grapevine bud cold hardiness [6,25,26,27], can be combined with ripening potential maps for the same area [48,49,50], and potentially other relevant spatial data products [9,10,12,13], to guide vineyard site evaluation and selection spatially [9,10,12]. EVT applications now intersect in many disciplines [47]. However, interestingly, to our knowledge, this was the first study to apply concepts and methods from EVT to study springtime frost risk for vineyard site evaluation and selection.

2. Materials and Methods
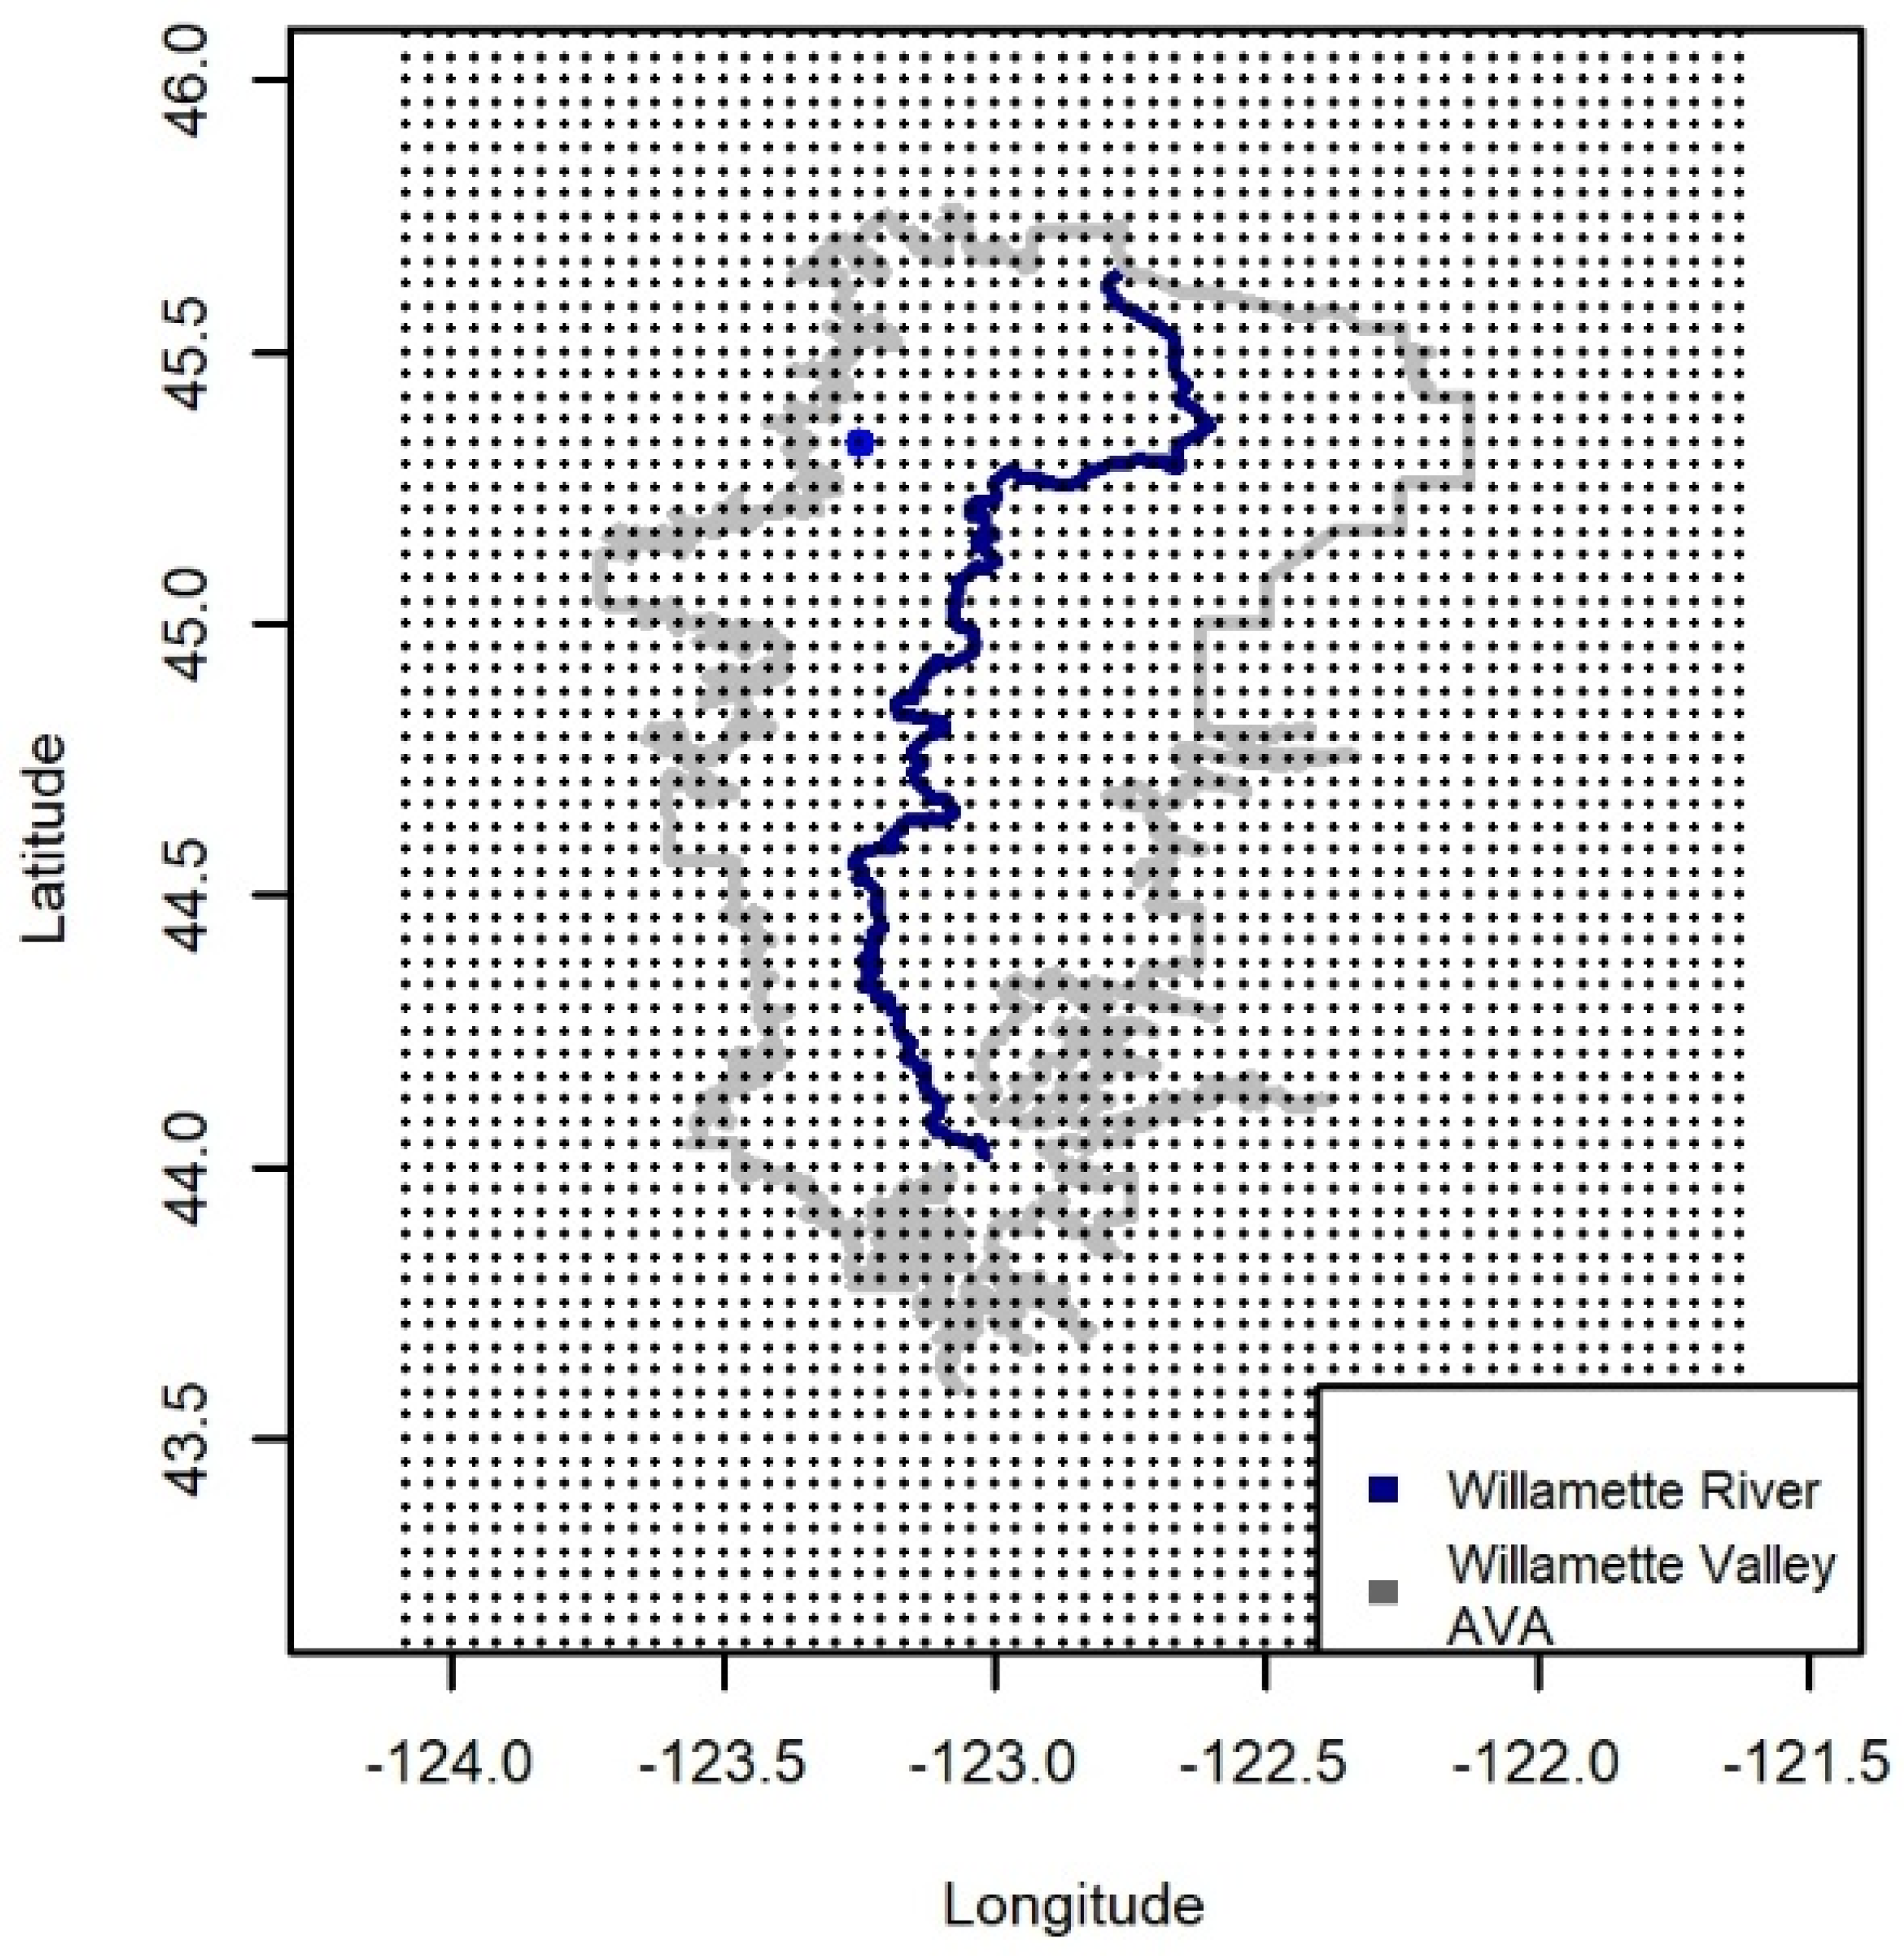
2.1. Study Area

The 13,876 km2 WV AVA of northwestern Oregon is bounded to its west by the Oregon Coastal Range and to its east by the Cascade Foothills and Mountains. The AVA is named after the Willamette River, whose 187 miles long main stem flows northward through the valley (Figure 1).
Based on the Parameter-elevation Relationships on Independent Slopes Model (PRISM) climatology for 1991–2020, 90% of the growing season average temperature values throughout the AVA vary from 14 °C to 16 °C, clearly classifying the AVA as a cool climate Pinot noir-growing region [12,51,52,53]. Also based on the (PRISM) climatology for 1991–2020, on average for 90% of the AVA, approximately 26–37 percent of annual rainfall totals occur during the growing season [49]. During the growing season it is drier, as measured by mean precipitation totals relative to annual totals, west of the Willamette River where the majority of the AVA’s vineyards and all its nested sub-AVAs are located [51,54].
The WV AVA was established in 1984. It expanded by approximately 75 km2 in 2016 [55,56]. The 2022 Oregon vineyard and winery report sponsored by the Oregon Wine Board [57] listed 31,234 planted acres for the WV AVA in 2022. Vitis vinifera L. cv. Pinot noir accounted for 21,344 acres, which equated to approximately 68% of the total planted acres. Total Pinot noir production for the WV AVA was estimated to be 61,928 tons, which accounted for approximately 64% of the total production for the AVA in 2022.

2.2. Pinot noir Cold Hardiness Data

Gardea [25] observed a rapid increase in bud water content at the transition from bud scales opening to woolly bud, which then plateaued for subsequent springtime phenological stages. With the increased water content, the grapevine buds are more vulnerable to potential cold damage [2,22,43]. Table 1 lists critical temperatures for Pinot noir buds and young shoots as a function of springtime phenology [6,25,26,27,28]. The data for budbreak from Table 1 were used to reclassify EVT-based gridded pointwise return level maps of extreme daily minimum surface air temperature data into zones within the WV AVA of no injury, injury, and greater than 50% cold damage.

2.3. Time Series Data

PRISM Gridded Temperature Data

PRISM gridded historical daily mean surface air temperature data from 1991 to 2022 were collected for a box region containing the WV AVA (Figure 2) [12,51]. The spatial resolution of the data was approximately four kilometers [51]. The PRISM daily mean surface air temperature data were used to calculate Pinot noir budbreak on a gridded basis throughout the WV AVA from 1991 to 2022.
The PRISM 30-year normals long-term average monthly gridded mean surface air temperature data, representative of the climatology from 1991 to 2020, were collected to calculate the mean growing season average temperature index throughout the WVA AVA for that 30-year period [17,19,51].
Four-kilometer resolution PRISM gridded historical daily minimum surface air temperature data were also collected for 1991–2022 [51]. The daily minimum surface air temperature data were used to compute seasonal block minima datasets for 1991–2021 and 1991–2022 at each PRISM data grid location for EVT model fitting and application for five predetermined date windows whose starting values were based on the distribution of computed budbreak dates from 1991 to 2021 (i.e., the lower 90%, 1st quartile, 2nd quartile, 3rd quartile, and upper 90%) and ending values were 30 June. Each seasonal block minima dataset involved blocking on an annual basis the observed daily minimum surface air temperature data for each date window and extracting the minimum value within each block [47].

2.4. Methods

2.4.1. Budbreak Calculations

The day of year for Vitis vinifera L. cv. Pinot noir budbreak was calculated on a gridded basis throughout the WV AVA from 1991 to 2022 using the PRISM mean surface air temperature data and the budbreak model, and its parameterization for Pinot noir, introduced by Zapata et al. [58]. Application of their method involved degree day ( D D ) calculations at each PRISM grid location (Figure 2) using the equation
D D = i = 1 n T i T b
where T i was the daily mean surface air temperature, T b = 8.1   ° C , T i T b = 0 if T i < T b , the starting date for the calculations was 1 January, and an upper threshold was specified for T i = 32   ° C [58]. The day of year for Vitis vinifera L. cv. Pinot noir budbreak was achieved when D D equaled or exceeded 79 [58].

2.4.2. Block Minima Dataset Development

Seasonal (springtime) block minimum temperature datasets were developed for 1991–2021 and 1991–2022 at each PRISM data grid location based on analysis of the budbreak calculations that were performed on a gridded basis throughout the WV AVA from 1991 to 2021. Five springtime date window starting values were selected at each PRISM data grid location, viz., the lower 90%, 1st quartile, 2nd quartile, 3rd quartile, and upper 90% of the computed budbreak day of year values from 1991 to 2021. The date windows all ended on 30 June. Each seasonal block minima dataset involved blocking on an annual basis the observed daily minimum surface air temperature data for each date window and extracting the minimum value within each block [47]. EVT models were fitted at each PRISM data grid location for each springtime date window using the grid location specific seasonal block minima datasets from 1991 to 2021 and 1991 to 2022.

2.4.3. Extreme Value Theory for Block Minima

EVT is well suited for quantifying spring frost risk, as well as winter freeze risk and duration specific exceedances above summertime maximum temperature thresholds, throughout a winegrowing region in that it is concerned with the occurrence and sizes of rare events, and, if necessary, can extrapolate beyond the observed record. By applying concepts and methods from EVT, one can directly calculate throughout the WV AVA the probability that the daily minimum temperature is less than the critical temperature thresholds reported in Table 1 for Vitis vinifera L. cv. Pinot noir.
EVT informs us that the generalized extreme value (GEV) family is the limit distribution for block minima (and maxima) data [47]. The GEV distribution function for block minima is given by
G x = 1 exp 1 ξ x μ σ 1 / ξ
and is defined on x : 1 ξ x μ / σ > 0 , with parameter space μ , σ , ξ : μ R , σ > 0 , ξ R . The location μ , scale σ , and shape ξ parameters of the distribution specify the center of the distribution, the deviation around μ , and the tail behavior of the distribution, respectively. The symbol R denotes the set of real numbers.
The GEV distribution function for block maxima is given by
G ˜ x = exp 1 + ξ x μ σ 1 / ξ
and is defined on x : 1 + ξ x μ / σ > 0 , with parameter space μ , σ , ξ : μ R , σ > 0 , ξ R . Block minima can be modelled using the GEV distribution defined for block maxima by negating the block minima data and upon fitting the GEV distribution for block maxima to the negated block minima data, negating the estimated value for the location parameter [47]. This approach was applied in this study. For each springtime data window and PRISM data grid point, a GEV model was fit to its negated block minima data using maximum likelihood estimation as implemented in version 2.3.7 of the R software package “evd” [59,60].
For one PRISM data grid location within the WV AVA and the springtime data window starting value associated with the first quartile budbreak day of year value for that location, version 1.5.9 of the R software package “extremeStat” [61] was applied to fit GEV models to its negated block minima data for 1991–2021 and 1991–2022. Estimates from these two GEV model fits were compared with the critical temperature thresholds for Pinot noir at budbreak (Table 1), the spring 2022 frost event observation at the location, and with each other to examine if there was any change to the risk profile for extreme daily minimum surface air temperature at that location due to the April 2022 frost event.

2.4.4. Return Level Estimation and Gridded Pointwise Return Level Maps

With the application of EVT, a computed return level (quantile) associated with the fitted extremal model is often a quantity of interest. A return level, denoted by x p , is exceeded by the block minima/maxima in any particular year with probability p . It is more commonly understood to be the value that is exceeded on average once every 1 / p years where 1 / p is defined to be the return period [47].
The quantiles of the GEV distribution for block minima are obtained by solving G x p = p for x p yielding [45]:
x p = μ + σ ξ 1 l n 1 p ξ ,           for   ξ 0     μ + σ l n l n 1 p ,                                 for   ξ = 0
For the five GEV models fitted at every PRISM data grid location, return levels were computed for return periods of 10, 20, 30 and 50 years. For each fitted GEV model and return period, a gridded pointwise return level map was compiled for the WV AVA. These maps were reclassified relative to the Pinot noir budbreak no injury and LT50 values reported in Table 1. This process was performed twice, once with the block minima datasets from 1991 to 2021 and a second time with the block minima datasets from 1991 to 2022.
For one PRISM data grid location in the WV AVA, with a longitude and latitude in decimal degrees of −123.25 and 45. 3 ¯ , respectively, computed return levels were plotted versus return period for the two block minima datasets. For these two plots, the computed return levels were associated with the GEV models fitted with the block minima datasets whose springtime date window starting value were defined by the 1st quartile of the computed budbreak day of year values from 1991 to 2021. At the grid location, this selected springtime date window starting value coincided with the date of the April 2022 frost event.

3. Results and Discussion

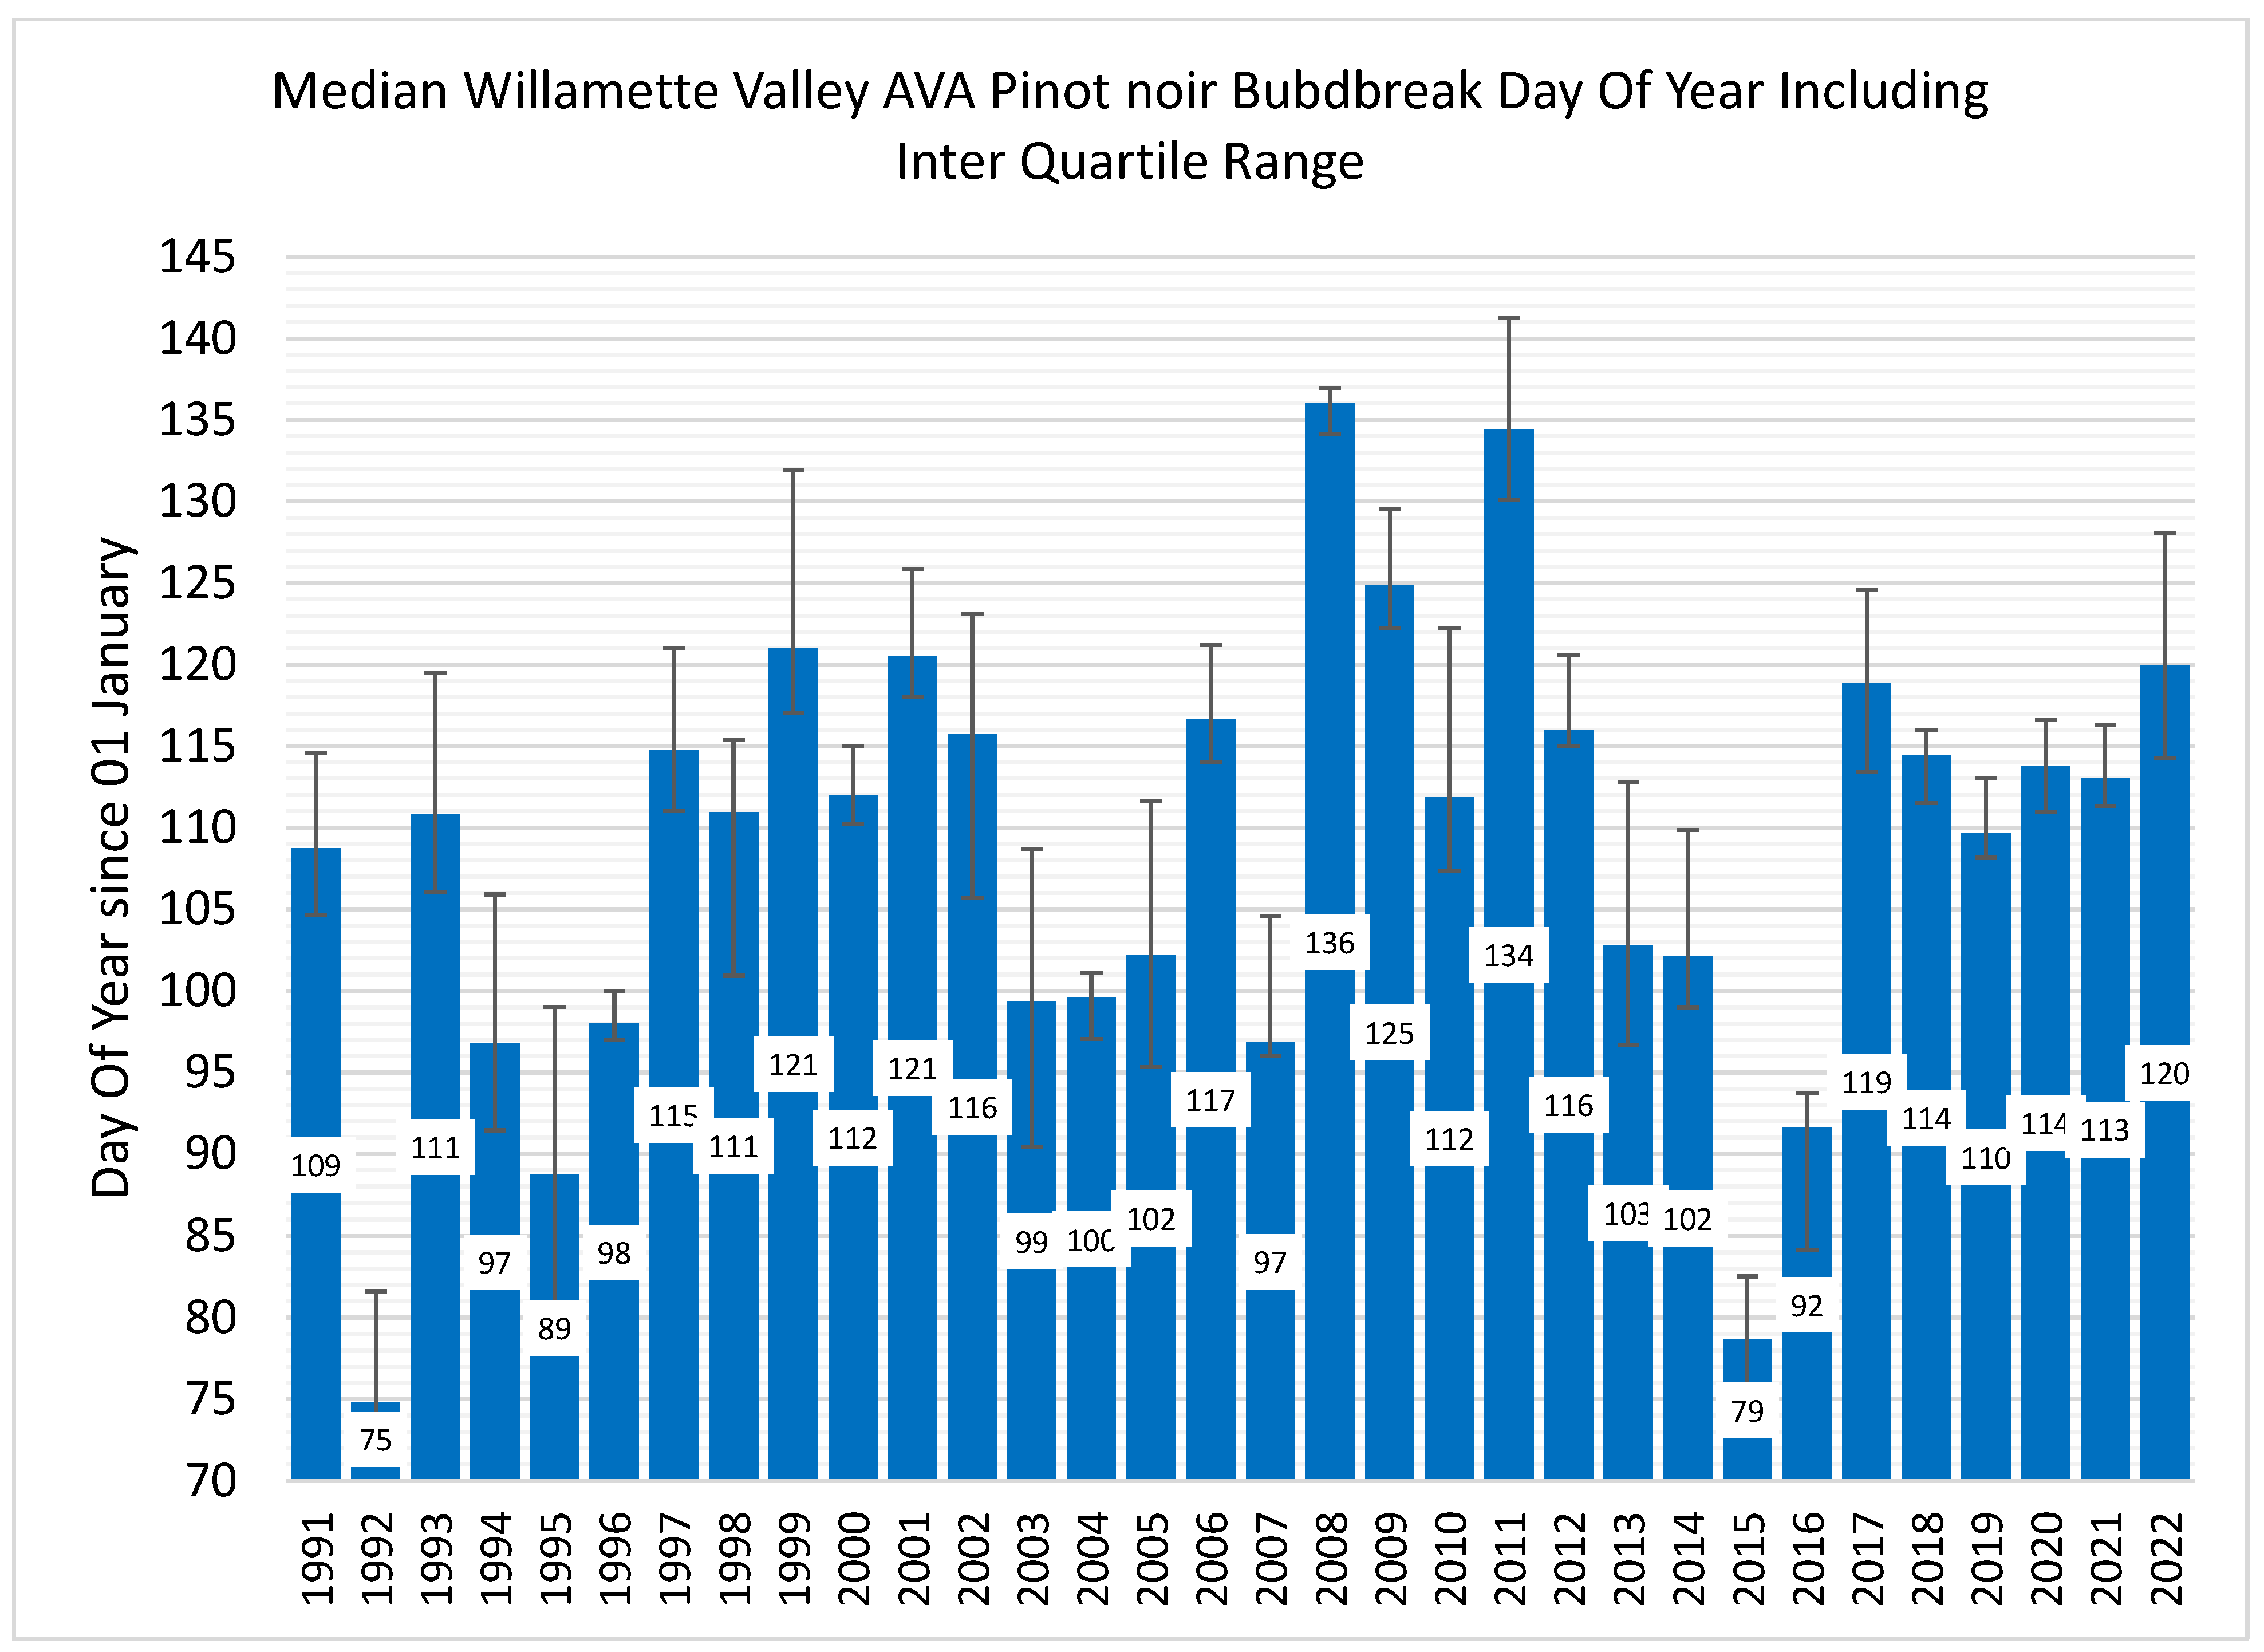
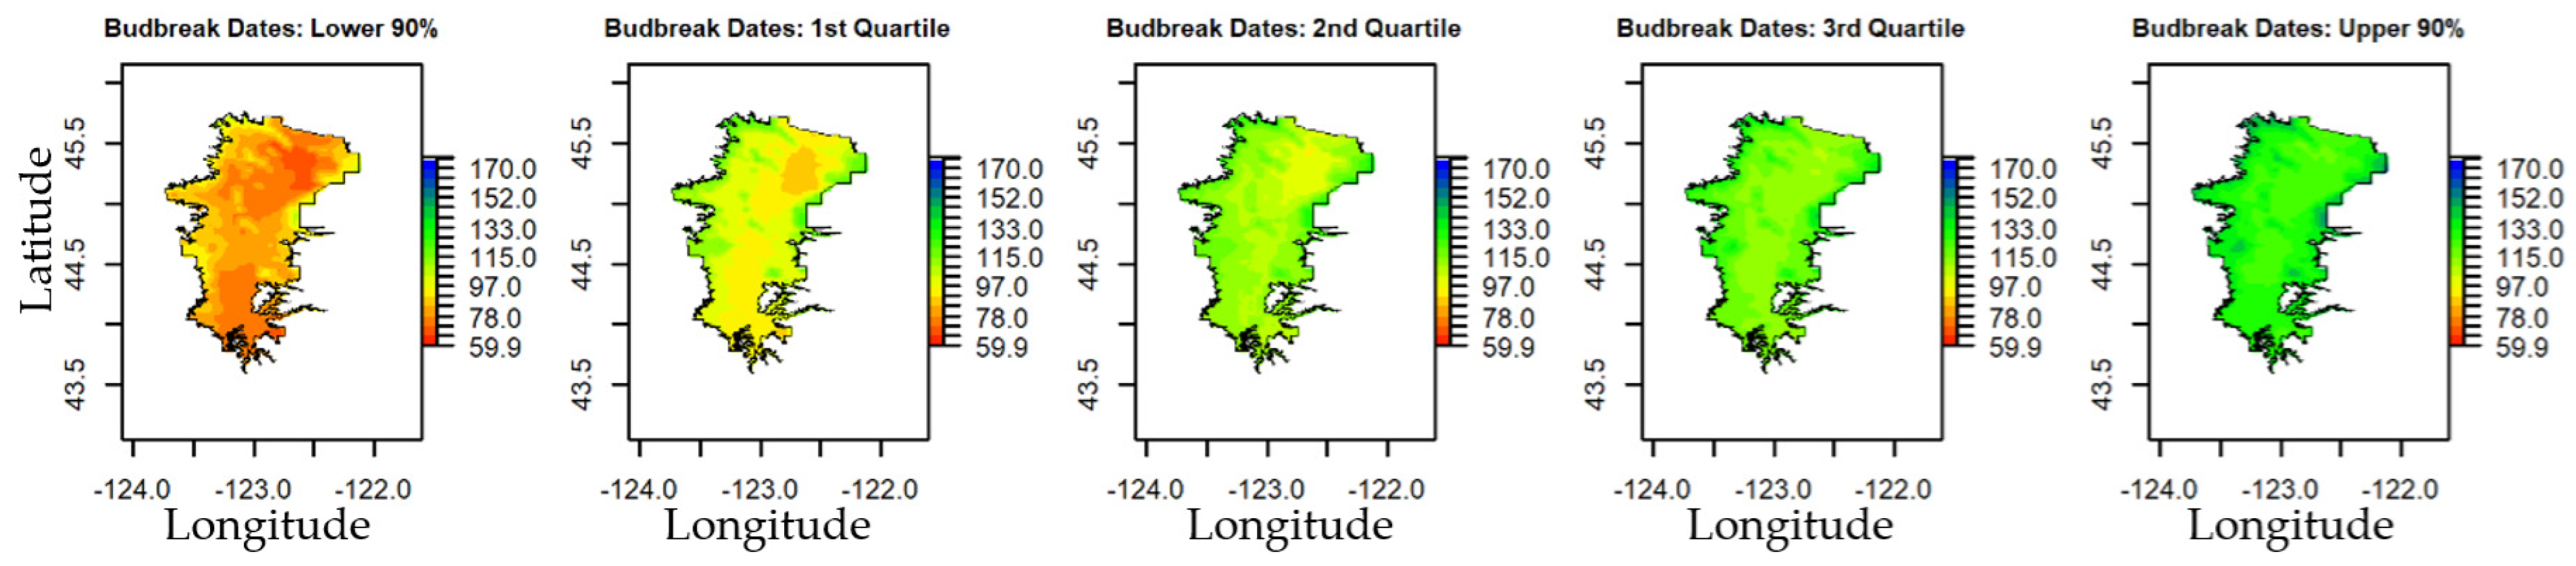
3.1. Computed Budbreak Estimates

Figure 3 plots the computed Pinot noir budbreak day of year value on a gridded basis throughout the WV AVA for 1991–2022. The computed Pinot noir budbreak day of year values varied from year to year. For some years, they were relatively early (e.g., 1992, 1995, 2015, 2016) while for other years they were somewhat late (e.g., 1999, 2001, 2008, 2011). In addition, they were rather uniform throughout the AVA for some years (e.g., 1996, 2004, 2008) while highly variable other years (e.g., 1995, 2003).
Figure 4 plots the median Pinot noir budbreak day of year value computed throughout the WV AVA for 1991–2022, including the 1st and 3rd quartile values. To a degree, these data corroborated the information gleaned from the spatial datasets presented in Figure 3. The relatively early, late, uniform, and variable years were easily identified from this summary of the computed Pinot noir budbreak day of year values for the WV AVA. The median Pinot noir budbreak day of year value computed throughout the WV AVA was as early as 15 March in 1992 and as late as 15 May in 2008. Its mean across all 32 years was the 109th day of the year (18/19 April).
Figure 5 plots maps of the 5, 25, 50, 75, and 95th percentiles for the computed Pinot noir budbreak day of year value at each PRISM data grid location for 1991–2021. For the median (50%) computed Pinot noir budbreak day of year grid, its 1st, 2nd, and 3rd quartile values were 108 (17/18 April), 111 (20/21 April), and 115 (24/25 April), respectively. When only the northern WV AVA was considered, these values were 104 (13/14 April), 110 (19/20 April), and 116 (25/26 April), respectively. The mean was 111 (20/21 April). These values agreed reasonably well with, albeit somewhat greater than, the long-term observed budbreak average of 13 April (103/104) reported by Jones [62] for the northern WV AVA.
The 2nd quartile values associated with the 5, 25, 50, 75, and 95th percentile maps for the computed Pinot noir budbreak day of year value were 82 (22/23 March), 99 (08/09 April), 111 (20/21 April), 116 (25/26 April), and 130 (09/10 May), respectively. The risk for a spring frost event and potential cold damage was expected to be greater for the springtime date windows whose starting values were associated with the earlier budbreak dates [2,43].

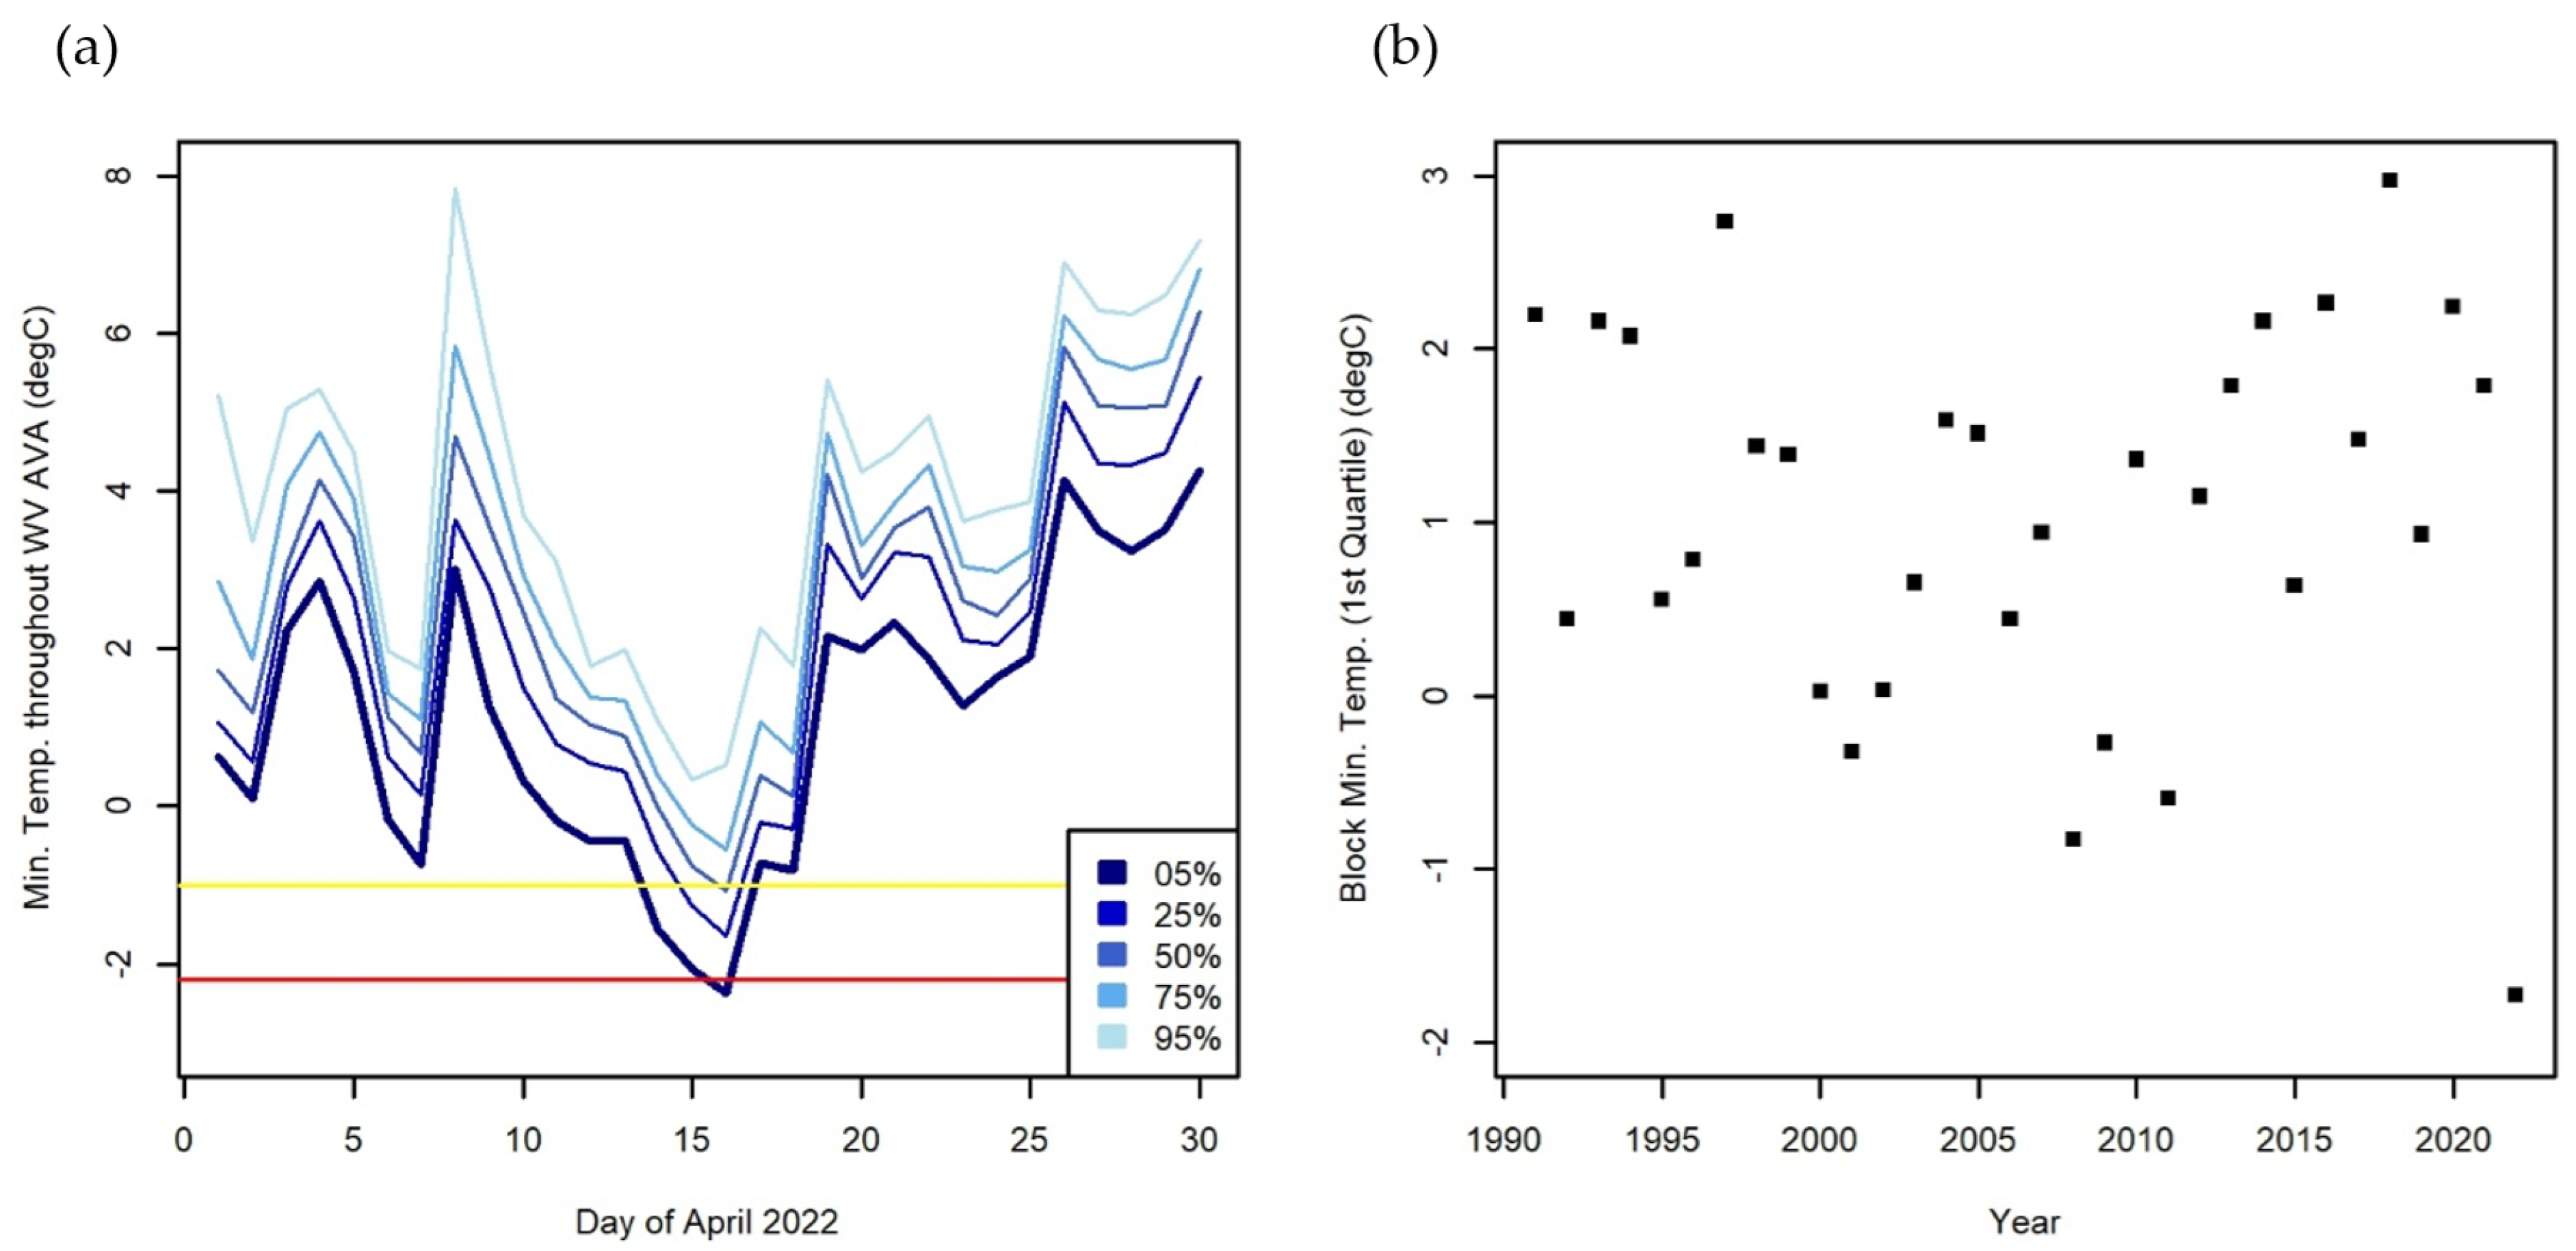
3.2. April 2022 Frost Event

Figure 6a plots the distribution of gridded PRISM daily minimum surface air temperature data throughout the WV AVA for April 2022. The yellow (−1 °C) and red (−2.2 °C) horizontal lines in Figure 6a are the no injury/injury and LT50 budbreak threshold temperature values for Vitis vinifera L. cv. Pinot noir (Table 1). Approximately half of the WV AVA experienced minimum surface air temperature values less than the Pinot noir cold injury budbreak temperature threshold on 16 April 2022. For that day, 0, 8.5, and 12.8 percent of the AVA experienced temperature values less than the LT50 for Pinot noir at woolly bud, budbreak, and first leaf, respectively [6,25,26,27,51]. Potential cold damage was less extensive the previous day, where approximately 40% of the WV AVA experienced temperatures less than the Pinot noir cold injury threshold and only 2.9 and 6.6 percent of the WV AVA experienced temperatures less than the LT50 for Pinot noir at budbreak and 1st leaf. The computed budbreak map for 2022 (Figure 3) showed that early budbreak was mostly concentrated in the northern WV AVA.
Figure 6b is a plot of the block minima dataset that was prepared for the PRISM data grid location in the WV AVA with a longitude and latitude in decimal degrees of −123.25 and 45. 3 ¯ , respectively (Figure 2). The starting date value for this block minima dataset was defined to be the 1st quartile of the computed budbreak day of year values from 1991 to 2021. The 1st quartile budbreak day of year value at the grid location equaled the date of the April 2022 frost event. For the block minima dataset plotted in Figure 6b, the 2022 observation was the last data point and notably less than the remainder of the extreme event data. Previous studies that applied EVT have examined datasets, of extreme precipitation [36] and extreme flood data [35], that were similar in form. The form of the dataset plotted in Figure 6b motivated an analysis of springtime frost risk before and after the April 2022 frost event, not only at this grid location, but throughout the WV AVA.

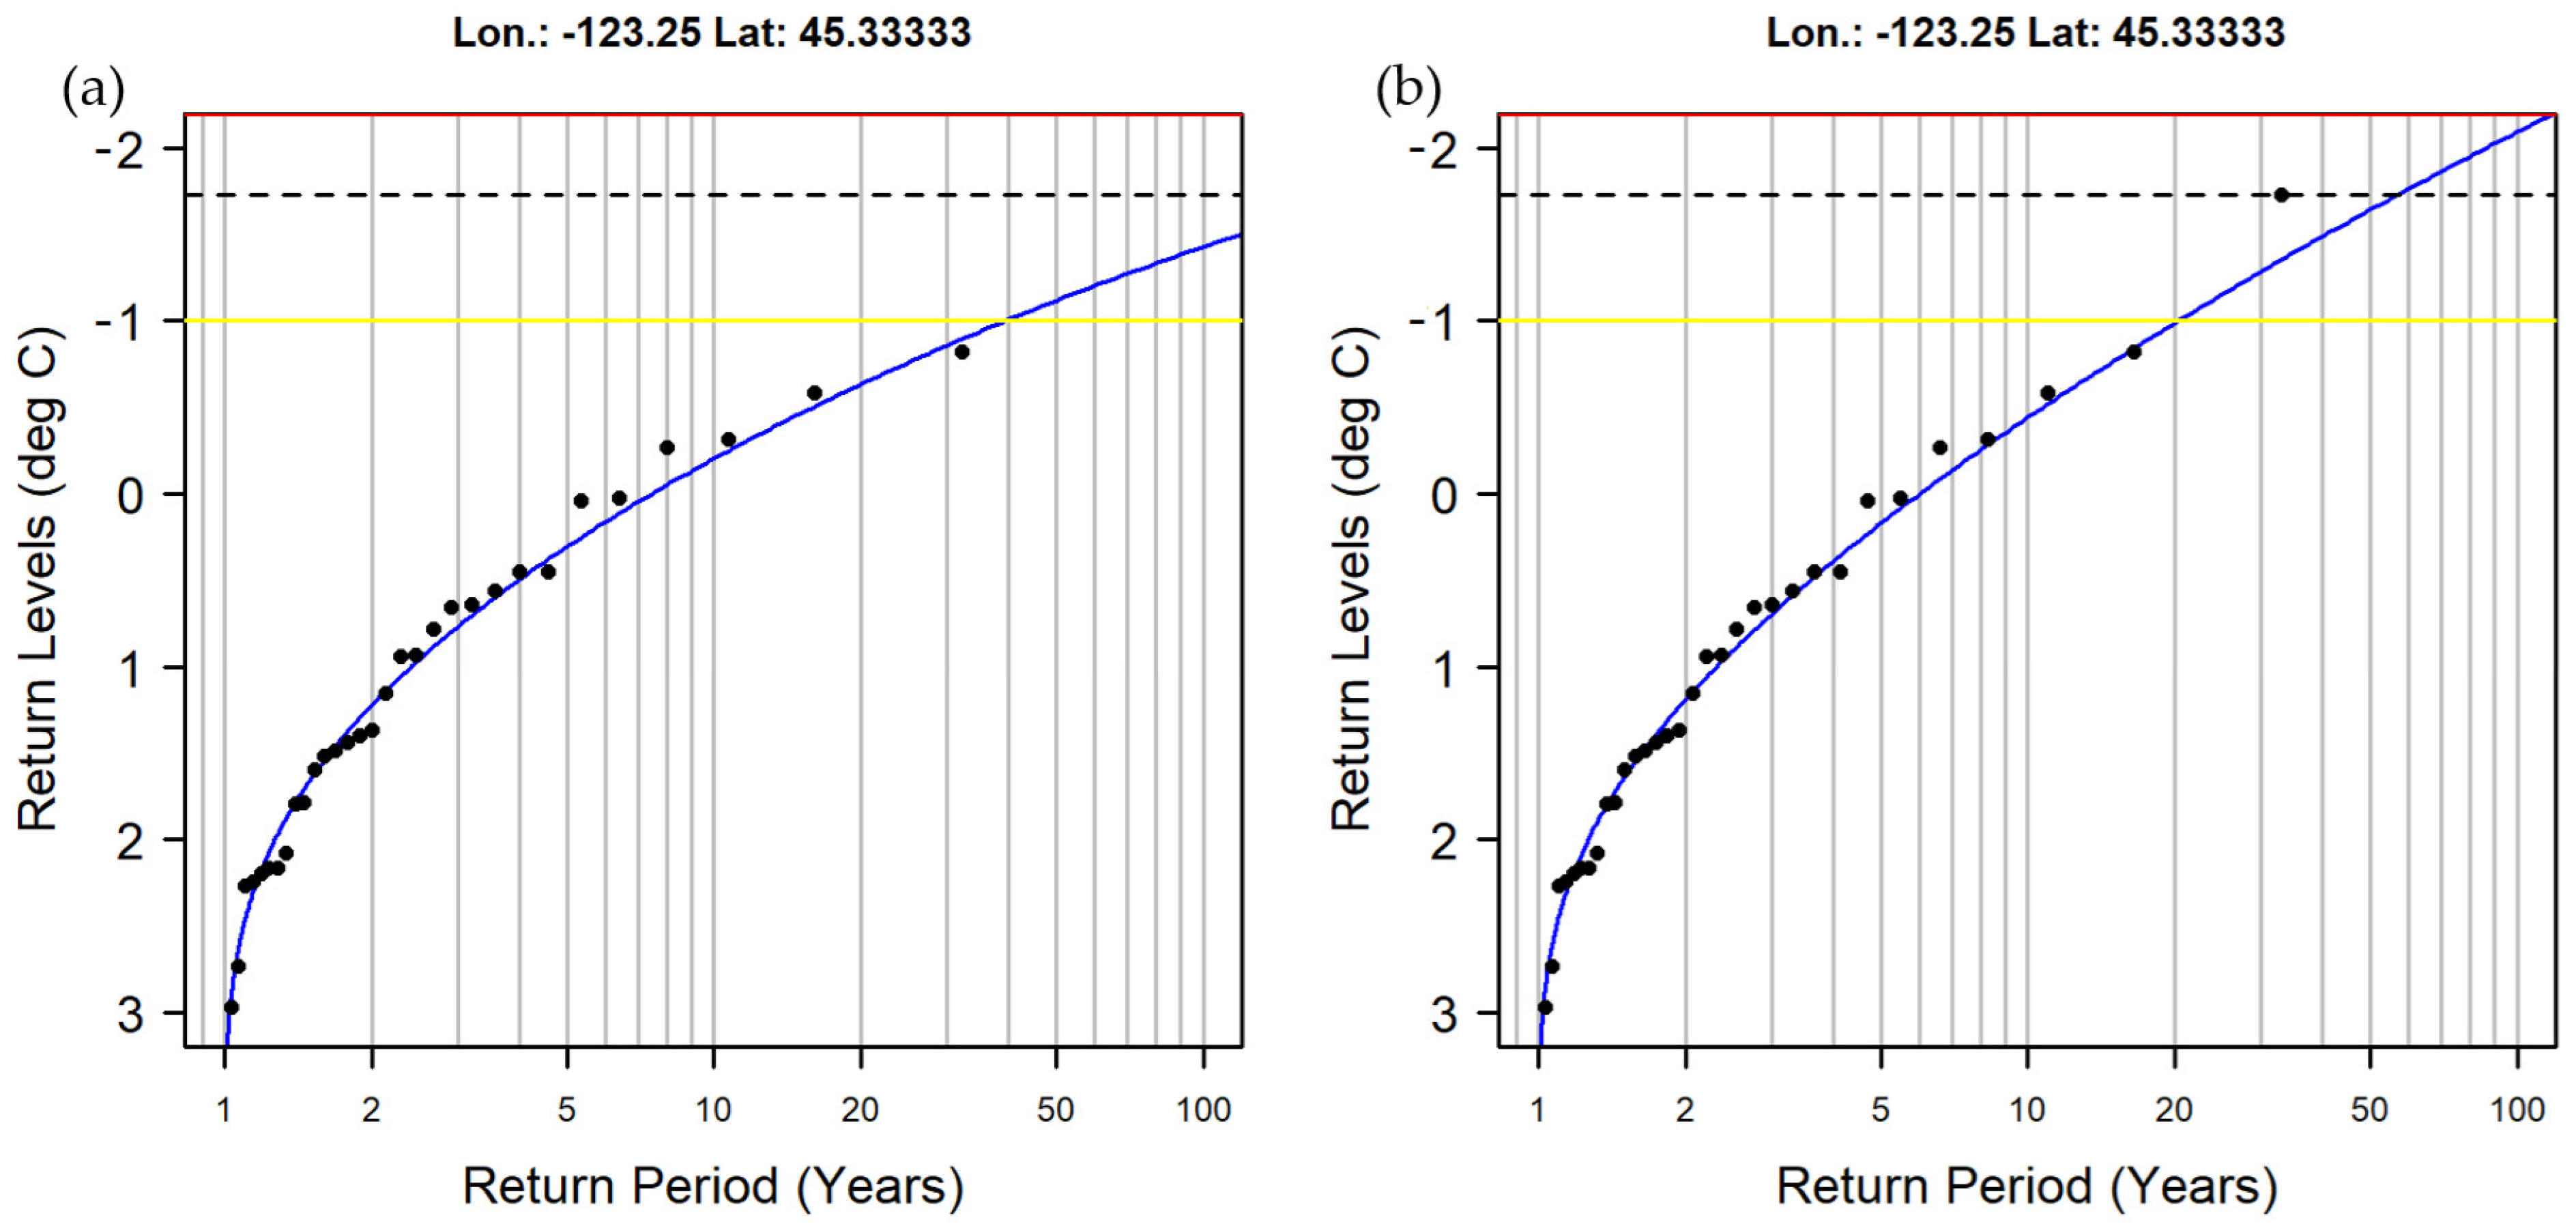
3.3. Return Level Estimates for a Single PRISM Grid Data Location

Figure 7 plots computed return levels as a function of return period for the PRISM data grid location in the WV AVA with a longitude and latitude in decimal degrees of −123.25 and 45. 3 ¯ , respectively (Figure 2). The computed return levels were associated with the GEV models fitted, at the grid location, with the block minima datasets from 1991 to 2021 and 1991–2022, and whose date window starting values were equal to the 1st quartile of the budbreak day of year values from 1991 to 2021.
The 2022 frost event clearly impacted the risk assessment at the grid location. Prior to the 2022 event, the budbreak injury threshold of −1 °C was expected to be exceeded approximately once every 40 years. After the 2022 extreme event, that exceedance return period was halved to 20 years. Further, the return period for the 2022 event observation was greater than 100 years based on the modelled results using the 1991–2021 block minima dataset. The estimated return period for the 2022 event observation from the GEV model fitted with the 1991–2022 block minima dataset was approximately 60 years.

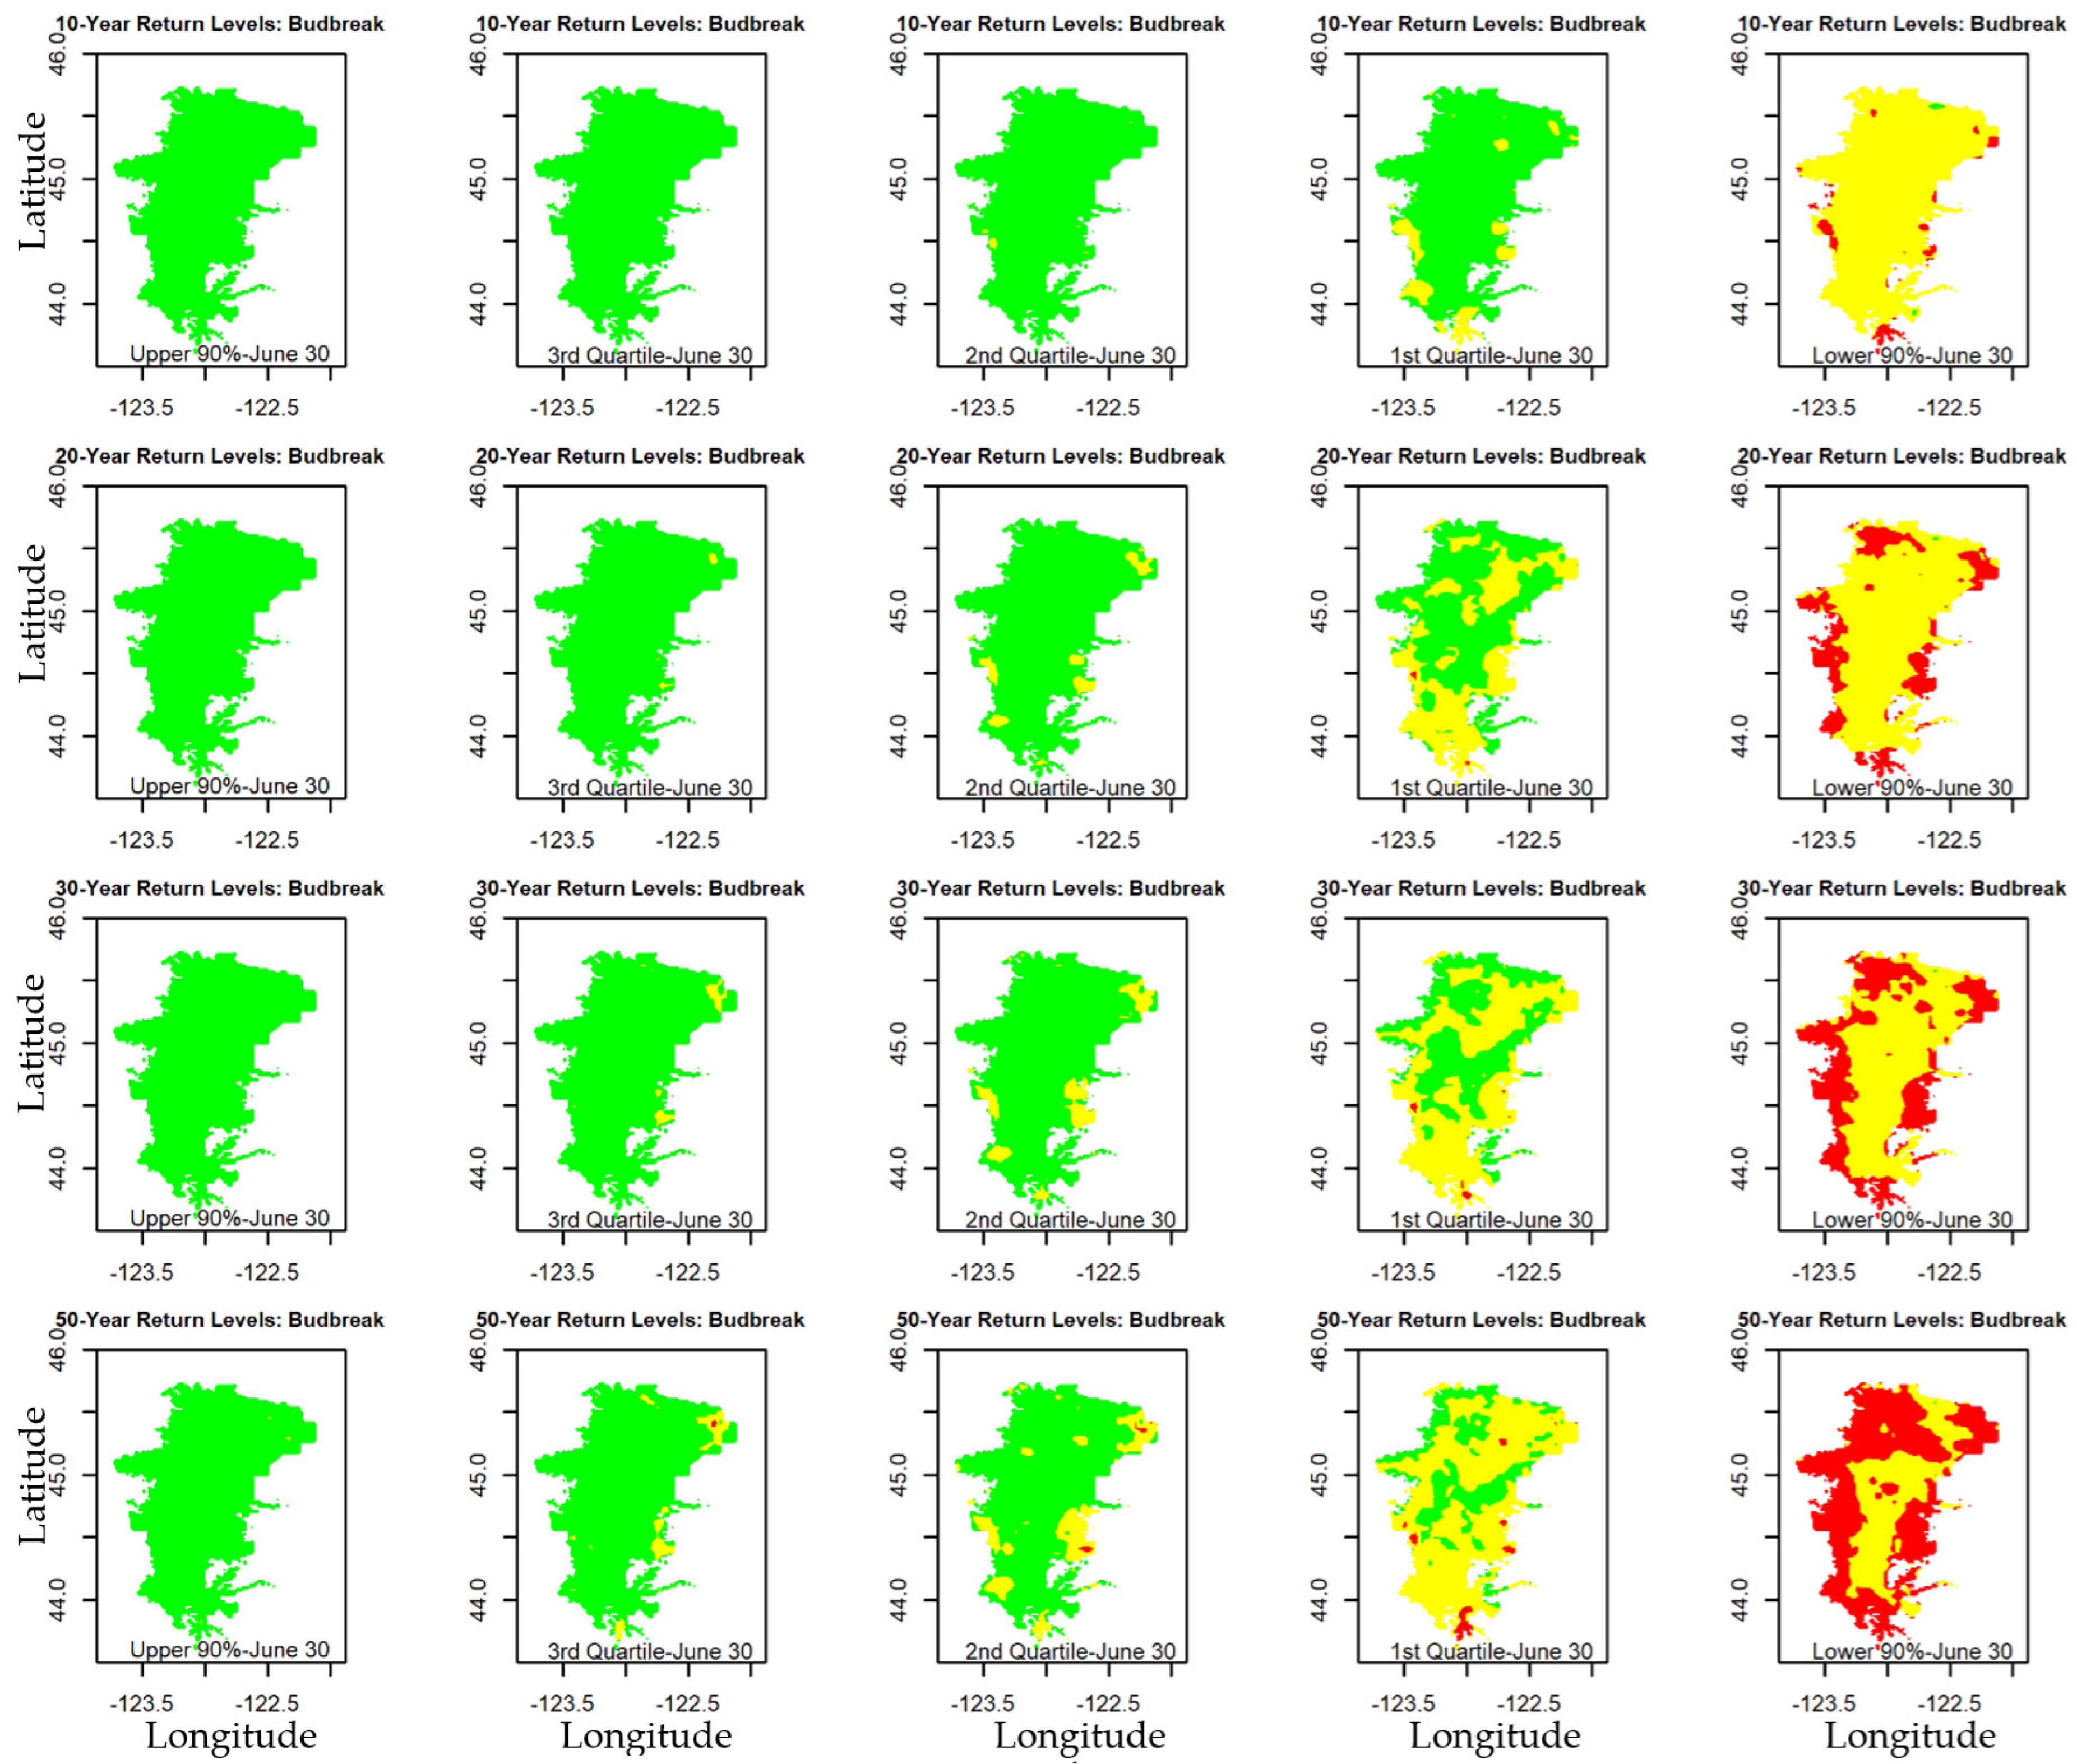
3.4. Reclassified Gridded Return Level Maps

Figure 8 plots return levels computed on a gridded basis throughout the WV AVA for four return periods (10, 20, 30, and 50 years), reclassified relative to the no injury/injury and LT50 budbreak threshold temperature values for Vitis vinifera L. cv. Pinot noir (Table 1). The return levels are associated with the GEV models that were fit to five distinct 1991–2021 block minima datasets at each PRISM data grid location, which had date window starting values defined by the 5% (lower 90%), 25%, 50%, 75%, and 95% (upper 90%) values for budbreak day of year based on the computed budbreak dates from 1991 to 2021. Figure 9 plots comparable gridded pointwise return level maps derived from the GEV models fitted to the 1991–2022 block minima datasets at each grid location. Table 2 summarizes the percent of the WV AVA area that was reclassified as no injury (green areas in Figure 8 and Figure 9), less than the injury threshold but greater than the LT50 budbreak threshold for Vitis vinifera L. cv. Pinot noir (Table 1) (yellow areas in Figure 8 and Figure 9), and equaling or exceeding the LT50 budbreak threshold temperature (red areas in Figure 8 and Figure 9) for the 20-year and 30-return return periods for the 1991–2021 and 1991–2022 block minima datasets.
The gridded pointwise return level maps presented in Figure 8 and Figure 9 show the spatiotemporal variation of springtime frost risk throughout the WV AVA. The risk for budbreak cold damage increased with increasing return period, for the models whose block minima date window starting values were earlier, and when the 2022 extreme event observations were included. When the 2022 extreme event observations were considered in the analysis, the increased risk for cold damage relative to the results that excluded the 2022 observations was most apparent for the higher return periods and the block minima datasets whose date window starting values were associated with an earlier budbreak.
The risk for any budbreak cold injury throughout the WV AVA was relatively low at the 30-year return period for either the 1991–2021 or 1991–2022 block minima datasets whose date window starting values were associated with the 50% values for budbreak day of year based on the computed budbreak dates from 1991 to 2021. For the 1991–2021 block minima datasets, the 30-year return level map indicated that 91% of the AVA would not experience any budbreak cold damage. That percentage decreased by only 0.3% for the 1991–2022 block minima datasets. For each of the modelled datasets, the remaining AVA area experienced some degree of cold injury, but there were no exceedances beyond the budbreak LT50 threshold.
The risk for cold damage climbed when the GEV model fitting and subsequent return level estimation was conditioned on a block minima dataset with a date window starting value associated with an earlier computed budbreak. For the 1991–2021 block minima datasets with date window starting values associated with the 25% values for budbreak day of year based on the computed budbreak dates from 1991 to 2021, on average once every 30 years approximately 0.5%, 58%, and 41.5% of the AVA would experience an exceedance of the budbreak LT50 threshold, cold injury but no exceedance of the budbreak LT50 threshold, and no injury, respectively. Those values shifted to 0.5%, 70%, and 29.5% for the 1991–2022 block minima datasets with the same date window starting values.
When the 1991–2021 and 1991–2022 block minima datasets date window starting values were associated with the 5% values for budbreak day of year based on the computed budbreak dates from 1991 to 2021, only 0.04% of the AVA was modelled to experience no cold injury for the 30-year return period. For the 1991–2021 block minima datasets, the 30-year return level maps showed that 39.91% and 60.05% of the AVA area would exceed the budbreak LT50 threshold or experience some cold injury but not exceed the budbreak LT50 threshold, respectively. Those numbers changed slightly to 41.51% and 58.45% for the 1991–2022 block minima datasets.
The data contained in Table 2 suggested that for a given return period, the impact of the 2022 event observations rose, peaked, and receded as the block minima dataset date window starting value decreased.
For the purposes of demonstration, this study considered five percentiles (5 (lower 90), 25, 50, 75, and 95 (upper 90)) of the computed Pinot noir budbreak day of year values at each PRISM data grid location from 1991 to 2021 to define the block minima datasets’ date window starting values. Additional percentiles could be considered, particularly for earlier dates, to account for the identified bias toward simulating a later long-term mean budbreak for the northern WV AVA relative to the observations [62] and the notable difference in the day of year values associated with the 1st quartile and lower 90% gridded values derived from the computed budbreak dates from 1991 to 2021. Their difference ranged from 7 to 36 days. Doing so would not only yield a catalog of reclassified return level maps that potentially depict smoother transitions, with time, for the assessment of Pinot noir budbreak cold damage risk throughout the AVA (for no injury, injury but not exceeding the LT50 threshold, and exceedance of the LT50 threshold), but also provide a more precise estimate of the risk for cold injury at any given location and date.
Given the gridded nature of the PRISM temperature data and that the study primarily focused on profiling the risk for budbreak cold damage, the five block minima date window starting values were specified to vary spatiotemporally, using the PRISM temperature data grid and the distribution of the computed budbreak dates at each grid point. However, the block minima date window starting values could have been defined in a more arbitrary manner instead, without using the computed budbreak date distributions. The current study’s EVT-based analysis for quantifying frost risk is not necessarily dependent upon a potentially uncertain predetermined budbreak date estimate [43]. Reclassified pointwise return level maps like those shown in Figure 8 and Figure 9 could have also been developed for the springtime phenological stages of 1st leaf, 2nd leaf, and 4th leaf using the critical temperature threshold data from Table 1 and the same, or differently defined, block minima datasets.
The reclassified pointwise return level maps like the ones shown in Figure 8 and Figure 9 could potentially guide vineyard-management action at any given location throughout the WV AVA when there is a forecasted springtime frost event and the springtime phenology date is known. For vineyard locations mapped to be low risk for springtime frost risk, one could decide to take no action in anticipation of the frost event [6].
The results presented in Figure 7, Figure 8 and Figure 9, and Table 2 demonstrated that this study’s approach for quantifying frost risk is flexible and can be readily updated, for example, on a yearly basis. Moreover, the data and results underscored the importance of updating risk maps on a regular basis. The approach is also flexible in that it could be applied to assess winter freeze risk and duration specific exceedances above summertime maximum temperature thresholds and incorporate that information into a spatial vineyard site suitability analysis. Winter freeze and summertime maxima risk analyses are anticipated to be more straightforward than the analysis of this study that involved the consideration of a temporally evolving springtime frost risk.
The approach presented in this study to spatially compute the risk for springtime cold damage directly relates to springtime phenology critical temperature thresholds (Table 1). The maps shown in Figure 8 and Figure 9 are not necessarily definitive in that there are 10 additional years (1981–1990) of available gridded historical PRISM temperature data that could have been included in the analysis. Other gridded datasets could also be used with the approach outlined in this study [63,64], including future climate projections [65,66]. In addition, this analysis did not account for the slight discrepancy between the elevation of the PRISM surface air temperature observations (2 m above ground level) and the typical elevation of the fruiting wire (approximately 1 m above ground level).
The approach taken in this study leveraged the gridded nature of the PRISM historical observed temperature data to develop the pointwise return level maps. For cases where gridded observations are not available, one could build spatial GEV models, trading space for time by pooling data from neighboring stations to improve estimation and leveraging physiographic and climatological covariate data to spatially distribute, in a parsimonious manner, the extremal model parameters to build gridded return level maps like those produced in this study [67].

3.5. Spatial Vineyard Site Selection Combining Ripening Potential and Springtime Frost Risk

Figure 10 presents four spatial analyses that each combined a map which identified the area throughout the WV AVA defined to be optimal for ripening Pinot noir with a map that communicated the risk of potential springtime Pinot noir cold damage.
The ripening potential map was the same for all four analyses. It was based on application of the growing season average temperature (GST) index [17,19]. The GST index was computed using the PRISM climate normals temperature datasets for the period 1991–2020 [51]. The areas with a computed GST 14 ,   16   ° C , shown in cyan in Figure 10a–d, was the WV AVA area defined to be optimal for ripening cool climate Pinot noir winegrapes [52,53].
The springtime cold damage maps were the 30-year return level maps that were computed with the GEV models that used the block minima datasets for 1991–2021 (Figure 10a,b) and 1991–2022 (Figure 10c,d). Their springtime date window starting values were defined by the 25% and 5% values for budbreak day of year based on the computed budbreak dates from 1991 to 2021. They were reclassified relative to the no injury/injury and LT50 budbreak threshold temperature values for Vitis vinifera L. cv. Pinot noir (Table 1).
The first and third analyses (Figure 10a,c) assumed that only the 30-year return levels reclassified to experience no cold injury would be combined with the cool climate ripening potential map. The second and fourth analyses (Figure 10b,d) considered 30-year return level maps representative of a lower risk tolerance. However, these applications had to relax the assumption of what area to include in the climate focused vineyard site-selection spatial analysis. In this case, there was little to no area mapped to experience no cold injury on average once every 30 years. Hence, areas that would experience cold injury but not exceed the LT50 budbreak threshold temperature were selected to be combined with the ripening potential map.
The results from the first and third analyses (Figure 10a,c) showed that the April 2022 frost event observations noticeably impacted the spatial vineyard suitability analysis. Before the event, 36.7% of the WV AVA would be classified as suitable for growing cool climate Pinot noir winegrapes. After the April 2022 event, that value reduced to 24.5%.
The April 2022 event observations impacted to a lesser degree the suitability analysis results from the second and fourth analyses. Before the event, 52.5% of the WV AVA would be classified as suitable for growing cool climate Pinot noir winegrapes. After the April 2022 event, that value reduced to 50.8%.
However, if the 1st/3rd and 2nd/4th analyses were compared consistently, with the 1st and 3rd analyses also allowing some cold injury but no exceedance of the LT50 budbreak temperature threshold, then 88.1% of the WVA AVA would be classified as suitable for vineyard site selection before and after the April 2022 event.
When simultaneously evaluating Pinot noir ripening potential with springtime frost risk using historical data, the limiting factor for vineyard site selection throughout the WV AVA was frost risk, not ripening potential [10]. A spring frost is a major risk factor for successful wine production that can potentially introduce a detrimental penalty at the beginning of a growing season. In this context, the entire cultivation of a site must be questioned since the vineyard requires special cultivation, in particular plant protection [6]. The entire harvest will be subject to a higher effort with nonhomogeneous berry ripening.
There was a subjective element to the vineyard spatial suitability analysis that combined a map of optimal ripening potential with a map that assessed the risk of springtime frost risk. A springtime frost risk map, reclassified relative to the springtime critical temperature thresholds (Table 1), must be selected compatible with one’s individual risk tolerance. The results are dependent upon the risk tolerance level assumed.
Only maps of ripening potential and springtime frost risk were considered for the vineyard spatial suitability analysis. Maps representing other factors relevant for vineyard site suitability could also be included [9,10,12,13]. The approach is applicable for other winegrape-growing regions.

4. Conclusions

This study introduced the first application of EVT for the spatial analysis of grapevine springtime frost risk while using gridded historical temperature observations. Results from the approach were directly compatible with springtime phenology critical temperature threshold data.
Gridded pointwise return level maps resulting from the EVT model applications, reclassified relative to the no injury/injury and LT50 threshold temperature values for Vitis vinifera L. cv. Pinot noir (Table 1), have the potential to impact vineyard management with a forecasted frost event, particularly, no remedial action for those areas identified to be of low risk for springtime cold damage. The EVT-based risk analysis can be readily updated each year as new data become available.
The reclassified gridded pointwise return level maps were readily combined with spatial products of ripening potential to identify optimal areas for vineyard site selection throughout the WV AVA. The application results depended on the selected springtime frost risk map.
While the study focused on the WV AVA, the approach is applicable for other winegrape-growing regions. Opportunities for future related research include similar applications in other winegrape-growing regions, including vineyard spatial suitability analyses that consider other relevant spatial data products in addition to ripening potential and springtime frost risk, the consideration of other gridded temperature data products including climate change projections, assessments of winter freeze risk and summertime heatwaves, and the use of non-gridded observed temperature datasets. Results from such studies could help to present known risks for the cultivation of vines in a small-scale resolution and to make well-founded decisions based on a wide variety of climatologically important aspects.

Author Contributions

Conceptualization, B.S., B.B. and M.S.; methodology, B.S., B.B. and M.S.; formal analysis, B.S.; investigation, B.S., B.B. and M.S.; writing—original draft preparation, B.S.; writing—review and editing, B.S., B.B. and M.S.; visualization, B.S., B.B. and M.S.; supervision, B.B. and M.S. All authors have read and agreed to the published version of the manuscript.

Funding

This research received no external funding.

Data Availability Statement

Publicly available datasets were analyzed in this study. These data can be found here: https://www.prism.oregonstate.edu/ (accessed on 23 March 2024).

Acknowledgments

The first author would like to thank the Northwest Wine Studies Center Wine Studies Program located at Chemeketa Eola in the Eola-Amity Hills sub-AVA of the Willamette Valley AVA for their support of this research project. The authors thank the reviewers for their comments which improved this article.

Conflicts of Interest

The authors declare no conflicts of interest.

References

  1. Evans, K.J.; Bricher, P.K.; Foster, S.D. Impact of frost injury incidence at nodes of Pinot Noir on fruitfulness and growth-stage lag. Aust. J. Grape Wine Res. 2019, 25, 201–211. [Google Scholar] [CrossRef]
  2. Molitor, D.; Caffarra, A.; Sinigoj, P.; Pertot, I.; Hoffmann, L.; Junk, J. Late frost damage risk. Aust. J. Grape Wine Res. 2014, 20, 160–168. [Google Scholar] [CrossRef]
  3. Schultze, S.R.; Sabbatini, P. Impact of Early Season Temperatures in a Climate-Changed Atmosphere for Michigan: A Cool-Climate Viticultural Region. Atmosphere 2022, 13, 251. [Google Scholar] [CrossRef]
  4. Meier, M.; Fuhrer, J.; Holzkämper, A. Changing risk of spring frost damage in grapevines due to climate change? A case study in the Swiss Rhone Valley. Int. J. Biometeorol. 2018, 62, 991–1002. [Google Scholar] [CrossRef] [PubMed]
  5. Madelin, M.; Beltrando, G. Spatial interpolation-based mapping of the spring frost hazard in the Champagne vineyards. Meteorol. Appl. 2005, 12, 51–56. [Google Scholar] [CrossRef]
  6. Sugar, D.; Gold, R.; Lombard, P.; Gardea, A. Strategies for Frost Protection. In Oregon Viticulture; Hellman, E.W., Ed.; Oregon State University Press: Corvallis, OR, USA, 2002; pp. 213–217. [Google Scholar]
  7. Poling, E.B. Spring Cold Injury to Winegrapes and Protection Strategies and Methods. HortScience 2008, 43, 1652–1662. [Google Scholar] [CrossRef]
  8. Jones, G.V.; Hellman, E.W. Site Assessment. In Oregon Viticulture; Hellman, E.W., Ed.; Oregon State University Press: Corvallis, OR, USA, 2002; pp. 44–50. [Google Scholar]
  9. Yau, I.; Davenport, J.R.; Moyer, M.M. Developing a Wine Grape Site Evaluation Decision Support System for the Inland Pacific Northwestern United States. HortTechnology 2014, 24, 88–98. [Google Scholar] [CrossRef]
  10. Kurtural, S.K.; Dami, I.E.; Taylor, B.H. Utilizing GIS Technologies in Selection of Suitable Vineyard Sites. Int. J. Fruit Sci. 2007, 6, 87–107. [Google Scholar] [CrossRef]
  11. Tesic, D. Vineyard Location Analysis for Site Selection and Evaluation. Acta Hortic. 2004, 640, 27–35. [Google Scholar] [CrossRef]
  12. Nowlin, J.; Bunch, R.; Jones, G. Viticultural Site Selection: Testing the Effectiveness of North Carolina’s Commercial Vineyards. Appl. Geogr. 2019, 106, 22–39. [Google Scholar] [CrossRef]
  13. Kurtural, S.K.; Wilson, P.E. Vineyard Site Selection in Kentucky Based on Climate and Soil Properties; University of Kentucky College of Agriculture Cooperative Extension Service: Lexington, KY, USA, 1987; pp. 1–4. Available online: https://www2.ca.uky.edu/agcomm/pubs/ho/ho87/ho87.pdf (accessed on 28 February 2024).
  14. Chien, M.L. A Practical Guide to Developing a Commercial Wine Vineyard. Available online: https://www.vineyardteam.org/files/resources/Draft%20Copy%20of%20A%20Practical%20Guide%20to%20Developing%20a%20Commercial%20Wine%20Vineyard.pdf (accessed on 28 February 2024).
  15. Skinkis, P.A. Establishing a Vineyard in Oregon: A Quick-Start Resource Guide; Oregon State University Extension Service: Corvallis, OR, USA, 2022; pp. 1–9. Available online: https://extension.oregonstate.edu/pub/em-8973 (accessed on 28 February 2024).
  16. Winkler, J.; Cook, J.; Kliewer, W.M.; Lider, L.A. General Viticulture, 4th ed.; University of California: Berkeley, CA, USA, 1974. [Google Scholar]
  17. Jones, G.V.; Duff, A.; Hall, A.; Myers, J. Spatial Analysis of Climate in Winegrape Growing Regions in the Western United States. Am. J. Enol. Viticulture. 2010, 61, 313–326. Available online: https://www.ajevonline.org/content/61/3/313 (accessed on 5 January 2020). [CrossRef]
  18. Badr, G.; Hoogenboom, G.; Abouali, M.; Moyer, M.; Keller, M. Analysis of several bioclimatic indices for viticultural zoning in the Pacific Northwest. Clim. Res. 2018, 76, 203–223. [Google Scholar] [CrossRef]
  19. Jones, G.V. Climate and terroir: Impacts of climate variability and change on wine. In Fine Wine and Terroir: The Geoscience Perspective; Macqueen, R.W., Meinert, L.D., Eds.; Geoscience Canada Reprint Series; Geo-logical Association of Canada: St. John’s, NL, Canada, 2006; p. 203. [Google Scholar]
  20. Huglin, M. Nouveau Mode d’Évaluation des Possibilités Héliothermiques d’un Milieu Viticole. C. R. Acad. Agric. Fr. 1978, 64, 1117–1126. [Google Scholar]
  21. Parker, A.K.; García de Cortázar-Atauri, I.; Gény, L.; Spring, J.-L.; Destrac, A.; Schultz, H.; Molitor, D.; Lacombe, T.; Graça, A.; Monamy, C.; et al. Temperature-based grapevine sugar ripeness modelling for a wide range of Vitis vinifera L. cultivars. Agric. For. Meteorol. 2020, 285–286, 107902. [Google Scholar] [CrossRef]
  22. Ferguson, J.C.; Moyer, M.M.; Mills, L.J.; Hoogenboom, G.; Keller, M. Modeling Dormant Bud Cold Hardiness and Budbreak in Twenty-Three Vitis Genotypes Reveals Variation by Region of Origin. Am. J. Enol. Vitic. 2014, 65, 59–71. [Google Scholar] [CrossRef]
  23. Ferguson, J.C.; Tarara, J.M.; Mills, L.J.; Grove, G.G.; Keller, M. Dynamic thermal time model of cold hardiness for dormant grapevine buds. Ann. Bot. 2011, 107, 389–396. [Google Scholar] [CrossRef]
  24. Saxena, A.; Pesantez-Cabrera, P.; Ballapragada, R.; Lam, K.-H.; Keller, M.; Fern, A. Grape Cold Hardiness Prediction via Multi-Task Learning. Proc. AAAI Conf. Artif. Intell. 2023, 37, 15717–15723. [Google Scholar] [CrossRef]
  25. Gardea, A.A. Freeze Damage of Pinot Noir (Vitis vinifera L.) as Affected by Bud Development, INA Bacteria, and Bacterial Inhibitor. Master’s Thesis, Oregon State University, Corvallis, OR, USA, 1987. Available online: https://ir.library.oregonstate.edu/concern/graduate_thesis_or_dissertations/gt54kq01r (accessed on 11 August 2023).
  26. Levin, A.; Copp, C.; Skinkis, P. Resources for Vineyard Frost Protection; Oregon State University, Oregon Wine Research Institute: Corvallis, OR, USA, 2022; pp. 1–6. Available online: https://files.constantcontact.com/27fc1a43201/d4d977ab-eec3-470c-8e92-07951569b00f.pdf (accessed on 15 August 2023).
  27. Poni, S.; Sabbatini, P.; Palliotti, A. Facing Spring Frost Damage in Grapevine: Recent Developments and the Role of Delayed Winter Pruning—A Review. Am. J. Enol. Vitic. 2022, 73, 211–226. [Google Scholar] [CrossRef]
  28. Coombe, B.G. Adoption of a system for identifying grapevine growth stages. Aust. J. Grape Wine Res. 1995, 1, 104–110. [Google Scholar] [CrossRef]
  29. Willamette Valley Grape Crop Is Dealt a Frosty Blow. Producers Are Anxiously Wondering How Much of Their Crop Has Been Lost to Mid-April Willamette Valley Frost Event. Available online: https://www.decanter.com/wine-news/willamette-valley-grape-crop-is-dealt-a-frosty-blow-479866/ (accessed on 2 March 2024).
  30. Oregon Winemakers Still Reeling from Freak April Frost. Available online: https://ribbonridgewinery.com/oregon-winemakers-still-reeling-from-freak-april-frost/ (accessed on 2 March 2024).
  31. Willamette Valley Vintage Reviews. Available online: https://www.willamettewines.com/trade-resources/vintage-reviews/ (accessed on 2 March 2024).
  32. Jones, G.V.; McLain, M.; Hendricks, S. Winegrowing Regions. In Oregon Viticulture; Hellman, E.W., Ed.; Oregon State University Press: Corvallis, OR, USA, 2002; pp. 51–69. [Google Scholar]
  33. 2023 Oregon Wine Symposium|Climatology Report. Available online: https://industry.oregonwine.org/resources/workshops/2023-oregon-wine-symposium-climatology-report/ (accessed on 29 February 2024).
  34. 2023 Oregon Wine Symposium|Viticulture Track|Impacts and Learning from the 2022 Frost Event. Available online: https://industry.oregonwine.org/resources/workshops/2023-oregon-wine-symposium-viticulture-track-frost/ (accessed on 29 February 2024).
  35. Viglione, A.; Merz, R.; Salinas, J.L.; Blöschl, G. Flood frequency hydrology: 3. A Bayesian analysis. Water Resour. Res. 2013, 49, 675–692. [Google Scholar] [CrossRef]
  36. Coles, S.; Pericchi, L. Anticipating catastrophes through extreme value modelling. Appl. Stat. 2003, 52 Pt 4, 405–416. [Google Scholar] [CrossRef]
  37. Koss, W.J.; Owenby, J.R.; Steurer, P.M.; Ezell, D.S. Freeze/Frost Data; Climatography of the U.S. No. 20, Supplement No. 1; U.S. Department of Commerce, National Oceanic and Atmospheric Administration, National Climatic Data Center: Asheville, NC, USA, 1988; pp. 1–191.
  38. Thom, H.C.S.; Shaw, R.H. Climatological Analysis of Freeze Data for Iowa. Mon. Wea. Rev. 1958, 86, 251–257. [Google Scholar] [CrossRef]
  39. Thom, H.C.S. The distributions of freeze-date and freeze-free period for climatological series with freezeless years. Mon. Wea. Rev. 1959, 87, 136–144. [Google Scholar] [CrossRef]
  40. Vestal, C.K. First and last occurrences of low temperatures during the cold season. Mon. Wea. Rev. 1971, 99, 650–652. [Google Scholar] [CrossRef]
  41. Interpreting Freeze/Frost Probabilities from the National Centers for Environmental Information. Available online: https://content.ces.ncsu.edu/interpreting-freezefrost-probabilities-from-the-national-centers-for-environmental-information (accessed on 5 March 2024).
  42. Interactive Map: Average Date of Last Spring Freeze across the United States. Available online: https://www.climate.gov/news-features/understanding-climate/interactive-map-average-date-last-spring-freeze-across-united (accessed on 5 March 2024).
  43. Sgubin, G.; Swingedouw, D.; Dayon, G.; García de Cortázar-Atauri, I.; Ollat, N.; Pagé, C.; van Leeuwen, C. The risk of tardive frost damage in French vineyards in a changing climate. Agric. For. Meteorol. 2018, 250–251, 226–242. [Google Scholar] [CrossRef]
  44. van Leeuwen, C.; Sgubin, G.; Bois, B.; Ollat, N.; Swingedouw, D.; Zito, S.; Gambetta, G.A. Climate change impacts and adaptations of wine production. Nat. Rev. Earth Environ. 2024, 5, 258–275. [Google Scholar] [CrossRef]
  45. Frechet, M. Sur la loi de Probabilité de l’écart Maximum. Ann. Soc. Math. Polon. 1927, 6, 93–116. [Google Scholar]
  46. Fisher, R.A.; Tippett, L.H.C. Limiting forms of the frequency distribution of the largest or smallest member of a sample. Proc. Cambridge Phil. Soc. 1928, 24, 180–190. [Google Scholar] [CrossRef]
  47. Coles, S. An Introduction to Statistical Modeling of Extreme Values; Springer: London, UK, 2001; pp. 1–209. [Google Scholar]
  48. Petitjean, T.; Bonnardot, V.; Tissot, C.; Chassaing, T.; Quénol, H. Spatial representations of the maturity potential of Chardonnay and Chenin grape varieties in the Brittany and Pays de la Loire regions (1976–2100). Climatology 2023, 21, 2. [Google Scholar] [CrossRef]
  49. Skahill, B.; Berenguer, B.; Stoll, M. Temperature-based Climate Projections of Pinot noir Suitability in the Willamette Valley American Viticultural Area. OENO One 2022, 56, 209–225. [Google Scholar] [CrossRef]
  50. Skahill, B.; Berenguer, B.; Stoll, M. Climate Projections for Pinot Noir Ripening Potential in the Fort Ross-Seaview, Los Carneros, Petaluma Gap, and Russian River Valley American Viticultural Areas. Agronomy 2023, 13, 696. [Google Scholar] [CrossRef]
  51. PRISM Climate Group, Oregon State University, Data Created 4 February 2014. Available online: https://prism.oregonstate.edu (accessed on 23 March 2024).
  52. Jones, G.V.; White, M.A.; Cooper, O.R.; Storchmann, K. Climate change and global wine quality. Clim. Change 2005, 73, 319–343. [Google Scholar] [CrossRef]
  53. Jones, G.V. Climate change and the global wine industry. In Proceedings of the Thirteenth Australian Wine Industry Technical Conference, Adelaide, Australia, 28 July–2 August 2007. [Google Scholar]
  54. Willamette Valley. Available online: https://trade.oregonwine.org/resources/willamette-valley/ (accessed on 6 March 2024).
  55. Department of the Treasury. Bureau of Alcohol, Tobacco and Firearms. Treasury Decision ATF-162, Establishment of the Willamette Valley Viticultural Area; 48 Fed. Reg. 54220 (3 January 1984) (27 CFR Part 9); Bureau of Alcohol, Tobacco and Firearms: Washington, DC, USA, 1984.
  56. Department of the Treasury. Alcohol and Tobacco Tax and Trade Bureau. Treasury Decision TTB-134, Expansion of the Willamette Valley Viticultural Area; 81 Fed. Reg. 11110 (4 April 2016) (27 CFR Part 9); Alcohol and Tobacco Tax and Trade Bureau: Washington, DC, USA, 2016.
  57. 2022 Oregon Vineyard and Winery Report. Available online: https://industry.oregonwine.org/resources/reports-studies/2022-oregon-vineyard-and-winery-report/ (accessed on 5 March 2024).
  58. Zapata, D.; Salazar-Gutierrez, M.; Chaves, B.; Keller, M.; Hoogenboom, G. Predicting Key Phenological Stages for 17 Grapevine Cultivars (Vitis vinifera L.). Am. J. Enol. Vitic. 2017, 68, 60–72. [Google Scholar] [CrossRef]
  59. R Core Team. R: A Language and Environment for Statistical Computing; R Foundation for Statistical Computing: Vienna, Austria, 2022; Available online: https://www.R-project.org/ (accessed on 1 January 2024).
  60. Stephenson, A.G. evd: Extreme Value Distributions. R. News 2002, 2, 31–32. Available online: https://CRAN.R-project.org/doc/Rnews/ (accessed on 1 January 2024).
  61. Boessenkool, B. extremeStat: Extreme Value Statistics and Quantile Estimation. R package, version 1.5.9; 2024. Available online: https://CRAN.R-project.org/package=extremeStat (accessed on 1 January 2024).
  62. Vintage and Other Miscellaneous Reports, Vintage 2022, North Willamette Valley, Gregory V. Jones, Ph.D., CEO, Abacela Vineyards and Winery. Available online: https://www.climateofwine.com/_files/ugd/07f66e_4ccab8ed9dd345939d488cd0a906ffa8.pdf?index=true (accessed on 7 May 2024).
  63. Abatzoglou, J.T. Development of gridded surface meteorological data for ecological applications and modelling. Int. J. Climatol. 2013, 33, 121–131. [Google Scholar] [CrossRef]
  64. Livneh, B.; Rosenberg, E.A.; Lin, C.; Nijissen, B.; Mishra, V.; Andreadis, K.M.; Maurer, E.P.; Lettenmaier, D.P. A long-term hydrologically based dataset of land surface fluxes and states for the conterminous United States: Updates and extensions. J. Clim. 2013, 26, 9384–9392. [Google Scholar] [CrossRef]
  65. Pierce, D.W.; Cayan, D.R.; Thrasher, B.L. Statistical Downscaling Using Localized Constructed Analogs (LOCA). J. Hydrometeorol. 2015, 15, 2558–2585. [Google Scholar] [CrossRef]
  66. Pierce, D.W.; Cayan, D.R.; Maurer, E.P.; Abatzoglou, J.T.; Hegewisch, K.C. Improved bias correction techniques for hydrological simulations of climate change. J. Hydrometeorol. 2015, 16, 2421–2442. [Google Scholar] [CrossRef]
  67. Love, C.A.; Skahill, B.E.; Russell, B.T.; Baggett, J.S.; AghaKouchak, A. An Effective Trend Surface Fitting Framework for Spatial Analysis of Extreme Events. Geophys. Res. Lett. 2022, 49, e2022GL098132. [Google Scholar] [CrossRef]
Figure 1. The boundary for the 13,876 km2 WV AVA located in the northwestern part of the State of Oregon (OR) in the U.S., the main stem of the Willamette River, a raster digital elevation model for a region containing the WV AVA (m = meters), and the locations for the cities of Portland (black filled square), Salem (black filled circle), and Eugene (black filled triangle) in the WV AVA. The horizontal axis is in degrees longitude and the vertical axis is in degrees latitude.
Agronomy 14 01566 g001
Figure 2. The nominal four-kilometer grid associated with the daily PRISM mean and minimum surface air temperature data that were collected for the study, the WV AVA boundary, and the Willamette River. The horizontal axis is in degrees longitude and the vertical axis is in degrees latitude. Highlighted blue is the single PRISM data grid location in the WV AVA, with a longitude and latitude in decimal degrees of −123.25 and 45. 3 ¯ , respectively, for which computed return levels were plotted versus return period for two block minima datasets (1991–2021 and 1991–2022).
Agronomy 14 01566 g002
Figure 3. Maps of the computed Pinot noir budbreak day of year value on a gridded basis throughout the WV AVA for 1991–2022 using PRISM gridded historical daily mean surface air temperature data and the budbreak model introduced by Zapata et al. [58], parameterized for Vitis vinifera L. cv. Pinot noir.
Agronomy 14 01566 g003
Figure 4. The median Pinot noir budbreak day of year value computed throughout the WV AVA from 1991 to 2022, including the 1st and 3rd quartile values. The values were calculated using PRISM gridded historical daily mean surface air temperature data and the budbreak model introduced by Zapata et al. [58], parameterized for Vitis vinifera L. cv. Pinot noir.
Agronomy 14 01566 g004
Figure 5. Maps of the 5, 25, 50, 75, and 95th percentiles for the computed Pinot noir budbreak day of year value at each PRISM data grid location for 1991–2021.
Agronomy 14 01566 g005
Figure 6. (a) Plot of the distribution of gridded PRISM daily minimum surface air temperature data throughout the WV AVA for April 2022. The yellow (−1 °C) and red (−2.2 °C) horizontal lines are the no injury/injury and LT50 budbreak threshold temperature values for Vitis vinifera L. cv. Pinot noir (Table 1). (b) Plot of the 1991–2022 block minima dataset for the PRISM data grid location in the WV AVA with a longitude and latitude in decimal degrees of −123.25 and 45. 3 ¯ , respectively (Figure 2). The starting date value for the block minima dataset was defined by the 1st quartile of the computed budbreak day of year values from 1991 to 2021.
Agronomy 14 01566 g006
Figure 7. Computed return levels (blue lines) as a function of return period for the PRISM data grid location in the WV AVA with a longitude and latitude in decimal degrees of −123.25 and 45. 3 ¯ , respectively (Figure 2). The computed return levels were associated with the GEV models fitted, at the grid location, with the block minima datasets (black dots) from (a) 1991 to 2021 and (b) 1991 to 2022, and whose date window starting values were equal to the 1st quartile of the budbreak day of year values from 1991 to 2021. The yellow (−1 °C) and red (−2.2 °C) horizontal lines are the no injury/injury and LT50 budbreak threshold temperature values for Vitis vinifera L. cv. Pinot noir (Table 1). The 2022 extreme event observation at the grid location is denoted by the dashed black horizontal line.
Agronomy 14 01566 g007
Figure 8. Return levels computed on a gridded basis throughout the WV AVA for four return periods (10, 20, 30, and 50 years), reclassified relative to the no injury/injury and LT50 budbreak threshold temperature values for Vitis vinifera L. cv. Pinot noir (Table 1) (green = no injury; yellow = injury; red = exceeded the LT50 budbreak threshold). The return levels are associated with the GEV models that were fit to five distinct 1991–2021 block minima datasets at each grid location, which had date window starting values defined by the 5% (lower 90%), 25%, 50%, 75%, and 95% (upper 90%) values for budbreak day of year based on the computed budbreak dates from 1991 to 2021.
Agronomy 14 01566 g008
Figure 9. Return levels computed on a gridded basis throughout the WV AVA for four return periods (10, 20, 30, and 50 years), reclassified relative to the no injury/injury and LT50 budbreak threshold temperature values for Vitis vinifera L. cv. Pinot noir (Table 1) (green = no injury; yellow = injury; red = exceeded the LT50 budbreak threshold). The return levels are associated with the GEV models that were fit to five distinct 1991–2022 block minima datasets at each grid location, which had date window starting values defined by the 5% (lower 90%), 25%, 50%, 75%, and 95% (upper 90%) values for budbreak day of year based on the computed budbreak dates from 1991 to 2021.
Agronomy 14 01566 g009
Figure 10. Four spatial analyses that combined Pinot noir ripening potential maps with maps that communicated the risk of potential springtime Pinot noir cold damage. The ripening potential map was the same for all four analyses. It was based on application of the GST index. The GST index was computed using the PRISM climate normals temperature datasets for the period 1991–2020. The footprint of the areas throughout the WV AVA with a computed GST 14 ,   16   ° C , shown in cyan in (ad), was the area defined to be optimal for ripening Pinot noir winegrapes. The springtime cold damage maps were the 30-year return level maps that were computed with the GEV models that used the block minima datasets for 1991–2021 (a,b) and 1991–2022 (c,d). Their springtime date window starting values were defined by the 25% and 5% values for budbreak day of year based on the computed budbreak dates from 1991 to 2021. They were reclassified relative to the no injury/injury and LT50 budbreak threshold temperature values for Vitis vinifera L. cv. Pinot noir (Table 1) (green = no injury; yellow = injury; red = exceeded the LT50 budbreak threshold; = intersection; black = area that simultaneously satisfies ripening and frost risk).
Agronomy 14 01566 g010
Table 1. Critical temperatures of Pinot noir for springtime phenological stages (NA = not available).
Phenological StageE-L Stages [28]No Injury (°C)LT50 (°C)
Bud scales opening2NA−14.0
Woolly bud3NA−3.4
Budbreak4−1.0−2.2
First leaf7−1.0−2.0
Second leaf9−1.0−1.7
Fourth leaf11−0.6−1.2
Table 2. The percent of the WV AVA area that was reclassified as no injury (green areas in Figure 8 and Figure 9), less than the injury threshold but greater than the LT50 budbreak threshold for Vitis vinifera L. cv. Pinot noir (Table 1) (yellow areas in Figure 8 and Figure 9), equaling or exceeding the LT50 budbreak threshold temperature (red areas in Figure 8 and Figure 9) for the 20-year and 30-return return periods for the 1991–2021 and 1991–2022 block minima datasets.
% WV AVA
20-Year (1991–2021)20-Year (1991–2022)
No
Injury
Injury but LT50 Not
Exceeded
LT50
Exceeded
No
Injury
Injury but LT50 Not
Exceeded
LT50
Exceeded
Upper 90%1000010000
3rd Quartile99.480.52099.560.440
2nd Quartile95.064.94095.194.810
1st Quartile57.6442.160.2046.8052.970.23
Lower 90%0.0775.3324.600.0873.7826.14
30-year (1991–2021)30-year (1991–2022)
Upper 90%1000010000
3rd Quartile97.972.03098.051.950
2nd Quartile90.969.04090.679.330
1st Quartile41.5357.930.5429.5169.960.54
Lower 90%0.0460.0539.910.0458.4541.51
Disclaimer/Publisher’s Note: The statements, opinions and data contained in all publications are solely those of the individual author(s) and contributor(s) and not of MDPI and/or the editor(s). MDPI and/or the editor(s) disclaim responsibility for any injury to people or property resulting from any ideas, methods, instructions or products referred to in the content.

