Abstract
Since Chernozems are among the most fertile soils in the world, the study of their degradation is of great interest. However, the microstructure and composition of the soil organic matter (SOM) in eroded Chernozems have not yet been sufficiently studied. We studied the SOM and aggregate states of eroded Chernozems using the example of two catenas with arable Haplic Chernozems in the Kursk region of Russia. In the plow horizons (the part of the soil most susceptible to water erosion), we determined the mean-weighted aggregate diameter (MWD), structure and water stability coefficients (SC and WS; dry and wet sieving, respectively), soil organic carbon (SOC) content, and SOM composition and content (qualitative and quantitative micromorphological analyses, respectively). It was shown that with an increase in the degree of erosion, the content of SOC decreased significantly, according to both chemical and micromorphological methods of evaluation. No significant relationships were found between the degree of erosion and the indicators of the structure (except for WS, which was significantly lower in non-eroded Chernozem than in slightly and moderately eroded soils). With the increasing degree of erosion, the humus state of these soils deteriorates at the microlevel, the intensity of humification decreases, the depth of the appearance of assimilated biogenic aggregates with finely dispersed calcite in the profile increases, the structure is destroyed, lumpy aggregates form, and the proportion of planar voids increases. The downslope transport of the soil solid phase under the impact of erosion is accompanied by the accumulation of the transformation products of carbohydrates in the Chernozems in the lower part of the catena. In the Chernozems located in the transit position of the slope, the composition of SOM is characterized by the predominance of lipids and nitrogen-containing compounds. Our unique results contribute to a deeper understanding of the formation of structure and water resistance in eroded soils.
1. Introduction
Chernozems (Mollisols or black soils) are one of the most fertile soils in the world [1]. In Russia, Chernozems cover 326.8 million ha, or 45% of the total Chernozem area of the Earth [1]. These soils produce the highest yields of cereals, sugar beets, and sunflowers.
However, due to unsustainable use, Chernozems degrade. For example, they lose soil organic matter (SOM) and suffer from the destruction of their structure, compaction, and salinization. Soil erosion is a serious environmental problem worldwide in both natural and anthropogenic ecosystems. At the global level, soil losses from erosion are estimated at 1.7–10.5 t/ha/year. For agricultural areas, the average global estimate is 4.2 t/ha/year [2]. At the same time, the level of acceptable soil loss from water erosion (T-value) is estimated, on average, at 1.6–2.0 t/ha/year [3]. Moreover, for the northern black soils of China, the T-value is ~1.9 t/ha/year [4]. For Ukrainian ordinary and southern Chernozems, this estimate is 5–7 t/ha/year [5]. For the Central Black Earth region of Russia, the limits of permissible soil losses from washout range from 0.3 to 10.0 t/ha/year (on average, 5 t/ha/year) depending on the subtype of Chernozem, the degree of erodibility, and agricultural practices [6]. According to recent estimates, the real losses of Chernozems in the East European Plain from erosion are about 6 t/ha/year [7], highlighting the importance of studying the manifestations of water erosion in Chernozems and their erosion resistance.
Erosion influences almost all indicators of the humus state of soils. The changes in morphological parameters at the level of soil horizons and soil profiles have been well studied and are mainly manifested in the thickness of the humus-accumulative (A) horizon and the distribution of humus along the profile. The features of humus formation and, in general, the transformation of SOM under the impact of erosion are less known. Currently, it is important to study the molecular composition of SOM and its transformation under various environmental conditions. The formation of SOM quality under conditions of water erosion has an impact on the activity of soil biota [8]. Differences in the composition of SOM under the impact of water erosion are also associated with the predominant removal of the light fraction of SOM [9], which differs significantly in its molecular composition from the mineral-associated OM fraction [10]. The heterogeneity of SOM caused by erosion is associated with the accumulation of stable components and a low degree of aromaticity of SOM at the footslope and transit positions, respectively [11,12]. In general, considering the impressive scale of erosion as a factor in soil degradation, the impact of this process on the spatial heterogeneity of SOM remains poorly understood.
The aim of this work was to assess the intensity of water erosion’s impact on the humus state of Haplic Chernozems with different degrees of erosion under the conditions of agricultural production. The following tasks were formulated: i. the detailed analysis of soil chemical properties; ii. the determination of the relationships between the degree of erosion and soil properties.
2. Materials and Methods
2.1. Site Description
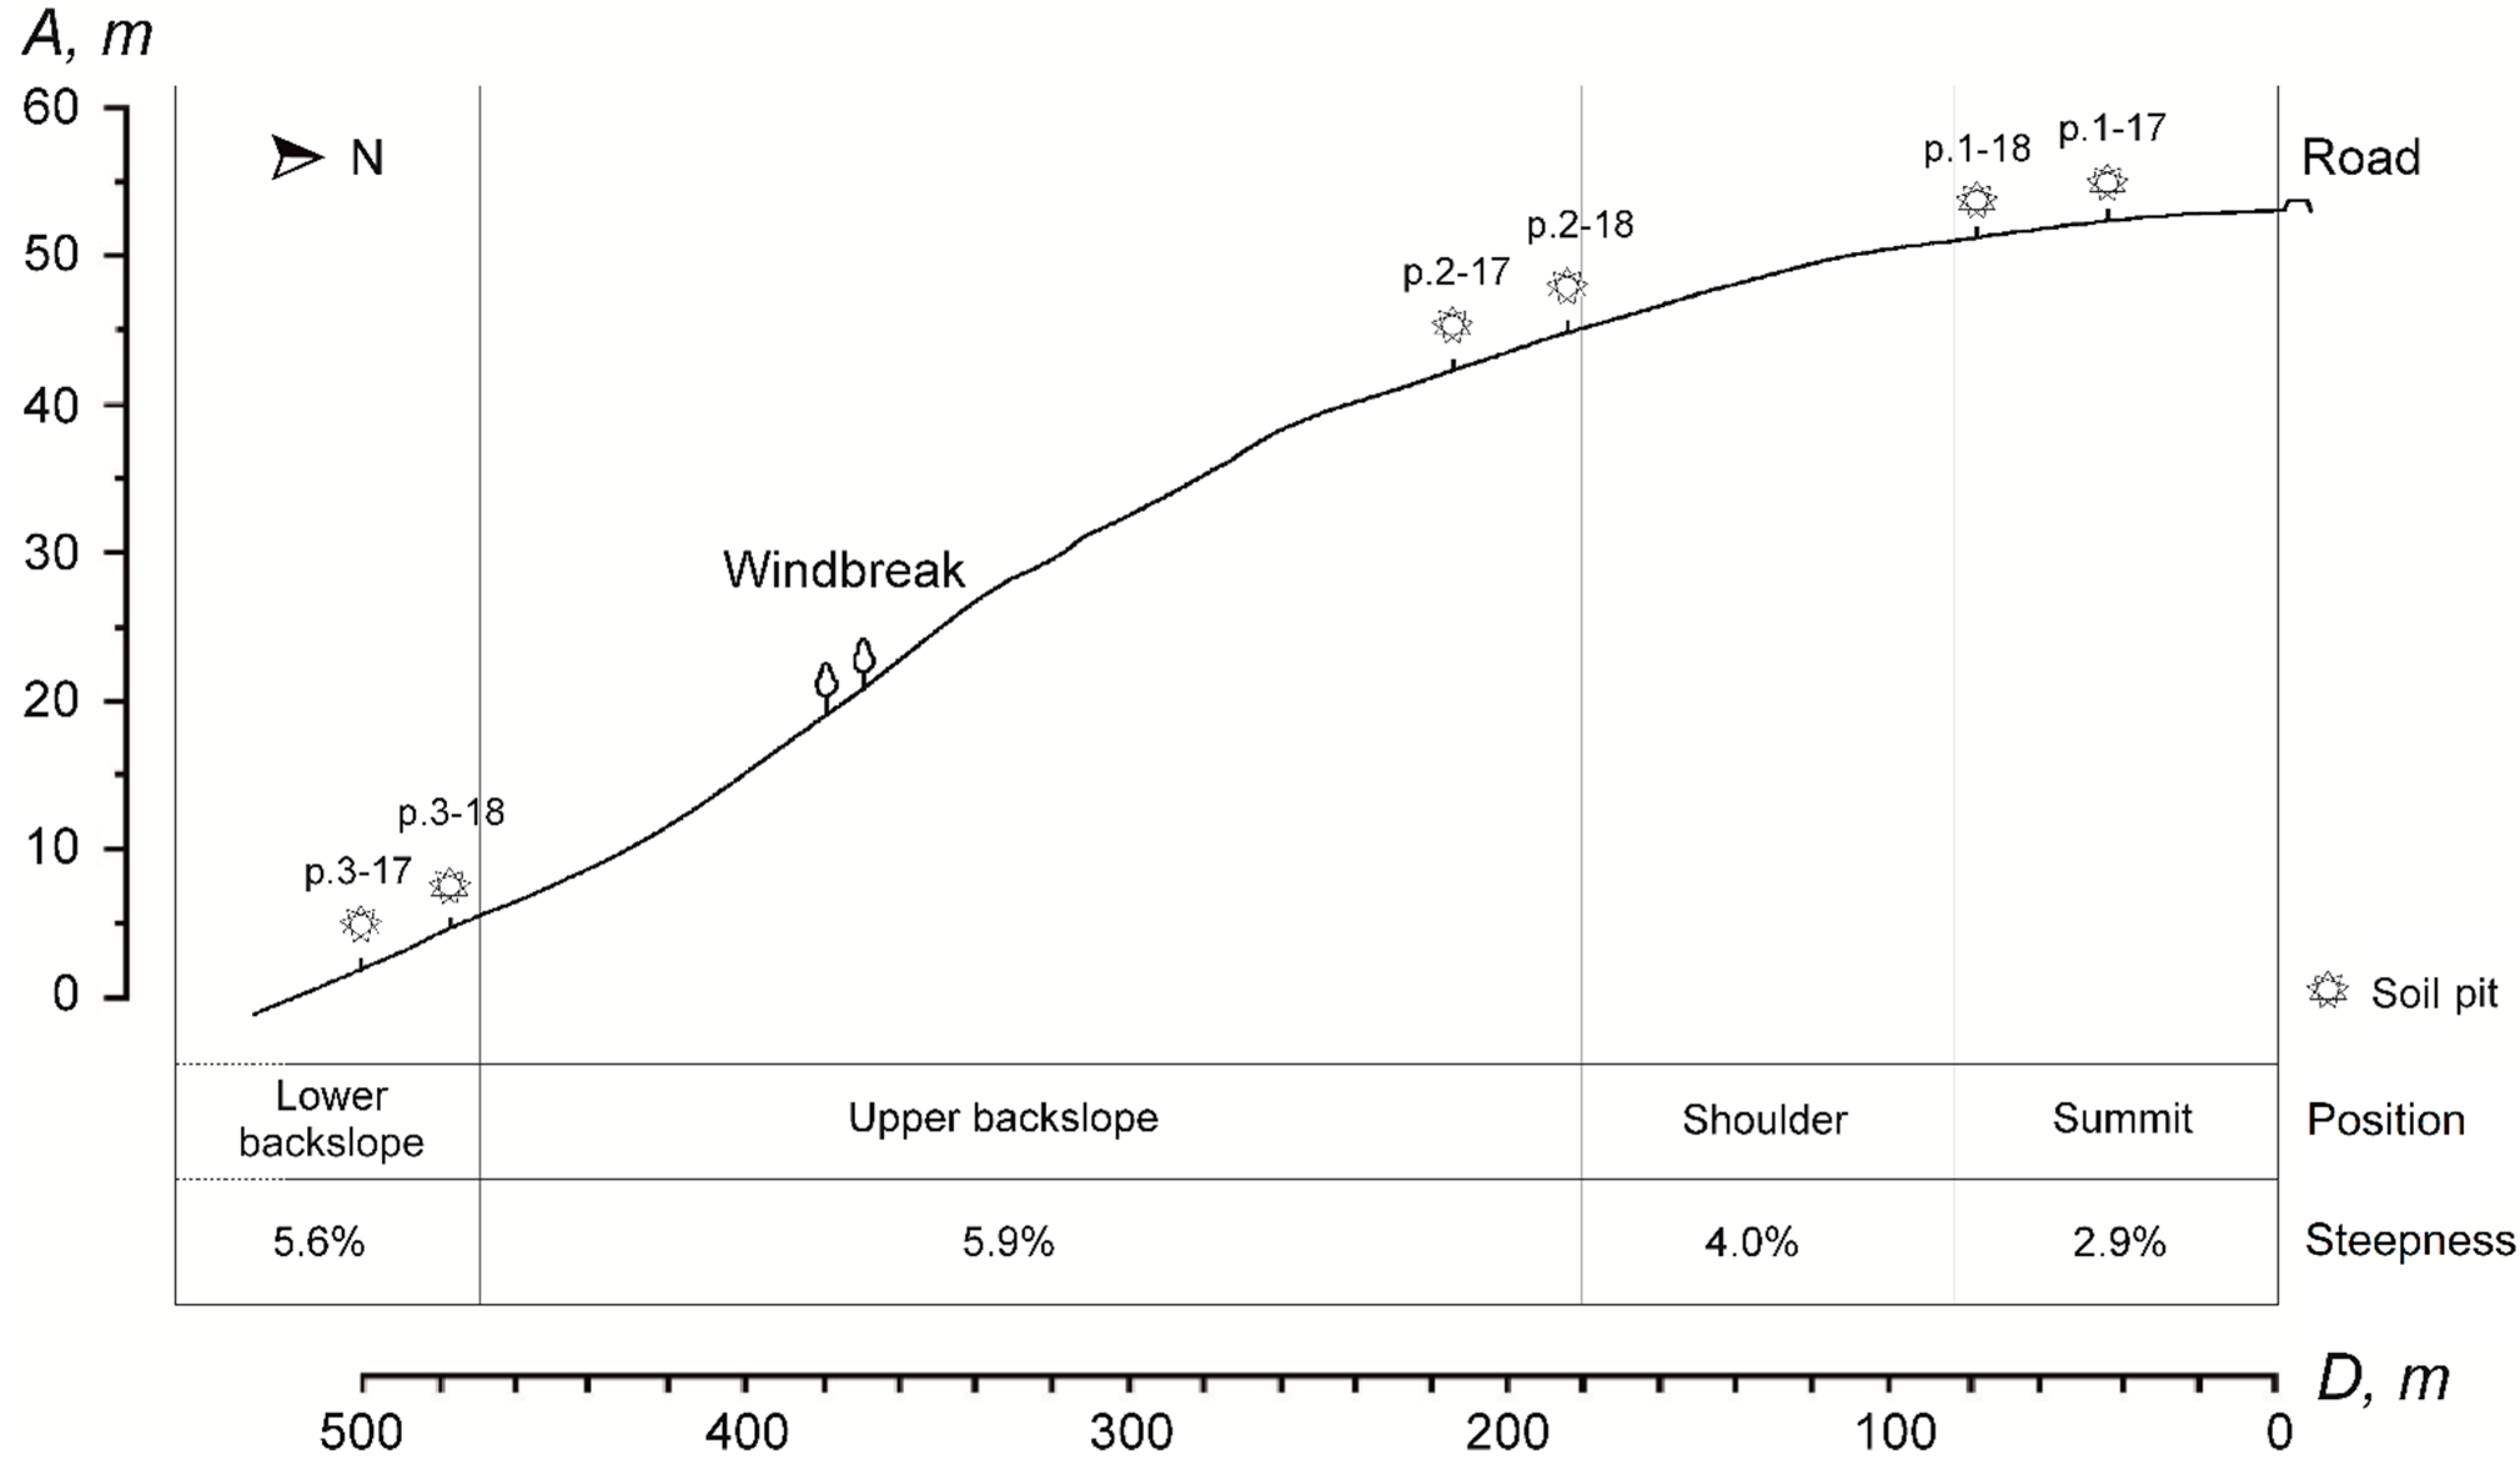
Typical non-eroded, slightly eroded, and moderately eroded arable Chernozems according to the Soviet soil classification system [13] or Haplic Chernozems (Aric, Loamic, Pachic) in terms of the international (WRB) system [14] were studied in 2017–2018 in two soil geomorphological profiles (Figure 1) on a slope with southern exposure (slope steepness 0.9–8.9%) within the Experimental Field of the All-Russia Research Institute of Agriculture and Soil Erosion Control (at present, Federal Agricultural Kursk Research Center). Each profile included non-eroded and slightly and moderately eroded Chernozems. The degree of erosion was determined according to [13], taking into account the slope gradient and its exposure [15]. The depth of effervescence from hydrochloric acid decreased with the increasing degree of erosion and reached 90, 62, and 29 cm in the non-eroded, slightly eroded, and moderately eroded Chernozems, respectively. The thickness of the plow horizon was 30(41) cm in the non-eroded Chernozem (the thickness of 41 cm was due to deep tillage). In the slightly and moderately eroded Chernozems, it was 25(30) and 20 cm, respectively. The humified layer thickness (horizons A + AB) of the non-eroded, slightly eroded, and moderately eroded Chernozems was 95(120), 80(64), and 54(48) cm, respectively. The symbols of soil horizons are given in accordance with [14].
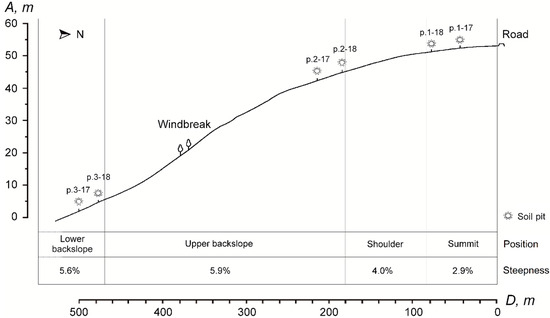
Figure 1.
Longitudinal scheme of the slope on which the soil pits of plowed Haplic Chernozems were excavated. The soil pits are numbered according to the following general principle: the first number (1–3) corresponds to the degree of soil erosion (1—non-eroded; 2—slightly eroded; 3—moderately eroded), and the second number corresponds to the sampling year (17—2017; 18—2018). A and D are the relative altitudes of the soil pits and distances between them according to the leveling line, respectively.
The Kursk region has a long history of agricultural land use. The plowing of the territory for grain crops began in the 17th century [16]. Currently, winter wheat and rye, oats, barley, peas, vetch, millet, buckwheat, sugar beets, sunflower, and corn are grown [17]. Land reclamation has never been carried out. The cropping system on the territory of the Experimental Field includes the alternation of grain and grass crops. Tillage methods include early spring harrowing, pre-sowing cultivation, soil rolling, grass and stubble mulching, and autumn moldboard plowing after the growing season. All tillage treatments are performed along contour lines across the slope.
2.2. Soil Sampling
Bulk samples from the plow horizon (0–20 cm) were taken to characterize its structural state. The structure coefficient (SC) and water stability coefficient (WS) were determined by dry and wet sieving according to Savvinov [18]. After dry sieving, the mean-weighted aggregate diameter (MWDa) was determined. After the wet sieving of air-dried and capillary-wetted soil, the mean-weighted diameters of water-resistant aggregates were determined (MWDwa and MWDww, respectively). All procedures were conducted in triplicate for both transects (n = 6).
To determine the soil organic carbon (SOC) content, samples were taken from 10 cm thick layers to a depth of 30 cm. The determination of the SOM content for the first soil erosion profile was carried out by the Nikitin method with colorimetric termination according to Orlov–Grindel. The determination of the SOM content in soils of the second soil erosion profile was carried out by the same method in the Testing Laboratory Center of the FRC V.V. Dokuchaev Soil Science Institute [19].
Micromorphological methods were used to study the forms and content of SOM. Soil thin sections were made from undisturbed soil core samples from the upper and lower parts of the plow horizon on the first soil geomorphological profile. The sampling depths were 7–12 and 36–41 cm in the non-eroded Chernozem (the latter depth corresponded to the lowermost part of the plow horizon of the deeply plowed soil), 6–11 and 20–25 cm in the slightly eroded Chernozem, and 6–11 and 15–20 cm in the moderately eroded Chernozem. Thin sections were described using an Olympus BX51 optical polarizing microscope with an Olympus DP26 digital camera (Olympus Co., Tokyo, Japan) and the international terminology [20]. The SOM content was determined by a quantitative micromorphological method using Thixomet Pro software (version 4.0, module Pores, Minerals, Coatings) (Thixomet Ltd., St. Petersburg, Russia). For this purpose, using a Zeiss Axio Imager A2.m optical polarizing microscope (Carl Zeiss AG, Oberkochen, Germany), panoramic imaging of five randomly selected sections was performed on each soil thin section with 200× magnification under two imaging conditions: without and with an analyzer. The acquired images were then segmented and analyzed in Thixomet Pro (version 4.0) [21], obtaining information on the areas of objects in the following classes: intrapedal mass, optically oriented clay, pores, minerals, and black objects. In the case of the plow horizons of Chernozems, black objects can be confidently attributed to various forms of SOM, including amorphous, highly decomposed plant remains. Artifacts were removed manually. The obtained values of the fraction of the image area occupied by black objects were corrected, taking into account the following: (i) the fraction of pores in the total area of the panoramic image varies greatly, and the object of interest is SOM included in the intrapedal mass and (ii) as pores are often mistakenly assigned by the program to the class of minerals, the fraction of the image area occupied by black objects was calculated not from the total image area, but from the image area minus the pore area minus the mineral area.
The composition of SOM was estimated in bulk samples from the plow horizon (0–20 cm) in triplicate by one-stage analytical pyrolysis with gas chromatography with mass spectrometric termination on a pyrolyzer EGA/PY-3030D (Frontier Laboratories, Fukushima, Japan) and a single-quadrupole gas chromatograph–mass spectrometer (GCMS-QP2010, Shimadzu, Kyoto, Japan). A total of 30 pyrolysates (Py-GC/MS) were identified. The deconvolution of pyrograms was performed on the GNPS (Global Natural Products Social Molecular Networking; version 1.3.16-GNPS) web-service platform [22]. Peak identification was performed in an MS Search program (version 2.0, FairCom Co., Gaithersburg, MD, USA) using the NIST11 mass spectra library (National Institute of Standards and Technology, Gaithersburg, MD, USA). Semi-quantitative estimation of pyrolysate content was performed by the internal normalization method [23].
2.3. Data Processing
The structure and water stability coefficients (SC and WS, respectively) were calculated by the following formulas [18]:
where A is the sum of macroaggregates with sizes from 0.25 to 10 mm (%), and B is the sum of aggregates < 0.25 mm and >10 mm (%), and
where C is the content of aggregates 0.25–1 mm after dry sieving of the air-dried soil (%), and Cws is the content of water-stable aggregates of the same size after wet sieving of the air-dried soil (%).
SC = A/B,
WS = Cws/C,
Mean-weighted diameters were calculated according to the following formula:
where is the mean diameter of the ith fraction (mm), and is the content of the ith fraction (%).
To assess the significance of differences in the SOC content between the studied Chernozems, the data obtained by chemical determination in two years of analysis were combined into one dataset (n = 6). These samples were compared using the Mann–Whitney U-test. The pairwise Mann–Whitney U-test was used to assess the significance of differences in the structure coefficient, water stability coefficient, and mean-weighted diameters of soil aggregates after dry and wet sieving between subdivisions of the studied Chernozems.
To assess the significance of differences in the SOM content between the studied Chernozems according to the quantitative micromorphological (micromorphometric) data, the Kruskal–Wallis H-test was used (comparing the uppermost part of the horizon with the lowermost part in each subdivision, the uppermost part with the uppermost part in each subdivision, and the lowermost part with the lowermost part in each subdivision for a total of 9 pairs of comparisons).
Statistical analysis and the visualization of analytical pyrolysis data were performed using the RStudio software (version 2023.09.0+463) [22]. The following R packages were used for data processing and visualization: dplyr [24], stats [25], ggplot2 [26], ggpubr [26], and FSA [27]. We applied principal component analysis (PCA) to the Py-GC/MS results to find a smaller number of variables, or factors, that could be used to describe differences in the SOM composition. For pairwise multiple comparisons, Dunn’s test was used as a post hoc test after the Kruskal–Wallis test [28].
3. Results
3.1. Indicators of Soil Structure
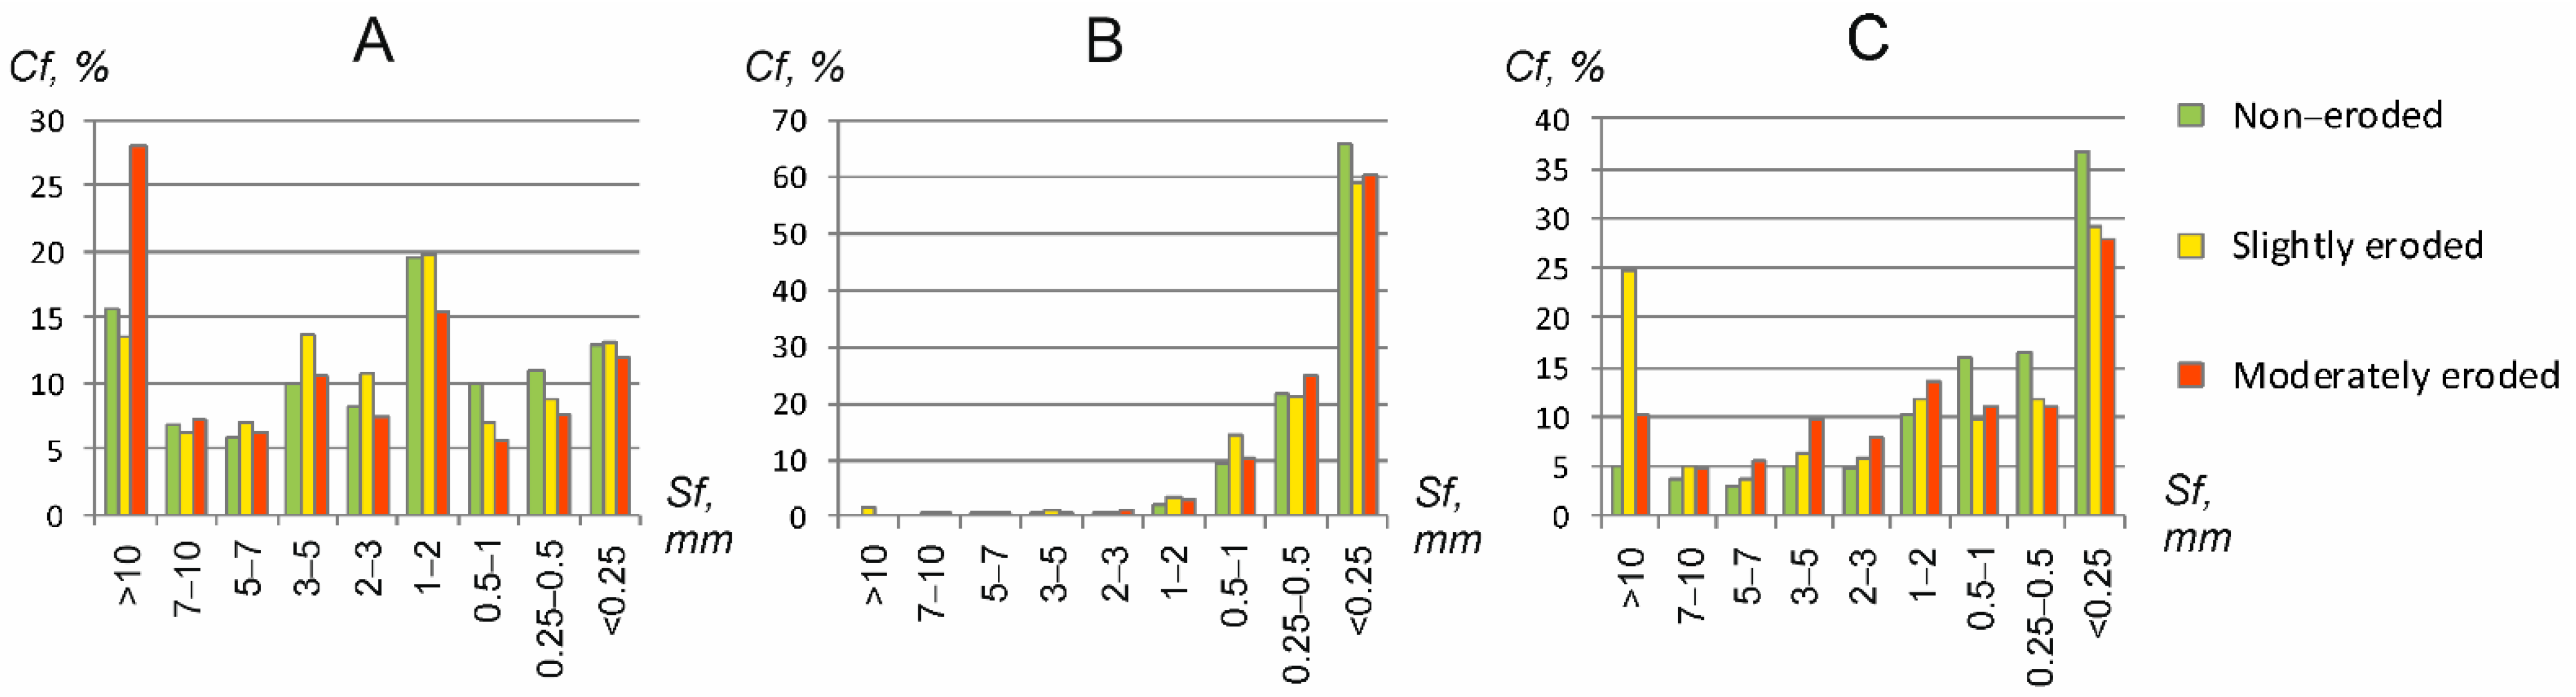
The aggregate fraction of 1–2 mm predominated in the composition of agronomically valuable aggregates in all the studied soils (Figure 2 and Table 1). In the moderately eroded Chernozem, the share of clumpy aggregates (>10 mm) was almost two times higher than that in the non-eroded and slightly eroded Chernozems. The shares of 2–3 and 3–5 mm aggregates were slightly higher in the slightly eroded Chernozem. The shares of 0.5–1 and 0.25–0.5 mm aggregates were higher in the non-eroded Chernozem. Upon wet sieving of air-dried samples, the slightly eroded Chernozem—the only one of the three samples compared—had water-resistant aggregates >10 mm. It also had a higher proportion of 0.5–1 mm aggregates than the non-eroded and moderately eroded Chernozems. At the same time, the general pattern for all the soils was that most of the aggregates in coarse fractions (>10 mm) were destroyed and transformed into 0.5–1, 0.25–0.5, and <0.25 mm fractions. Upon wet sieving of capillary-wetted samples, water-resistant aggregates > 10 mm were present in all the soils, but their share in slightly eroded Chernozem was higher than in the non-eroded and moderately eroded Chernozems. In the moderately eroded Chernozems, the share of the 3–5 mm fraction was higher. The shares of 0.5–1, 0.25–0.5, and <0.25 mm fractions were higher in the non-eroded Chernozem.

Figure 2.
Histograms of the aggregate composition of plowing Haplic Chernozems with different degrees of erosion: (A) dry sieving of air-dried soil, (B) wet sieving of air-dried soil, (C) wet sieving of capillary-wetted soil. Cf, content of aggregate fractions (%); Sf, size of aggregate fractions (mm).

Table 1.
Descriptive statistics of parameters of aggregate compositions of arable Chernozems studied (n = 6).
The SC, MWDa, MWDww, and MWDwa of the studied arable Haplic Chernozems with different degrees of erosion did not differ significantly (Table 1). The WS coefficient in the non-eroded Chernozem was significantly lower than that in the slightly and moderately eroded Chernozems. MWDww was higher than MWDwa for all the studied soils.
3.2. Micromorphological Features of Material and SOM
In spite of the presence of (sub)angular blocky aggregates, good aggregation, and the presence of crumb and granular structures, the pore space is well developed in all studied Chernozems, and channel and compound packing voids prevail. Their walls are at least partially accommodated (Table S1). At the same time, the upper parts of the plow horizon in the non-eroded and moderately eroded Chernozems have strong aggregate adhesion and the formation of large clumpy separations with wide planar voids (Figure S1).
The humic matter in the studied plow horizons of Chernozems is represented by dark (up to black) clots, both scattered (punctuations) and connected by bridges (Figure 3). Humus in the form of flakes (organic pigment) is also identified in the moderately eroded Chernozem. The number and size of clots, as well as the share of clots connected by bridges, decrease with the increasing degree of erosion (Table S1). The relative share of humus punctuations increases. In the non-eroded and moderately eroded Chernozems, humus clots are black and dark brown, respectively. With the increasing degree of erosion, the share of moderately decomposed plant residues increases.
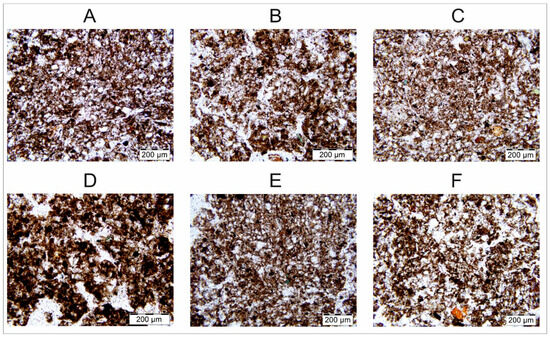
Figure 3.
Organic matter in plow horizons of Haplic Chernozems with different degrees of erosion (plane-polarized light without analyzer): (A,D) non-eroded Chernozem, 7–12 and 36–41 cm, respectively; (B,E) slightly eroded Chernozem, 6–11 and 20–25 cm, respectively; (C,F) moderately eroded Chernozem, 6–11 and 15–20 cm, respectively.
The plow horizon of non-eroded Chernozem contains single assimilated aggregates consisting of the clayey material of the AB horizon with a stipple-speckled b-fabric; carbonates are absent (Figure 4A,D). In the plow horizon of slightly eroded Chernozem, aggregates from the material of the underlying horizon are also few. However, their finely dispersed mass has signs of crystallitic b-fabric (Figure 4B,E) inherent to the carbonate composition [29].
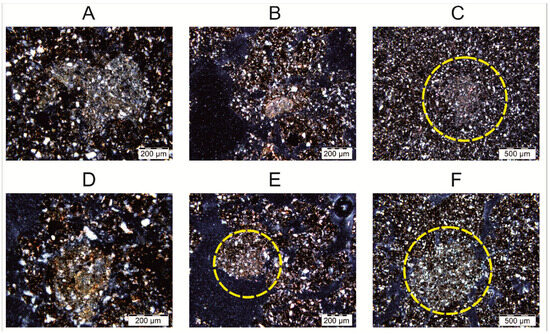
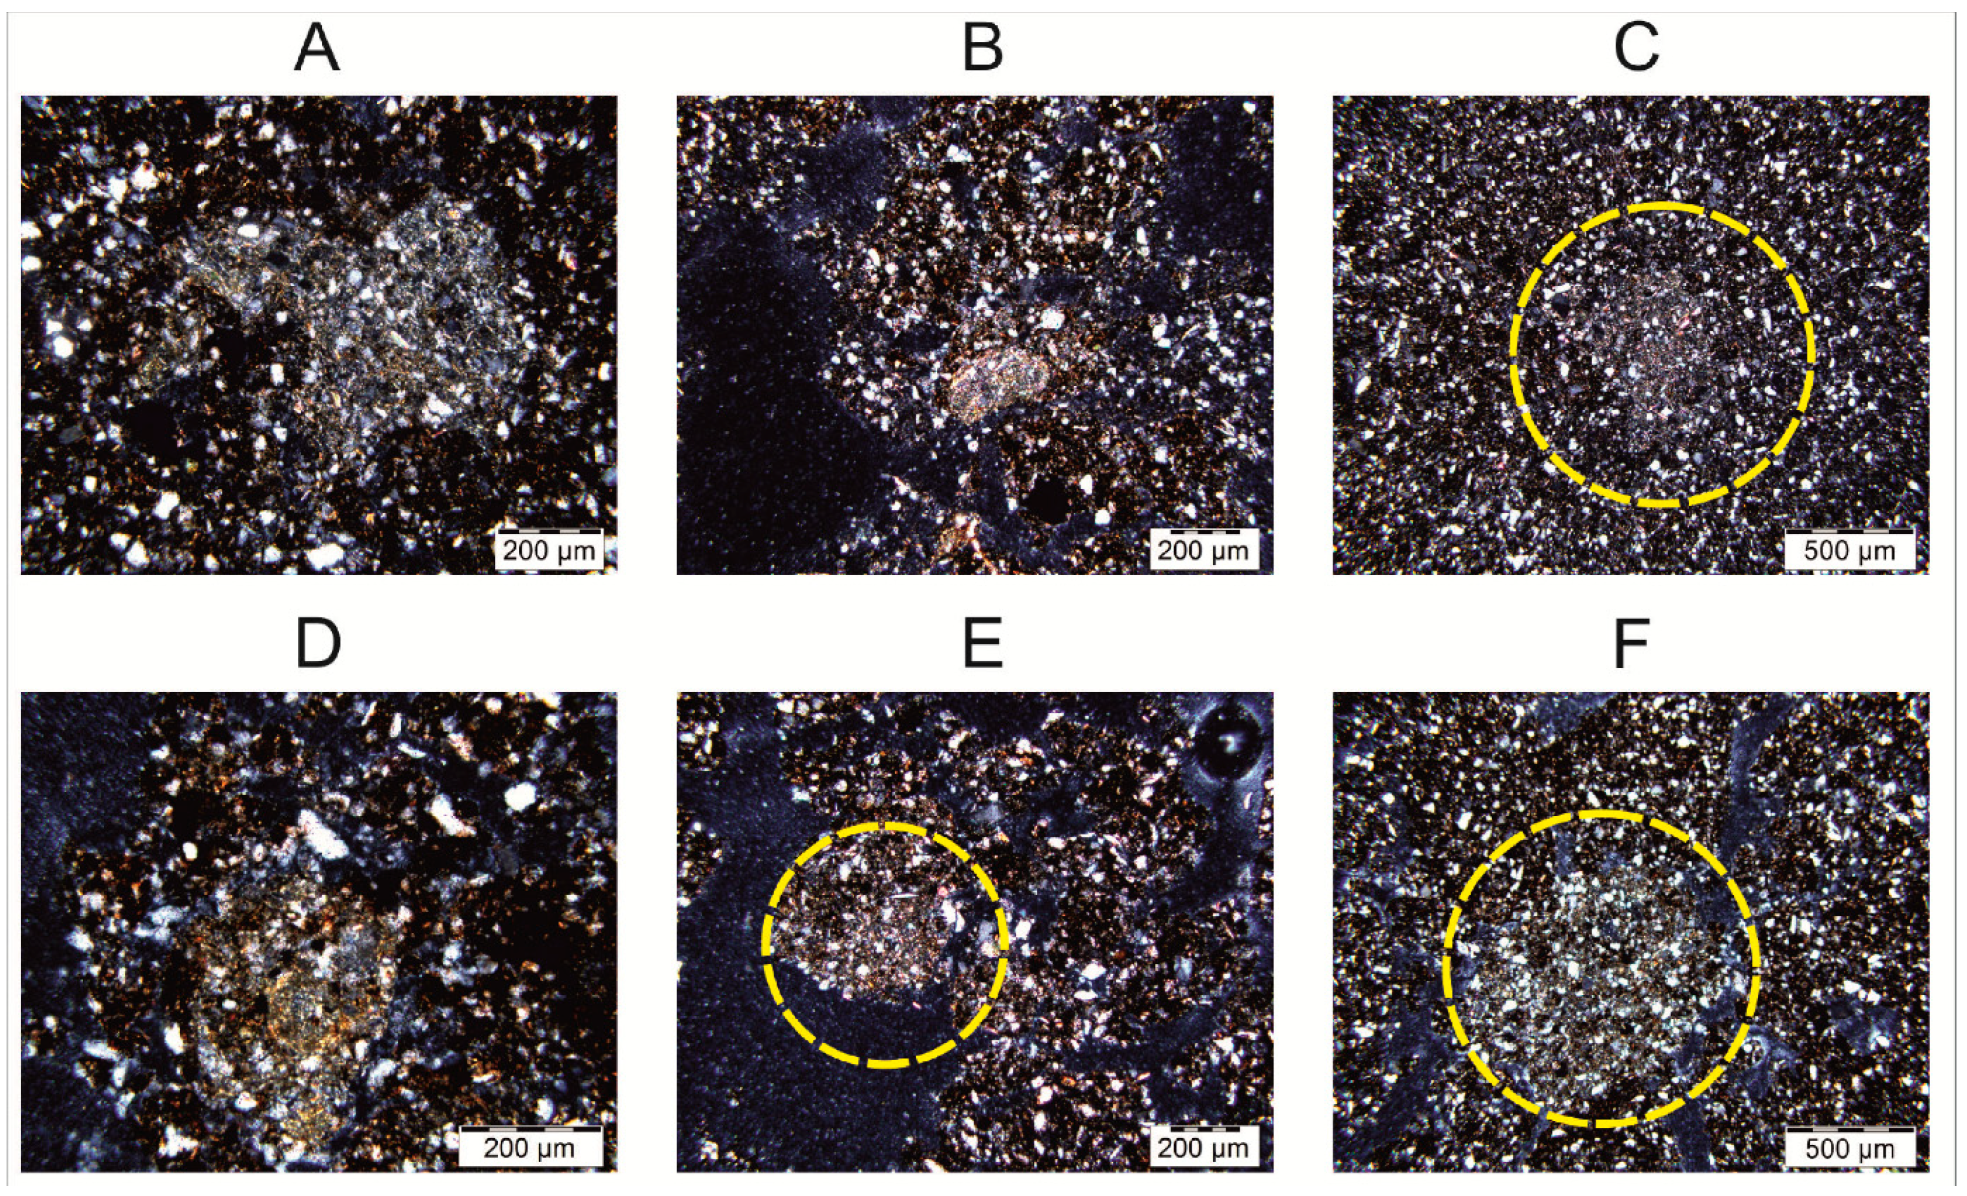
Figure 4.
Aggregates from lower carbonate-containing horizons assimilated by biota to the plow horizons of Haplic Chernozems with different degrees of erosion (plane-polarized light with an analyzer): (A,D) non-eroded Chernozem, 7–12 and 36–41 cm, respectively; (B,E) slightly eroded Chernozem, 6–11 and 20–25 cm, respectively; (C,F) moderately eroded Chernozem, 6–11 and 15–20 cm, respectively. Yellow circles indicate the presence of carbonates.
In the finely dispersed mass of the plow horizon of moderately eroded Chernozem, assimilated aggregates also have carbonate features. Their occurrence is much more frequent—about 10 pieces per thin section from the lower part of the horizon compared to 1–2 pieces in slightly eroded Chernozem (Figure 4C,F). In the main soil mass of slightly eroded and moderately eroded Chernozems, calcite grains, which appeared here after the assimilation of aggregates from the Bk horizon, were found; they were singular in the slightly eroded Chernozem and more frequent in the moderately eroded Chernozem (Table S1).
Sampling depth did not significantly affect the morphometric index of the SOM content when compared to the degree of erosion (results of the H-test; Table 2). A pairwise comparison of Chernozem subsets within the uppermost layer did not reveal any influence of the degree of erosion on this indicator. However, in the lowermost layer, the highest content of SOM was found in non-eroded Chernozem, according to morphometric analysis.
Table 2.
Median values of the share of the area of black objects from the area of analysis minus the area of pores and minerals, obtained from the segmentation data of the digital images of typical arable Chernozems of the Kursk region. Different letters indicate statistically significant differences (p < 0.05).
3.3. SOM Content and Composition According to Chemical Analysis
According to pairwise analysis (non-eroded–slightly eroded, slightly eroded–moderately eroded, and non-eroded–moderately eroded Haplic Chernozems), the SOC content is significantly higher in the non-eroded Chernozem than in the moderately eroded Chernozem (Table 3).
Table 3.
SOC content in the 30 cm thick upper layer of plowed Haplic Chernozems studied in the Kursk region. Different letters indicate statistically significant differences (p < 0.05).
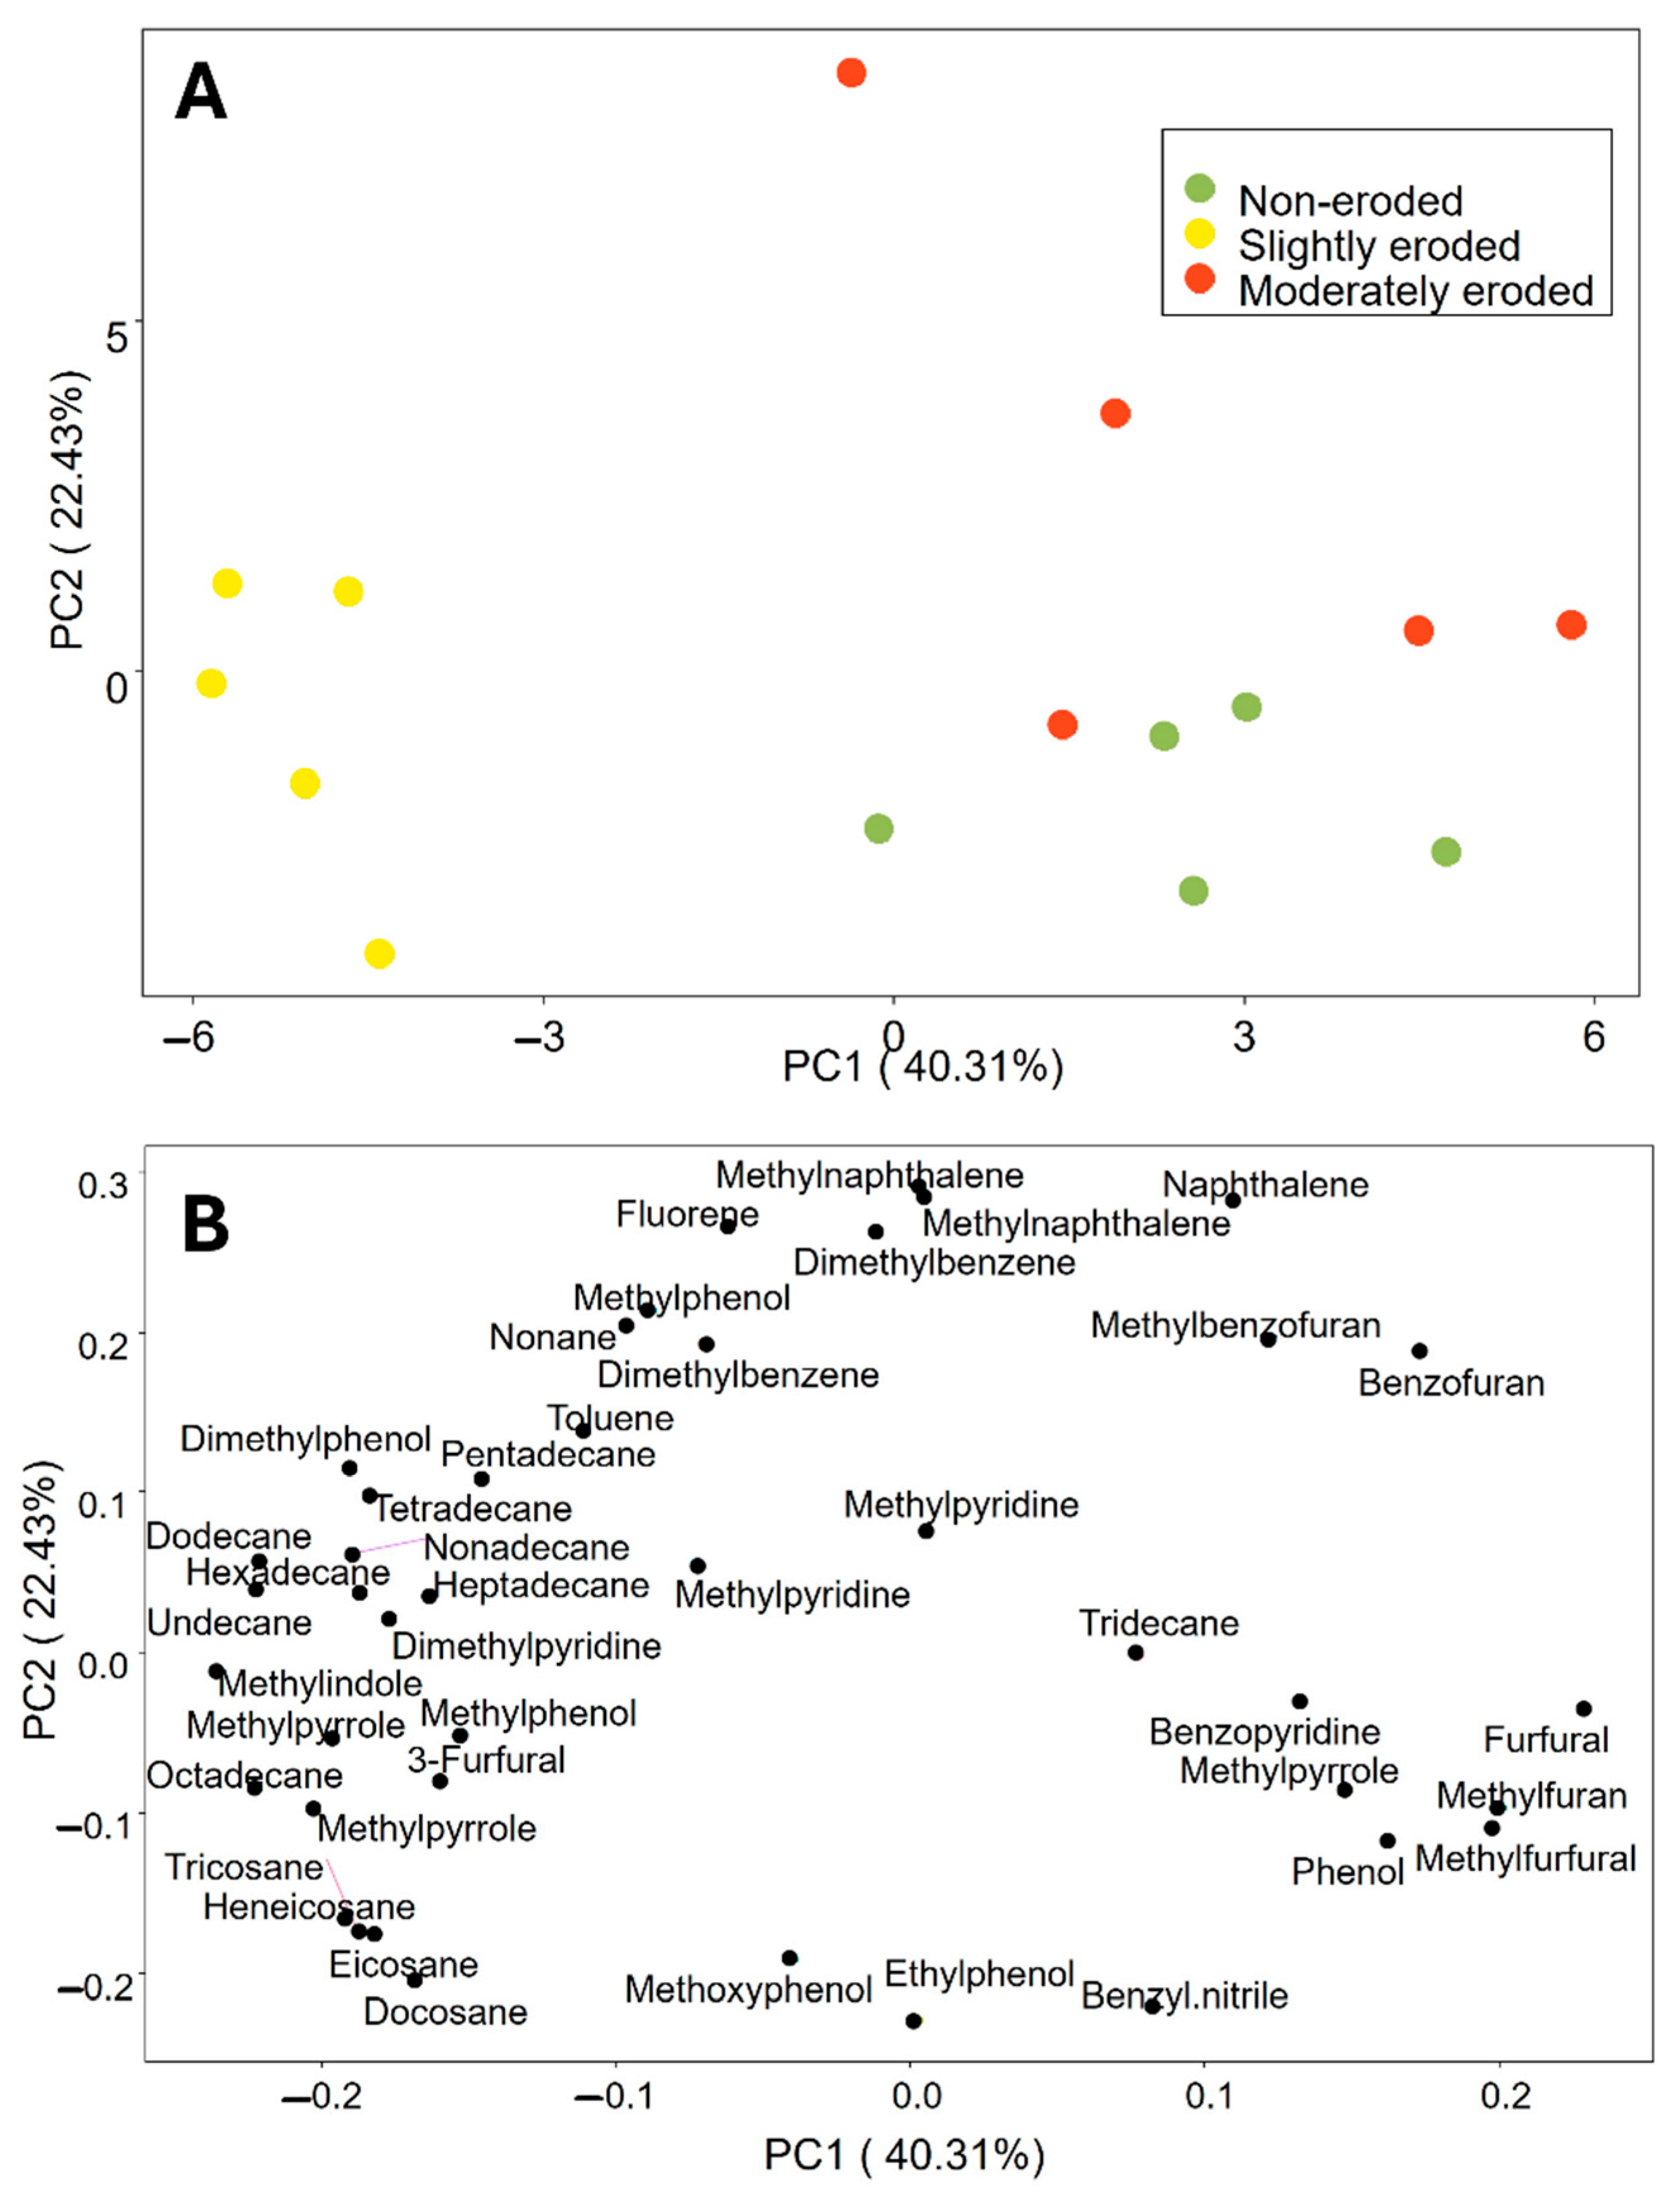
The compositions of SOM in the non-eroded, slightly eroded, and moderately eroded Chernozems differ significantly (Figure 5 and Figure 6). The identified pyrolysates are classified as alkanes, furans, nitrogen-containing compounds, phenols, and monocyclic and polycyclic aromatic hydrocarbons (MAHs and PAHs) (Table S2).
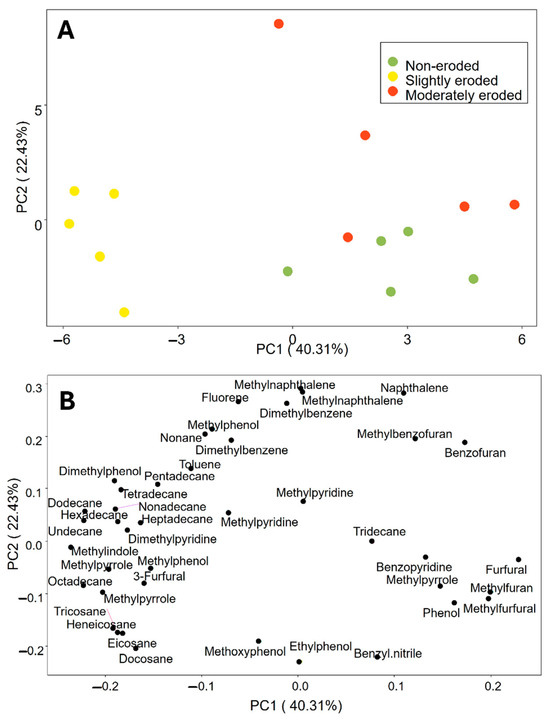
Figure 5.
(A) Ordination plot of Chernozems studied. (B) Loadings of pyrolysis products on the first two principal components, which explained 63% of the total variation in Py-GC/MS data.

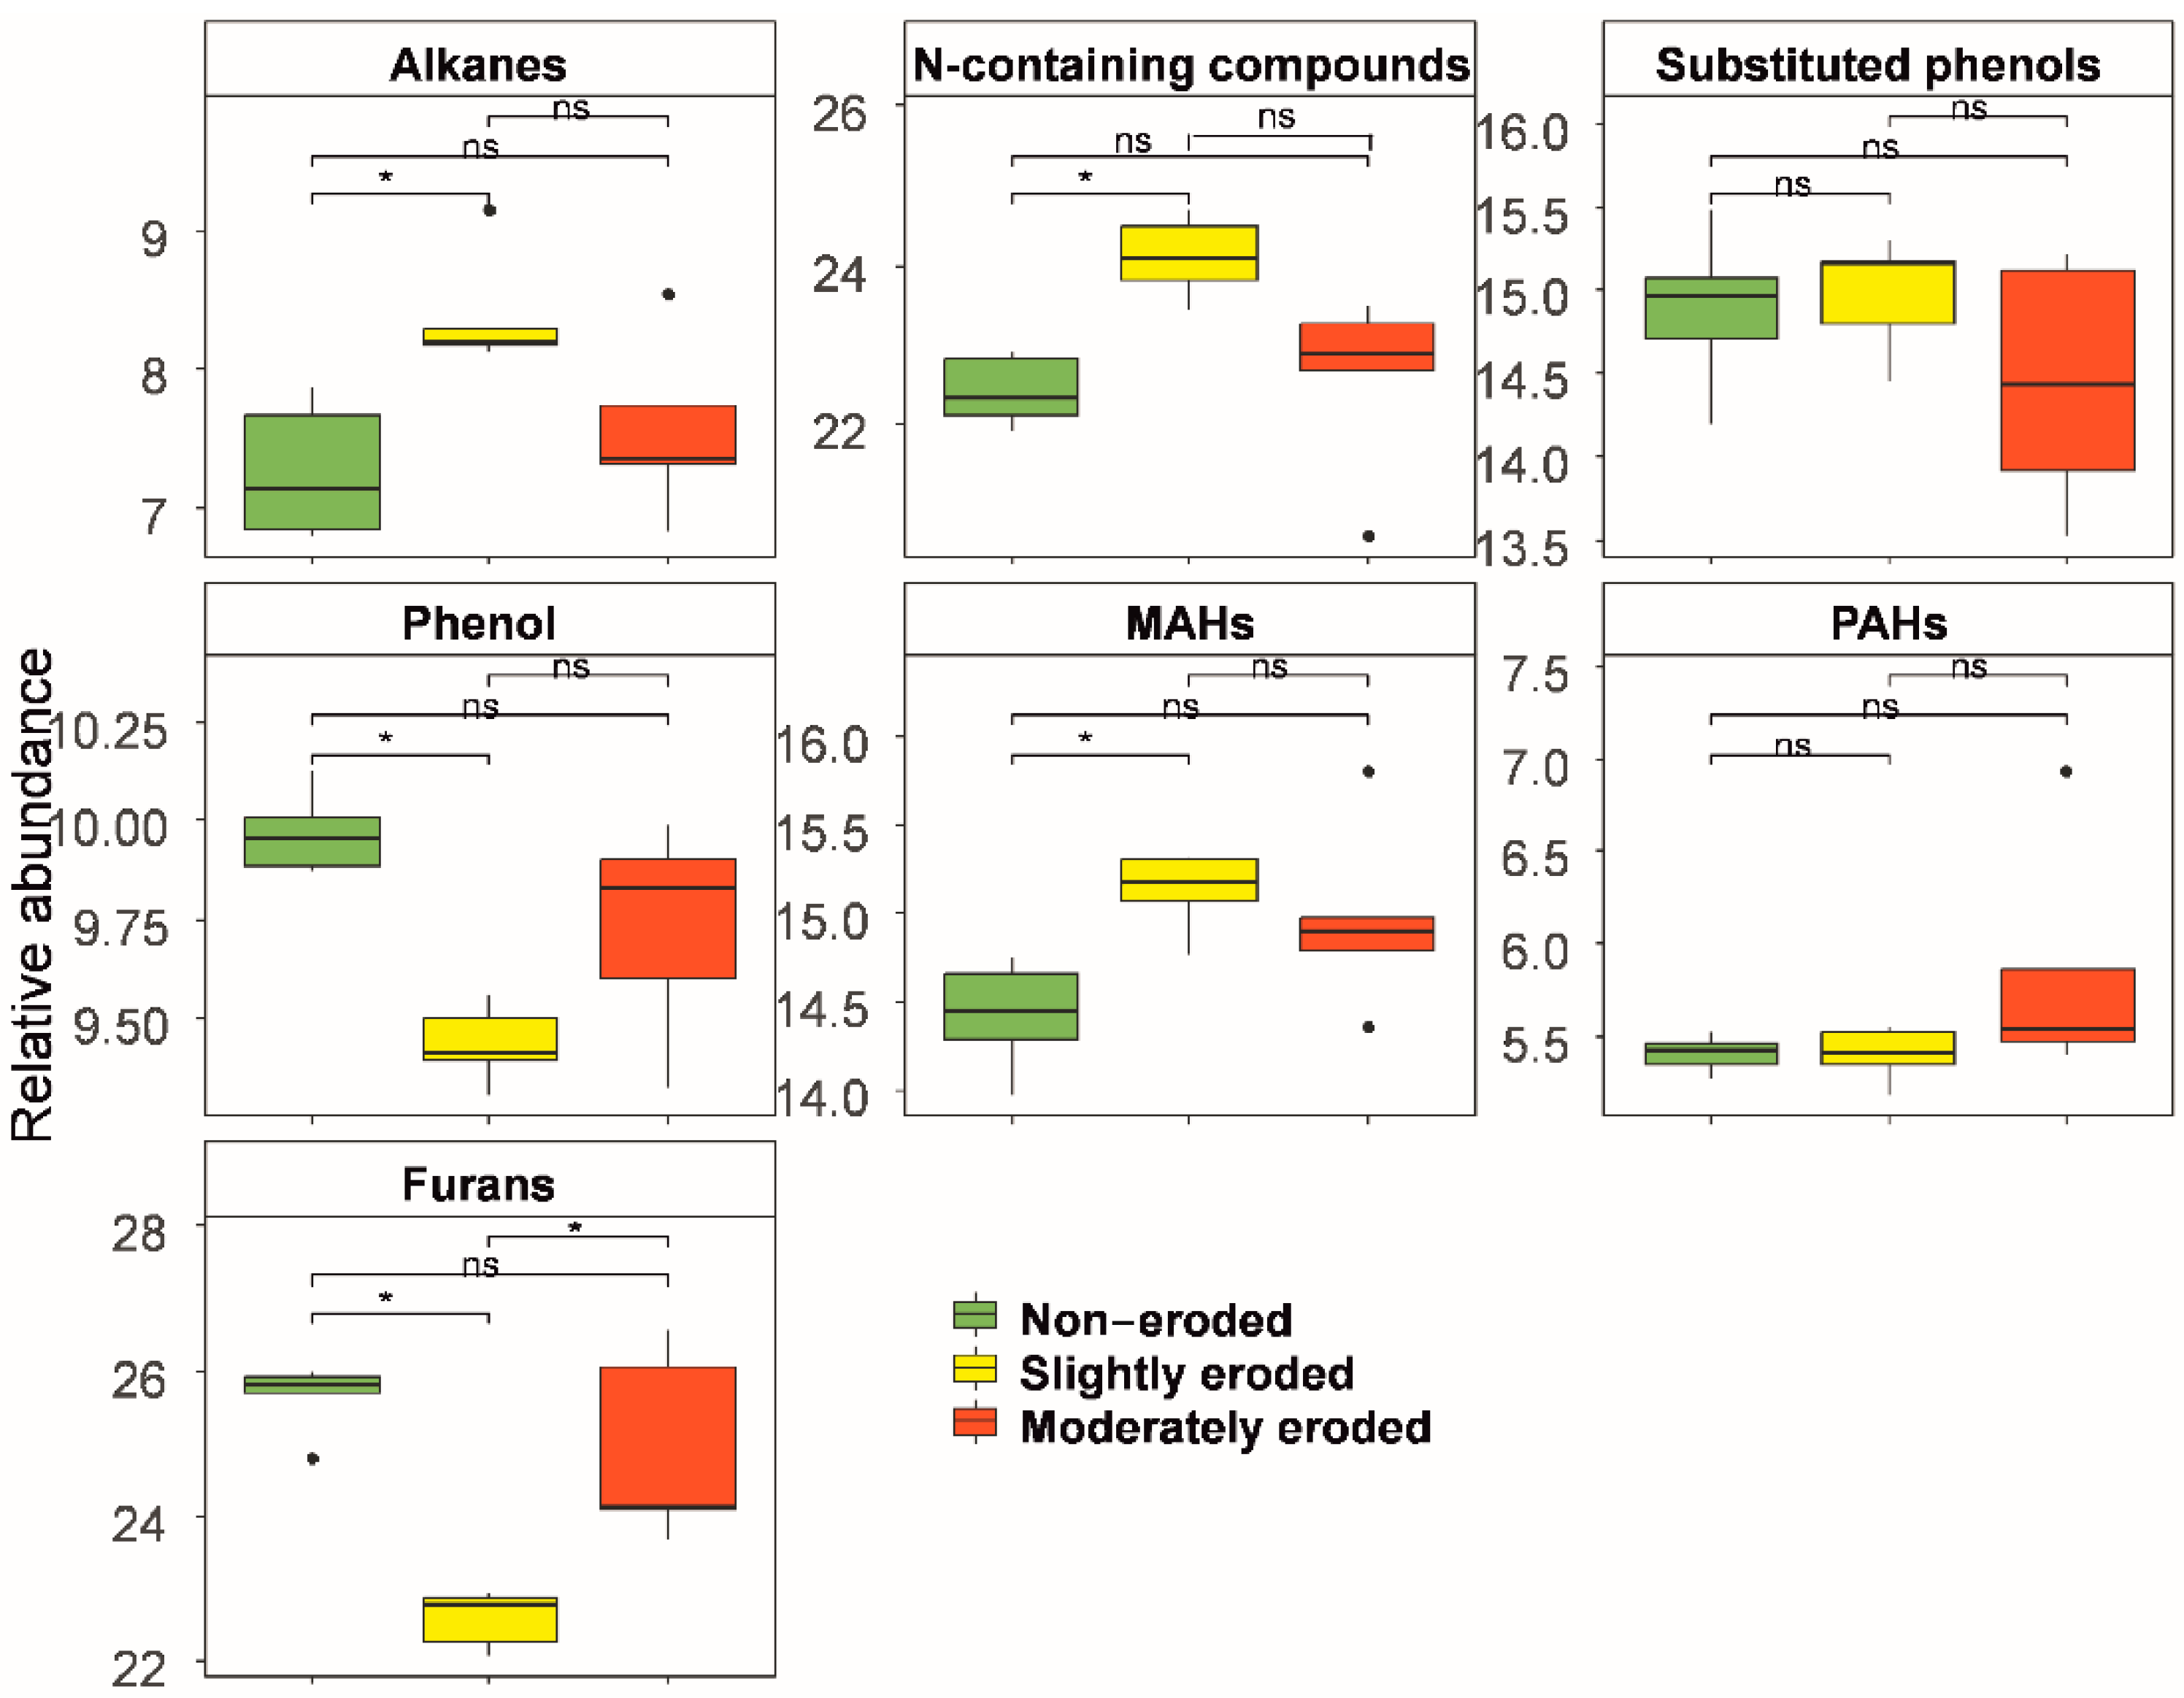
Figure 6.
Relative abundance of pyrolysates of SOM. Note: non-significant differences—ns; significant differences—* p < 0.05.
Alkanes are among the main products of lipid pyrolysis [25,26,27]. Phenols are formed by the pyrolysis of lignins and tannins [28,29,30]. Nitrogen-containing pyrolysates are characterized by the presence of amino acids, proteins, nucleic acids, amino sugars, and other nitrogen-containing SOM compounds [31,32,33,34]. The leading reactions in the pyrolysis of SOM are cyclization and aromatization. Thus, aromatic hydrocarbons can be formed in the pyrolysis of SOM of various origins: lipids, lignin, carbohydrates [35,36,37], and carbonaceous particles [38,39]. Furans are pyrolysates of carbohydrates [40,41] and are also noted to be characteristic of the highly transformed part of SOM [42,43].
Significant differences between the studied Chernozems in the relative contents of alkanes, MAHs, nitrogen-containing compounds, phenols, and furans were revealed. For the other groups of compounds, the observed differences can be considered as trends (Figure 6). The compositions of the OM pyrolysates of the moderately eroded and non-eroded Chernozems were similar. The relative contents of alkanes, N-containing pyrolysates, and MAHs were higher in the slightly eroded Chernozem in comparison with the moderately eroded Chernozem and did not differ between the non-eroded and moderately eroded Chernozems. In general, a tendency for an increase in the considered groups of pyrolysates in the sequence from non-eroded to moderately eroded and to slightly eroded Chernozems can be seen. The relative content of phenols was higher in the moderately eroded Chernozem than in the slightly eroded Chernozem. The minimum relative content of furans was detected in the slightly eroded Chernozem. The proportion of phenols and furans in the composition of pyrolysates of OM tended to increase in the sequence from the slightly eroded to moderately eroded and non-eroded Chernozems. There were also noticeable tendencies for increasing contents of PAHs and substituted phenols in the composition of pyrolysates in moderately and slightly eroded Chernozems, respectively. The content of substituted phenols was lower in the moderately eroded Chernozem than in the non-eroded and slightly eroded Chernozems.
4. Discussion
4.1. Indicators of Soil Structure
The absence of significant differences between the SC and MWD of soil aggregates after dry sieving can be attributed to the influence of annual plowing, which mixes and cuts larger aggregates to smaller ones and thus homogenizes the structure of the plow horizon [30,31]. In general, the arable Haplic Chernozems studied by us have a lower SC than previously reported for this area [32]. However, it should be noted that all of the studied soils are characterized by good aggregate composition [33].
The significantly lower WS values in the plow horizon of non-eroded Chernozem in comparison with those in the slightly and moderately eroded Chernozems can result from the absence of water-resistant aggregates with diameters of 7–10 mm and the low share 0.5–1 mm aggregates in both eroded Chernozems (Figure 2B). It should also be noted that during the dry sieving of air-dried samples, the aggregate composition of the plow horizons of slightly and moderately eroded Chernozems had a higher proportion of 3–5 and >10 mm fractions, respectively (Figure 2A), which could also affect the results of wet sieving and, consequently, the calculation of WS.
The values of MWDwa are low and similar to the data previously obtained in [32] for the same Experimental Field and slightly lower than the values obtained for arable Chernozems of typical territories of the Petrinka reference site of the FRC V.V. Dokuchaev Soil Science Institute, located less than 10 km from our study area [34].
MWDww values did not differ significantly from one another and were significantly higher than MWDwa. This phenomenon is explained primarily by the fact that the wet sieving of air-dried samples results in a sharp displacement of air trapped in the intra-aggregate pores, which breaks the aggregates into smaller ones. The preliminary capillary saturation of samples with water allows the gradual displacement of trapped air, which favorably affects the water resistance of the aggregates. The absence of significant differences in MWDww between differently eroded Haplic Chernozems can be explained by several factors. Firstly, the line of effervescence from HCl in all soil pits is found to be much lower than the depth of the plow horizon, which means that calcium carbonates have no structuring or water-stability-increasing effect on the studied soil samples. Secondly, the particle-size distribution data show a similar predominance of coarse silt and fine silt in the studied soils [32]; it is known that silt particles are one of the main agents in the formation of water-resistant structure [35]. Thirdly, due to water erosion, not only the mineral part of the soil but also the organic matter, which participates in the creation of water-resistant structure, is washed away.
4.2. Micromorphological Features of Aggregates and SOM
A high degree of expression of crumb and granular microstructures is characteristic of the humus horizon of Chernozems [36,37]. On the contrary, aggregate coalescence in the upper part of the plow horizon can be explained by intensive annual plowing, which causes the degradation of the natural soil structure with the subsequent formation of lumpy separations [38]. The tendency for a decrease in the content and diversity of humus forms with an increase in the degree of erosion noted during the micromorphological description of thin sections is supported by the results of chemical analyses [39]. The browning of humus clots in the plow horizon of moderately eroded Chernozem has two possible causes. First, there is probably a decrease in the share of humic acids in moderately eroded Chernozem relative to the non-eroded one [40]. Secondly, during the long-term plowing of Chernozems, the redistribution of organic matter downward in the profile takes place, and the maximum content is observed in the subsoil horizons [41]. An additional sign of decreasing humification intensity is a tendency for an increase in the amount of moderately decomposed plant residues with an increasing degree of erosion. In the plow horizon of moderately eroded Chernozem, the structure-forming role of humic substances decreases, while the structuring role of calcium carbonates (the presence of which was confirmed by micromorphology) increases.
Judging from the microstructure of the plow horizons in the studied Chernozems, we can conclude that the humus state deteriorates, the intensity of humification decreases, the depth of the appearance of assimilated biogenic aggregates with finely dispersed calcite in the profile increases, and the soil structure is destroyed with the formation of lumpy aggregates and an increasing proportion of planar voids with an increase in the degree of erosion. These processes are partially leveled by plowing, which is expressed at the microlevel as well-developed pore spaces and an abundance of coprogenic aggregates in all the studied soils.
The results of the micromorphometric determination of the SOM content without its subdivision into forms and fractions show, firstly, that the SOM is evenly distributed throughout the thickness of the entire plow horizon, and secondly, that the content of organic matter in the plow horizon of non-eroded Chernozem is significantly higher than that in the moderately eroded Chernozem. Slightly eroded Chernozem occupies an intermediate position in terms of the SOM content. These data have been obtained by a quantitative micromorphological method for eroded soils for the first time. Previously, data on the SOM content in soil thin sections were collected only for Parabraunerden soils under diverse forests [42].
Our unique data are supported by the data obtained by chemical methods both in our research and in the studies of other authors [39], which shows that the micromorphological method of estimating the organic matter content can be used for quantitative comparisons.
4.3. Organic Matter Composition
The absence of significant differences in the SOC content of the plow horizon between non-eroded and slightly eroded Chernozems and between slightly eroded and moderately eroded Chernozems can be explained by the intermediate topographic position of the studied soils. Such patterns of changes in the SOC content in eroded soils are noted in diverse regions [43,44,45,46].
Slightly eroded Chernozem is located in the upper part of the slope (~160 m from the divide), where slope flows do not reach a rate sufficient to break off and transport a considerable amount of soil material. Moderately eroded Chernozem occurs in the middle part of the slope (460 m from the divide), which is sufficient for the formation of powerful eroding flows. Using Chézy’s and Bazin’s formulas to calculate the velocity of slope flows and the Chézy coefficient, respectively, the flow rates for slightly and moderately eroded Chernozems should be 0.05 and 0.40 m/s, respectively. This flow rate is already critical for Chernozem. At this rate, the intensity of erosion exceeds 340 g/m2s [47,48]. We assume that this is one of the reasons why the SOC content in the plow horizon of moderately eroded Chernozem is significantly lower than that in non-eroded Chernozem. An additional reason is the lower thickness of the humus layer in the moderately eroded Chernozem, which causes the plowing of less humified subsoil material into the plow horizon.
To divide pyrolysates into groups, an empirical approach based on the assessment of the contribution of individual features (pyrolysates) to the difference in the compositions of SOM of the study objects was applied. This approach allows the grouping of pyrolysates. For example, although the relative abundances of MAHs and PAHs differ in the studied Chernozems, they characterize the content of pyrolysates with aromatic structures. Phenols and substituted phenols are divided according to the same principle. The difference in the distribution of similar structural groups may indicate a difference in precursors. Our approach may provide additional information on the structure peculiarities of SOM in the future.
The clustering of soils according to the composition of SOM pyrolysates indicates the similarity of SOM in the non-eroded and moderately eroded Chernozems and their difference from slightly eroded Chernozems. Such differentiation indicates the accumulation of washed-out material at the lower backslope [11,49]. Thus, the composition of SOM indicates the solid-phase deposition, which was not diagnosed morphologically.
A high proportion of lipids is associated with low humus content [50,51] and the accumulation of difficult-to-degrade components, which is probably due to intensive mineralization in soils in the transit position on the slope [52]. The abundance of nitrogen-containing pyrolysates, as well as alkanes, probably indicates the accumulation of difficult-to-degrade SOM [11,53].
The abundance of phenols and furans among SOM pyrolysates of moderately eroded Chernozem in comparison with the slightly eroded Chernozem indicates the accumulation of soil erosion products. It can also be stated that the abundance of furans characterizes the accumulation of hardly biodegradable carbohydrates from plant or/and microbial residues of moderately eroded Chernozem [54,55].
We suggest that the presence of substituted phenols among pyrolysates may be characteristic of weakly decomposed SOM of plant origin. A tendency for the accumulation of these components in slightly eroded Chernozem indicates the stabilization of fresh SOM on the free surface of the soil mineral matrix [56]. The abundance of PAHs among SOM pyrolysates is often associated with the presence of black carbon. Among the studied Chernozems, a tendency for an increase in these pyrolysates in the moderately eroded Chernozem is visible. This is probably associated with the washing away of the light fractions of SOM, including black carbon particles, with subsequent accumulation in the backslope position [57,58,59].
The formation of SOM on the slope largely depends on mineralization and carbon sequestration. Mineralization is associated with the destruction of soil structure due to erosion and decomposition of previously protected intra-aggregate SOM [60]. In contrast, sequestration under erosion is associated with the stabilization of SOM on the soil mineral matrix with subsequent export to the sediment accumulation zone [60]. Based on the data obtained, it can be assumed that the mineralization of SOM leads to the accumulation of lipids and nitrogen-containing compounds, while the proportion of carbohydrates and phenolic compounds increases as a result of carbon sequestration [61,62].
The similarity in the compositions of non-eroded and moderately eroded Chernozems indicates the accumulation of eroded particles with a high carbohydrate content. Carbohydrates are an important carbon and energy source for microorganisms [63], which may explain why areas with sediment accumulation have high biological activity [8]. In the backslope position, soils form with a high proportion of nitrogen-containing compounds and lipids and low relative amounts of carbohydrates and phenolic compounds. An analysis of the composition of SOM formed in an erosive landscape in the future will allow for a better understanding of carbon stabilization, microbial community formation, and the prediction of soil quality for agricultural use [64,65].
5. Conclusions
Water erosion has a significant influence on the degradation of Chernozems. In our study, it manifested primarily in a decrease in the content of organic carbon in the plow layer. Contrary to our expectations, most of the structure indicators of the plow layer did not change with an increase in the degree of erosion, because they were influenced by a combination of various factors acting in different positions on the slope.
At the same time, depending on the degree of erosion, the composition of SOM changed both at the microlevel and according to pyrolysis data. Under the impact of water erosion, carbohydrates of the SOM were washed away from the higher positions and accumulated at the lower positions on the slope. The component composition of SOM in Chernozems on the backslope is characterized by the predominance of lipids and nitrogen-containing compounds. Despite the redistribution of components of the passive SOM pool along the slope and their accumulation in the plow horizon of moderately eroded Chernozem, this did not affect the mean-weighted diameter of water-resistant aggregates, because the total SOC content in this soil was significantly lower than that in the plow horizon of non-eroded Chernozem.
The unique results obtained in our study inspire hope that the continuation of research on the composition of the organic matter of eroded soils can potentially answer the question about the formation of their structure and water resistance, which is one of the most important characteristics of soil erodibility.
Supplementary Materials
The following supporting information can be downloaded at https://www.mdpi.com/article/10.3390/agronomy14081607/s1. Figure S1. Microstructure of plow horizons of differently eroded Haplic Chernozems (PPL, plane-polarized light): (A,D) non-eroded, 7–12 and 36–41 cm, respectively; (B,E) slightly eroded, 6–11 and 20–25 cm, respectively; (C,F) moderately eroded, 6–11 and 15–20 cm, respectively. Table S1. Description of microstructure of plow horizons of Haplic Chernozems with different degrees of erosion (Kursk region, Russia). Table S2. Identified pyrolysates of organic matter of Chernozems with different degrees of erosion (Kursk region).
Author Contributions
Writing—original draft: O.O.P., V.V.D., Y.R.F., and P.R.T. Writing—review and editing: I.N.S. All authors have read and agreed to the published version of the manuscript.
Funding
This research was carried out with the financial support of the Russian Science Foundation (project no. 22-77-10062).
Data Availability Statement
Data are available on request.
Acknowledgments
Micromorphological analysis was conducted using the equipment of the Center for Collective Use of Scientific Equipment of FRC V.V. Dokuchaev Soil Science Institute (“Functions and properties of soils and soil cover”).
Conflicts of Interest
The authors declare no conflicts of interest.
References
- FAO Global Status of Black Soils. Available online: https://doi.org/10.4060/cc3124en (accessed on 22 May 2024).
- Doetterl, S.; Van Oost, K.; Six, J. Towards constraining the magnitude of global agricultural sediment and soil organic carbon fluxes. Earth Surf. Processes Landforms 2012, 37, 642–655. [Google Scholar] [CrossRef]
- Beach, T.; Gersmehl, P. Soil Erosion, T Values, and Sustainability: A Review and Exercise. J. Geogr. 1993, 92, 16–22. [Google Scholar] [CrossRef]
- Li, L.; Du, S.; Wu, L.; Liu, G. An overview of soil loss tolerance. Catena 2009, 78, 93–99. [Google Scholar] [CrossRef]
- Chornyy, S.; Poliashenko, N. Determination of Soil-loss Tolerance for Chernozem of Right-Bank Ukraine. In Soil Science Working for a Living; Springer International Publishing: Cham, Switzerland, 2017; pp. 109–119. ISBN 9783319454177. [Google Scholar]
- Kuznetsov, M.S.; Abdulkhanova, D.R. Soil loss tolerance in the central chernozemic region of the European part of Russia. Eurasian Soil Sci. 2013, 46, 802–809. [Google Scholar] [CrossRef]
- Golosov, V.N.; Collins, A.L.; Dobrovolskaya, N.G.; Bazhenova, O.I.; Ryzhov, Y.V.; Sidorchuk, A.Y. Soil loss on the arable lands of the forest-steppe and steppe zones of European Russia and Siberia during the period of intensive agriculture. Geoderma 2021, 381, 114678. [Google Scholar] [CrossRef]
- Xiao, H.; Li, Z.; Chang, X.; Huang, J.; Nie, X.; Liu, C.; Liu, L.; Wang, D.; Dong, Y.; Jiang, J. Soil erosion-related dynamics of soil bacterial communities and microbial respiration. Appl. Soil Ecol. 2017, 119, 205–213. [Google Scholar] [CrossRef]
- Holz, M.; Augustin, J. Erosion effects on soil carbon and nitrogen dynamics on cultivated slopes: A meta-analysis. Geoderma 2021, 397, 115045. [Google Scholar] [CrossRef]
- Liu, C.; Wu, Z.; He, C.; Zhang, Y.; Huang, W.; Wang, D. Source identification and chemical compositions of particulate and mineral-associated organic matter in the deposited sediments of a dam-controlled watershed. Catena 2022, 219, 106618. [Google Scholar] [CrossRef]
- Jandl, G.; Baum, C.; Heckrath, G.; Greve, M.H.; Kanal, A.; Mander, Ü.; Maliszewska-Kordybach, B.; Niedzwiecki, J.; Eckhardt, K.-U.; Leinweber, P. Erosion Induced Heterogeneity of Soil Organic Matter in Catenae from the Baltic Sea Catchment. Soil Syst. 2019, 3, 42. [Google Scholar] [CrossRef]
- Suleymanov, A.; Gabbasova, I.; Suleymanov, R.; Abakumov, E.; Polyakov, V.; Liebelt, P. Mapping soil organic carbon under erosion processes using remote sensing. Hung. Geogr. Bull. 2021, 70, 49–64. [Google Scholar] [CrossRef]
- Egorov, V.V.; Fridland, V.M.; Ivanova, E.N.; Rozov, N.N.; Nosin, V.A.; Friev, T.A. Classification of Soils of the USSR; Kolos: Moscow, Russia, 1977. [Google Scholar]
- IUSS Working Group WRB World Reference Base for Soil Resources. International Soil Classification System for Naming Soils and Creating Legends for Soil Maps, 4th ed.; International Union of Soil Sciences: Vienna, Austria, 2022. [Google Scholar]
- Zaslavskiy, M.N. Soil Erosion; Vyshaya Shkola: Moscow, Russia, 1983; Available online: https://search.rsl.ru/ru/record/01001139700 (accessed on 1 July 2024).
- Motrevich, V.P. Agrarian History of Russia (IX–XX Centuries); Ural Agrarian Publishing House: Ekaterinburg, Russia, 2012. [Google Scholar]
- Bazdyrev, G.I.; Loshakov, V.G.; Puponin, A.I.; Rassadin, A.Y.; Safonov, A.F.; Tulikov, A.M. Agriculture; Maksimova, A.S., Ed.; Kolos: Moscow, Russia, 2000; Available online: https://djvu.online/file/peNXsxT6xqqUJ (accessed on 1 July 2024).
- Vadyunina, A.F.; Korchagina, Z.A. Methods for Studying the Physical Properties of Soils; Agropromizdat: Moscow, Russia, 1986; Available online: https://djvu.online/file/SHzvgCKRn9d2D (accessed on 1 July 2024).
- Derzhavin, L.M.; Samokhvalova, S.G.; Sokolova, N.V.; Orlova, A.N.; Habarova, K.A.; Prizhukova, V.G.; Ya, P.S. Soils. Methods for Determination of Organic Matter; Russian Institute of Standardisation: Moscow, Russia, 2021; Available online: https://files.stroyinf.ru/Data/758/75803.pdf (accessed on 1 July 2024).
- Stoops, G.J. Guidelines for Analysis and Description of Soil and Regolith Thin Sections; Soil Science Society of America: Madison, WI, USA, 2003; ISBN 0-89118-842-8. [Google Scholar] [CrossRef]
- Plotnikova, O.O.; Kust, P.G.; Romanis, T.V.; Lebedeva, M.P. Methodical Guidance for Computer Analysis of Images of Soil Thin Sections Using the Thixomet Pro Software; Ivanov, A.L., Ed.; MBA Publishing House LLC: Moscow, Russia, 2022. [Google Scholar] [CrossRef]
- Aksenov, A.A.; Laponogov, I.; Zhang, Z.; Doran, S.L.F.; Belluomo, I.; Veselkov, D.; Bittremieux, W.; Nothias, L.F.; Nothias-Esposito, M.; Maloney, K.N.; et al. Auto-deconvolution and molecular networking of gas chromatography–mass spectrometry data. Nat. Biotechnol. 2021, 39, 169–173. [Google Scholar] [CrossRef] [PubMed]
- De la Rosa, J.M.; González-Pérez, J.A.; González-Vázquez, R.; Knicker, H.; López-Capel, E.; Manning, D.A.C.; González-Vila, F.J. Use of pyrolysis/GC–MS combined with thermal analysis to monitor C and N changes in soil organic matter from a Mediterranean fire affected forest. Catena 2008, 74, 296–303. [Google Scholar] [CrossRef]
- Wickham, H.; François, R.; Henry, L.; Müller, K. dplyr: A Grammar of Data Manipulation. R package version. Media. 2019. Available online: https://cran.r-project.org/web/packages/dplyr/dplyr.pdf (accessed on 1 July 2024).
- R Core Team. R: A Language and Environment for Statistical Computing. Available online: https://www.r-project.org/ (accessed on 1 July 2024).
- Kassambara, A. ggpubr. R Package version 0.4.0. 2020. Available online: https://cran.r-project.org/web/packages/ggpubr/index.html (accessed on 1 July 2024).
- Ogle, D.H.; Doll, J.C.; Wheeler, A.P.; Dinno, A. fcaR. 2023. Available online: https://doi.org/10.32614/CRAN.package.FSA (accessed on 1 July 2024).
- Dinno, A. Nonparametric Pairwise Multiple Comparisons in Independent Groups using Dunn’s Test. Stata J. Promot. Commun. Stat. Stata 2015, 15, 292–300. [Google Scholar] [CrossRef]
- Durand, N.; Monger, H.C.; Canti, M.G. Calcium Carbonate Features. In Interpretation of Micromorphological Features of Soils and Regoliths; Elsevier: Amsterdam, The Netherlands, 2010; pp. 149–194. ISBN 9780444531568. [Google Scholar]
- Radziuk, H.; Świtoniak, M. Time of aggregate destruction as a parameter of soil water stability within an agricultural hummocky moraine landscape in northern Poland. Bull. Geogr. Phys. Geogr. Ser. 2022, 23, 49–62. [Google Scholar] [CrossRef]
- Radziuk, H.; Świtoniak, M. The Effect of Erosional Transformation of Soil Cover on the Stability of Soil Aggregates within Young Hummocky Moraine Landscapes in Northern Poland. Agronomy 2022, 12, 2595. [Google Scholar] [CrossRef]
- Dubovik, E.V. Interrelation of the Humus and Structural State in Eroded Chernozems in the Slope Agroecosystems on the Central Chernozemc Region. Ph.D. Thesis, Russian State Agrarian University—Moscow Timiryazev Agricultural Academy (RSAU–MTAA), Moscow, Russia, 2017. Available online: https://search.rsl.ru/ru/record/01006657681 (accessed on 1 July 2024).
- Shein, E.V. The particle-size distribution in soils: Problems of the methods of study, interpretation of the results, and classification. Eurasian Soil Sci. 2009, 42, 284–291. [Google Scholar] [CrossRef]
- Mamontov, V.G.; Kogut, B.M.; Rodionova, L.P.; Ryzhkov, O.V. Influence of agricultural using on the structural condition of typical chernozem and content of organic carbon in aggregates of different sizes and quality. Timiryazev Agric. Acad. 2016, 6, 22–31. [Google Scholar]
- Bronick, C.J.; Lal, R. Soil structure and management: A review. Geoderma 2005, 124, 3–22. [Google Scholar] [CrossRef]
- Polyakov, A.N.; Yarilova, E.A. Main features of microtexture of chernozems of the Central Chernozem regions. Pochvovedenie 1978, 5, 99–109. [Google Scholar]
- Gerasimova, M.I.; Gubin, S.V.; Shoba, S.A. Micromorphology of Soils of Natural Zones of the USSR; Dobrovolskiy, G.V., Ed.; Pusshchino Scientific Center of the Russian Academy of Sciences: Pusshchino, Russia, 1992. [Google Scholar]
- Sanzharova, S.I.; Bgantsev, V.N.; Skvortsova, E.B. Structural state of typical chernozem of different duration of agricultural use. In Micromorphology of Anthropogenically Modified Soils; Nauka: Moscow, Russia, 1988; pp. 64–74. [Google Scholar]
- Dubovik, E.V.; Dubovik, D.V. Relationships between the Organic Carbon Content and Structural State of Typical Chernozem. Eurasian Soil Sci. 2019, 52, 150–161. [Google Scholar] [CrossRef]
- Masyutenko, N.P.; Glazunov, G.P.; Sanzharov, A.I.; Kuznetsov, A.V.; Afonchenkov, N.V.; Oleshitskiy, V.V. Influence of the degree of erodibility on the indicators of ecological state of chernozem soils. Dostizhenie Nauk. Tekhnologii APK 2015, 29, 19–23. [Google Scholar]
- Kukharuk, N.S.; Chendev, Y.G.; Petin, A.N. Micromorphologic features of organic matter during agrogenic transformation of soils in the forest-steppe zone. Nauchniye Vedom. BelSU. Seriya Estestv. Nauk. 2011, 15, 168–179. [Google Scholar]
- Babel, U. Vergleich von mikrogefügemerkmalen einiger humus-bildungen mit hilfe einer schätzmethode. Geoderma 1967, 1, 347–357. [Google Scholar] [CrossRef]
- Artemyeva, Z.S.; Danchenko, N.N.; Kirillova, N.P.; Masyutenko, N.P.; Dubovik, E.V.; Kuznetsov, A.V.; Kogut, B.M. The Effect of Erosion Processes on the Content and Composition of Organic Matter in Macro-and Microaggregates of Haplic Chernozem. Eurasian Soil Sci. 2021, 54, 1659–1667. [Google Scholar] [CrossRef]
- Hancock, G.R.; Kunkel, V.; Wells, T.; Martinez, C. Soil organic carbon and soil erosion—Understanding change at the large catchment scale. Geoderma 2019, 343, 60–71. [Google Scholar] [CrossRef]
- Jakab, G.; Szabó, J.; Szalai, Z.; Mészáros, E.; Madarász, B.; Centeri, C.; Szabó, B.; Németh, T.; Sipos, P. Changes in organic carbon concentration and organic matter compound of erosion-delivered soil aggregates. Environ. Earth Sci. 2016, 75, 144. [Google Scholar] [CrossRef]
- Olson, K.R.; Al-Kaisi, M.; Lal, R.; Cihacek, L. Soil Organic Carbon Dynamics in Eroding and Depositional Landscapes. Open J. Soil Sci. 2016, 6, 121–134. [Google Scholar] [CrossRef]
- Panova, I.G.; Demidov, V.V.; Shulga, P.S.; Ilyasov, L.O.; Butilkina, M.A.; Yaroslavov, A.A. Interpolyelectrolyte complexes as effective structure-forming agents for Chernozem soil. Land Degrad. Dev. 2021, 32, 1022–1033. [Google Scholar] [CrossRef]
- Zhou, K.; Zhang, Z.; Zhang, C.; Xia, L.; Meng, D.; Wu, L.; Song, S.; Sancheze, R.M.T.; Farias, M.E. Rapid artificial biocrust development by cyanobacterial inoculation and clay amendment. Land Degrad. Dev. 2023, 34, 3728–3743, Erratum in Land Degrad. Dev. 2023, 34, 5152–5152. [Google Scholar] [CrossRef]
- Liu, C.; Li, Z.; Berhe, A.A.; Zeng, G.; Xiao, H.; Liu, L.; Wang, D.; Peng, H. Chemical characterization and source identification of organic matter in eroded sediments: Role of land use and erosion intensity. Chem. Geol. 2019, 506, 97–112. [Google Scholar] [CrossRef]
- Rozentsvet, O.A.; Fedoseeva, E.V.; Terekhova, V.A. Lipid biomarkers in ecological assessment of soil biota: Analysis of fatty acids. Usp. Sovrem. Biol. 2019, 139, 161–177. [Google Scholar] [CrossRef]
- Yang, S.; Jansen, B.; Absalah, S.; Kalbitz, K.; Chunga Castro, F.O.; Cammeraat, E.L.H. Soil organic carbon content and mineralization controlled by the composition, origin and molecular diversity of organic matter: A study in tropical alpine grasslands. Soil Tillage Res. 2022, 215, 105203. [Google Scholar] [CrossRef]
- Kirkels, F.M.S.A.; Cammeraat, L.H.; Kuhn, N.J. The fate of soil organic carbon upon erosion, transport and deposition in agricultural landscapes—A review of different concepts. Geomorphology 2014, 226, 94–105. [Google Scholar] [CrossRef]
- Leinweber, P.; Walley, F.; Kruse, J.; Jandl, G.; Eckhardt, K.-U.; Blyth, R.I.R.; Regier, T. Cultivation Affects Soil Organic Nitrogen: Pyrolysis-Mass Spectrometry and Nitrogen K-edge XANES Spectroscopy Evidence. Soil Sci. Soc. Am. J. 2009, 73, 82–92. [Google Scholar] [CrossRef]
- Saiz-Jimenez, C.; De Leeuw, J.W. Chemical characterization of soil organic matter fractions by analytical pyrolysis-gas chromatography-mass spectrometry. J. Anal. Appl. Pyrolysis 1986, 9, 99–119. [Google Scholar] [CrossRef]
- Buurman, P.; Peterse, F.; Almendros Martin, G. Soil organic matter chemistry in allophanic soils: A pyrolysis-GC/MS study of a Costa Rican Andosol catena. Eur. J. Soil Sci. 2007, 58, 1330–1347. [Google Scholar] [CrossRef]
- Juarez, S.; Rumpel, C.; MChunu, C.; Chaplot, V. Carbon mineralization and lignin content of eroded sediments from a grazed watershed of South-Africa. Geoderma 2011, 167–168, 247–253. [Google Scholar] [CrossRef]
- Guggenberger, G.; Rodionov, A.; Shibistova, O.; Grabe, M.; Kasansky, O.A.; Fuchs, H.; Mikheyeva, N.; Zrazhevskaya, G.; Flessa, H. Storage and mobility of black carbon in permafrost soils of the forest tundra ecotone in Northern Siberia. Glob. Chang. Biol. 2008, 14, 1367–1381. [Google Scholar] [CrossRef]
- Rumpel, C.; Chaplot, V.; Planchon, O.; Bernadou, J.; Valentin, C.; Mariotti, A. Preferential erosion of black carbon on steep slopes with slash and burn agriculture. Catena 2006, 65, 30–40. [Google Scholar] [CrossRef]
- Rumpel, C. Biochar transport in terrestrial ecosystems: Fate and impact. In Biochar for Environmental Management; Lehmann, J., Joseph, S., Eds.; Earthscan: Oxford, UK, 2024; pp. 313–330. [Google Scholar]
- Xiao, H.; Li, Z.; Chang, X.; Huang, B.; Nie, X.; Liu, C.; Liu, L.; Wang, D.; Jiang, J. The mineralization and sequestration of organic carbon in relation to agricultural soil erosion. Geoderma 2018, 329, 73–81. [Google Scholar] [CrossRef]
- Derrien, D.; Marol, C.; Balabane, M.; Balesdent, J. The turnover of carbohydrate carbon in a cultivated soil estimated by 13 C natural abundances. Eur. J. Soil Sci. 2006, 57, 547–557. [Google Scholar] [CrossRef]
- Gerke, J. Carbon Accumulation in Arable Soils: Mechanisms and the Effect of Cultivation Practices and Organic Fertilizers. Agronomy 2021, 11, 1079. [Google Scholar] [CrossRef]
- Gunina, A.; Kuzyakov, Y. Sugars in soil and sweets for microorganisms: Review of origin, content, composition and fate. Soil Biol. Biochem. 2015, 90, 87–100. [Google Scholar] [CrossRef]
- Lal, R. Challenges and opportunities in soil organic matter research. Eur. J. Soil Sci. 2009, 60, 158–169. [Google Scholar] [CrossRef]
- Angst, G.; Mueller, K.E.; Nierop, K.G.J.; Simpson, M.J. Plant- or microbial-derived? A review on the molecular composition of stabilized soil organic matter. Soil Biol. Biochem. 2021, 156, 108189. [Google Scholar] [CrossRef]

Disclaimer/Publisher’s Note: The statements, opinions and data contained in all publications are solely those of the individual author(s) and contributor(s) and not of MDPI and/or the editor(s). MDPI and/or the editor(s) disclaim responsibility for any injury to people or property resulting from any ideas, methods, instructions or products referred to in the content. |
© 2024 by the authors. Licensee MDPI, Basel, Switzerland. This article is an open access article distributed under the terms and conditions of the Creative Commons Attribution (CC BY) license (https://creativecommons.org/licenses/by/4.0/).