Article

The Relation between Soil Moisture Phase Transitions and Soil Pore Structure under Freeze–Thaw Cycling

1
State Key Laboratory of Soil and Sustainable Agriculture, Institute of Soil Science, Chinese Academy of Sciences, Nanjing 210008, China
2
College of Agricultural, Nanjing Agricultural University, Nanjing 210095, China
3
State Key Laboratory of Efficient Utilization of Arid and Semi-Arid Arable Land in Northern China, Institute of Agricultural Resources and Agricultural Planning, Chinese Academy of Agricultural Sciences, Beijing 100081, China
*
Author to whom correspondence should be addressed.
Agronomy 2024, 14(8), 1608; https://doi.org/10.3390/agronomy14081608
Submission received: 24 June 2024 / Revised: 20 July 2024 / Accepted: 21 July 2024 / Published: 23 July 2024
(This article belongs to the Section Soil and Plant Nutrition)

Abstract

:
The process of soil moisture phase transitions (SMPT) under freeze–thaw cycling is considered a key factor driving changes in soil pore structure. However, there is still no consensus on which indicators related to SMPT affect the soil pore structure. The objectives of this study were to compare SMPT and soil pore characteristics under freeze–thaw cycling, and to analyze the inherent relationship between them as affected by different bulk densities. Hence, we employed thermal pulse time-domain reflection technology (T-TDR) and X-ray CT scanning technology (X-CT) to quantitatively study the process of SMPT and pore characteristics of soil core samples (60 mm diameter, 100 mm height) repacked with three different bulk density levels: 1.10 g·cm−3 (NC), 1.30 g·cm−3 (LC) and their combination (1.10 g·cm−3 for upper half, 1.30 g·cm−3 for lower half, SC) under freeze–thaw cycling. Our results showed that compared with NC, the porosity of LC’s 0–5 cm soil column decreased by 0.070 cm3·cm−3, the imaged porosity (ϕ>60μm) decreased by 0.034 cm3·cm−3, and the maximum soil ice content (MIC) decreased by 0.030 cm3·cm−3. The pores within the range of 200−300 mm (ϕ2) and 300–400 mm (ϕ3) contribute the most significantly to ϕ>60μm (50–60%). Soil initial moisture content (IMC) and MIC explained 50.1% of the change in ϕ2, and the bulk density explained 49.3% of the change in ϕ3. During the melting process, higher moisture content promotes the thaw collapse of soil particles, resulting in a decrease in ϕ>60μm. The mean pore radius of the limiting layer (MRLL) and the hydraulic radius (HR) show that changes in bulk density from 1.10 g·cm−3 to 1.30 g·cm−3 do not have significant differences. Our results show the relationship between SMPT and pore structure change during freeze–thaw cycles as affected by initial soil bulk density and moisture condition.

1. Introduction

Freeze–thaw cycling is one of the non-biological factors that affect soil structure. After experiencing one or more freeze–thaw cycles, indicators such as soil bulk density, soil aggregate stability, soil saturated hydraulic conductivity, soil water retention properties, and surface runoff are compromised to varying extents [1,2,3], which can indirectly change the biogeochemical processes of soil such as organic matter turnover, carbon mineralization, and nitrogen mineralization [4,5]. At the farmland scale, the most intuitive manifestation of freeze–thaw cycling is the fragmentation and granulation of surface soil [6]. At the pore scale, freeze–thaw cycling can modify the original structure and connectivity of soil pore networks [7]. A study from North Dakota, demonstrated that freeze–thaw cycling has the potential to mitigate soil compaction in farmland [8]. Numerous scholars attribute these changes to the displacement of soil matrix caused by the volume changes in water during the soil moisture phase transitions (SMPT), that is, the freezing and melting of soil moisture during the SMPT changes the original structure of the soil [9,10,11]. Hence, clarifying the dynamic changes in soil ice content during SMPT can provide insight into how micro-pore structure evolves within soils.
The advancements in scientific and technological fields have offered numerous options and techniques to document the progression of SMPT. The phase transition process of soil moisture in farmland occurs below freezing point, and when the temperature drops to a certain value, some film water and hygroscopic water in the soil will not freeze again due to the influence of soil properties [12]. Consequently, researchers generally employ the unfrozen water content of soil to characterize its freeze–thaw state and characteristics [11]. Based on the trend of changes in the unfrozen water content in soil, the freeze–thaw process of farmland soil is divided into rapid freezing period, stable frozen period, and melting period [13,14]. However, during the early freezing period or melting period, a large amount of soil moisture will migrate in space due to the effect of water potential difference [15]. At this time, using the unfrozen water content can only roughly estimate the freezing situation of the soil, and cannot accurately calculate the soil ice content. An indirect method for characterizing soil ice content in the field is the combination of neutron instrument and time-domain reflectometer technology. The neutron method is used to determine the total soil moisture content through the function relationship between slow neutron cloud density and water molecules after fast neutron and hydrogen atom collisions. The liquid moisture content in the soil is recorded using TDR sensors, and the difference between the two is calculated to obtain the soil ice content. Although this method can locate and observe the dynamic changes in soil moisture content, it requires researchers to measure it on site and cannot be applied to surface soil [16,17]. With further technological innovation, low field nuclear magnetic resonance technology (NMR) has been widely used in soil science research due to its advantages in water phase imaging. By monitoring the hydrogen proton relaxation process in soil water, soil moisture content can be determined [18,19]. However, this technology cannot be continuously monitored in farmland. The thermal pulse time-domain reflection technology (T-TDR) integrates a time-domain reflectometer (TDR) and a thermal pulse probe, which can simultaneously measure the liquid moisture content (θl) and soil thermal conductivity (λ). With this technology, a soil ice content estimation model based on soil thermal conductivity has been developed [20], which has the characteristics of small error, continuous in situ measurement, and automation. Meanwhile, T-TDR has been incorporated into the standard method for in situ determination of soil ice content by the American Society of Soil Sciences [21].
The pore structure of farmland soil can be likened to a “black box”. Under the influence of external factors, the pore structure of soil exhibits strong heterogeneity [22]. X-ray computed tomography (X-CT) is an effective tool to help us understand the micro-pore structure of soil [23,24]. Within existing research, X-CT and image analytical methods have been frequently utilized for analyzing freeze–thaw soil. For instance, Liu et al. [25] and Ma et al. [26] discovered at the soil column scale and aggregate scale that the soil matrix undergoes displacement under the influence of freeze–thaw cycling, which can change the original pore channels of the soil, causing changes in the original pore distribution and pore throat network of the soil. Rooney et al. [7] focused on the connectivity of soil pore networks under freeze–thaw cycles, and the findings indicated that repeated freeze–thaw cycles can affect the vulnerability of pore networks. In summary, how much water participates in the phase transition process during freeze–thaw cycling? What indicators pertaining to SMPT influence the micro-pore structure of soil? These inquiries remain unresolved.
In this work, we set up three different soil bulk density combinations to simulate different soil compaction conditions. T-TDR was used to record the dynamic changes in soil ice contents during freeze–thaw cycling, while X-CT and image analysis techniques were used to quantitatively analyze the pore characteristics of soil columns. The specific objectives of this work are: (1) to contrast the pore structure attributes of soil under diverse compaction states prior to and following freeze–thaw cycling, and (2) to evaluate the impact of SMPT related indicators on soil pore structure changes.

2. Materials and Methods

2.1. Experimental Materials and Experimental Design

2.1.1. Physicochemical Properties of Experimental Soil

In October 2022, 0–20 cm of surface soil was collected from a plot of maize continuous cropping in Hailun City, Heilongjiang Province, China (126.79 E, 47.43 N). The bulk density of this soil ranges from 1.10 g·cm−3 to 1.30 g·cm−3, and according to the American soil classification, this soil is classified as black soil (Mollisols). The characteristics of this soil are as follows: organic matter content was 67.62 g·kg−1, pH value was 6.79, cation exchange capacity (CEC) is 33.17 cmol·kg−1, sand, silt, and clay contents are 14.23%, 59.39%, and 26.38%, respectively, and the texture is sandy clay loam. The collected soil is dried and sieved through a 2 mm sieve for the following experiments.

2.1.2. Soil Moisture Sensor and Thermal Characteristic Sensor

The soil liquid moisture content (θl) and soil thermal conductivity (λ) were determined by the MT10 soil moisture sensor (Zheqin Technology, Inc., Dalian, China) and the TP01 soil thermal characteristic sensor (Hukseflux, Inc., Delft, The Netherlands), respectively. The sensor data were connected to the CR300 data logger (Campbell Inc., Logan, UT, USA) via a custom-designed program for recording. Specifically, the MT10 sensor for soil moisture sensor consisted of three dielectric probes, each measuring 52 mm in length, 3.4 mm in width, 2.1 mm in thickness, and a needle spacing of 5 mm. The temperature measurement range of the sensor is −40 °C to 80 °C, and the measurement range of the dielectric constant extends from 0.88 to 81.88. The TP01 sensor for soil thermal conductivity is designed from thin plastic foil, measuring 60 mm in length, 20 mm in width, and 0.15 mm in thickness. The plastic foil incorporated heating wires and thermoelectric piles on its longitudinal axis, which could form a stable radial temperature difference during measurement. The rated measurement range for soil thermal conductivity is 0.3 to 5 Wm−1 K−1.

2.1.3. Experimental Design

Soil columns (60 mm diameter and 100 mm height) were repacked with <2 mm soils after following three bulk density conditions: 1.10 g·cm−3 for a whole column (NC), 1.30 g·cm−3 for a whole column (LC), and their combination with 1.10 g·cm−3 for the upper half (0–50 mm) and 1.30 g·cm−3 for the lower half (51–100 mm) defined as the SC treatment. During the repacking process, every 10 mm layer was repacked at a given bulk density. Soil moisture sensors and thermal characteristic sensors at the 25 mm and 75 mm positions for representing the upper and lower half columns. Each treatments had three replicates.
The soil columns were saturated from the bottom with distilled water, and then dehydrated to a moisture content of approximately 40%. Subsequently, the soil columns were enveloped with plastic sheeting and transported to a 4 °C. environment for 72 h to optimally balance the humidity within the soil columns. Upon completion of water equilibrium, the soil columns were extracted, and 3 parallel soil columns were selected for X-CT scanning under each treatment. The pore structure attributes of the soil column samples were documented and analyzed. Post scanning, the base and lateral walls of all soil columns were enclosed with substantial insulation material. The soil columns were then relocated to a freeze–thaw chamber, frozen in an environment of −15 °C for 48 h, and subsequently thawed at a temperature of 5 °C for 48 h. Three parallel soil columns from each treatment post freeze–thaw once more underwent CT scanning to acquire the pore attributes of the soil post freeze–thaw. The dynamic alterations in soil liquid moisture content and soil thermal conductivity during the freeze–thaw process were documented, and the T-TDR model was utilized to calculate alterations in soil ice content. The schematic diagram of the experimental design is illustrated in Figure 1.
Compared with the preset value, the filling process and water balance process of soil column will cause a small range of errors (<5%) between soil bulk density and soil moisture content. Therefore, the practical soil bulk density and the practical moisture value monitored after water balance are used as the initial soil indicators for data analysis in this study.

2.2. Model for Soil Ice Contents Calculation

This study used an empirical model based on soil thermal conductivity proposed by Tian et al. [20] to estimate the soil ice content. The specific content is as follows:
When θi > 0, the de Vries series model could be simplified as:
λ = θ l λ l + k i f i λ i + k a f a λ a + k s f s λ s θ l + k i f i + k a f a + k s f s
In the formula, λl (0.56 W·m−1·K−1), λs, λi (2.22 W·m−1·K−1), and λa (0.024 W·m−1·K−1) are the thermal conductivities of liquid moisture, soil solid, ice, and air, respectively; and ks, ki and ka are weighting factors of soil solids, ice, and air, respectively.
Estimating λs from soil texture:
λ s = λ s a n d f s a n d + λ s l i t f s l i t + λ c l a y f c l a y
In the formula, fsand, fslit, fclay represent the proportion of soil sand, silt, and clay under the soil texture classification of the United States Department of Agriculture, respectively. λsand, λslit, and λclay represent the thermal conductivity of soil sand, silt, and clay, with values of 7.70 W m−1 K−1, 2.74 W m−1 K−1, and 1.93 W m−1 K−1, respectively.
kn represents the weight factor of soil mineral solid or soil air, and ga(n) is the shape factor of soil mineral solid or air, obtained from the following equation:
k n = 2 3 × [ 1 + ( λ n λ w 1 ) g a ( n ) ] 1 + 1 3 × [ 1 + ( λ n λ w 1 ) ( 1 2 g a ( n ) ) ] 1
ga(soild) can be obtained from the soil texture by the following methods:
g a ( s o i l d ) = g a ( s a n d ) f s a n d + g a ( s l i t ) f s l i t + g a ( c l a y ) f c l a y
In the formula, ga(sand), ga(slit), and ga(clay) are 0.182, 0.0534, and 0.00775, respectively.
The ga(n) of air or ice follows the assumption of de Vries [27], changing from the closest spherical shape (ga(n) = 0.333) of fa and θi to the longitudinal ellipsoidal shape (ga(n) = 0) of fa and θi approaching the total soil porosity. Therefore, the ga(n) of air and ice can be solved using the following equation:
g a ( i c e ) = 0.333 ( 1 θ i 1 f s )
g a ( a i r ) = 0.333 ( 1 f a 1 f s )
In this model, The TP01 sensor can provide the determination of λs, and the MT10 sensor can provide the determination of θl, so the value of θi in Equation (1) can be calculated using GRG non-linear engine as solving method by using the solver code in Microsoft Excel 2021. The detailed solution of the equation was provided in Tian et al. [20].

2.3. X-CT Imaging and Data Processing

Utilizing an X-ray industrial CT scanner (Phoenix v | tome | x m 300, GE, Sensing and Inspection Technologies, GmbH, Wunstorf, Germany), scan soil columns under three different treatments before freezing and after melting, scanning three parallel soil columns for each treatment for a total of 18 scans. The scanning voltage was 180 kV, the current was 160 μA, the resolution was 60.866 μm, the exposure time was 334 mS, and the scanning time was 25 min. 2000 projection images were collected for each soil column. The projection images were reconstructed utilizing Phoenix Datos x software (GE Sensing and Inspection Technologies, GmbH, Wunstorf, Germany), and 16-bit Tiff format grayscale images were exported utilizing VG StudioMAX 3.5 software.
The total porosity of soil is calculated by Equation (7),
φ = ( 1 ρ b / ρ s ) × 100 %
Among them, ρb represents soil bulk density, g·cm−3; ρs represents soil particle density, with the value of 2.65 g·cm−3.Referring to the analysis method of Qian et al. [23], the image was processed and analyzed using Image J 1.53c software (Figure 2). To mitigate boundary impacts, regions of interest (ROI) with a diameter of 3 cm, a height of 1.5–4.5 cm, and 6.5–9.5 cm were selected from the original image, and the image was denoised utilizing a median filter. Subsequently, the Phasalkar automatic local adaptive segmentation method was applied to segment the grayscale image into a binary image.
The imaged porosity (ϕ>60μm) can be calculated by the “Volume Fracture” plugin, the fractal dimension (FD) can be calculated by the “Fractal Dimension” plugin, and the degree of anisotropy (DA) can be calculated by the “Anisotropy” plugin. In addition, the number and volume of soil pores can be calculated using the “Particle Analyzer” plugin, and further indicators such as the specific surface area (SA), the hydraulic radius (HR), the compactness (CP), and the global connectivity (Γ) can be calculated based on the obtained results. Furthermore, the local thickness algorithm in Bone J uses the maximum total inscribed sphere to calculate thickness. With this feature, we can obtain different soil pore size distributions (60–200 μm, 200–300 μm, 300–400 μm, 400–500 μm, > 500 μm).
The specific meanings of the above indicators are as follows: ϕ>60μm is the ratio of the pore volume derived from X-CT images to the total volume of the ROI; SA is calculated by the ratio of the pore surface to the total volume of the ROI, a larger specific surface area indicates a better soil structure; CP describes the shape of the macropore body, higher compactness indicates a greater deviation from a regular body; FD, which increases with the increasing pore structure complexity; DA is a calculated pore geometric characteristic based on the mean intercept length (MIL) method, the value between 0 (perfect isotropic structure) and 1 (anisotropic structure); Γ is equal to 1 as all pores are connected in one percolating pore and is close to 0 when pores with similar size are scattered; HR is calculated by the ratio of the pore volume to the pore surface area, and the mean pore radius of the limiting layer (MRLL) is the mean pore radius of the voxel layer with the least porosity; the higher the HR and MRLL, the better the hydraulic transmission of the soil.

2.4. Statistical Analysis

This investigation employed IBM SPSS Statistics 26 and Origin 2024 software for processing, plotting, and tabulating experimental data. One-way analysis of variance (ANOVA) was used to examine the differences in soil pore characteristics among the three compaction treatments at the same soil position before freezing and after thawing, and the least significant difference test was used to determine the differences (p < 0.05). A paired-samples t-test was used to check the difference between the same soil layer before freezing and after melting under the same treatment (the test level α was set to 0.05, and the test was two tailed). The Pearson correlation analysis was used to determine the correlation between soil initial bulk density, soil maximum ice content and porosity at different pore sizes, and the influence of these indexes on soil porosity at different pore sizes was quantification by multiple linear regression equation (Stepwise Selection). Meanwhile, the difference between the soil pore characteristic parameters before freezing and after melting was calculated and denoted as “Δ”. The Pearson correlation analysis was used to determine the correlation between the relevant indexes of soil initial bulk density and soil moisture phase transition and the changes in soil pore characteristic parameters.

3. Results

3.1. Changes in Soil Temperature and Soil Moisture Phase Transition under Freeze–Thaw Cycling

The changes in soil temperature and moisture under different treatments are shown in Figure 3. Based on the variations in soil temperature and liquid moisture content, the freeze–thaw process of soil could be categorized into three stages: the rapid freezing period (0–15 h), the stable frozen period (15–48 h), and the melting period (48–75 h). During the above three periods, the soil ice content showed a stable increase, relatively stable, and gradually decreasing trend, respectively. Meanwhile, due to the influence of unidirectional freezing, the upper half soil froze earlier but thawed later than the lower half soil (Figure 3).
Table 1 summarizes the quantitative data obtained from the soil freeze–thaw intensity of the three treatments. The NC treatment exhibited the highest ice content under the 5–10 cm soil layer, at 0.294 cm3·cm−3, which was approximately 0.030 cm3·cm−3 higher than the LC treatment. Furthermore, the ice content in the 0–5 cm soil layer under the SC was also greater than that in the 5–10 cm soil layer. The above phenomenon indicates that the compacted soil during the freeze–thaw process reduces the water content involved in phase transition, and the maximum thermal conductivity of the soil also exhibits the similar pattern. In addition, unlike changes in soil ice content, the soil column (5–10 cm) located in the lower layer had a faster freezing speed, longer negative temperature duration, and lower average temperature during the monitoring period.

3.2. Changes in Soil Pore Structure under Freeze–Thaw Cycling

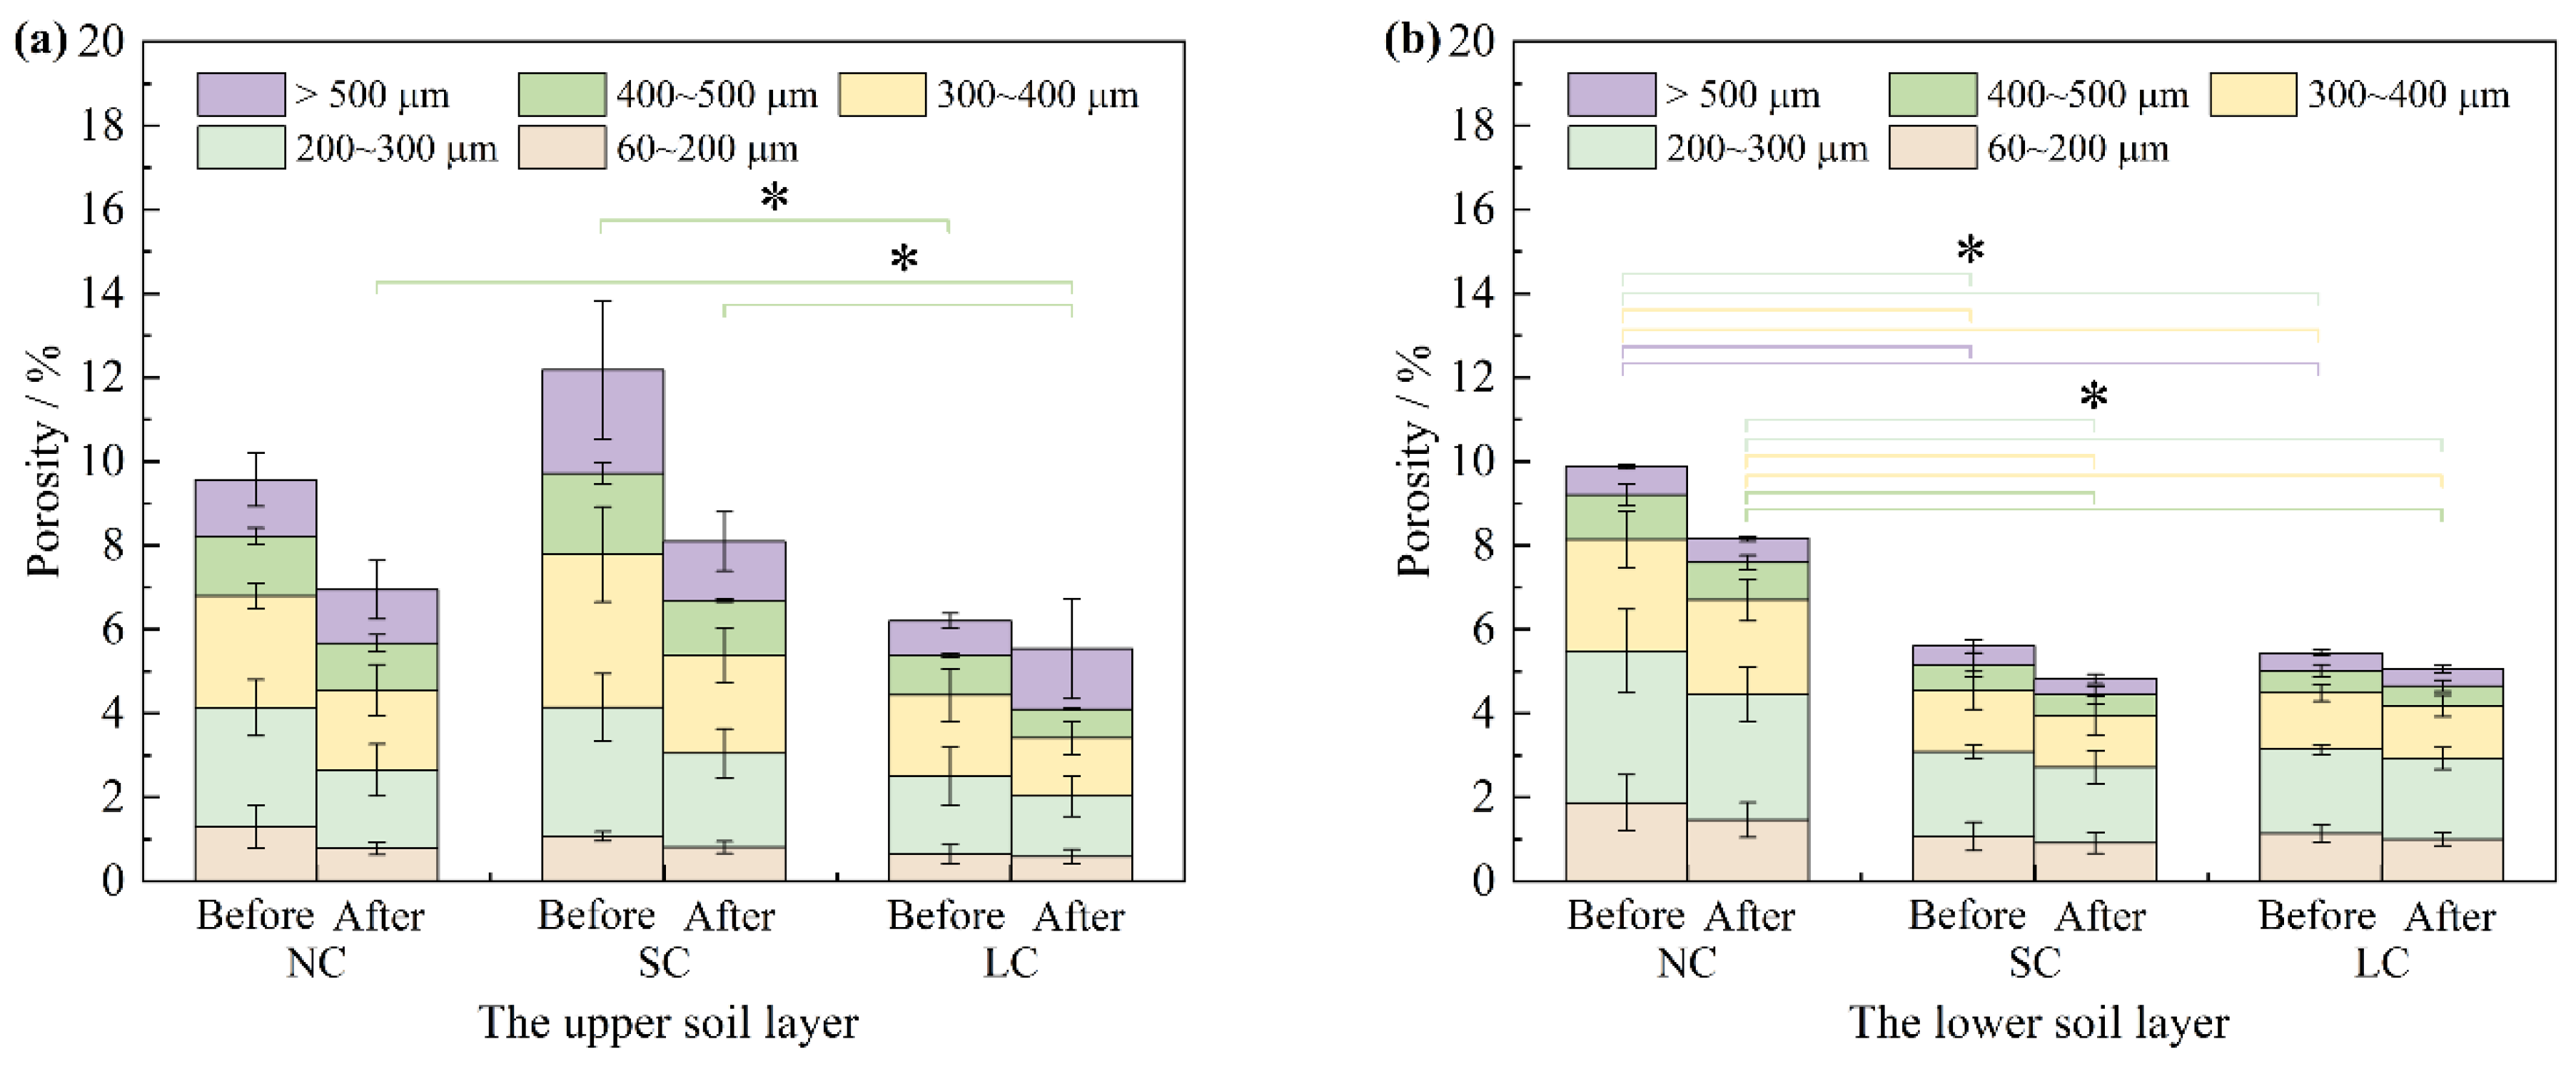
3.2.1. Soil Pore Size Distribution Calculated by X-CT Images

The variation in soil imaged porosity and the number of imaged pores with depth are shown in Figure 4. For the upper half soil, the threshold for imaged porosity of soil slices before freeze–thaw cycling ranged between 0.161% and 44.802%. After freeze–thaw cycling, this range reduced to between 0.274% and 26.759%, and the maximum number of imaged pores was also reduced from 819 to 676. At the same time, the lower half soil also showed a similar pattern of change, indicating that the freeze–thaw cycling had changed the distribution of some pores. However, the distribution of imaged porosity and the number of soil imaged pores under different treatments did not show regularity with depth.
To further investigate the effect of freeze–thaw cycling on soil pores, Figure 5 summarizes the changes in pore size distribution. Overall, before freeze–thaw cycling, the imaged porosity of the upper half soil (ROI: 15–45 mm) in each treatment was SC > NC > LC (12.45% > 9.56% > 6.20%), while the imaged porosity of the lower half soil (ROI: 65–95 mm) was NC > SC > LC (9.87% > 5.60% > 5.44%). The imaged porosity of the soil showed the same variation pattern as the porosity of the soil. After freeze–thaw cycling, the imaged porosity of each treatment decreased, but there was no significant difference in the imaged porosity of the soil before and after freeze–thaw cycling.
Meanwhile, this study provides a more detailed analysis of the distribution patterns of soil pores under different pore sizes. For the upper half soil before freeze–thaw cycling, only the SC (1.92%) and LC (0.96%) at a pore size of 400–500 μm showed significant differences, while NC (1.42%) showed no significant difference between the them. After freeze–thaw cycling, both SC (1.30%) and NC (1.12%) of the upper half soil at this pore size showed significant differences in comparison to LC (0.68%). Unlike the upper half soil, the soil pores in the lower half soil treated with NC before freeze–thaw cycling were significantly larger than those in the SC and LC treatments in the pore size range of 200–300 μm, 300–400 μm, and > 500 μm. After freeze–thaw cycling, the soil pores in the lower soil treated with NC in the pore size range of 200–300 μm, 300–400 μm, and 400–500 μm were significantly larger than those in the SC and LC treatments (p < 0.05). Furthermore, this study also found that the two soil pore sizes of 200–300 μm and 300–400 μm each accounted for the largest proportion of soil imaged porosity, with the sum of the two accounting for 51.1% to 63.5% of imaged porosity.

3.2.2. Soil Pore Characteristics Derived from X-CT Images

Table 2 presents soil pore characteristics obtained from X-CT images. In consonance with the varying trend observed in the soil imaged porosity previously discussed (Figure 4), the porosity of the upper half of the soil column treated with NC was found to be 7% higher compared to that of the upper half treated with LC, due to the influence of bulk density (F = 6799.4, df = 2, p < 0.001). Furthermore, the porosity of the lower half of the soil column was also 7.3% higher (F = 11,977.8, df = 2, p < 0.001). Regardless of before and after freeze–thaw cycling, the FD of the lower part of the soil layer under NC treatment was significantly higher than that under SC and LC treatments (F = 6.410, df = 2, p = 0.032). The Γ of the lower part of the soil layer under NC treatment showed significant differences after freeze–thaw cycling (t = 4.303, df = 2, p = 0.036). However, there were no significant difference in indicators such as SA, CP, DA, MRLL, and HR between different treatments, and the above indicators did not show significant differences before and after freeze–thaw cycling.

3.2.3. Changes in Soil Pores Evolution under Freeze–Thaw Cycling

The soil columns utilized in this study were made from repacked soil. During the preparation process of the soil column, the vast majority of extraneous objects such as grass roots were removed from the soil, and no soil organisms were introduced into the soil. Consequently, the soil pores in this study were identified as non-biological pores. Figure 5 illustrates the changes in the 2D image of soil before and after freeze–thaw cycling. The white area in the figure represents pores, while the black area represents soil, and the highlighted yellow area shows the changes in pores with different shapes under freeze–thaw cycling. Through visual observation, it was determined that under the influence of freeze–thaw cycling, phenomena such as pore compression and disappearance (Figure 6a,f), formation of new pores (Figure 6d), fracture of large pores (Figure 6b,c), recombination between small pores (Figure 6e), and overall displacement of pores occurred. Moreover, it was observed that under treatments with smaller bulk densities, there was a more dispersed distribution of soil pores compared to those with larger bulk densities. Quantitative analysis revealed that under the influence of freeze–thaw cycling, there was an overall decreasing trend in proportionality between soil pore quantity and pore area. This trend is consistent with the overall pore size variation pattern of soil columns (Figure 5). Significantly, the count of soil pores within the soil sections highlighted in Figure 6 also exhibited a general decreasing trend.

3.3. The Relationship between Initial Soil Conditions, Soil Freeze–Thaw Strength and Soil Porosity

To investigate the interconnection between freeze–thaw cycling and soil pore structure, this study executed a simplified categorization of the acquired data. The soil bulk density (BD) and initial soil moisture content (IMC) were served as the initial parameters for soil, while the maximum ice content (MIC), soil freezing rate (SFS), maximum thermal conductivity (MTC), duration of negative soil temperature (NTD), and average soil temperature during freeze–thaw period (AT) were employed as the parameters for soil freeze–thaw intensity (Table 1). The porosity within different pore size ranges reflected the distribution of soil pores. The Pearson correlation analysis results of the above indicators are shown in Figure 7 (df = 16).
The BD and IMC showed a significant negative correlation (p = 0.007) with the MIC (p < 0.001), and a significant positive correlation with the SFS (p = 0.016) and MTC (p < 0.001). Except for pores with the pore size greater than 500 μm, all other pore sizes exhibited a significant positive correlation, and the soil porosity under adjacent pore sizes showed a positive correlation (for example, there was a significant positive correlation between ϕ1 and ϕ2, with a correlation coefficient of 0.86). Meanwhile, it was worth noting that MIC displayed a significant positive correlation with ϕ2, ϕ3, ϕ4 and ϕ>60μm, whereas ϕ4 demonstrated a significant correlation with soil intensity indicators other than NTD (Figure 7).
Based on the above results, this study formulated multiple stepwise regression equations using the stepwise selection method based on the initial soil conditions and the freeze–thaw intensity of the soil, as well as the porosity of varying soil pore dimensions (Table 3). All models had good fitting effects, and all had significance. Specifically, NTD explained 50.4% of the change in ϕ1, MIC and IMC explained 50.1% of the change in ϕ2, BD explained 49.3% and 57.8% of the changes in ϕ3 and ϕ>60μm (imaged porosity), BD and NTD explained 80.4% of the change in ϕ4, and SFS explained 35.3% of the change in ϕ5.

3.4. The Relationship between Initial Soil Conditions, Soil Freeze–Thaw Strength and Changes in Soil Pore Characteristic Parameters

As shown in Table 2, most of the soil pore structure characteristic parameters did not show significant changes after undergoing freeze–thaw cycling. Consequently, this study attempts to explore the relationship between soil initial conditions, soil freeze–thaw intensity, and changes in soil pore characteristic parameters. The results are shown in Table 4 (df = 16). It was observed that BD showed a highly significant positive correlation with ΔCP and ΔΓ, IMC had a significant positive correlation with ΔCP, and MTC had a highly significant positive correlation with ΔCP and ΔΓ. However, there was no significant correlation (p > 0.05) between the initial conditions of soil and the freeze–thaw characteristics of soil, as well as DA, MRLL, and HR, which can characterize soil permeability.

4. Discussion

The three-phase soil consists of solid soil particles, liquid soil water, and air in pores. During freeze–thaw cycling, unfrozen water can still exist at negative temperatures due to capillary action and the influence of surface potential energy of soil particles Zou et al. [11] (Figure 2). Therefore, the soil in freeze–thaw cycling can be considered as composed of four phases: solid soil, liquid water, solid ice, and air [20]. Differences in bulk density between different treatments were observed in this study. Increasing the bulk density of the soil while maintaining its volumetric moisture content constant would lead to further compression of soil particles. As a result, the porosity and imaged porosity of NC before freeze–thaw cycling were significantly higher than those of LC (Table 1). During the stable frozen period under this condition, it was difficult for compacted soil particles to further compress. Assuming that the original soil pores will be filled with liquid water and solid ice from liquid moisture phase transitions, then under this assumption, NC will have more ice content compared to LC due to a greater amount of water involved in phase transitions; explaining why the MIC of NC was 0.03 cm3·cm−3 higher than that in LC (Figure 2). According to capillary theory, pore water can flow along the unfrozen water film on the surface of soil particles towards freezing front during freeze–thaw cycling [28]. The monitoring results in this study showed that the liquid moisture content of the 51–100 mm soil layer under stable frozen period in SC decreased by approximately 0.018 cm3·cm−3 compared to LC. The above phenomenon may be attributed to the accumulation of unfrozen soil moisture within the frozen layer secondary to the influence of hydraulic potential difference subsequent to the commencement of freeze–thaw, as the soil moisture in the subsurface layer steadily approaches the freezing front in the superposed layer [29,30].
For farmland in seasonal frozen soil area, the number of freeze–thaw cycles experienced by soil decreased with the increase in soil depth [31]. Therefore, the soil below the 25 cm layer may only undergo one freeze–thaw cycle, and the influence of natural conditions on soil structure is limited. At the same time, considering that the first freeze–thaw cycle had the greatest impact on soil microstructure, physical properties and chemical properties [9], only one freeze–thaw cycle was set in the freeze–thaw simulation in this study.
During the freeze–thaw process of soil, the volume expansion caused by the transformation of liquid water phase into solid ice has been widely recognized one of the main factors driving soil structural changes [32,33]. Therefore, it was believed that controlling the initial conditions of soil could effectively intervene and change the distribution of soil pores [34]. The correlation between soil initial conditions, soil freezing intensity indicators, and soil porosity are shown in Figure 7. The ϕ>60μm was significantly positively correlated with the porosity in the range of 60–500 mm (p < 0.05), especially the values of ϕ2, ϕ3 and ϕ4 were highly sensitive to the ϕ>60μm, ϕ2 and ϕ3 contributed the most significantly to the ϕ>60μm (Figure 5). The data results in Table 3 also confirmed that BD, IMC, and MIC had a significant impact on the pore structure of soil. In this study, NC exhibited the highest ice content, and compared with other treatments, the imaged porosity change was also the largest (Table 1). This phenomenon further confirms that soil ice content can significantly affect soil pore structure.
Previous studies have shown that the volume of soil water increases by approximately 9% after it is converted from liquid phase to solid phase. Additionally, under the influence of freezing stress, soil particles and aggregates will undergo elastic deformation [25], thus increasing soil porosity [9]. However, in this study, the imaged porosity of all treatments after the freeze–thaw cycling showed a decrease (Table 1). Starkloff et al. [35] also observed a reduction in large porosity and specific surface area during freeze–thaw cycling. Therefore, referring to the research methods of Ma et al. [26] and Fomin et al. [36], 2D images were used to observe the evolution of soil pores, revealing that small pores were mostly regular pores, while large pores were mostly irregular long pores. After freeze–thaw cycling, part of the pores could be observed to disappear through visual observation. Figure 4 also showed the soil imaged porosity and soil pore reduction after freeze–thaw cycling occurred in part of the soil core, which was likely due to the lower bulk density of the test soil columns (1.10 g·cm−3 and 1.30 g·cm−3) and the larger initial soil moisture content that reduced soil cohesion [37]. During the process of freeze–thaw cycling, the phenomenon of “thaw collapse” of soil mass under the influence of gravity, which is caused by the blocking of some pore spaces, also confirms the viewpoint proposed by Rooney et al. [7] that the change in soil pore structure is affected by the initial morphology of soil.
Qian et al. [23] proposed that MRLL and HR can effectively verify the permeability of soil. In this study, MRLL and HR did not show significant differences under different soil layers and different treatments (p > 0.05). Compared with the change rules of other soil pore characteristics, it was found that the increase in bulk density only had an effect on soil FD, while freeze–thaw cycling could not change the trend of change in FD. Considering the relationship between FD and soil erodibility factors [38], it was indicated that freeze–thaw cycling did not impact soil erodibility within the volume weight threshold in this study. In addition, a significant positive correlation between MIC and ΔCP was found (Table 4), indicating that the higher ice content led to the formation of more irregular macropores.
Although the results of this study were encouraging, there were also some limitations that need to be address. The repacked soil column lacks biological pores compared with the actual situation in the field. Previous studies have suggested that biological pores generated by soil roots can have a significant impact on soil pore structure [39]. Unfortunately, the structure of the repacked soil column in this study does not contain biological pores, which is somewhat different from the real farmland, so the response of biological pores to freeze–thaw cycling cannot be solved in this study. Moreover, the number of freeze–thaw cycles also has a significant impact on soil structure changes [26]. Considering the limitation of the resolution of X-CT in this study, in order to better explore the influence of soil moisture phase transition process on soil micro-pore structure, field samples, CT testing instruments with finer resolution and more freeze–thaw cycles should be considered to carry out follow-up tests.

5. Conclusions

In this research, we used T-TDR technology to comprehensively analyze the soil moisture phase transition and soil pore characteristics under different bulk density combinations. We evaluated the impact of soil freeze–thaw alternation on soil structure evolution. Finally, the following conclusion was deduced:
(1)
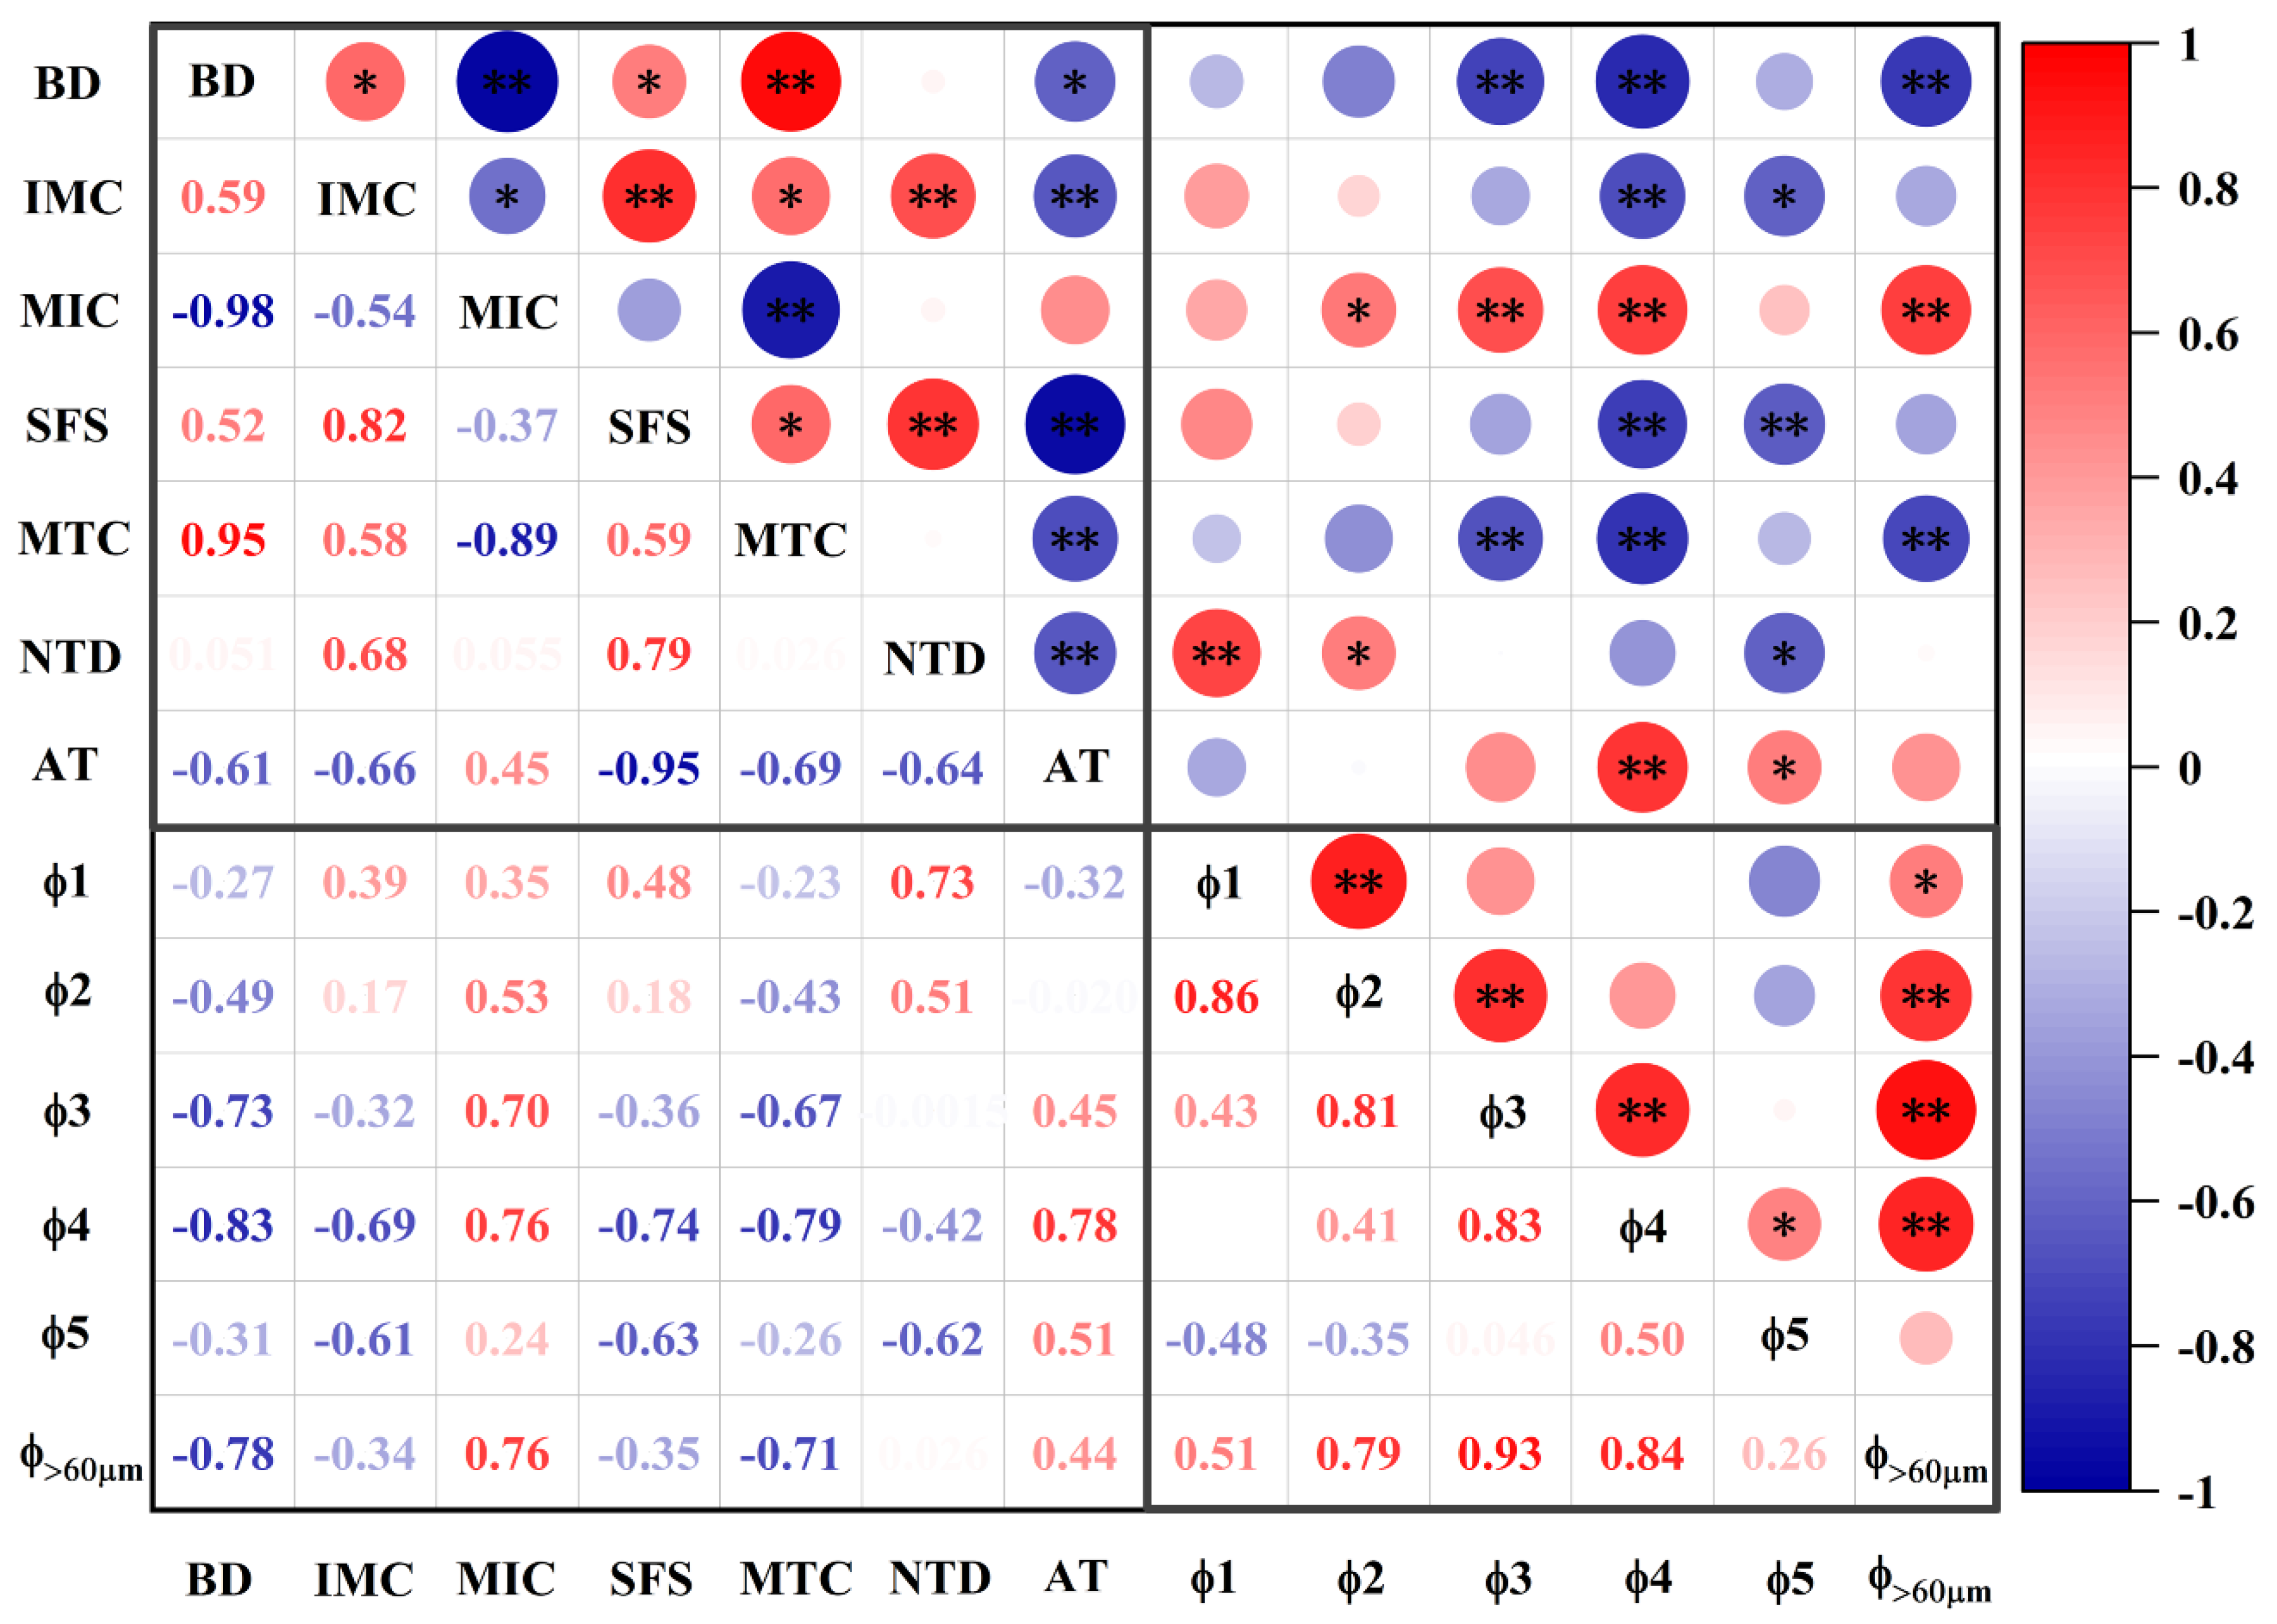
The pores within the range of 200–300 μm (ϕ2) and 300–400 μm (ϕ3) contributed the most significantly to ϕ>60mm (50–60%), and the IMC and bulk density had a high explanatory power for soil pores within the mentioned pore size range. The initial moisture content of soil could significantly affect soil pore structure. In the case of higher initial moisture content, the freeze–thaw cycling promoted the thaw collapse of soil particles, blocked some pores, and reduced the imaged porosity.
(2)
The hydraulic conductivity of the soil in this study was estimated using MRLL and HR, the result showed that changes in bulk density from 1.10 g·cm−3 to 1.30 g·cm−3, as well as single freeze–thaw cycles, did not affect the permeability of black soil. The soil pores transformed into finer and more regular shapes in elevated bulk density following freeze–thaw cycling.

Author Contributions

Conceptualization, Q.L. and X.P.; funding acquisition, Q.L. and X.P.; methodology, Q.L., Y.Q. and Y.W.; resources, X.P.; supervision, X.P.; writing—original draft, Q.L.; writing—review and editing, Q.L. and X.P. All authors will be informed about each step of manuscript processing including submission, revision, and revision reminders via emails from our system or assigned Assistant Editor. All authors have read and agreed to the published version of the manuscript.

Funding

This research was supported by the National Key Research and Development Program of China (2022YFD1500905–04) and the National Natural Science Foundation of China (U23A20222).

Data Availability Statement

The data presented in this study are available on request from the corresponding author.

Conflicts of Interest

The authors declare no conflict of interest.

References

  1. Fu, Q.; Zhao, H.; Li, T.; Hou, R.; Liu, D.; Ji, Y.; Zhou, Z.; Yang, L. Effects of biochar addition on soil hydraulic properties before and after freezing-thawing. Catena 2019, 176, 112–124. [Google Scholar] [CrossRef]
  2. Ma, Q.; Zhang, K.; Jabro, J.D.; Ren, L.; Liu, H. Freeze-thaw cycles effects on soil physical properties under different degraded conditions in Northeast China. Environ. Earth Sci. 2019, 78, 321. [Google Scholar] [CrossRef]
  3. Miranda-Velez, J.F.; Leuther, F.; Koehne, J.M.; Munkholm, L.J.; Vogeler, I. Effects of freeze-thaw cycles on soil structure under different tillage and plant cover management practices. Soil Tillage Res. 2023, 225, 105540. [Google Scholar] [CrossRef]
  4. Hou, R.; Li, T.; Fu, Q.; Liu, D.; Li, M.; Zhou, Z.; Li, Q.; Zhao, H.; Yu, P.; Yan, J. Effects of biochar and straw on greenhouse gas emission and its response mechanism in seasonally frozen farmland ecosystems. Catena 2020, 194, 104735. [Google Scholar] [CrossRef]
  5. Song, Y.; Zou, Y.; Wang, G.; Yu, X. Altered soil carbon and nitrogen cycles due to the freeze-thaw effect: A meta-analysis. Soil Biol. Biochem. 2017, 109, 35–49. [Google Scholar] [CrossRef]
  6. Leuther, F.; Schlueter, S. Impact of freeze-thaw cycles on soil structure and soil hydraulic properties. Soil 2021, 7, 179–191. [Google Scholar] [CrossRef]
  7. Rooney, E.C.; Bailey, V.L.; Patel, K.F.; Dragila, M.; Battu, A.K.; Buchko, A.C.; Gallo, A.C.; Hatten, J.; Possinger, A.R.; Qafoku, O.; et al. Soil pore network response to freeze-thaw cycles in permafrost aggregates. Geoderma 2022, 411, 115674. [Google Scholar] [CrossRef]
  8. Sivarajan, S.; Maharlooei, M.; Bajwa, S.G.; Nowatzki, J. Impact of soil compaction due to wheel traffic on corn and soybean growth, development and yield. Soil Tillage Res. 2018, 175, 234–243. [Google Scholar] [CrossRef]
  9. Xia, W.; Niu, C.; Yu, Q.; Wang, Q.; Wang, J.; Sun, X.; Wang, Z.; Shan, X. Experimental investigation of the erodibility of soda saline-alkali soil under freeze-thaw cycle from a microscopic view. Catena 2023, 232, 107430. [Google Scholar] [CrossRef]
  10. Zhang, L.; Ren, F.; Li, H.; Cheng, D.; Sun, B. The Influence Mechanism of Freeze-Thaw on Soil Erosion: A Review. Water 2021, 13, 1010. [Google Scholar] [CrossRef]
  11. Zou, Y.; Jiang, H.; Wang, E.; Liu, X.; Du, S. Variation and prediction of unfrozen water content in different soils at extremely low temperature conditions. J. Hydrol. 2023, 624, 129900. [Google Scholar] [CrossRef]
  12. Bai, R.; Lai, Y.; Zhang, M.; Yu, F. Theory and application of a novel soil freezing characteristic curve. Appl. Therm. Eng. 2018, 129, 1106–1114. [Google Scholar] [CrossRef]
  13. Gao, Y.; Li, T.; Fu, Q.; Li, H.; Liu, D.; Ji, Y.; Li, Q.; Cai, Y. Biochar application for the improvement ofwater-soil environments and carbon emissions under freeze-thaw conditions: An in-situ field trial. Sci. Total Environ. 2020, 723, 138007. [Google Scholar] [CrossRef] [PubMed]
  14. Li, Q.; Li, T.; Liu, D.; Fu, Q.; Hou, R.; Cui, S. The effect of biochar on the water-soil environmental system in freezing-thawing farmland soil: The perspective of complexity. Sci. Total Environ. 2022, 807, 150746. [Google Scholar] [CrossRef] [PubMed]
  15. Guo, Z.; Jing, E.-c.; Nie, Z.; Jiao, P.; Dong, H. Analysis on the characteristics of soil moisture transfer during freezing and thawing period. Adv. Water Sci. 2002, 13, 298–302. [Google Scholar]
  16. Cheng, Q.; Sun, Y.; Qin, Y.; Xue, X.; Cai, X.; Sheng, W.; Zhao, Y. In situ measuring soil ice content with a combined use of dielectric tube sensor and neutron moisture meter in a common access tube. Agric. For. Meteorol. 2013, 171, 249–255. [Google Scholar] [CrossRef]
  17. Wang, F.; Han, X.; Li, H.; Miao, S. A Technique of Distinguishing the Content of Solid and Liquid Water during Freezing-thawing Period. J. Soil Sci. 2007, 38, 1036–1037. [Google Scholar]
  18. Chen, Y.; Zhou, Z.; Wang, J.; Zhao, Y.; Dou, Z. Quantification and division of unfrozen water content during the freezing process and the influence of soil properties by low-field nuclear magnetic resonance. J. Hydrol. 2021, 602, 126719. [Google Scholar] [CrossRef]
  19. Tian, H.; Wei, C.; Wei, H.; Yan, R.; Chen, P. An NMR-Based Analysis of Soil-Water Characteristics. Appl. Magn. Reson. 2014, 45, 49–61. [Google Scholar] [CrossRef]
  20. Tian, Z.; Ren, T.; Kojima, Y.; Lu, Y.; Horton, R.; Heitman, J.L. An improved thermo-time domain reflectometry method for determination of ice contents in partially frozen soils. J. Hydrol. 2017, 555, 786–796. [Google Scholar] [CrossRef]
  21. Tian, Z.; Kojima, Y.; Heitman, J.L.; Horton, R.; Ren, T. Advances in thermo-time domain reflectometry technique: Measuring ice content in partially frozen soils. Soil Sci. Soc. Am. J. 2020, 84, 1519–1526. [Google Scholar] [CrossRef]
  22. Schlueter, S.; Sammartino, S.; Koestel, J. Exploring the relationship between soil structure and soil functions via pore-scale imaging. Geoderma 2020, 370, 114370. [Google Scholar] [CrossRef]
  23. Qian, Y.; Yang, X.; Zhang, Z.; Li, X.; Zheng, J.; Peng, X. Estimating the permeability of soils under different tillage practices and cropping systems: Roles of the three percolating pore radii derived from X-ray CT. Soil Tillage Res. 2024, 235, 105903. [Google Scholar] [CrossRef]
  24. Rabot, E.; Wiesmeier, M.; Schlueter, S.; Vogel, H.J. Soil structure as an indicator of soil functions: A review. Geoderma 2018, 314, 122–137. [Google Scholar] [CrossRef]
  25. Liu, B.; Fan, H.; Han, W.; Zhu, L.; Zhao, X.; Zhang, Y.; Ma, R. Linking soil water retention capacity to pore structure characteristics based on X-ray computed tomography: Chinese Mollisol under freeze-thaw effect. Geoderma 2021, 401, 115170. [Google Scholar] [CrossRef]
  26. Ma, R.; Jiang, Y.; Liu, B.; Fan, H. Effects of pore structure characterized by synchrotron-based micro-computed tomography on aggregate stability of black soil under freeze-thaw cycles. Soil Tillage Res. 2021, 207, 104855. [Google Scholar] [CrossRef]
  27. de Vries, D.A. Physics of Plant Environment; van Wijk, W.R., Ed.; North Holland: Amsterdam, The Netherlands, 1963; pp. 210–235. [Google Scholar]
  28. Taber, S. The Mechanics of Frost Heaving. J. Geol. 1930, 38, 303–317. [Google Scholar] [CrossRef]
  29. Hou, R.-J.; Li, T.-X.; Fu, Q.; Liu, D.; Li, M.; Zhou, Z.-Q.; Yan, J.-W.; Zhang, S. Research on the distribution of soil water, heat, salt and their response mechanisms under freezing conditions. Soil Tillage Res. 2020, 196, 104486. [Google Scholar] [CrossRef]
  30. Zheng, C.; Simunek, J.; Zhao, Y.; Lu, Y.; Liu, X.; Shi, C.; Li, H.; Yu, L.; Zeng, Y.; Su, Z. Development of the Hydrus-1D freezing module and its application in simulating the coupled movement of water, vapor, and heat. J. Hydrol. 2021, 598, 126250. [Google Scholar] [CrossRef]
  31. Chen, S.; Burras, C.L.; Zhang, X. Soil Aggregate Response to Three Freeze-Thaw Methods in a Northeastern China Mollisol. Pol. J. Environ. Stud. 2019, 28, 3635–3645. [Google Scholar] [CrossRef]
  32. Dan, C.; Jiankun, L. Review of the influence of freeze-thaw cycles on the physical and mechanical properties of soil. Sci. Cold Arid Reg. 2013, 5, 457–460. [Google Scholar] [CrossRef]
  33. Wang, L.; Wang, H.; Tian, Z.; Lu, Y.; Gao, W.; Ren, T. Structural Changes of Compacted Soil Layers in Northeast China due to Freezing-Thawing Processes. Sustainability 2020, 12, 1587. [Google Scholar] [CrossRef]
  34. Jiang, R.; Li, T.; Liu, D.; Fu, Q.; Hou, R.; Li, Q.; Cui, S.; Li, M. Soil infiltration characteristics and pore distribution under freezing-thawing conditions. Cryosphere 2021, 15, 2133–2146. [Google Scholar] [CrossRef]
  35. Starkloff, T.; Larsbo, M.; Stolte, J.; Hessel, R.; Ritsema, C. Quantifying the impact of a succession of freezing-thawing cycles on the pore network of a silty clay loam and a loamy sand topsoil using X-ray tomography. Catena 2017, 156, 365–374. [Google Scholar] [CrossRef]
  36. Fomin, D.S.; Yudina, A.V.; Romanenko, K.A.; Abrosimov, K.N.; Karsanina, M.V.; Gerke, K.M. Soil pore structure dynamics under steady-state wetting-drying cycle. Geoderma 2023, 432, 116401. [Google Scholar] [CrossRef]
  37. Xu, J.; Ren, J.; Wang, Z.; Wang, S.; Yuan, J. Strength behaviors and meso-structural characters of loess after freeze-thaw. Cold Reg. Sci. Technol. 2018, 148, 104–120. [Google Scholar] [CrossRef]
  38. Ahmadi, A.; Neyshabouri, M.-R.; Rouhipour, H.; Asadi, H. Fractal dimension of soil aggregates as an index of soil erodibility. J. Hydrol. 2011, 400, 305–311. [Google Scholar] [CrossRef]
  39. Zhang, Z.; Peng, X. Bio-tillage: A new perspective for sustainable agriculture. Soil Tillage Res. 2021, 206, 104844. [Google Scholar] [CrossRef]
Figure 1. Schematic diagram of experimental design. FTC, freeze–thaw cycling, in this study, only one freeze–thaw cycling process was conducted.
Agronomy 14 01608 g001
Figure 2. Flowchart illustrating all performed XCT image segmentations and analysis steps.
Agronomy 14 01608 g002
Figure 3. Soil temperature dynamics, soil liquid moisture content dynamics, and thermo-time-domain reflectometry (T-TDR) measured ice contents during freezing and thawing for soil samples with a initial moisture content of 0.40 cm3 cm−3. (a,d) represent the NC treatment (1.10 g cm−3), (b,e) represent the SC treatment (1.10 g cm−3 for the upper half and 1.30 g cm−3 for the lower half), and (c,f) represent the LC treatment (1.30 g cm−3).
Agronomy 14 01608 g003
Figure 4. Changes in soil imaged macroporosity (>60 μm) and the number of imaged macropores with soil depth. (ad) represent the upper layer (ROI: 1.5–4.5 cm), and (eh) represent the lower layer (ROI: 6.5–9.5 cm).
Agronomy 14 01608 g004
Figure 5. Soil pore size distribution of upper (0–50 mm) and lower half (51–100 mm) soil column as affected by different bulk density conditions (NC, 1.10 g cm−3; LC, 1.30 g cm−3; SC: 1.10 g cm−3 for the upper half and 1.30 g cm−3 for the lower half). The different colors in brackets correspond to the types of pore sizes one by one. * indicates that the differences in porosity between treatments at the same pore size reached significance (p < 0.05). (a,b) represent the pore distribution of the upper and lower soil layers, respectively.
Agronomy 14 01608 g005
Figure 6. Structural changes in 2D images of soil under freeze–thaw cycling. N represents the number of soil pores in the 2D image, and Area% represents the proportion of soil pores in the binary image.
Agronomy 14 01608 g006
Figure 7. The correlation between initial soil conditions, soil freeze–thaw intensity, and soil porosity. The data result is the Pearson correlation. * and ** indicate correlation at p = 0.05 and 0.01, respectively. The correlation coefficients range from −1 to 1, with a value between −1 and 0 being negative and between 0 and 1 being positive. Abbreviation: BD: soil bulk density; IMC: initial moisture content; MIC: maximum ice content; SFS: soil freezing speed; MTC: maximum thermal conductivity; NTD: negative temperature duration; AT: average temperature; ϕ1: soil porosity within the range of 60–200 μm; ϕ2: soil porosity within the range of 200–300 μm; ϕ3: soil porosity within the range of 300–400 μm; ϕ4: soil porosity within the range of 400–500 μm; ϕ5: soil porosity within the range of >500 μm; ϕ>60μm: total imaged porosity.
Agronomy 14 01608 g007
Table 1. Initial soil liquid moisture contents and main information on soil freeze–thaw intensity of upper (0–50 mm) and lower half (51–100 mm) soil column as affected by different bulk density conditions (NC, 1.10 g cm−3; LC, 1.30 g cm−3; SC: 1.10 g cm−3 for the upper half and 1.30 g cm−3 for the lower half).
TreatmentIMC
(cm3·cm−3)
MIC
(cm3·cm−3)
SFS
(°C·h−1)
MTC
(W·m−1·K−1)
NTD
(h)
AT
(°C)
NC upper0.3570.2920.6771.40854−5.790
SC upper0.3990.2850.6431.40952−5.610
LC upper0.3970.2620.7231.56353−5.965
NC lower0.4250.2940.7841.42069−5.987
SC lower0.4350.2600.7561.50763−5.937
LC lower0.4440.2650.8111.57661−6.063
Abbreviation: IMC: initial moisture content; MIC: maximum ice content; SFS: soil freezing speed; MTC: maximum thermal conductivity; NTD: negative temperature duration; AT: average temperature.
Table 2. Characteristics of imaged pores derived from X-CT images as affected by different bulk density conditions (NC, 1.10 g cm−3; LC, 1.30 g cm−3; SC: 1.10 g cm−3 for the upper half and 1.30 g cm−3 for the lower half).
Treatment ϕ
(cm cm−3)
ϕ>60μm
(cm cm−3)
SA
(m−1)
CPFDDAΓMRLL (mm)HR
(mm)
Before freeze–thaw cyclingNC
upper
0.583 a (0.001)0.096 b (0.007)9.860 (0.717)430.333 (38.877)2.665 (0.071)0.605 (0.064)0.148 (0.015)0.202 (0.069)0.102 (0.008)
SC
upper
0.584 a (0.001)0.125 Aa (0.009)9.065 (1.050)532.672 (113.281)2.666 (0.043)0.673 (0.076)0.214 (0.060)0.175 (0.033)0.111 (0.013)
LC
upper
0.513 b (0.001)0.062 c (0.014)10.110 (0.308)270.804 (84.330)2.502 (0.059)0.645 (0.309)0.127 (0.025)0.161 (0.060)0.099 (0.003)
NC
lower
0.585 a (0.001)0.099 a (0.023)11.081 (0.236)404.851 (99.625)2.740 a (0.068)0.414 (0.089)0.096 A (0.012)0.158 (0.004)0.090 (0.002)
SC
lower
0.510 a (0.001)0.056 b (0.007)11.059 (0.709)228.446 (142.759)2.604 b (0.054)0.332 (0.043)0.073 (0.057)0.170 (0.019)0.090 (0.006)
LC
lower
0.512 b (0.001)0.054 b (0.005)11.210 (0.153)153.089 (79.725)2.619 b (0.016)0.426 (0.104)0.044 (0.038)0.173 (0.040)0.089 (0.001)
After freeze–thaw cyclingNC
upper
-0.069 ab (0.015)9.785 (0.662)299.588 (148.093)2.581 (0.053)0.577 (0.041)0.140 (0.063)0.160 (0.012)0.103 (0.007)
SC
upper
-0.081 Ba (0.007)9.659 (0.809)373.716 (153.230)2.599 (0.048)0.482 (0.237)0.162 (0.085)0.148 (0.009)0.104 (0.008)
LC
upper
-0.055 b (0.001)9.213 (1.758)238.640 (131.294)2.487 (0.040)0.411 (0.006)0.190 (0.039)0.189 (0.089)0.110 (0.021)
NC lower-0.082 a (0.016)11.194 (0.119)260.516 (54.388)2.709 a (0.059)0.413 (0.057)0.066 B (0.003)0.173 (0.017)0.089 (0.001)
SC
lower
-0.048 b (0.012)11.308 (0.483)188.993 (155.813)2.556 b (0.067)0.341 (0.022)0.079 (0.093)0.159 (0.007)0.089 (0.001)
LC
lower
-0.051 b (0.008)11.283 (0.131)159.714 (113.973)2.583 b (0.053)0.358 (0.073)0.048
(0.043)
0.156 (0.011)0.089 (0.004)
Note: The number are presented as mean (standard error, n = 3). The uppercase letters represent significant differences in the pore characteristics between before and after freeze–thaw cycles under the same treatments, and the lowercase letters represent significant differences in the pore characteristics between different treatments (p < 0.05). Abbreviation: ϕ: total porosity; ϕ>60μm: total imaged porosity; SA: specific surface area; CP: compactness; FD: fractal dimension; DA: degree of anisotropy; Γ: global connectivity; MRLL: mean pore radius of the limiting layer; HR: hydraulic radius.
Table 3. Stepwise multiple regression model between different indicators.
Stepwise Multiple Regression ModelR2FpVIF
ϕ1 = 0.733 NTD0.50416.2590.001-
ϕ2 = 0.526 MIC0.2245.3420.037-
ϕ2 = 0.876 MIC + 0.643 IMC0.5018.5240.0041.422
ϕ3 = −0.726 BD0.49315.5700.001-
ϕ4 = −0.830 BD0.66731.0760.000-
ϕ4 = −0.811 BD − 0.376 NTD0.80431.7530.0001.003
ϕ5 = −0.629 SFS0.3539.1760.009-
ϕ>60μm = −0.779 BD0.57821.5420.000-
Abbreviation: BD: soil bulk density; IMC: initial moisture content; MIC: maximum ice content; SFS: soil freezing speed; NTD: negative temperature duration; ϕ1: soil porosity within the range of 60–200 μm; ϕ2: soil porosity within the range of 200–300 μm; ϕ3: soil porosity within the range of 300–400 μm; ϕ4: soil porosity within the range of 400–500 μm; ϕ5: soil porosity greater than 500 μm; ϕ>60μm: total imaged porosity.
Table 4. The correlation between initial soil conditions, soil freeze–thaw intensity, and the changes in soil pore characteristic parameters.
IndicatorsΔ SAΔ CPΔ FDΔ ΓΔ DAΔ MRLLΔ HR
BD0.2270.774 **−0.3310.739 **−0.2160.3350.186
IMC0.2690.526 *−0.1360.415−0.2800.1400.223
MIC−0.200−0.8170.347−0.8010.253−0.359−0.141
SFS0.2630.291−0.0960.193−0.1030.0810.264
MTC0.2410.740 **−0.2330.597 *−0.1640.2250.273
NTD0.202−0.043−0.023−0.030−0.0850.0220.154
AT−0.258−0.2900.113−0.2010.042−0.097−0.294
Note: “Δ” represents the difference between the soil pore characteristic parameter indicators after freeze–thaw and before freeze–thaw cycling. Abbreviation: BD: soil bulk density; IMC: initial moisture content; MIC: maximum ice content; SFS: soil freezing speed; MTC: maximum thermal conductivity; NTD: negative temperature duration; AT: average temperature; SA: specific surface area; CP: compactness; FD: fractal dimension; DA: degree of anisotropy; Γ: global connectivity; MRLL: mean pore radius of the limiting layer; HR: hydraulic radius. ‘*’ representative is significant at the p < 0.05 level, while ‘**’ representative is significant at the p < 0.01 level.
Disclaimer/Publisher’s Note: The statements, opinions and data contained in all publications are solely those of the individual author(s) and contributor(s) and not of MDPI and/or the editor(s). MDPI and/or the editor(s) disclaim responsibility for any injury to people or property resulting from any ideas, methods, instructions or products referred to in the content.

