Article

Study on the Appropriate Degree of Water-Saving Measures in Arid Irrigated Areas Considering Groundwater Level

1
State Key Laboratory of Hydraulic Engineering Simulation and Safety, Tianjin University, Tianjin 300072, China
2
State Key Laboratory of Simulation and Regulation of Water Cycle in River Basin, Beijing 100038, China
3
China Institute of Water Resources and Hydropower Research, Beijing 100038, China
4
School of Water Resources and Environment, China University of Geosciences (Beijing), Beijing 100083, China
5
Yellow River Institute of Hydraulic Research, Zhengzhou 450003, China
*
Author to whom correspondence should be addressed.
Agronomy 2024, 14(8), 1611; https://doi.org/10.3390/agronomy14081611
Submission received: 19 May 2024 / Revised: 19 June 2024 / Accepted: 19 July 2024 / Published: 23 July 2024
(This article belongs to the Special Issue Water Saving in Irrigated Agriculture: Series II)

Abstract

:
Irrigated areas are major vectors of agricultural development and components of ecosystems. The groundwater level maintains the irrigated areas’ ecology safety and sustainable development. Under the influence of irrational irrigation practices—such as flood irrigation or extreme water saving without consideration of ecological impact—different areas within an irrigation district may experience anomalies in groundwater levels (either too deep or too shallow). It is of great significance to carry out research on water resource allocation and future water-saving strategies, taking into consideration groundwater depths. In this study, a method for the optimal allocation of irrigation water resources that considered groundwater level was used to regulate irrational irrigation practices and to reveal the future direction of water saving. Helan County in Ningxia province, an ecologically fragile and arid irrigated area, was selected as a case study. Multiple scenarios of different water use and different degrees of water-saving were analyzed. The results showed that non-engineering water-saving measures (such as adjusting the planting structure and controlling the amount of irrigation for rice) had better benefits compared to engineering measures (such as efficient water-saving irrigation and channel lining). When implementing only one water-saving measure, the strategy of replacing 75% of the rice area with corn yielded the best results. This approach can reduce the irrigation water shortage rate to 11% and increase by 4.58% the acreage where the groundwater level is reasonable. When multiple water-saving measures are implemented together, the most effective strategy for future water-saving efforts involves the joint implementation of several measures: replacing 75% of the rice area with corn, limiting irrigation for rice to no more than 11.85 thousand m3/ha, adopting high-efficiency water-saving irrigation in 90% of the pump-diverted water irrigation region and 40% of the channel-diverted water irrigation region, and maintaining the channel’s water utilization coefficient at 0.62. This strategy can keep the irrigation water shortage below 3.66% and increase the acreage where the groundwater level is reasonable, by 4.58% per year. The conclusions and research approaches can provide references for the formulation of water-saving measures for irrigated areas’ sustainable development.

1. Introduction

Water is the lifeblood of agricultural development. Water and land resources are unevenly distributed [1,2]. Additionally, there is often a mismatch between natural precipitation and crop growth periods. As a result, irrigation has become an essential means to support global agriculture [3,4]. This is especially true in arid and semi-arid areas, where agricultural development has increasingly relied on irrigation. Research by Peterson et al. has shown that supplementary irrigation of crops can effectively increase crop yields [5]. Both Li et al. [6] and Shen et al. [7] have pointed out that agricultural development in arid and semi-arid areas is heavily reliant on irrigation. Irrigation plays a crucial role in ensuring agricultural development, and the scale of irrigated areas should be determined based on the condition of water resources. Hall [8] pointed out the importance of irrigated agriculture in meeting the massive additional food demand caused by rapid population growth and shared the regional irrigation experience applicable to the UK.
According to the 2016 statistics from the International Commission on Irrigation and Drainage, the global irrigated area is approximately 300 million hectares, constituting one-sixth of the total cultivated land area (1.87 billion hectares). Most of the irrigated area is concentrated in arid and semi-arid regions characterized by limited rainfall and water resources, such as in the Mediterranean arid and semi-arid regions [9], the arid US West [10], Central Asia [11], and Niger in Africa [12]. Meanwhile, China is predominantly located within the subtropical monsoon climate zone, with roughly 52.5% of its climate classified as arid or semi-arid, in regions that are notably characterized by their scarce water resources [13]. The scarcity of water resources and the dislocation of water and land resources have made agricultural development more dependent on irrigation [14]. Economically and socially, irrigation has become the largest consumer of water [15]. For a long time, China has maintained an agricultural irrigation water utilization of 310 billion m3, accounting for 54.2 percent of total water utilization. Irrigated areas produce 75% of food production and 90% of economic crop growth [16]. However, the available water resources for agriculture are under severe strain due to the small average quantities of water resources per area, resulting from uneven distribution and competition with industry amid socio-economic development. Research by Huang et al. [17] points out that 12 of China’s 13 major grain-producing provinces, which currently account for 74% of national grain production, already face water shortages and increased competition for water from non-agricultural sectors. Furthermore, studies by Peng et al. [18] and Wang et al. [19] suggest that China’s water use structure and agricultural water consumption growth in recent decades may intensify the competition for water between industry and agriculture in the future. Therefore, the development of water-saving agriculture is necessary to ensure national food security in the future.
Water saving in agriculture has been emphasized for a long time. However, the promotion of current water-saving measures has often focused too much on the single goal of water-saving usage, neglecting the impact on the entire water cycle and groundwater level, which may lead to ecological problems affecting the sustainable development of irrigated areas. Research led by Li et al. suggests that in arid regions, irrigated areas that draw water from external sources without considering the groundwater level may trigger salinization problems due to excessively shallow groundwater [15]. Essaid et al. [20] studied the effect of irrigation on the hydrology of the Smith River basin by simulating surface and groundwater interaction. They found that irrigation accelerates the water cycle, altering its natural pattern, and warned that improper irrigation could jeopardize regional sustainability. Chen et al. [21] suggest that it is necessary to evaluate the environmental consequences of irrigation projects from a lifecycle standpoint, rather than solely focusing on crop yield enhancement and reduction in irrigation quantity.
The uneven distribution of irrigation water resources leads to irrational irrigation practices. Different regions face various problems related to the use of irrigation water resources, such as in the areas of Hetao of China [22,23], the Danube, Sava, and Morava River Area [24], the Manas River basin oasis [25], Niger [26], Saharan irrigated land [27], and the Yinchuan plain [28,29], where irrigation water delivered from outside is plentiful. Due to flood irrigation and insufficient water-saving measures, the groundwater depth becomes too shallow, leading to salinization and other ecological problems. However, in some areas, the insufficient supply of irrigation water resources and excessive water-saving has reduced the deep seepage of surface water, resulting in a decrease in groundwater depth [30]. This further causes soil dryness and desertification [31]. In conclusion, the imbalanced distribution of irrigation water and unreasonable irrigation practices may result in anomalous groundwater depths in irrigated areas, which may cause ecological problems such as salinization, desertification, and so on.
The Qingtongxia irrigation area, located in Ningxia Autonomous Region of China, is an irrigation oasis created by the Yellow River in a typical continental arid and semi-arid climate area (Figure 1b). With the recent decrease in the Yellow River’s transit water [32], the contradiction between irrigation water supply and demand has become more prominent. Implementing water-saving measures has effectively alleviated the pressure on irrigation water, but it has also caused the ecological problems of groundwater decline and salinization through excessive water saving. Research by Wu [33], Zhang [34], and another team led by Zhang [35], using remote sensing and statistical methods, indicates severe salinization in the northern region of the Qingtongxia irrigation district, primarily due to shallow groundwater levels. Given the dual pressures of a fragile ecology and water shortage in the Qingtongxia irrigation area, exploring appropriate water-saving measures under the dual control of limited water use and rational groundwater depth is the primary task to ensure the sustainable development of the irrigated area.
Given these findings, it is critical to prioritize the selection of suitable water-saving strategies and implement sensible irrigation practices tailored to the specific conditions of the region. This approach is essential for the sustainable growth of irrigated agricultural zones and for enhancing efficient water use. The necessity of this research lies in its potential to guide policies and practices that can mitigate salinization issues, conserve water resources, and support the long-term viability of agriculture in areas vulnerable to such environmental challenges. We chose Helan irrigation area, a typical area within the Qingtongxia irrigation area, as the research site. The effects of 24 water-saving schemes were evaluated using the optimal water resources allocation method coupled with a numerical groundwater model. The appropriate direction for water-saving measures to ensure sustainable development of irrigated areas is proposed, taking into account both the shortage of irrigation water and the groundwater depth. The study can provide references for the direction of water saving in the Yellow River irrigation area in Ningxia and other arid areas under the premise of sound ecological development.

2. Study Area and Data Sources
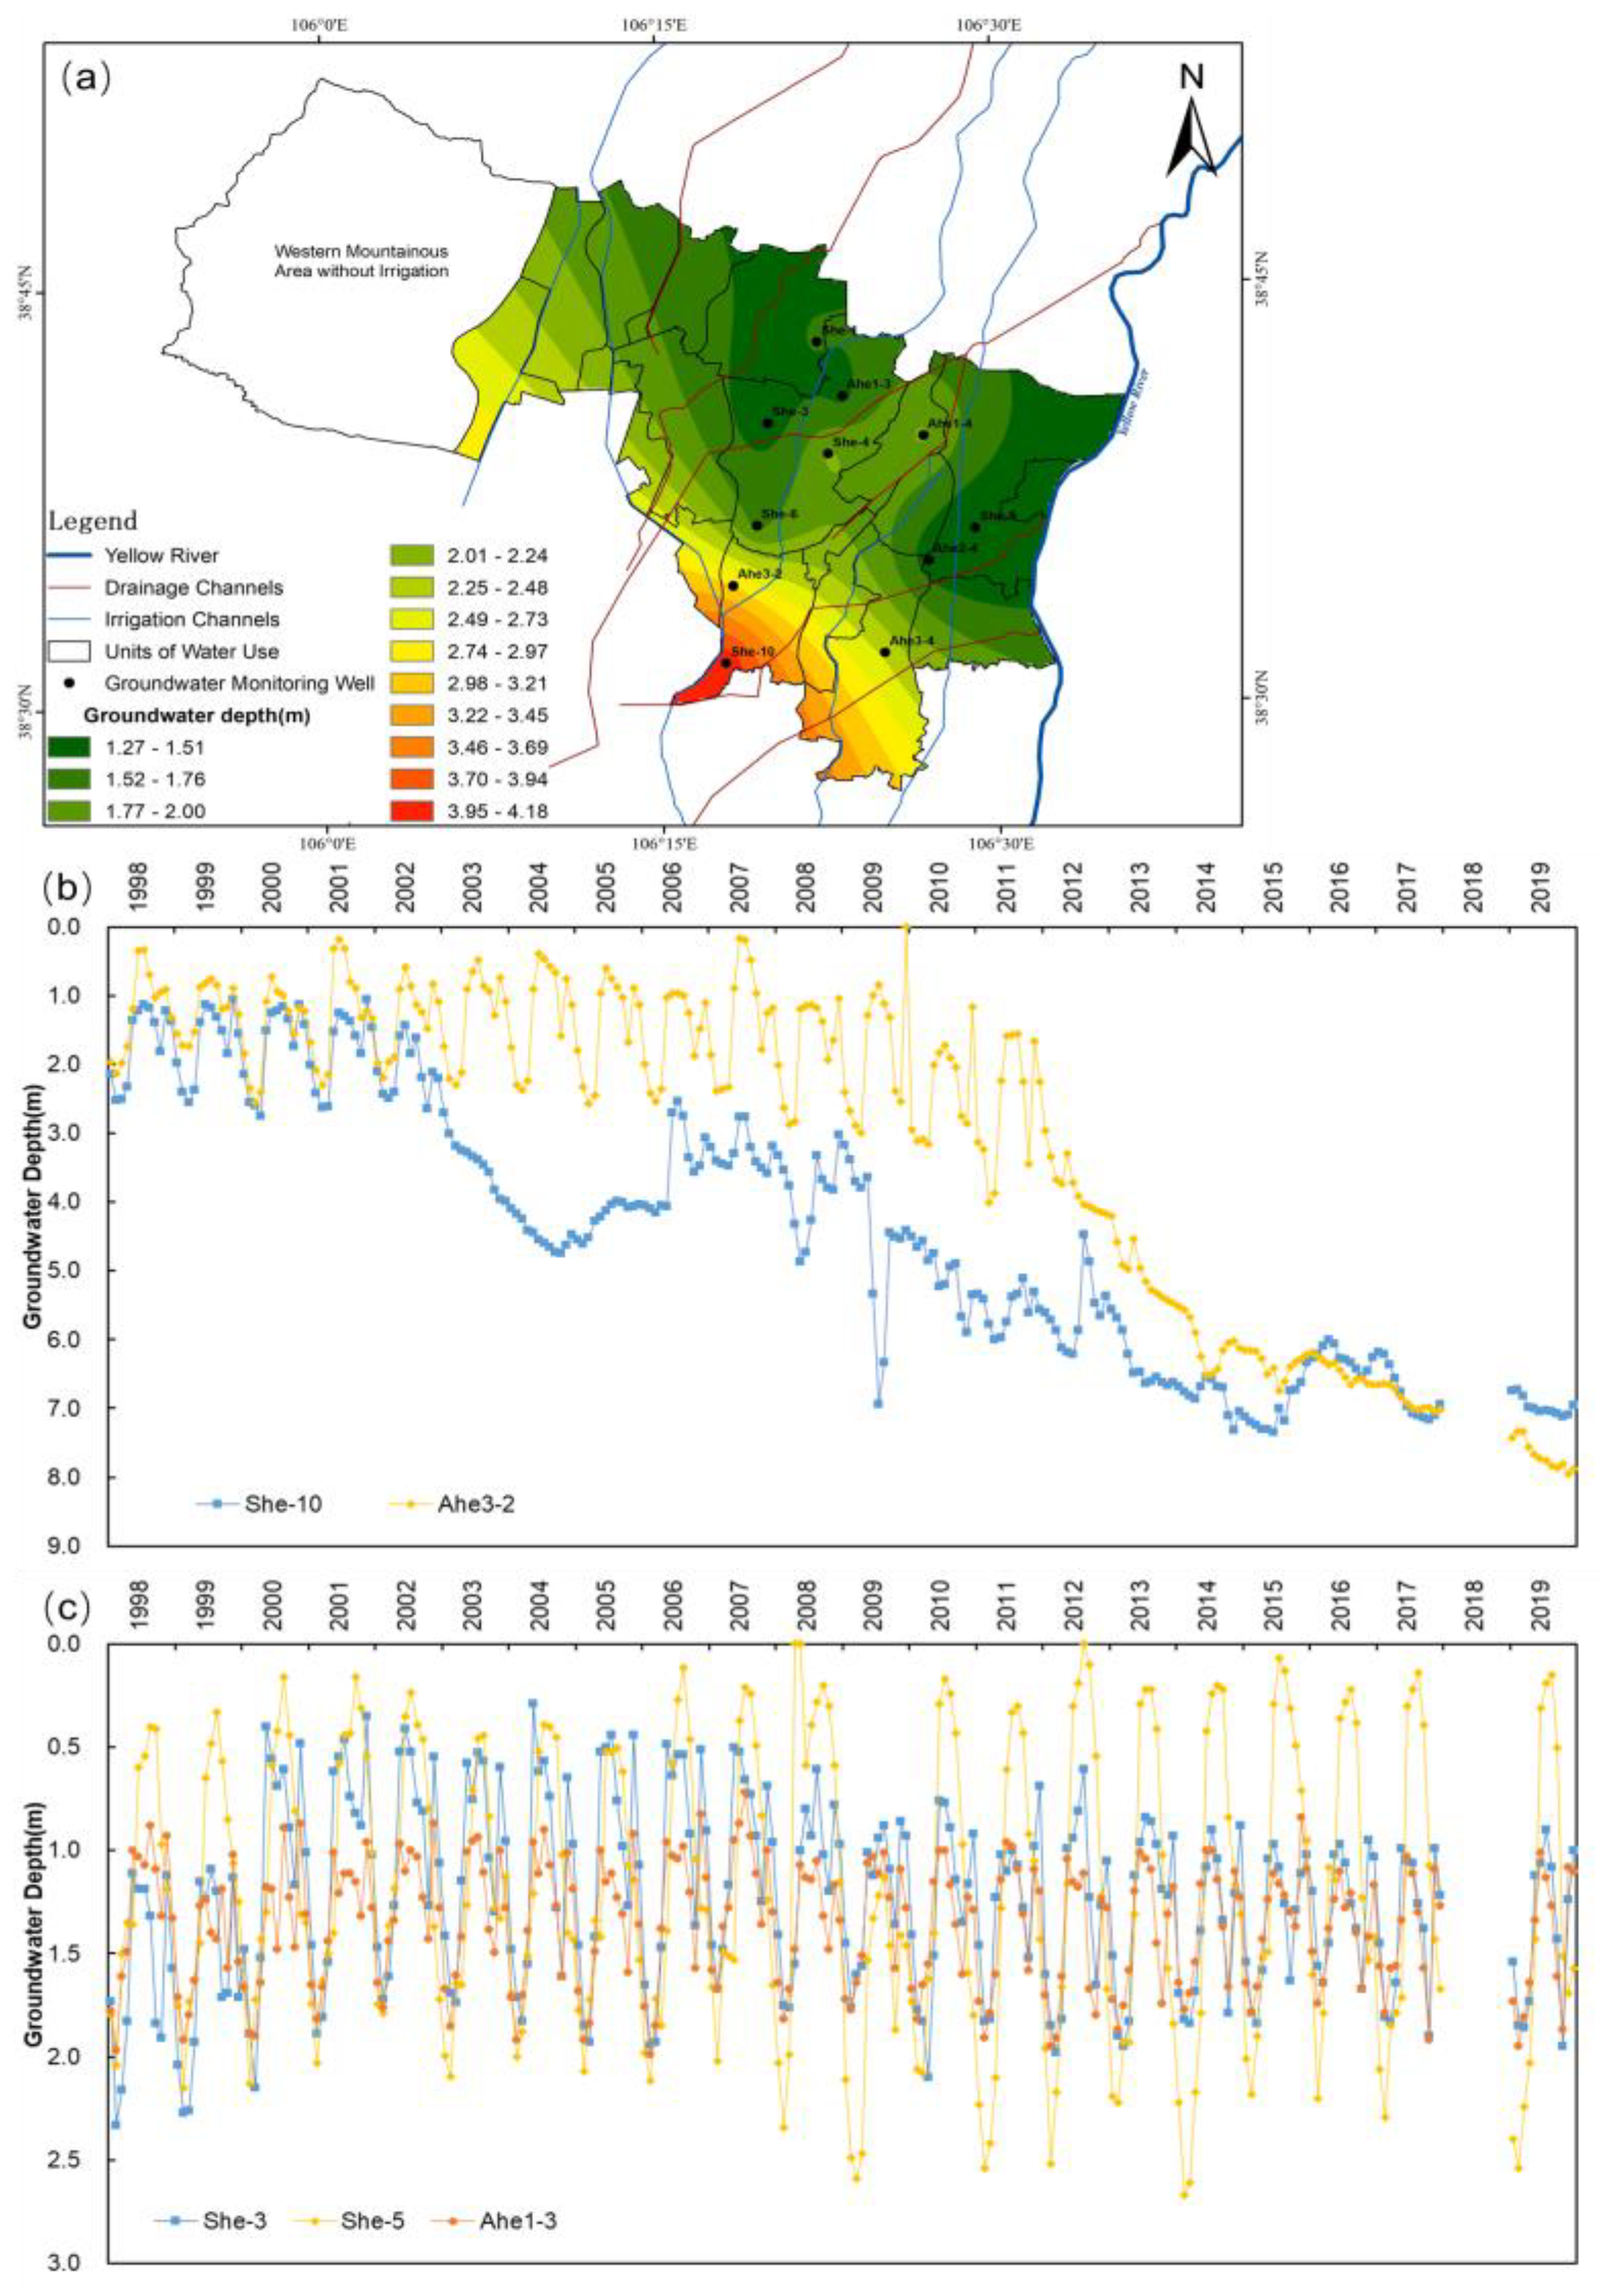
2.1. Study Area

Helan County is located in the northern part of Ningxia Autonomous Region and is a typical component of the Qingtongxia irrigation area. Its longitude is between 105°53′ and 106°36′, and its latitude is between 38°27′ and 38°52′ (Figure 1b,c). Helan county covers a total area of 1197.57 km2, and the terrain inclines from southwest to northeast. The landforms include the Helan Mountains, the modern alluvial plain of the Yellow River, and sandy land, in order from west to east. The advantageous geographical position, relatively flat terrain, and deep alluvial–proluvial soil layer create favorable conditions for agricultural development in Helan County.
The annual average precipitation and evaporation for the period from 1956 to 2019 were 193 mm and 1716.8 mm, respectively. The significant disparity between precipitation and evaporation has exacerbated the scarcity of natural water resources in Helan County, which is poorly endowed with natural water. The main sources of water for its agricultural development are diverted from the Yellow River and groundwater. According to the Ningxia Water Resources Bulletin, the total water consumption of Helan County in 2020 was 536 million m3, which included 487.7 million m3 of water diverted from the Yellow River and 48.3 million m3 of local groundwater. Considering the water use control indicators for total water consumption and groundwater withdrawal in 2020, the current total water consumption in Helan County is approaching the upper limit set for water consumption, and the groundwater usage has exceeded permissible levels. Given the current development situation, Helan County may face a significant agricultural water shortage in the future.

2.2. Regional Problem

On one hand, Helan County is facing the challenge of water shortage, which constrains future development. On the other hand, there are significant variations in the spatial distribution of groundwater depth in Helan County [36]. The groundwater depth is too shallow in the north and excessively deep in the south (as shown in Figure 2a). In the southern regions, although some measures have been implemented in recent years to reduce the extent of groundwater decline, the trend of decline has not been fundamentally curbed in certain areas due to overexploitation caused by unreasonable development of water resources (as shown in Figure 2b). In the northern regions, insufficient water saving and excessive irrigation have resulted in a shallow groundwater depth in some areas (as shown in Figure 2c), leading to salinization. According to the statistics from Helan County Government in 2019, there is currently a total area of cultivated land amounting to approximately 38 thousand ha within Helan County; this figure includes 18.7 thousand ha classified as saline–alkali land, which accounts for forty-nine percent of all cultivated land in Helan County.
Considering the aforementioned issues, and with the constraints of total water consumption and groundwater depth, it is of great importance to explore appropriate water-saving measures for agricultural irrigation. This will promote the healthy development of the irrigated area.

2.3. Data Sources

In this study, we used the development level of irrigated areas in Helan County from 2017 as the baseline to study the optimal allocation of irrigation water resources. We also explored appropriate water-saving measures in irrigated areas in response to changes in groundwater depth. The data for the planting area were selected based on the 2017 data from the Ningxia Statistical Yearbook (https://www.nx.gov.cn/ accessed on 5 December 2020) and the Helan County Statistical Yearbook (http://www.nxhl.gov.cn/ accessed on 8 December 2020). Information on water resources development and utilization was obtained from the Ningxia Water Resources Bulletin and the data recorded by the irrigation district management department (http://slt.nx.gov.cn/ accessed on 3 May 2021). The groundwater level observation data were from the groundwater monitoring data of Ningxia Hydrology Bureau. The meteorological data needed to calculate the crop irrigation water requirements in irrigated areas were obtained from China Meteorological Data Sharing Network (http://www.nmic.cn/ accessed on 26 October 2020).

3. Method

The optimal method for allocating irrigation water resources under the dual control of total water use and groundwater level involves coupling the irrigation water resource optimization allocation model with the numerically simulated groundwater model. This approach not only enables the spatio-temporal optimization allocation of irrigation water resources but also regulation of the groundwater level in the irrigated area. By inputting various water-saving measure schemes (S1–S9 and Z1–Z14) into the above method, we evaluated their impact on water security in the irrigated area and the corresponding groundwater level. We propose a direction for maintaining ecological balance and sustainability in water-saving, by comprehensive considering both irrigation water security and the groundwater level.

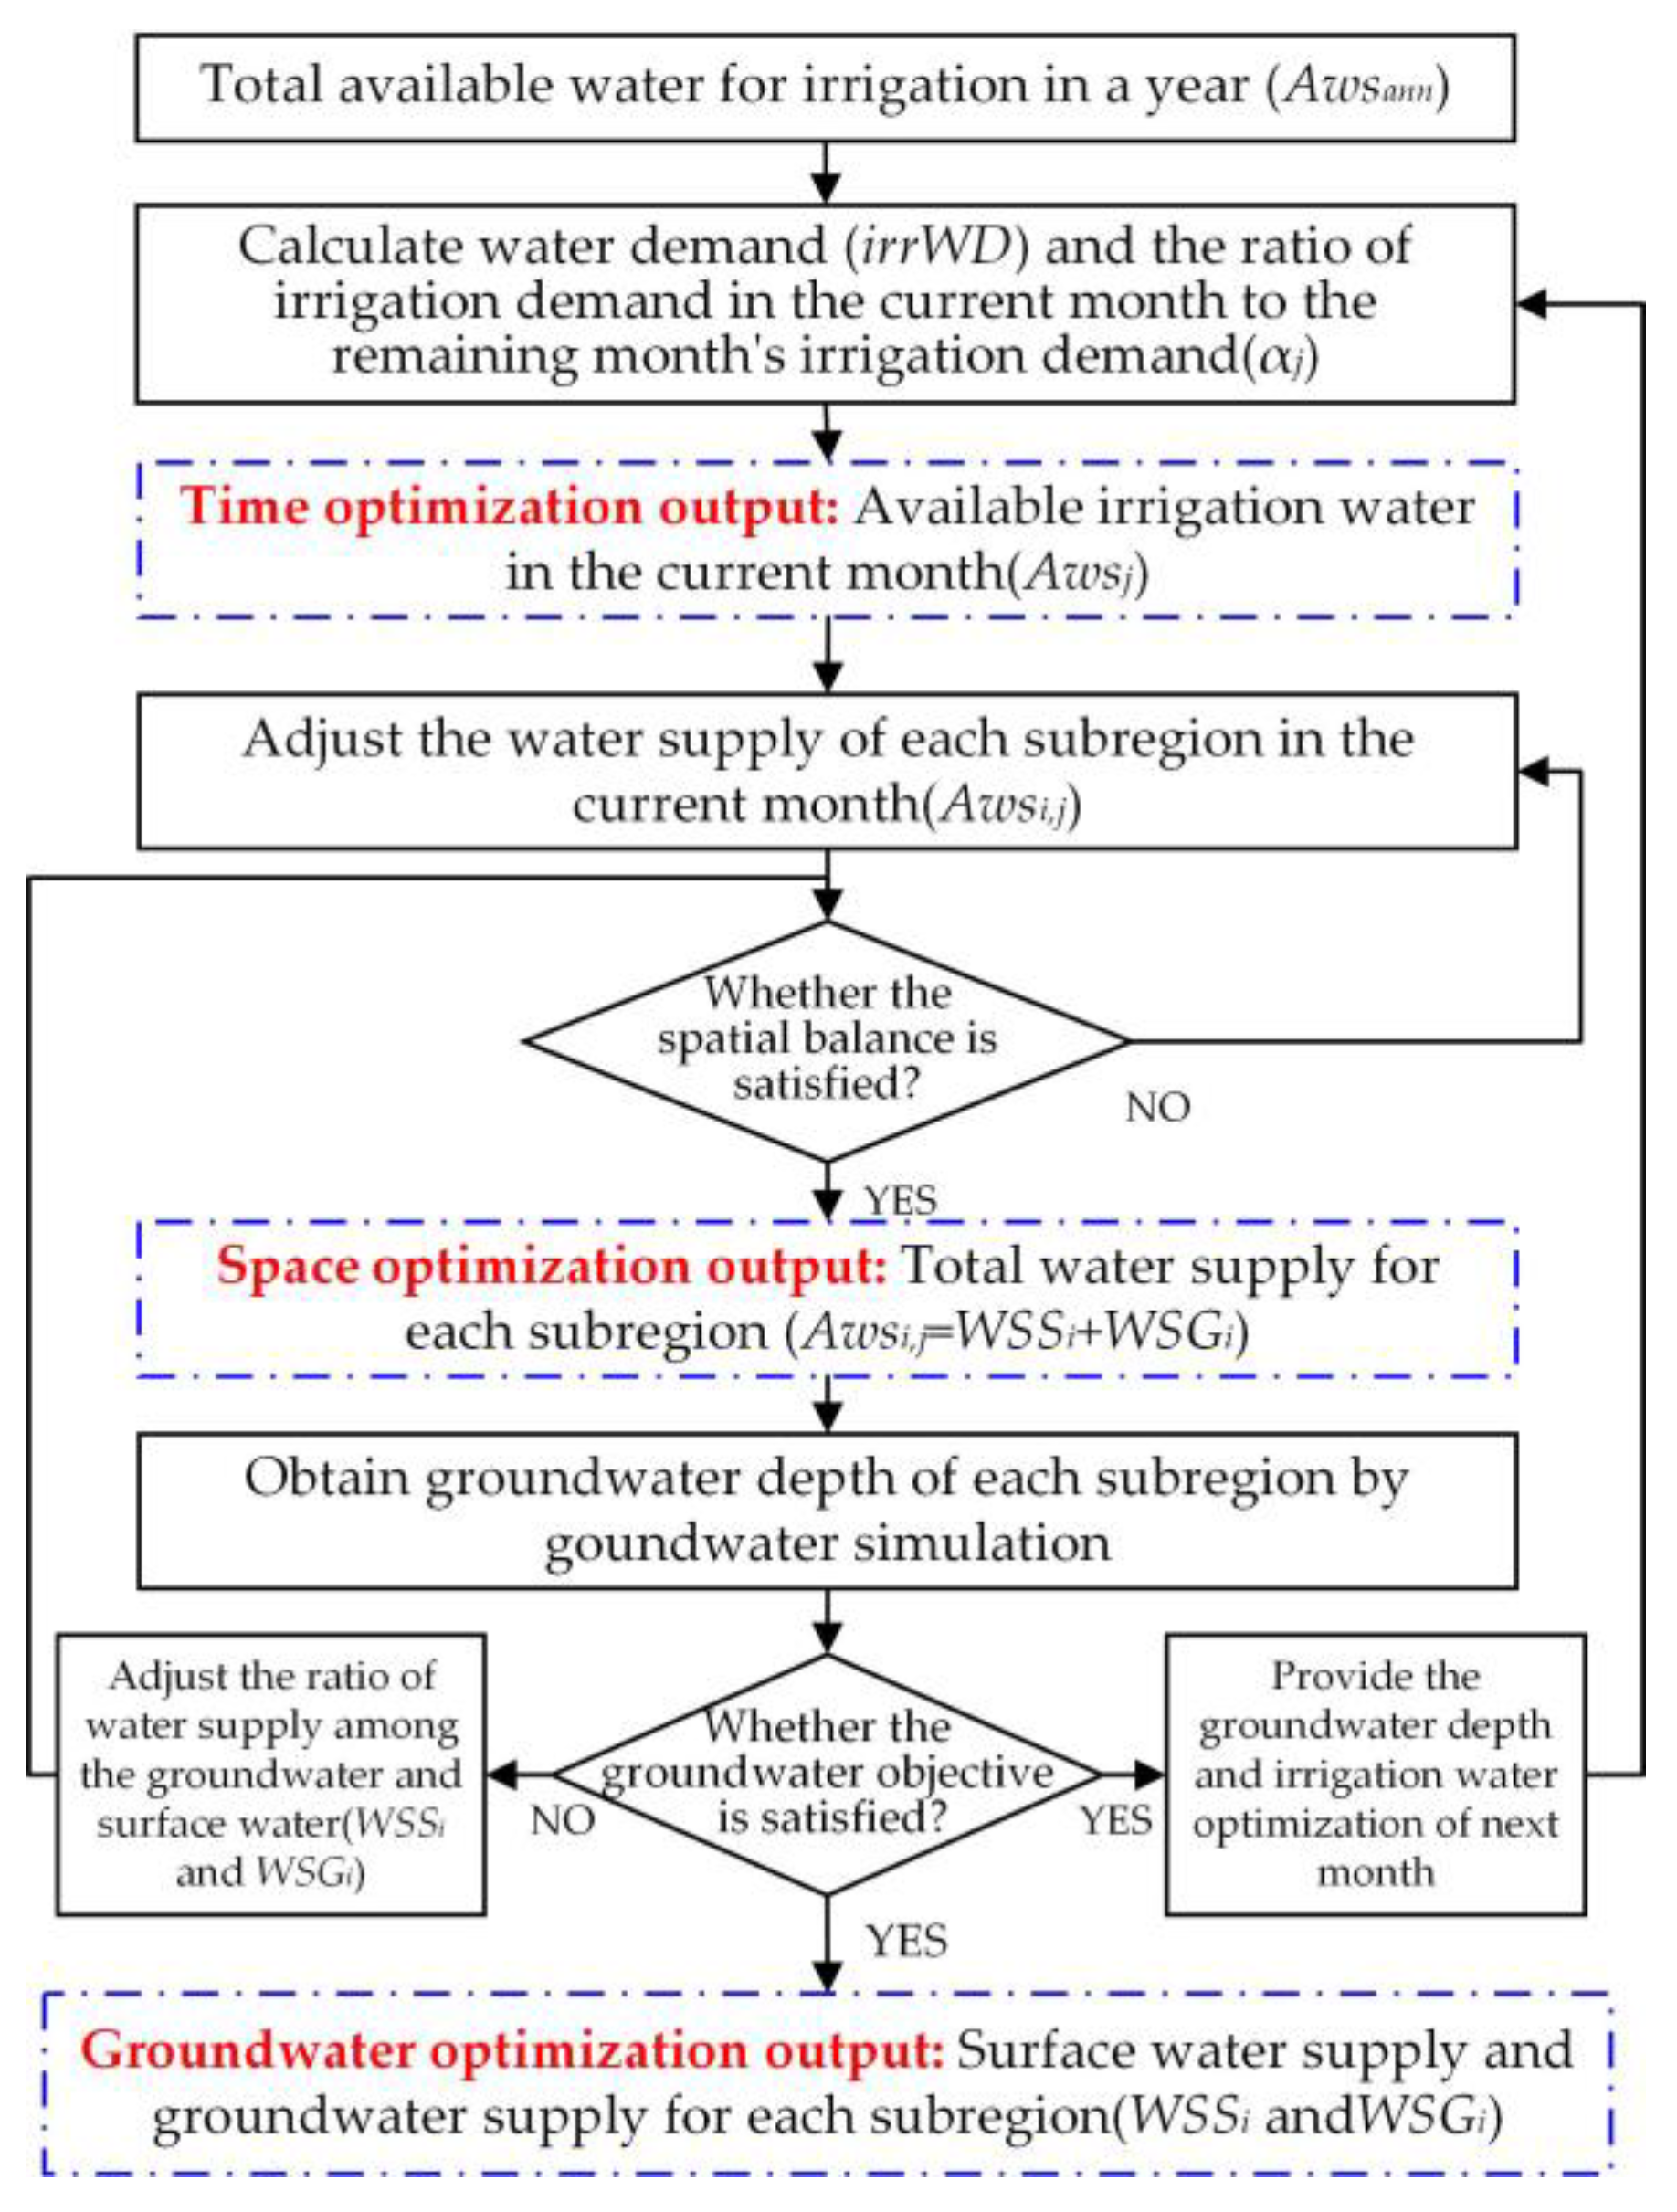
3.1. The Optimal Allocation Method of Water Resources

The optimal method for allocating water resources under the dual control of total water use and groundwater level consists of three optimization structures (as illustrated in Figure 3): space optimization, time optimization, and groundwater optimization. Time optimization primarily adjusts the distribution of irrigation water throughout the year, ensuring an even distribution of irrigation water according to crop water needs over time. Its main function is to allocate irrigation water in different irrigation periods according to the proportion of water demand and available water throughout the year. The output is then fed into the space optimization module. Space optimization primarily addresses the issue of differences in irrigation water uses across different regions, aiming to achieve a balance of irrigation water resources in spatial use. It mainly determines whether the irrigation water resources are spatially balanced and, if they are not, adjusts the irrigation water resources of each unit until the water consumption of each unit is essentially the same. The results are then fed into the groundwater optimization module. Groundwater optimization mainly involves adjusting the groundwater supply based on current groundwater levels. On the one hand, the groundwater module provides the groundwater burial depth for the time and space module, and on the other hand, it determines whether the groundwater burial depth is reasonable under the current allocation of irrigation water resources. If the groundwater objective is not satisfied, multiple iterations of calculations feed back into the space optimization and time optimization of irrigation water resources, achieving regulation of groundwater levels. The detailed formulas and optimization objectives are as follows:
Time optimization primarily calculates the current water demand and allocates water resource on a temporal scale (monthly). The water demand is calculated using the crop coefficient method, considering both the effective precipitation and capillary rising water from groundwater for crops. The water demand is calculated using the following formula:
i r r W D = A × ( k c × E T 0 e P u G ) 10 × η
where irrWD is the water demand, m3; kc is the crop coefficient; ET0 is potential evaporation, mm; eP is effective precipitation, mm; uG is the amount of groundwater directly utilized by crops, mm; A is the planting area of crop, ha; and η is the effective utilization coefficient of irrigation water.
In the optimal allocation of water resources on a temporal scale (monthly), the main objective is to achieve a balanced allocation of water resources according to the monthly crop demand. The optimized water supply (irrigation water) for the current month is obtained by Formula (2):
A w s j = α 1 × A w s a n n i f j = 1 α j × ( A w s a n n 1 j 1 A w s j ) i f j = 2,3 , , 11 A w s a n n 1 j 1 A w s j i f j = 12
where Awsj is the current available irrigation for the optimization month (month j), m3; Awsann is the total annual available irrigation water in the study area, m3; αj is the ratio of irrigation demand in the current month to the remaining month’s irrigation demand.
Space optimization primarily achieves the spatial balance optimization of each subregion in the current month by iteratively adjusting the water supply of each subregion. This process obtains the optimized water supply (irrigation water) for the subregions in the current month. The objective function of spatial optimization is the minimum sum of the variance of water shortage rate and the square of the accumulated water shortage rate among each subregion. The optimization’s objective functions and corresponding constraints are shown in Formulas (3)–(7):
m i n F 1 = 1 n i = 1 n i r r W D i W S S i W S G i i r r W D i i r r W D W S S W S G i r r W D 2
m i n F 2 = i = 1 n i r r W D i W S S i W S G i i r r W D i
W S S i + W S G i < i r r W D i
W S G i m i n G I C i S Y G i
i a W S S i D C b
where minF1 and minF2 are the objective functions; irrWDi, WSSi, and WSGi are the current month’s water demand, water supply from surface water, and water supply from groundwater of subregion i, m3; irrWD, WSS, and WSG are the current month’s water demand, water supply from surface water, and water supply from groundwater of the whole study area, m3; GICi and SYGi are the monthly groundwater intake capacity and max yield of groundwater under the sustainable development situation, m3; DCb is the monthly maximum delivering water capacity of b channel; a is the number of subregions that obtain water from channel b.
Groundwater optimization combines the groundwater simulation model and spatial optimization. The groundwater depth was obtained using a Modflow groundwater numerical simulation model. The spatial optimization results were input into the groundwater simulation model, and groundwater optimization was realized by repeatedly adjusting the ratio of the groundwater and surface water supply. Through the year-by-month cycle calculation, the balanced allocation of water resources considering groundwater depth was realized by means of time optimization, space optimization, and groundwater optimization. The groundwater optimization objectives are expressed in Formulas (8)–(10):
m i n F 3 = i = 1 m D e p i D e p *
m a x F 4 = A
D e p * = D e p m i n * i f D e p i < D e p m i n * 0 i f D e p m i n * D e p i D e p m a x * D e p m a x * i f D e p i D e p m a x *
where minF3 is the objective of groundwater depth deviation value index; maxF4 and A are the objective of the acreage of the groundwater located at a reasonable level, m2; Depi is the groundwater depth of the i monitoring well, m; Dep* is the reasonable groundwater depth; Dep*min and Dep*max are the lower and upper reasonable groundwater depths, m.
Method data and parameter setting: In conjunction with the characteristics of water management in Helan County irrigation area, the current situation of water use, and the local regulations for management of water resources [15], the maximum available irrigation consumption was set at 454.2 million m3. This included 25.11 million m3 of groundwater and 429.09 million m3 of surface water sourced from the Yellow River. The irrigated region of Helan County, excluding the western mountainous area that has no irrigation, was designated as the study area. This area was divided into 20 subregions (units of water use) based on the boundaries of the irrigation canal system and the requirements and scope of irrigation water management (as shown in Figure 1c). The depth of groundwater has a significant impact on the ecological security and sustainable development of the region. Synthesizing numerous research findings [37,38,39] and actual investigation, the reasonable groundwater depth threshold adopted in this paper is 1.2–3 m. The reasonable groundwater depths for different months are shown in Figure 4.

3.2. The Scenarios of Water-Saving Measures

Based on the current water supply structure and water-saving level, combined with the future development trend of the irrigation area and the constraints of total water consumption, we constructed 24 water-saving schemes. These were informed by the Irrigation Development Plan of Ningxia, the Development Plan for the Modern Ecological Irrigation Area of Ningxia Diversion Irrigation Area, and others. The 24 water-saving schemes consisted of 1 benchmark scheme (S0), 9 single water-saving schemes (S1–S9), and 14 comprehensive water-saving schemes (Z1–Z14). The benchmark scheme (S0) represents the current level of water-saving. Each single scheme (S1–S9) incorporated only one water-saving measure. The comprehensive schemes (Z1–Z14) were combinations of several single-schemes (S1–S9). The detailed water-saving schemes are shown in Table 1.
The benchmark scheme (S0): the planting structure and water-saving degree in 2017 were used as the benchmark scheme. According to the Statistical Yearbook of Helan County, the effective irrigated area in the study area was 42.18 thousand ha, and the total planting area was 48.79 thousand ha. The crop distribution included rice (26.16%), wheat (9.73%), corn (8.24%), wheat interplanted with corn (3.83%), vegetables (14.41%), and other crops (37.63%). Implementation of high-efficiency water-saving irrigation covered 58% of the pump-diverted water irrigation region and 20.8% of the channel-diverted water irrigation region. The water utilization efficiency of the channel was 0.605. The net quota of rice irrigation by traditional irrigation methods was 15 thousand m3/ha.
The engineering water-saving measures included 2 types: implementing efficient water-saving irrigation and channel lining to increase the efficiency of water utilization. Efficient water-saving irrigation was divided into three schemes (S3–S5). S3 adopted highly efficient water-saving irrigation covering 70% of the pump-diverted water irrigation region and 30% of the channel-diverted water irrigation region. S4 and S5 were set at 80% and 35%, and 90% and 40%, respectively. In terms of channel lining, three schemes (S6-S8) were set. The water utilization efficiencies of the channel were increased to 0.62 (S6), 0.64 (S7), and 0.66 (S8), respectively.
The non-engineering water-saving measures include 2 types: adjusting the planting structure and controlling the irrigation water volume for rice. In the adjustment of the planting structure, two schemes (S1–S2) were set, in which 50% (S1) and 75% (S2) of rice planting areas were replaced with corn, while the planting areas of other crops remained unchanged. In terms of controlling the irrigation water volume for rice, 1 scheme was set to focus on controlling the irrigation volume for highly water-consuming crops such as rice. The net irrigation quota for rice was reduced to no more than 11.85 thousand m3/ha.

4. Results

4.1. Evaluation of the Effect of Single Water-Saving Schemes

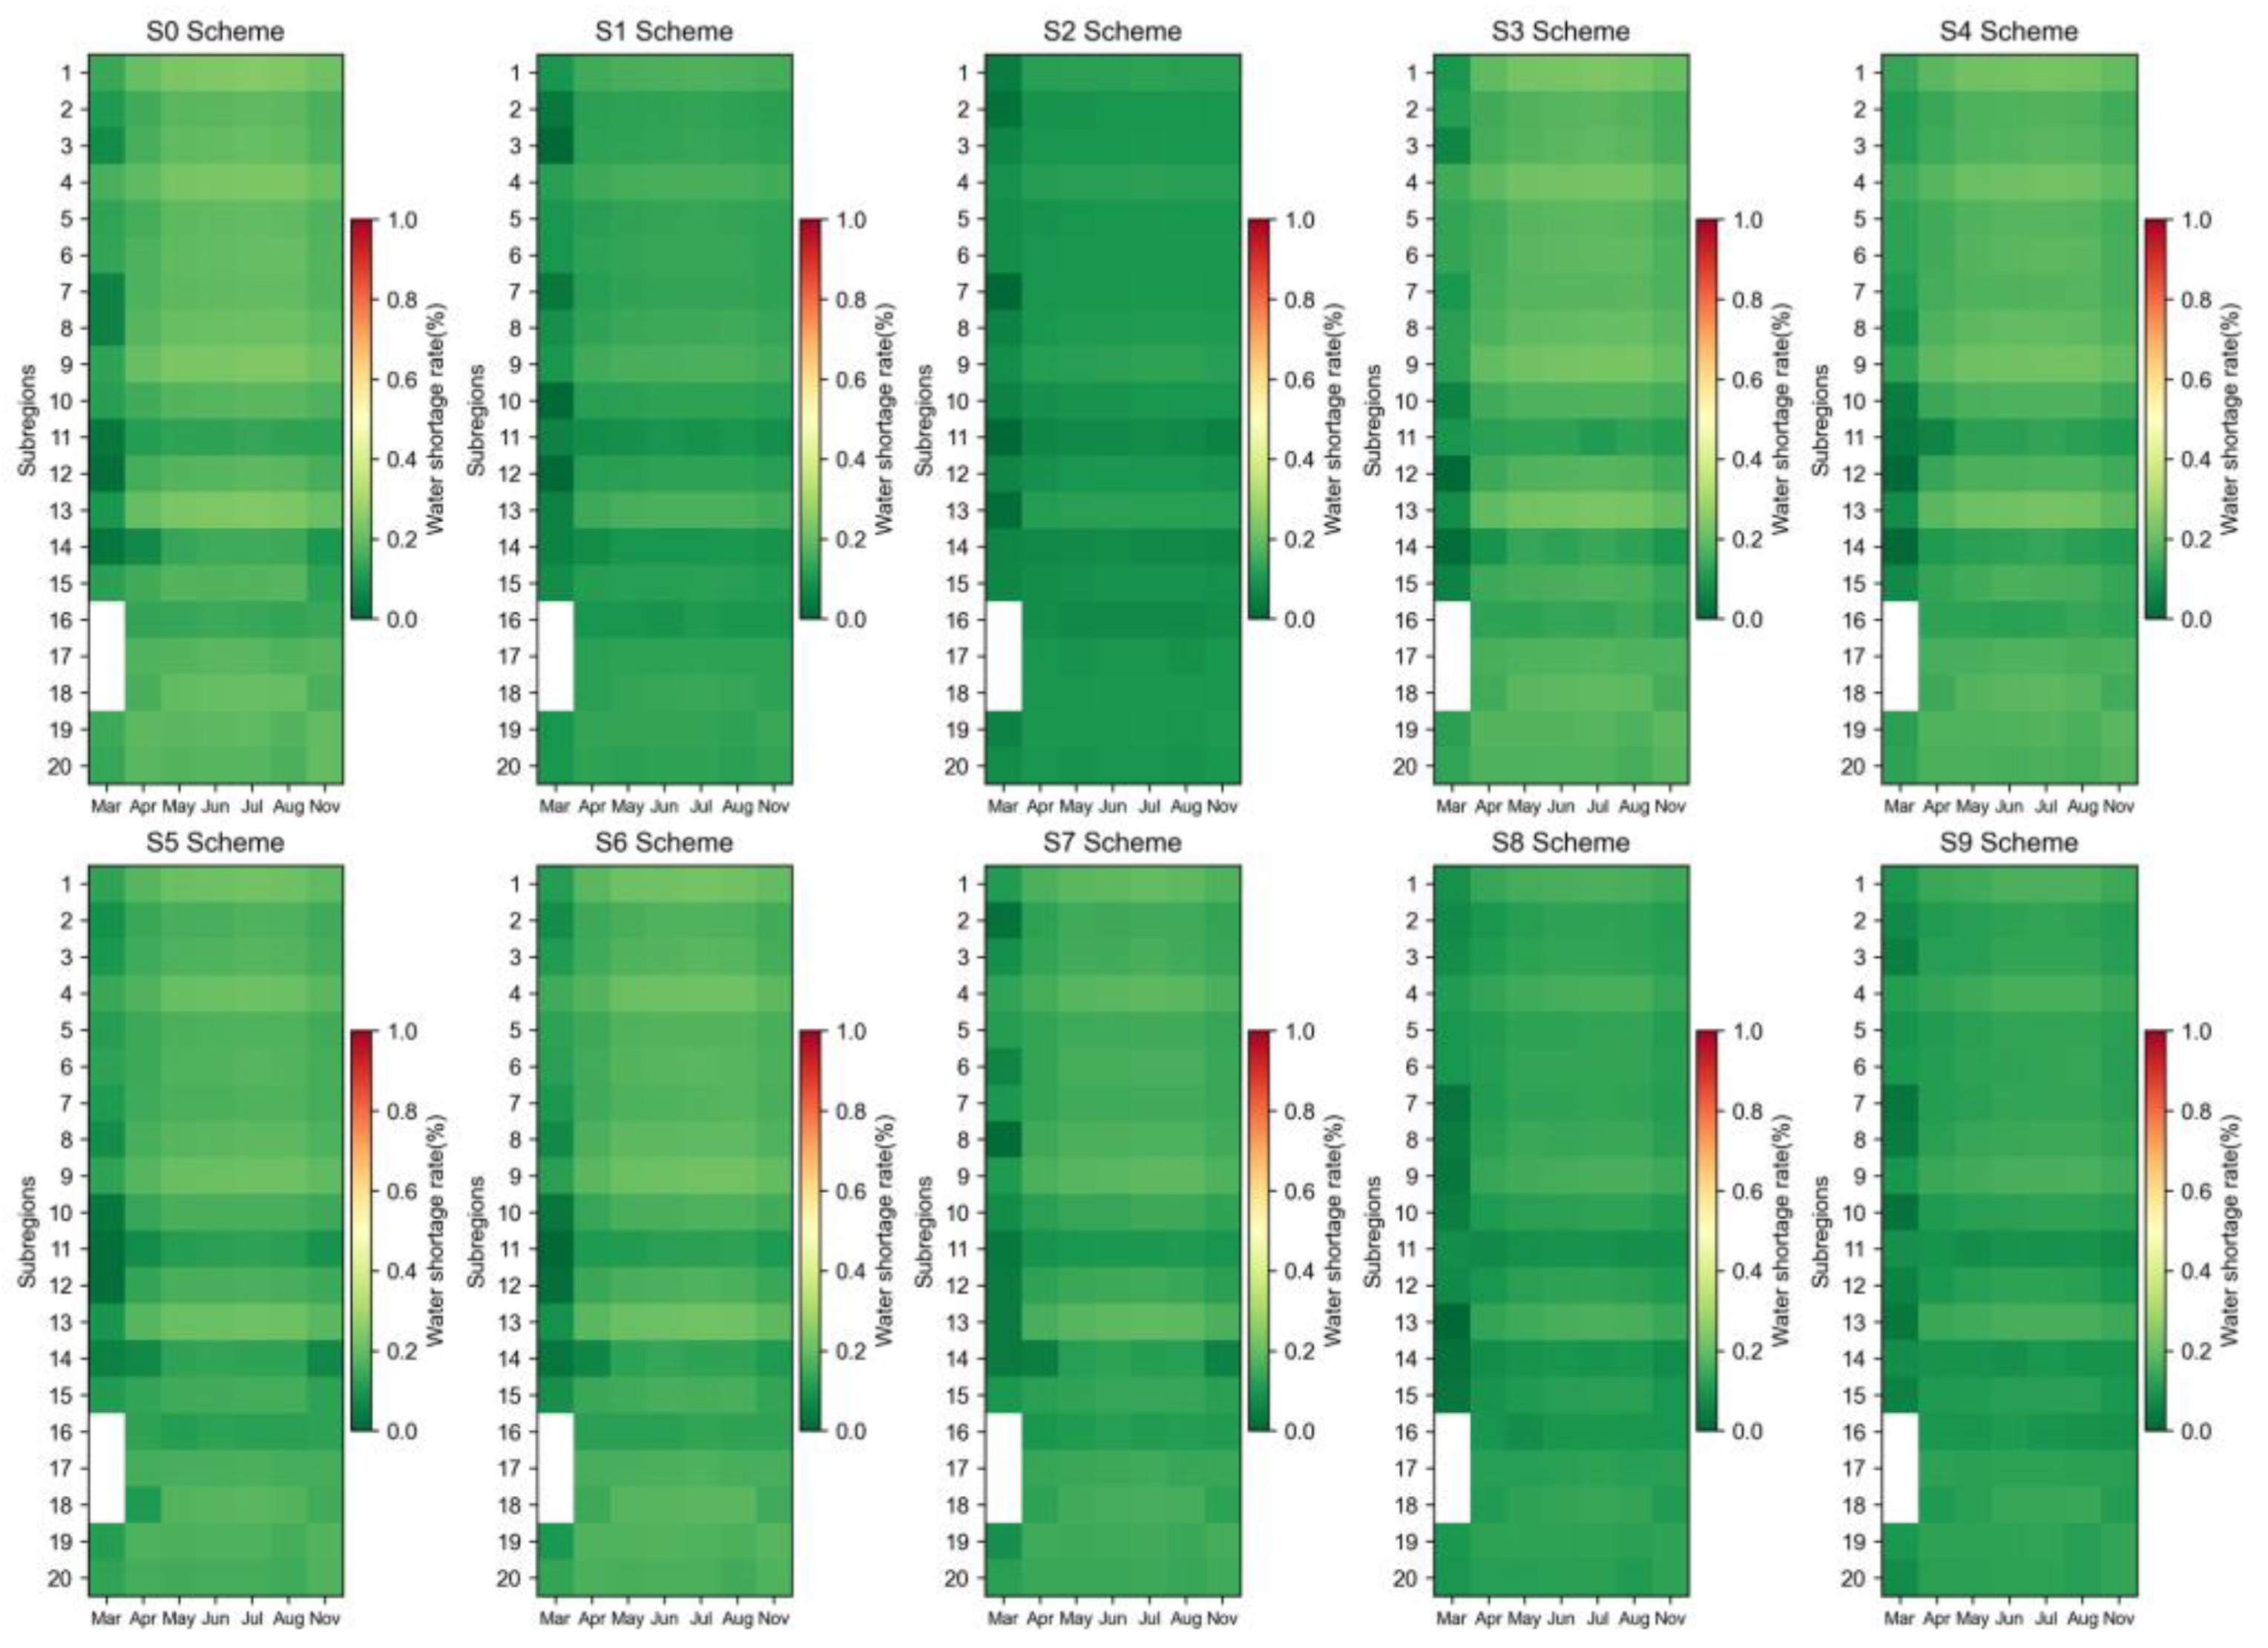
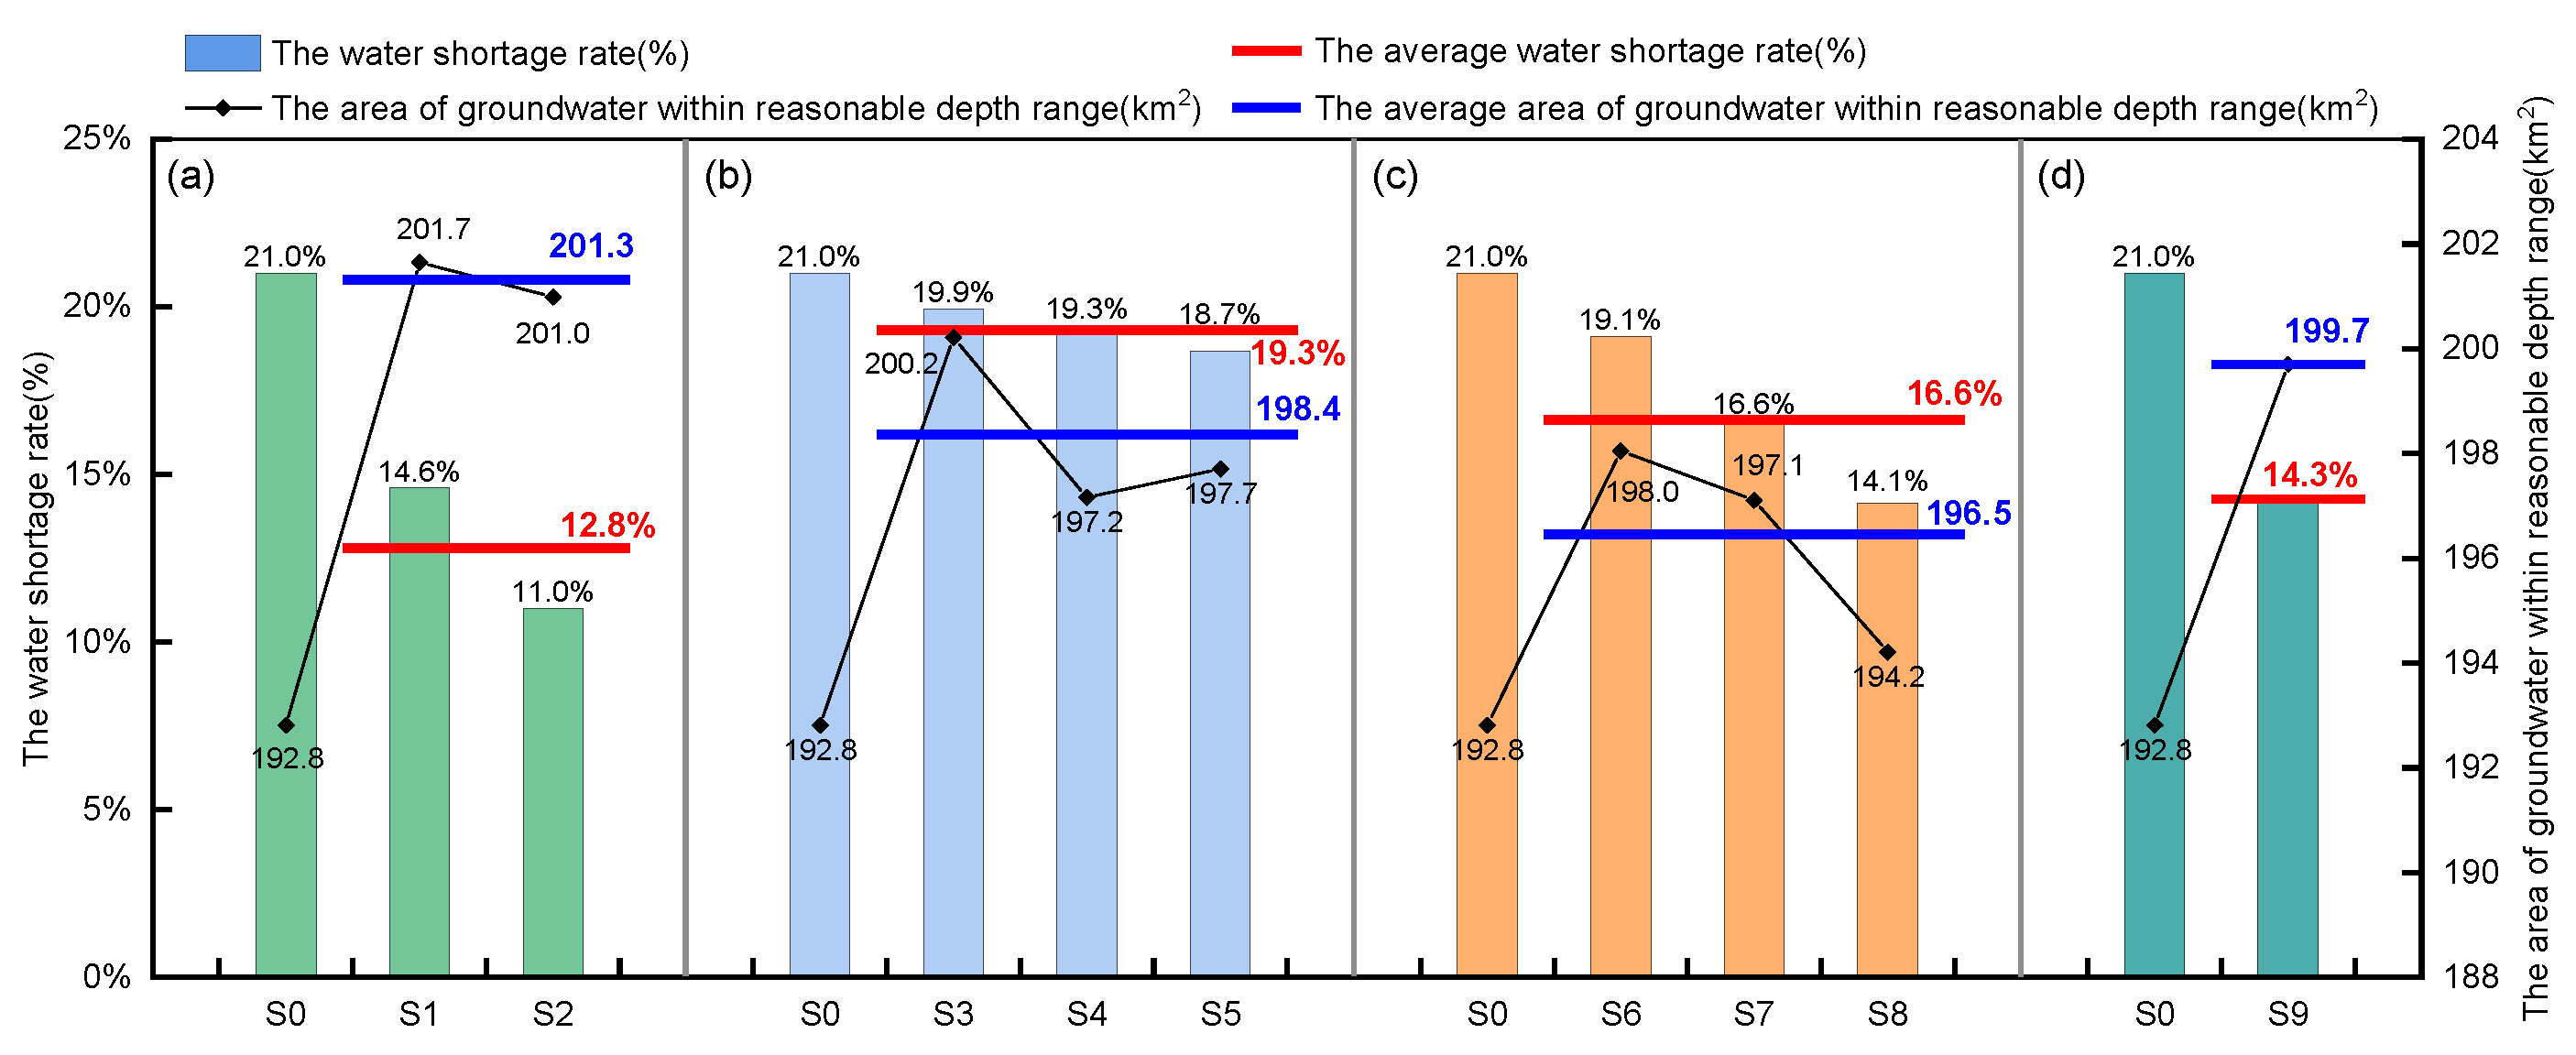
4.1.1. The Impact of Single Water-Saving Schemes on Water Scarcity and Water Shortage Rate

The irrigation-water-shortage volume of the benchmark scheme (S0) was 120.8 million m3, and the corresponding water shortage rate in the study area was 21%. After the implementation of different single water-saving schemes, the water shortage volume decreased to 56.2–113.2 million m3, and the water shortage rate decreased to 11.0–19.9%. The detailed volumes and rates of water shortage for each single-water-saving scheme are shown in Figure 5. Among the single water-saving schemes, S2 had the best water-saving effect, and the irrigation water shortage decreased to 56.2 million m3, which was 53.5% lower than the S0 scheme. The next was S8 with 74.8 million m3 water shortage, and the water shortage was reduced by 38.1% compared with the S0 scheme. The S3 scheme had the least water-saving effect, with the water shortage reduced by only 6.3% compared with S0. The detailed water shortage rates for each subregion and month under different single water-saving schemes are shown in Figure 6. When considering the effects of irrigation water shortage and the water shortage rate only, the ranking of the beneficial effects of different single water-saving schemes was S2 > S8 > S9 > S1 > S7 > S5 > S6 > S4> S3.

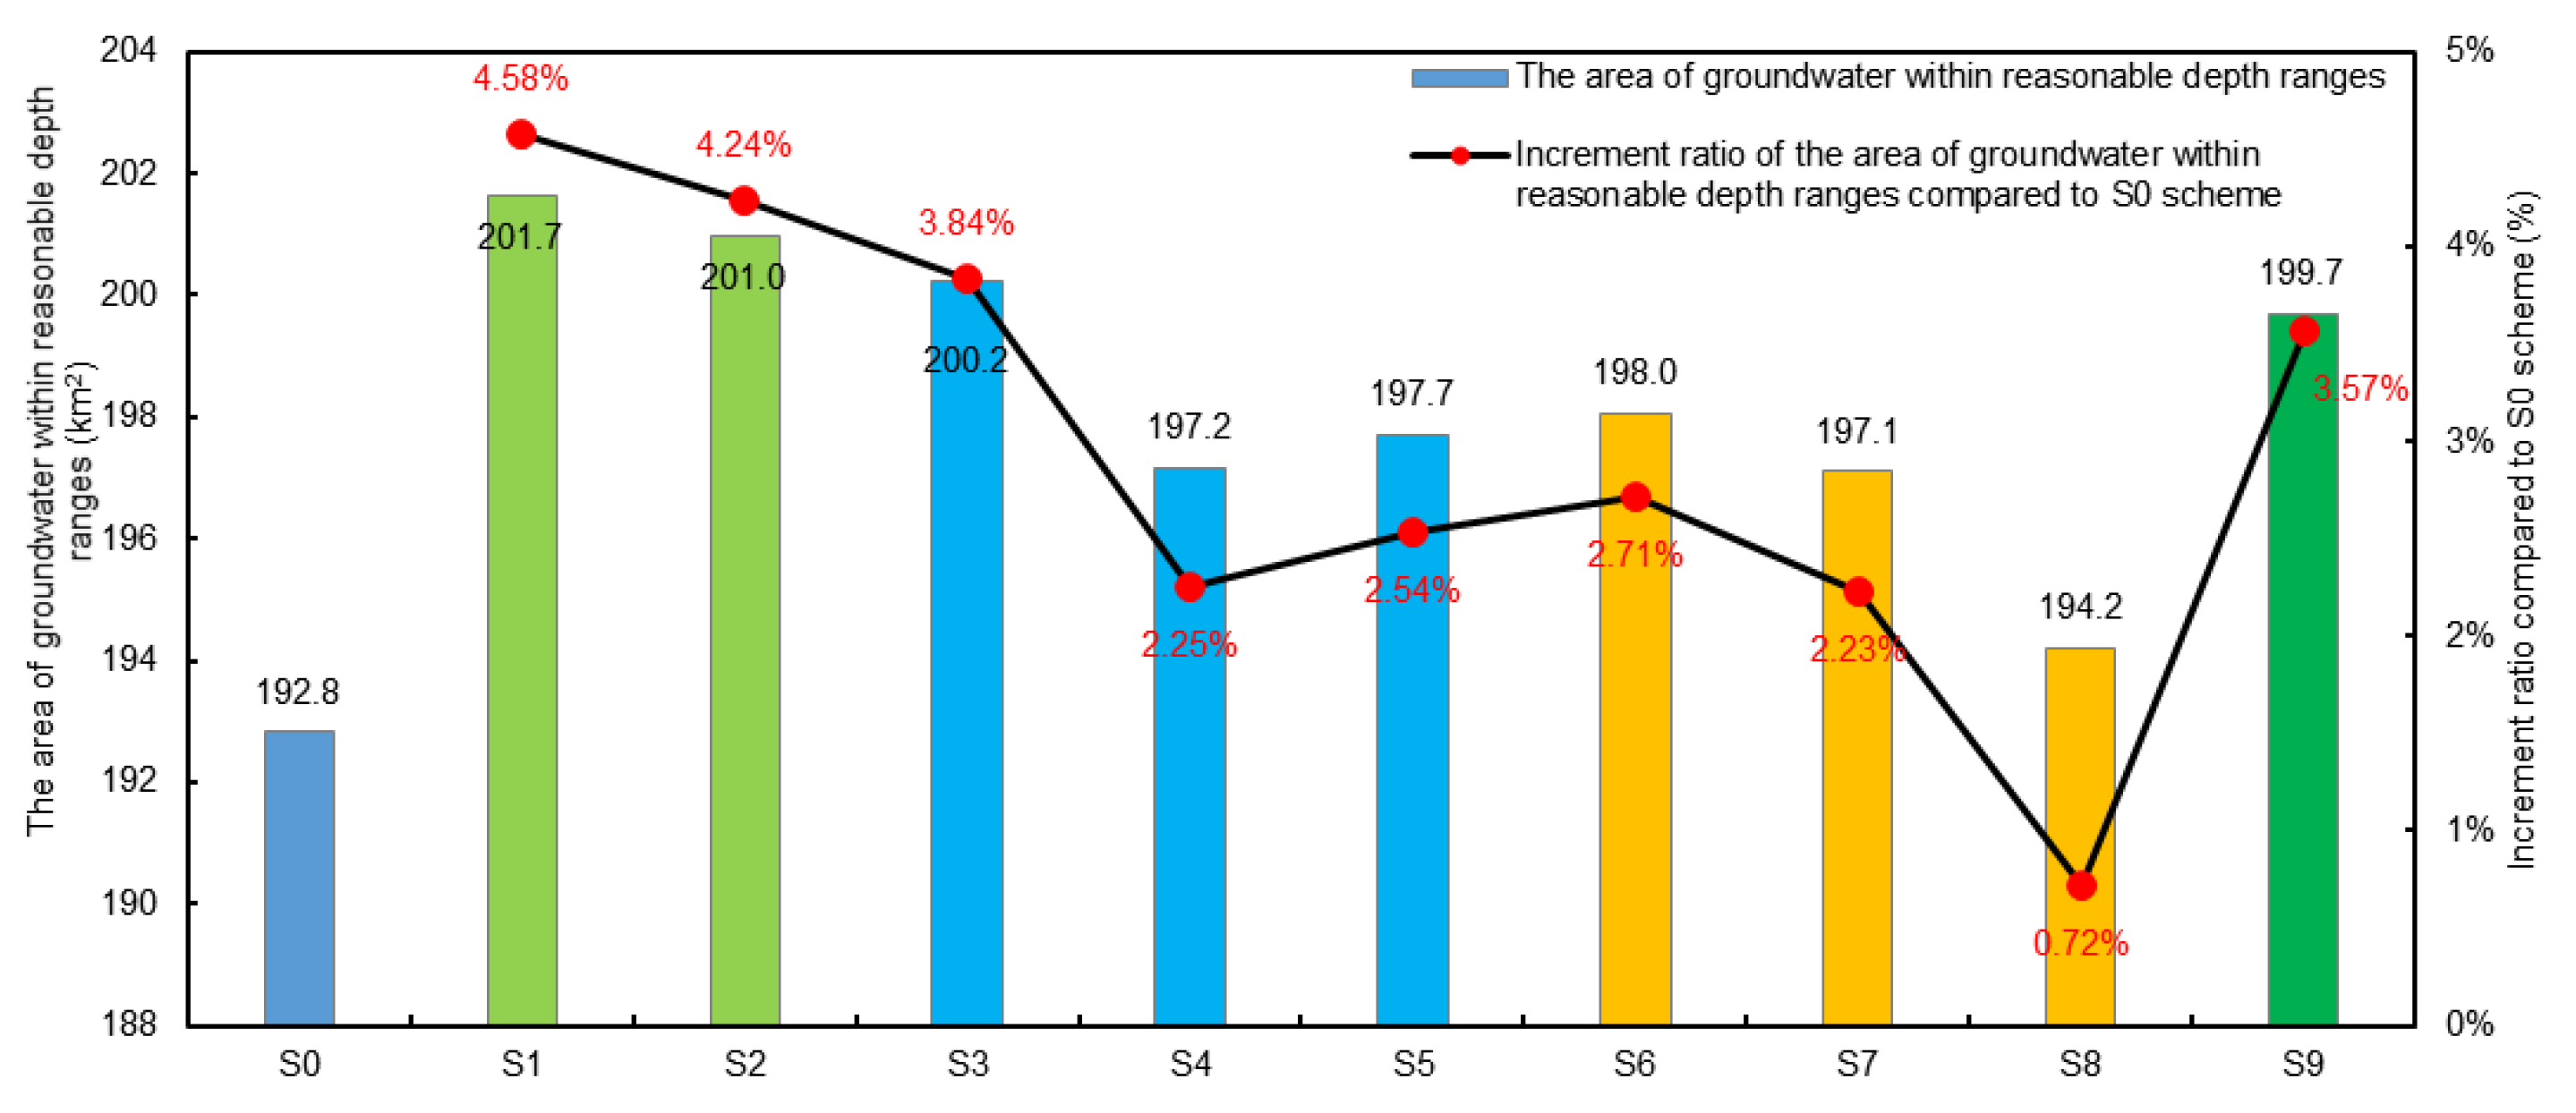
4.1.2. The Response of Changes in Groundwater to Different Single Water-Saving Schemes

Groundwater depth plays an important role in regional ecology, especially in irrigated areas located in arid climates. Too deep groundwater may cause desertification and ecological degradation, while too shallow groundwater may cause secondary salinization and reduce productivity. Therefore, the influence on groundwater should not be ignored when evaluating the effects of water-saving. The change of groundwater level in the irrigation area is a highly intricate process, influenced by alterations in irrigation water and the degree of water saving. We adopted a combination of water resources allocation and groundwater models to describe more accurately the changes in the groundwater under different degrees of water-saving.
The results showed that the average groundwater depth in the study area did not change significantly under different single water-saving schemes (S0–S9). However, compared with the S0 scheme, the acreage with reasonable groundwater depth increased to some extent (as shown in Figure 7). Among the schemes, the planting structure adjustment schemes (S1–S2) had the best effect on the regulation of groundwater depth, and the acreage with reasonable groundwater depth increased by 4.24–4.58%. Increasing the area of promoted efficient water-saving irrigation (S3–S5) and controlled irrigation of rice (S9) had middling effects on the regulation of groundwater depth, with the acreage with reasonable groundwater depth increasing by 2.25%–3.84% and 3.57%. The effect of improving the water utilization coefficient of the channel (S6–S8) was relatively small, with the acreage only increasing by 0.72–2.71%. When considering the groundwater depth effect only, the ranking of the beneficial effects of different single water-saving schemes was S1 > S2 > S3 > S9 > S6 > S5 > S4 > S7 > S8.

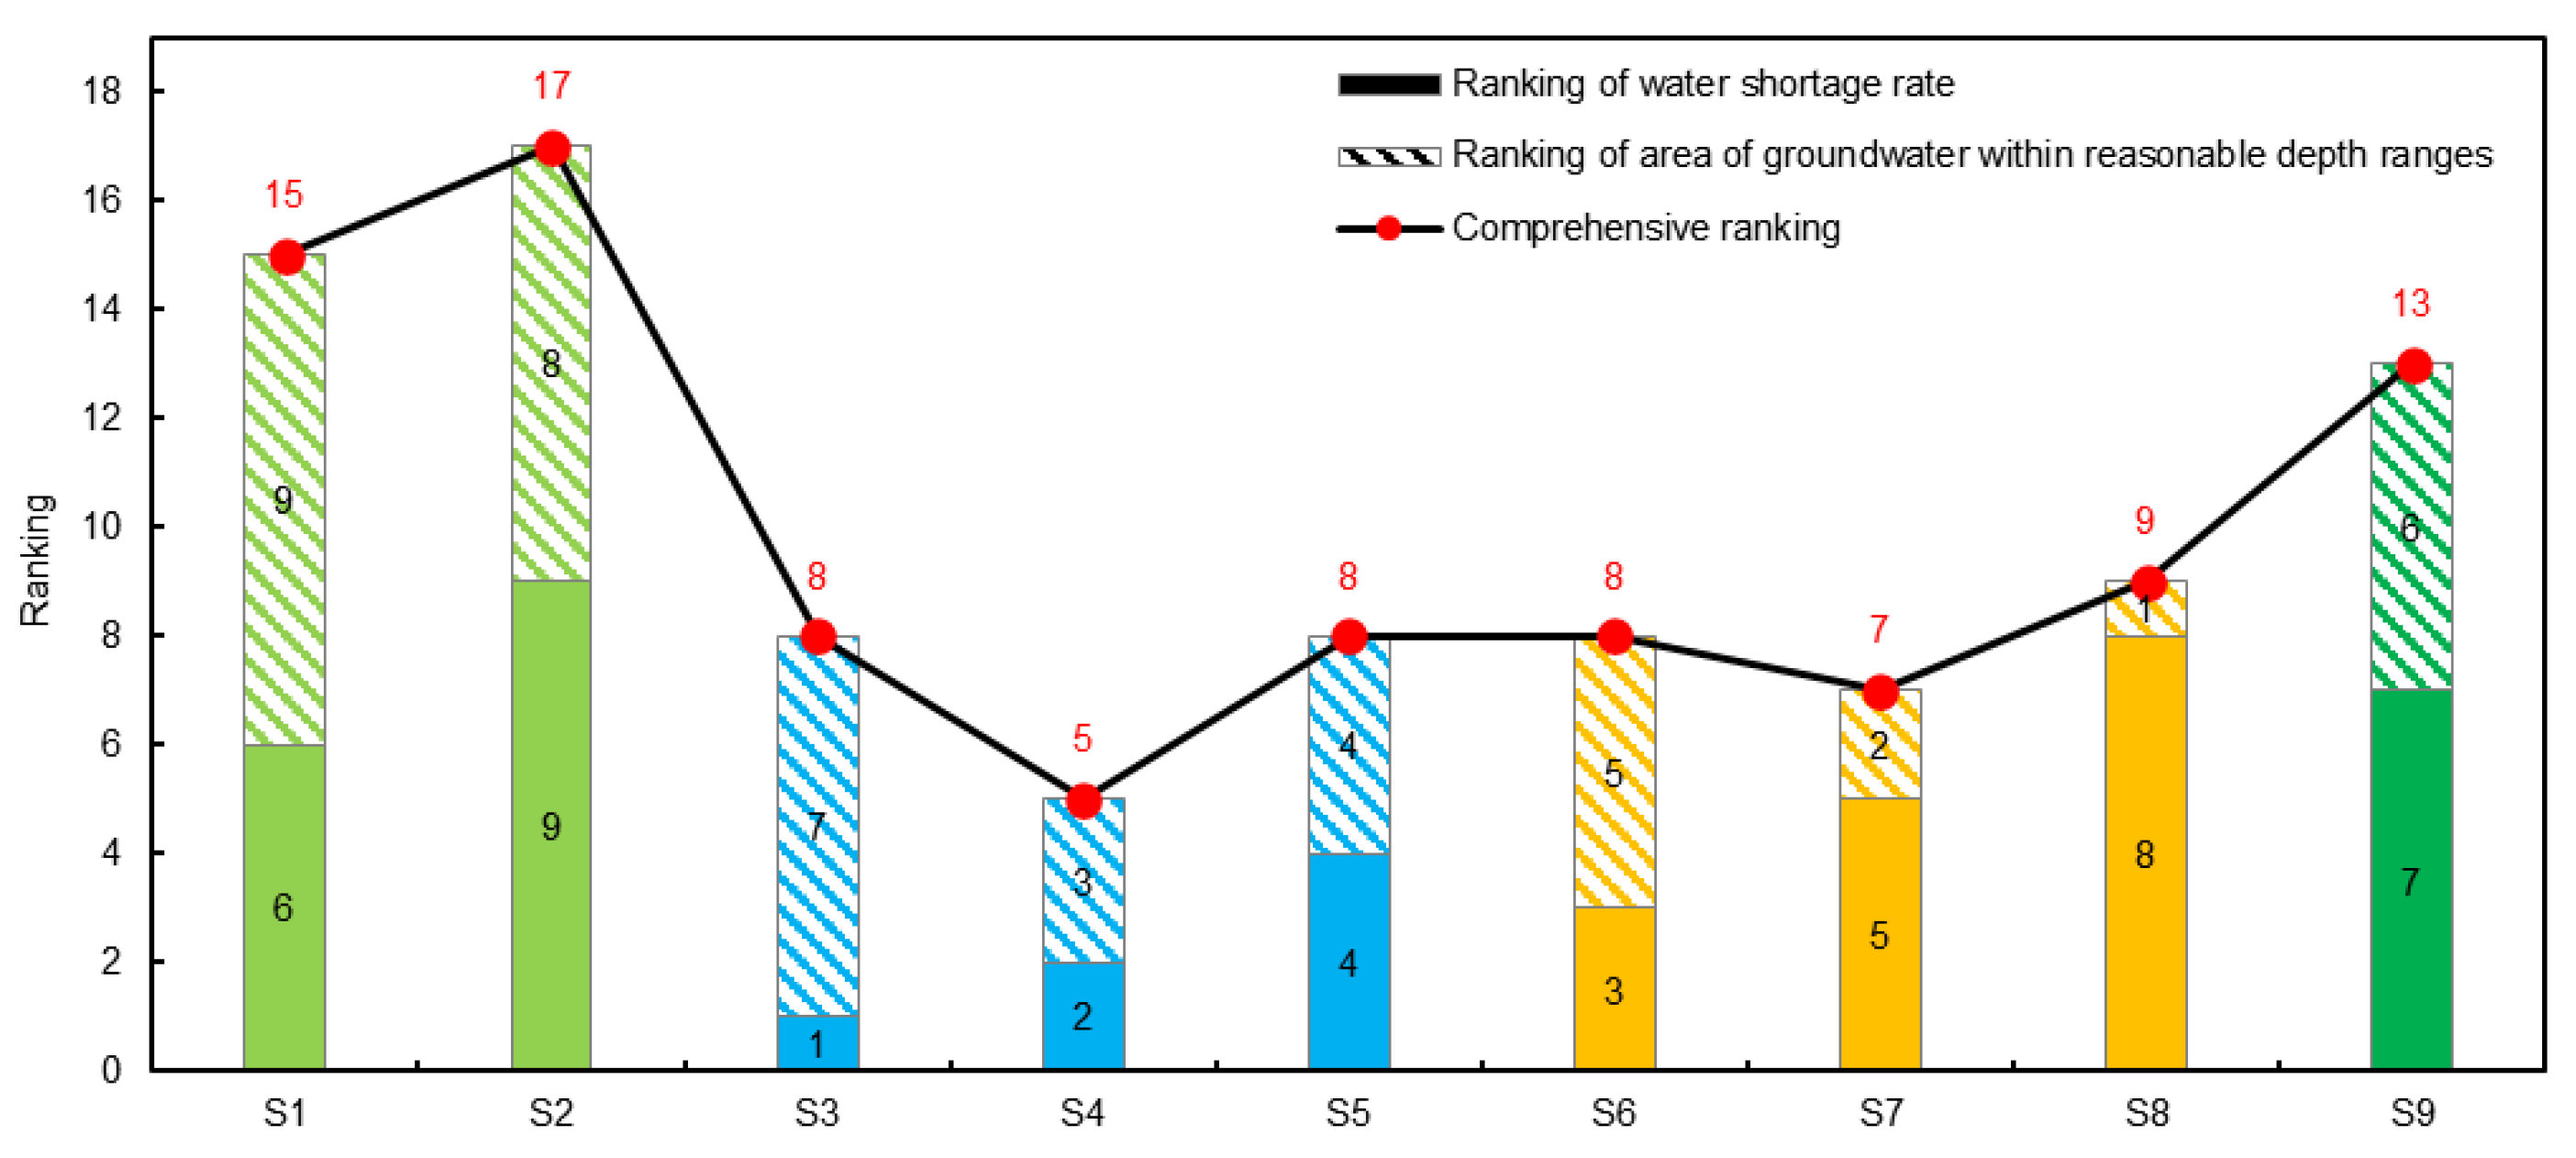
4.1.3. The Comprehensive Evaluation of the Effect of Single Water-Saving Schemes

When evaluating the effects of water saving, it is crucial to consider both the groundwater and the volume of water saved, rather than focusing solely on one aspect. Therefore, this study employed a comprehensive ranking methodology to effectively evaluate the single water-saving schemes. Specifically, the water shortage rates of nine single schemes (S1–S9) were ranked from the largest to the smallest and then, their ranking levels were set from 1 to 9. The acreages with reasonable groundwater depth in the nine single schemes (S1–S9) were ranked from the smallest to the largest and then, their ranking levels were set from 1 to 9. These two ranking levels were added to generate a comprehensive ranking level. A higher value in the comprehensive ranking level indicated a better synthesis of water shortage rate and groundwater (Figure 8). Among the nine single water-saving schemes, the adjustment of planting structure had the best effect (S1–S2) with rankings of 15–17, followed by the controlled irrigation of rice (S9) with a ranking of 13, and channel lining (S6–S8) with rankings of 7–9. The comprehensive ranking of the beneficial effects on both water shortage rate and groundwater was S2 > S1 > S9 > S8 > S3 = S5 = S6 > S7 > S4. The best scheme was S2, which involved replacing 75% of the rice area with corn.

4.2. Estimated of the Effect of Comprehensive Water-Saving Measure Schemes

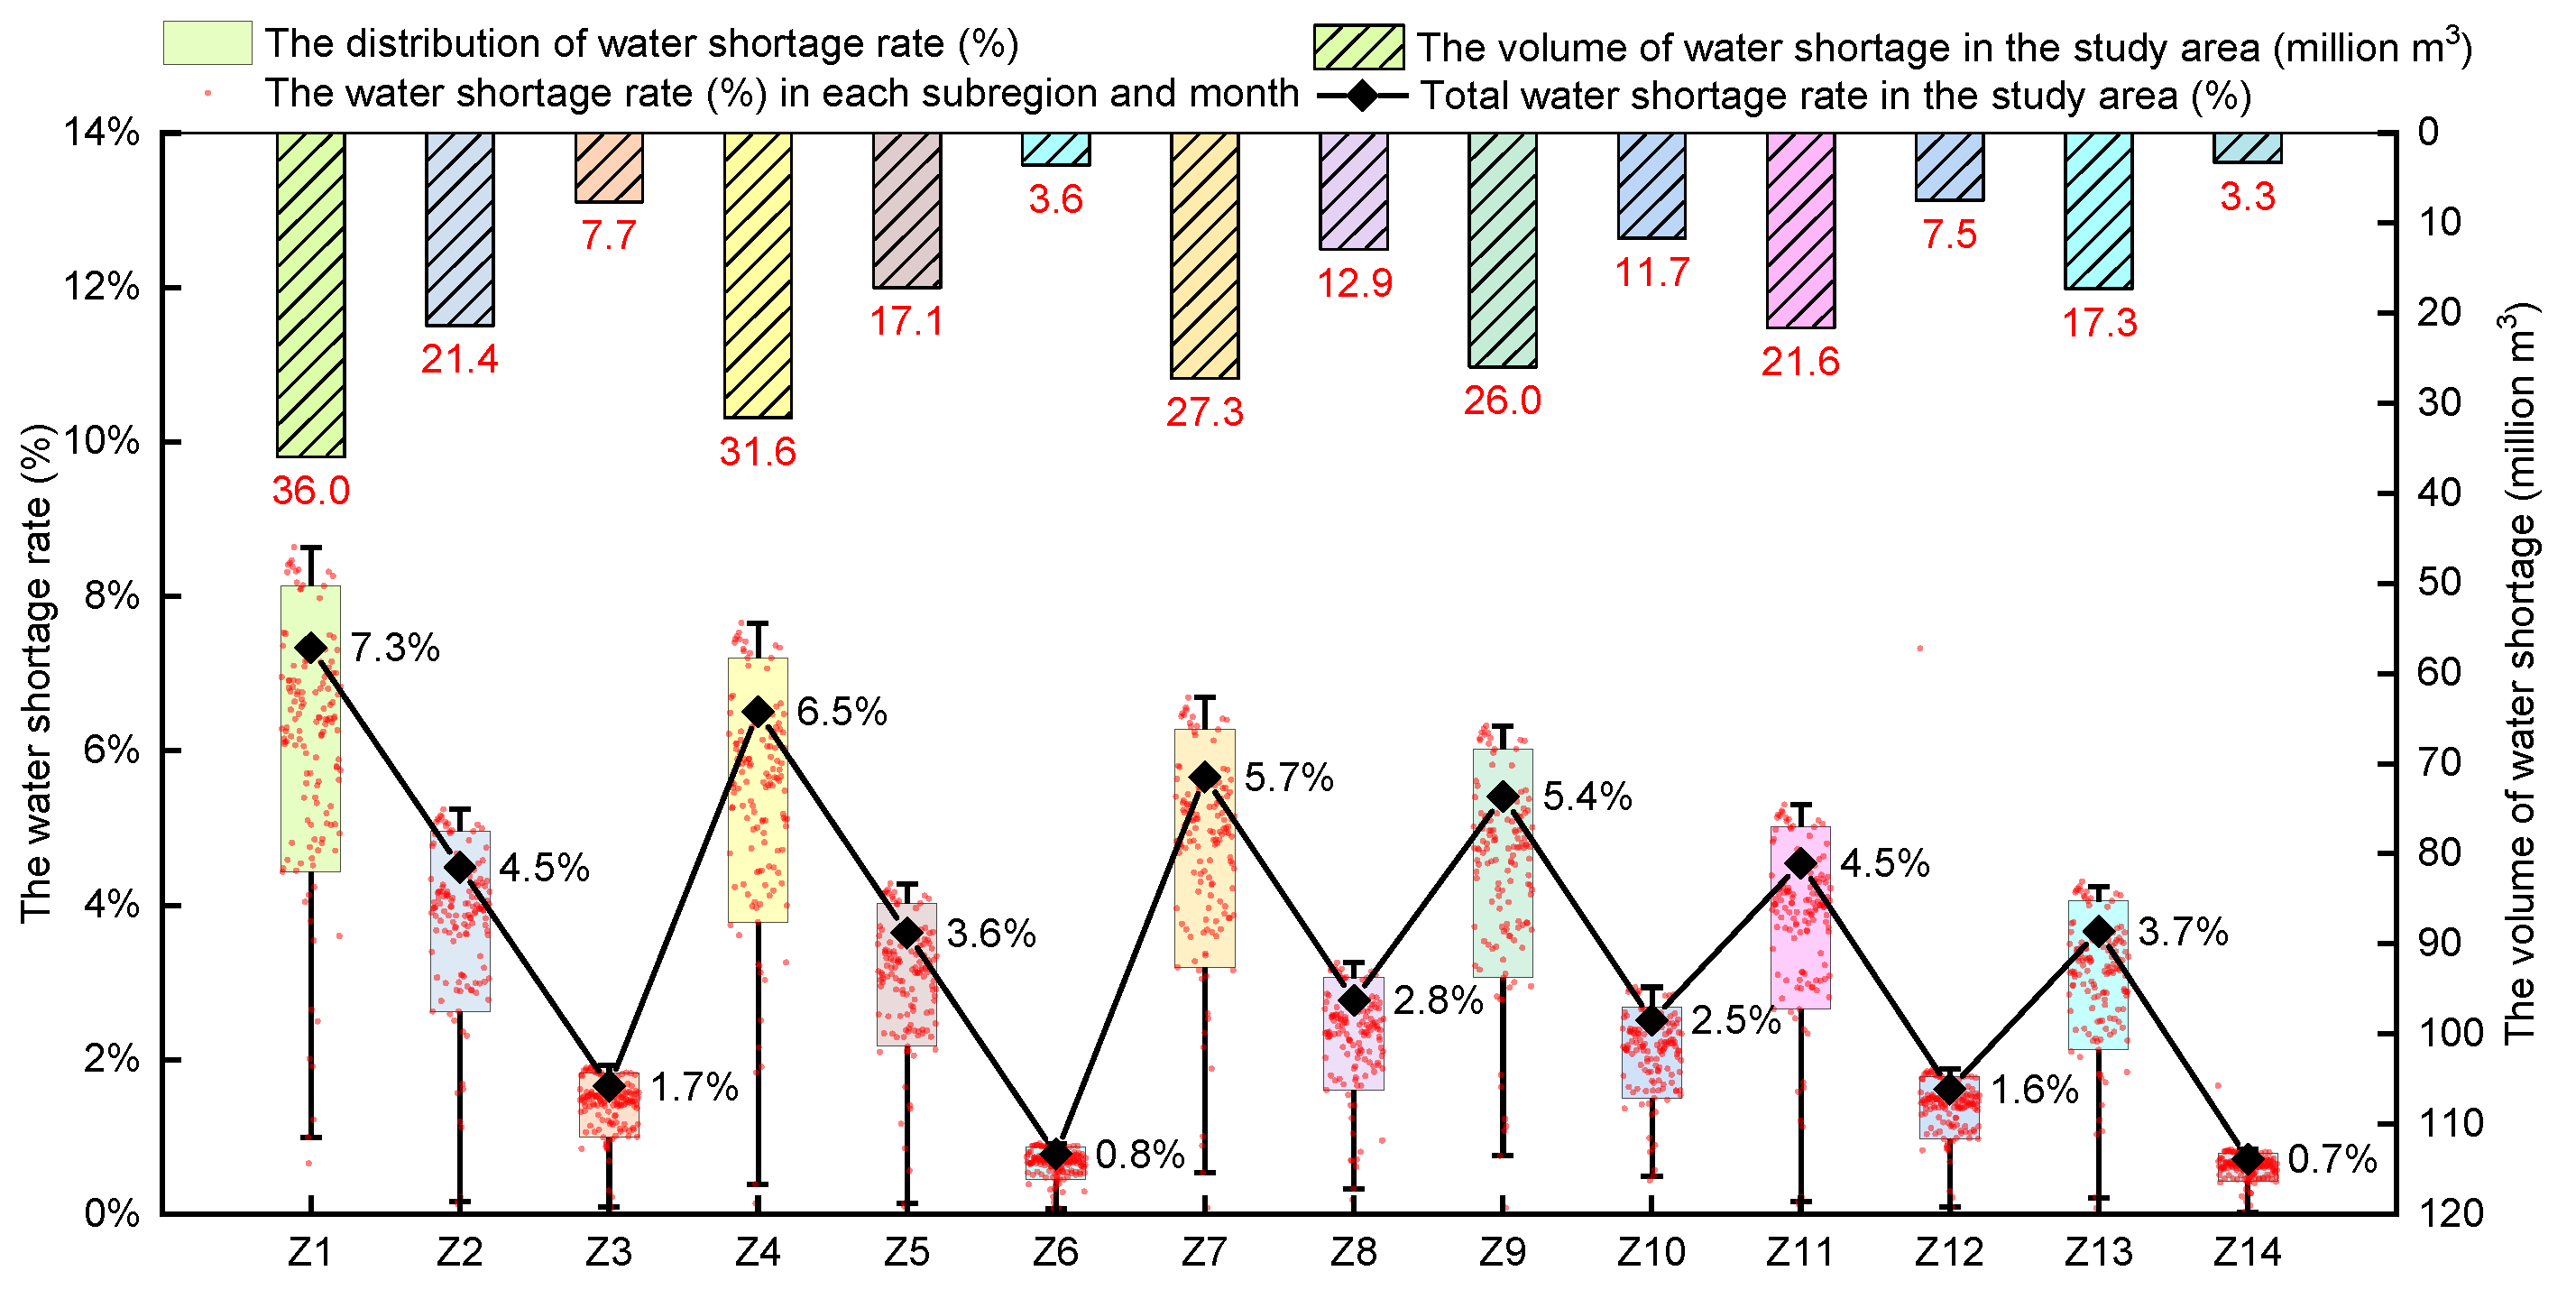
4.2.1. The Impact of Comprehensive Water-Saving Schemes on Water Scarcity and Water Shortage Rate

The comprehensive schemes, combinations of several single schemes (S1–S9), incorporated multiple water-saving measures at different water-saving levels. Due to the interplay of various water-saving measures, the effects of water saving on the changes in amounts of irrigation water saved and groundwater depth became more complex. In the actual process of water saving in the region, multiple water-saving measures at different levels are often implemented together. Hence, comprehensive schemes can better represent the actual water-saving degree in the future. After implementing comprehensive water-saving schemes, irrigation water shortages can be further reduced to alleviate water scarcity issues. The water shortage decreased from 120.8 million m3 in the S0 scheme to 3.3–36.0 million m3 in the Z1–Z14 schemes, and the water shortage rate decreased from 21.0% to 11.0–19.9% (as shown in Figure 9). Among the schemes, Z2 and Z6 had the best water-saving effects on irrigation water shortage and shortage rate. The irrigation water shortages were only 3.3 and 3.6 million m3, with water shortage rates of 0.7% and 0.8%. The next was the Z6 scheme with 7.5 million m3 water shortage, in which the water shortage rate was reduced to 1.6%. The detailed water shortage rates for each subregion and month under different comprehensive water-saving schemes are indicated by the red dots in Figure 9. When considering the effects of irrigation water security and the water shortage rate, the ranking of the different water-saving schemes in terms of effectiveness was Z14 > Z6 > Z12 > Z3 > Z10 > Z8 > Z5 > Z13 > Z2 > Z11 > Z9 > Z7 > Z4 > Z1.

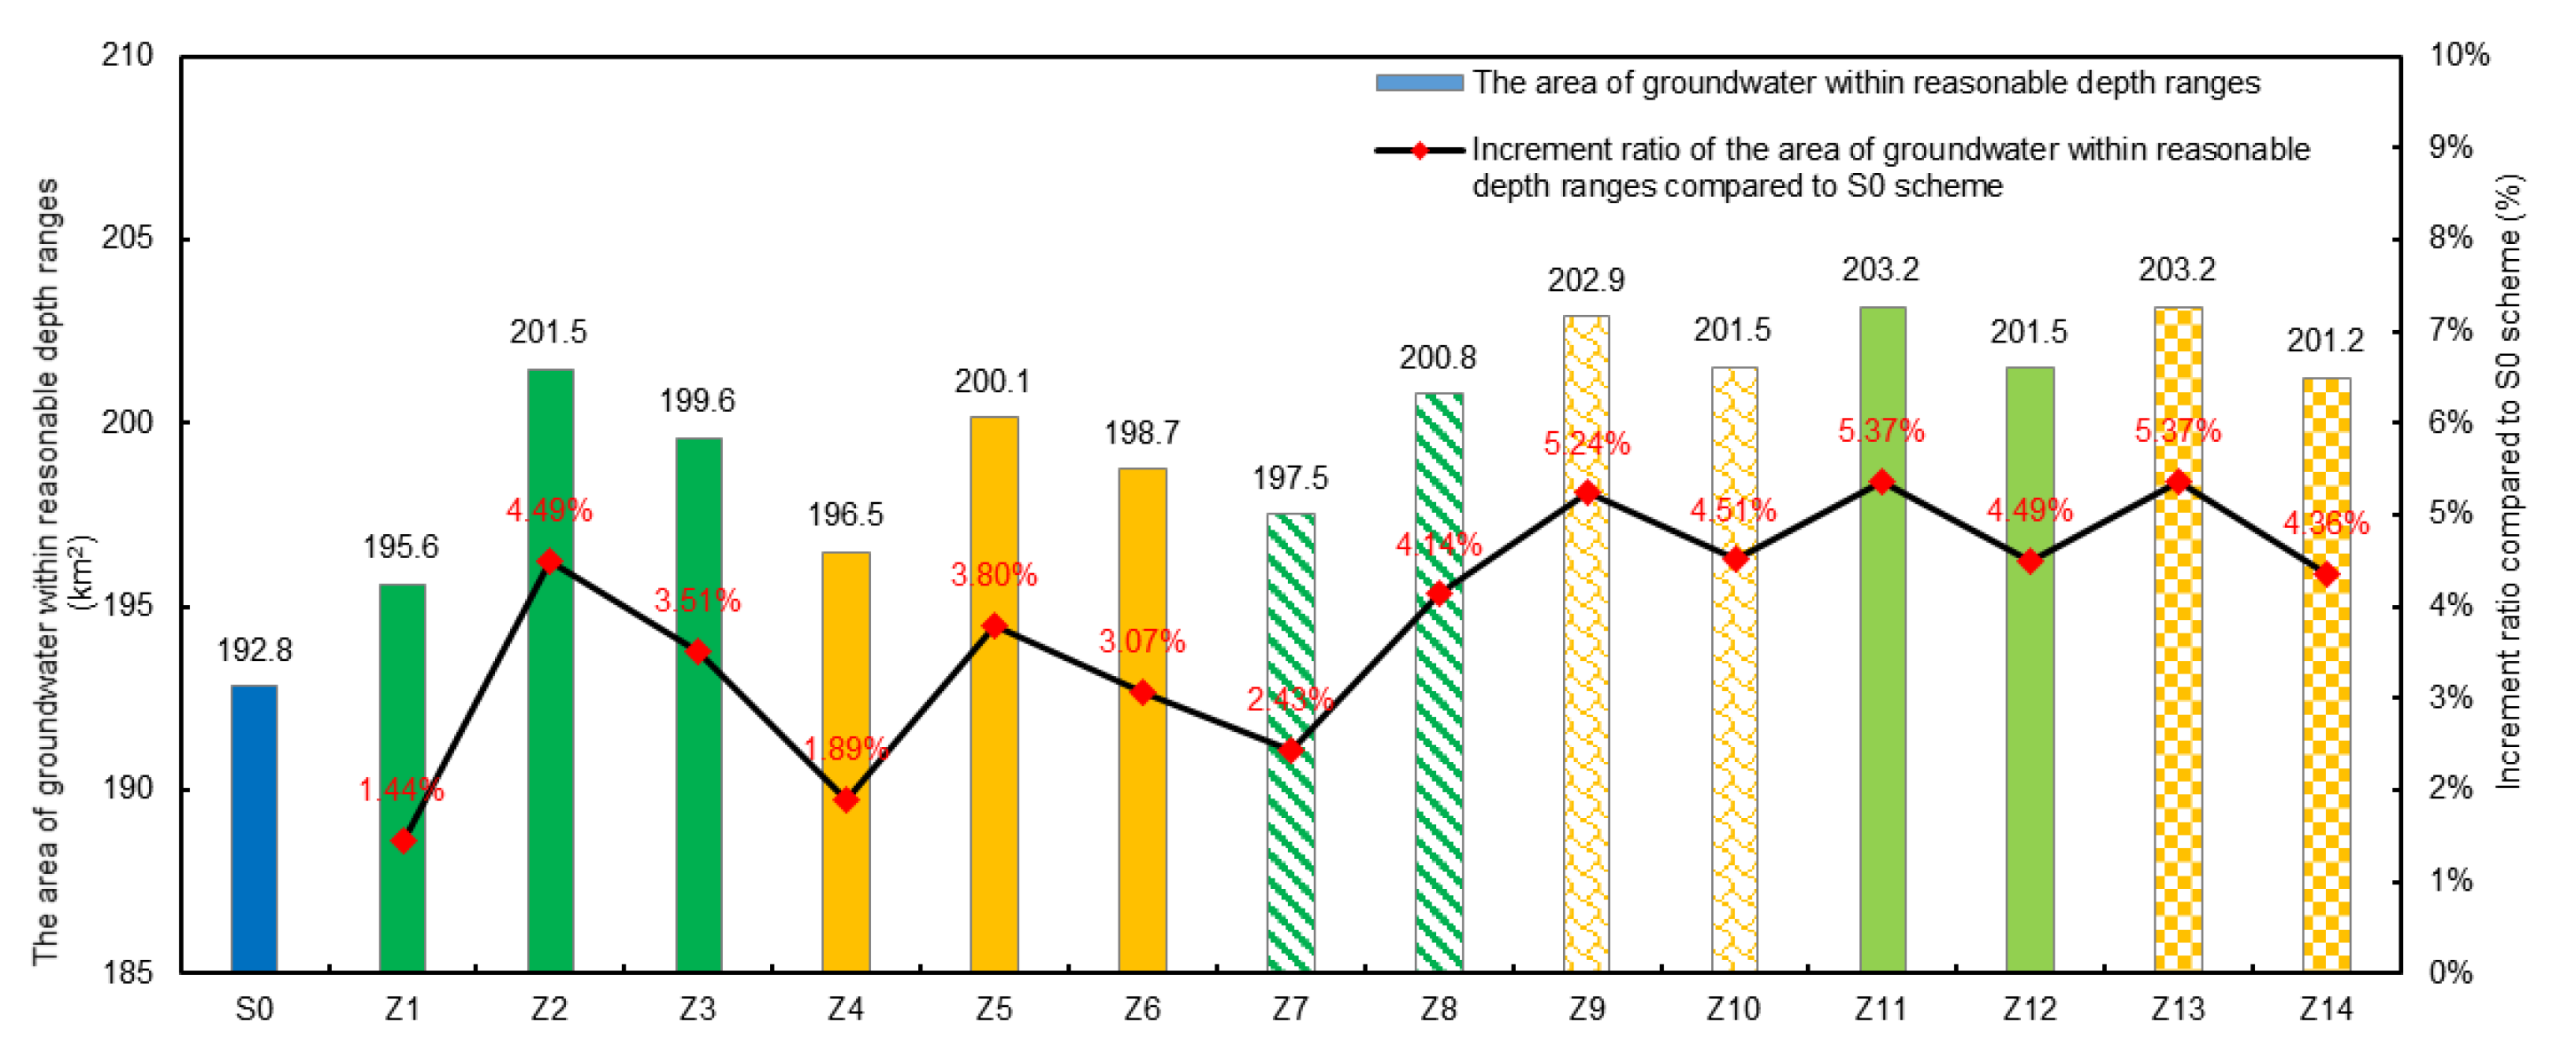
4.2.2. The Response of Changes in Groundwater to Different Comprehensive Water-Saving Schemes

The implementation of comprehensive water-saving schemes has greatly reduced irrigation water demand and improved the utilization efficiency of irrigation water. Simultaneously, it also affects the depth of groundwater. Compared with single water-saving schemes, the influence mechanism of water-saving measures under comprehensive water-saving schemes is more complex. In the model, the acreage where groundwater was located at a reasonable level increased to varying degrees after the implementation of different comprehensive water-saving schemes (as shown in Figure 10). The acreage varying remained between 195.8–203.2 km2, representing a relative increase of 1.44–5.37% compared with S0. Among the schemes, Z11 and Z13 included the largest areas, reaching 203.2 km2. The Z1 scheme had the smallest increase in acreage where groundwater was located at a reasonable level, at 195.6 km2. The ranking of the beneficial effects on groundwater was Z13 = Z11 > Z9 > Z10 > Z12 > Z2 > Z14 > Z8 > Z5 > Z3 > Z6 > Z7 > Z4 > Z1.

4.2.3. The Selection of the Comprehensive Water-Saving Schemes for the Future

Through the evaluation of the impact of various water-saving schemes on water saving and water shortage, it was observed that both the water shortage and the water shortage rate for each comprehensive water-saving measure scheme were relatively small. Except for Z1, Z4, Z7, and Z9, most of the comprehensive water-saving measures resulted in a water shortage of less than 25 m3 and a water shortage rate less than 5%. Considering local allocation of water resources and the actual irrigation process, if the water shortage rate is less than 5%, it can be considered that the irrigation water can meet the needs of crop growth, and agricultural irrigation is acceptable. Therefore, when selecting better water-saving schemes, the scheme with a water shortage rate less than 5% and the maximum acreage where groundwater is located at a reasonable level should be chosen. Among the schemes with a water shortage rate less than 5%, the Z13 scheme can be regarded as a favorable choice for future water-saving measures. It exhibited a mere 3.66% water shortage rate and an increase of 5.37% in acreage where groundwater was located at a reasonable level.

5. Discussion

The sustainable development of irrigation areas not only shoulders the significant responsibility of national food security, but also plays a crucial role in maintaining socio–economic stability. Furthermore, these irrigation areas form an integral part of the “mountain–water–forest–farmland–lake–grass” ecosystem, holding significant responsibilities for the healthy evolution of regional ecology [40]. Especially in arid and semi-arid regions, this situation has led to numerous ecological and environmental issues in the quest for economic development. As various water-saving measures have been promoted without sufficient assessment of regional adaptability, many ecological and environmental problems closely related to irrigation have become increasingly evident. With the escalation and implementation of diverse water-saving measures, significant progress has been made in improving the efficiency of agricultural irrigation water resource utilization, conserving water, and mitigating water shortages [41,42]. However, due to the lack of assessment of the regional adaptability of water-saving measures, many new ecological and environmental issues closely related to irrigation are becoming increasingly prominent.
Ningxia, located in the arid and semi-arid region of northwest China, is characterized by scarce water resources and a fragile ecological environment. Moreover, as the first pilot province for the construction of a water-saving society in China, water saving has reached the forefront in industry, agriculture, and daily life. However, given the current trend towards the upper limit of water usage, Ningxia is facing a severe water resource shortage. The shortage is particularly noticeable in agricultural irrigation, a major consumer of water. Water conservation has thus become an inevitable trend in agricultural development. Under the premise of sustainable development and maintaining ecological health, groundwater, as a key determinant of the ecological environment, is crucial for the well-being of irrigation areas [43]. The challenge lies in ensuring that the groundwater depth in irrigated areas is controlled within a reasonable range amidst limited water resources. Additionally, the selection and promotion of water-saving measures in water resource development and utilization are of paramount importance.
Numerous studies have examined the utilization and conservation of irrigation water resources from various perspectives, with a focus on aspects such as meeting irrigation water demand, ensuring fairness in water use across different regions, and matching water and land resources. These studies have significantly promoted the rational use of water resources in irrigated areas. For instance, Nazoumou et al. [26] used area and water allocation models and simulated optimization techniques to optimally distribute land and water resources among different crops in different allocation units. Smout et al. [44] employed a multi-level analysis method to optimize the allocation of irrigation water resources in different regions, aiming for the lowest deficit in irrigation water use. Karimov et al. [45] assessed the benefits of different water-saving schemes by analyzing the water-saving potential in the Syr Darya River basin in Central Asia, using accounting methods, and pointed out future directions for water conservation.
However, there has been relatively little research focusing on the impact of irrigation water resource allocation and water-saving levels on sustainable ecological development. Building on previous studies, our research takes into consideration the impact of irrigation and different levels of water saving on groundwater levels. By incorporating reasonable groundwater levels into the allocation of irrigation water resources, this study can effectively guide water resource allocation and water-saving levels in different regions based on their groundwater levels.
Among the four water-saving strategies—adjustment of planting structure, efficient water-saving irrigation, channel lining, and controlled irrigation of rice—the latter two show the most comprehensive benefits. As depicted by the red line in Figure 11, the average water shortage rates for these strategies were 12.8% and 14.3% respectively. Furthermore, the average areas maintaining an optimal groundwater depth, represented by the blue line in Figure 11, were 201.7 km2 and 199.7 km2, respectively. These figures indicate a superior performance compared with the other two strategies, namely efficient water-saving irrigation and channel lining. In the practical application of these water-saving measures, it is worth noting that non-engineering methods, such as adjusting planting structures and implementing controlled irrigation of rice, eliminate the need for large-scale civil engineering projects. This results in lower demand for manpower, material resources, and financial investment. However, these non-engineering measures have a significant social aspect, aligning them more closely with social activities. It is crucial to consider this social dimension when implementing these measures. Mandatory regulations without consideration of their potential negative impact on the public, especially farmers, should be avoided. Instead, it is recommended to enhance regulation of food markets and reform water rights to ensure a balanced and sustainable implementation of these water-saving measures.
However, it is important to note certain limitations in this study. The selection of water-saving measures primarily considers indicators of sustainable development, such as water security and groundwater level in irrigated areas. Comprehensive benefits pertaining to the input–output of water-saving relationships within the water-saving process have not been taken into account. Moreover, the scope of this study is relatively narrow. The generalized boundary for groundwater level may not adequately capture the complexity of regional water-cycle interactions. As a result, there could be some uncertainty when simulating changes in groundwater under different water-saving schemes. Despite this, this study effectively demonstrates the relative changes in groundwater, providing valuable insights into the efficacy of different water-saving measures.

6. Conclusions

The current situation of water saving in irrigated areas is complex and challenging. While these measures can aid in preserving water resources, improper implementation may lead to ecological and environmental issues. To tackle these concerns, this paper integrates the “nature–society” water cycle concept and examines 24 water-saving schemes, encompassing both engineering and non-engineering measures, within the Ningxia region. The study simulated and evaluated the effects of multiple water-saving measures on water scarcity and groundwater levels in Helan County. The main results were as follows:
Non-engineering water-saving measures had better benefits compared with engineering. Among the single water-saving schemes, the S2 scheme exhibited the most effective water-saving results, with a lower water shortage rate of 14.6%, and the area with reasonable groundwater depth extended to a higher acreage of 201.7 km2. The ranking of the effects of the nine single water-saving measure schemes was as follows: S2 > S1 > S9 > S8 > S3 = S5 = S6 > S7 > S4. This ranking can provide valuable guidance for the development of water-saving measures and policies.
Regarding the comprehensive water-saving schemes, the Z13 scheme represents a favorable choice for future water-saving efforts. It boasted a mere 3.66% water shortage rate and a 5.37% increase in acreage with reasonable groundwater depth. The Z13 scheme encompassed four water-saving measures: replacing 75% of the rice area with corn, controlled irrigation for the rice not exceeding 11.85 thousand m3/ha, adopting highly efficient water-saving irrigation covering 90% of the pump-diverted water irrigation region and 40% of the channel-diverted water irrigation region, and maintaining the channel’s water utilization coefficient at 0.62.
This study aimed to combine the optimization of irrigation water resource allocation with various water-saving scenarios. The proposed method of water resource optimization and water-saving degree analysis considers both crop water requirements and ecological indicators (groundwater levels). This approach is particularly applicable to studies related to the allocation of irrigation water resources in areas where groundwater issues are prominent, and it can also be used in water resource management. The conclusions and research methodologies put forth in this study could offer valuable insights for the development of water-saving measures, contributing to the healthy and sustainable development of irrigated areas.

Author Contributions

Conceptualization, S.L. and C.C.; methodology, S.L.; software, C.C.; validation, G.Y., H.W. and X.J.; formal analysis, Z.P.; investigation, Z.P.; resources, X.J.; data curation, S.L.; writing—original draft preparation, S.L.; writing—review and editing, G.Y.; visualization, S.L.; supervision, H.W.; project administration, H.W.; funding acquisition, G.Y. All authors have read and agreed to the published version of the manuscript.

Funding

This research was funded by the National Key Research and Development Program (2021YFD1900600), the Key Research and Development Plan of Ningxia Hui Autonomous Region (2018BBF02022), the research project on the irrigation map of the water saving and salt controlling and production improvement in the Qingtongxia irrigation district (SKL-IOW-2023TC2307), and Ningxia Natural Science Foundation project (2022AAC03725).

Data Availability Statement

The data presented in this study are available upon request from the corresponding author. The data are not publicly available due to privacy or other restrictions.

Acknowledgments

We thank our colleagues for their insightful comments on an earlier version of this manuscript.

Conflicts of Interest

The authors declare no conflicts of interest.

References

  1. Zhao, D.; Chen, X.; Han, Y.; Zhao, Y.; Men, X. Study on the Matching Method of Agricultural Water and Land Resources from the Perspective of Total Water Footprint. Water 2022, 14, 1120. [Google Scholar] [CrossRef]
  2. Geng, Q.; Liu, H.; He, X.; Tian, Z. Integrating Blue and Greens Water to Identify Matching Characteristics of Agricultural Water and Land Resources in China. Water 2022, 14, 685. [Google Scholar] [CrossRef]
  3. Yang, G.; Li, S.; Wang, H.; Wang, L. Study on agricultural cultivation development layout based on the matching characteristic of water and land resources in North China Plain. Agric. Water Manag. 2022, 259, 107272. [Google Scholar] [CrossRef]
  4. Cai, X.; Rosengrant, M.W. Water scarcity and food security: Alternative futures for the 21st century. Water Sci. Technol. 2001, 43, 61–70. [Google Scholar] [CrossRef]
  5. Peterson, C.A.; Pittelkow, C.M.; Lundy, M.E. Targeted irrigation expands scope for winter cereal production in water-limited areas of California’s San Joaquin Valley. Agric. Syst. 2023, 210, 103696. [Google Scholar] [CrossRef]
  6. Li, J.; Fei, L.; Li, S.; Xue, C.; Shi, Z.; Hinkelmann, R. Development of “water-suitable” agriculture based on a statistical analysis of factors affecting irrigation water demand. Sci. Total Environ. 2020, 744, 140986. [Google Scholar] [CrossRef]
  7. Shen, Y.; Li, S.; Chen, Y.; Qi, Y.; Zhang, S. Estimation of regional irrigation water requirement and water supply risk in the arid region of Northwestern China 1989–2010. Agric. Water Manag. 2013, 128, 55–64. [Google Scholar] [CrossRef]
  8. Hall, A.W. Priorities for irrigated agriculture. Agric. Water Manag. 1999, 40, 25–29. [Google Scholar] [CrossRef]
  9. Bortolini, L.; Maucieri, C.; Borin, M. A Tool for the Evaluation of Irrigation Water Quality in the Arid and Semi-Arid Regions. Agronomy 2018, 8, 23. [Google Scholar] [CrossRef]
  10. Xu, W.; Li, M. Water supply and water allocation strategy in the arid US West: Evidence from the Eastern Snake River Plain Aquifer. Reg. Environ. Change 2015, 16, 893–906. [Google Scholar] [CrossRef]
  11. Peng, J.; Liu, T.; Chen, J.; Li, Z.; Ling, Y.; De Wulf, A.; De Maeyer, P. The conflicts of agricultural water supply and demand under climate change in a typical arid land watershed of Central Asia. J. Hydrol. Reg. Stud. 2023, 47, 101384. [Google Scholar] [CrossRef]
  12. Pasternak, D.; Woltering, L.; Ndjeunga, J.; Wani, S.P. Innovative and sustainable approaches for agricultural water management in the drylands of the developing world. Acta Hortic. 2011, 922, 121–131. [Google Scholar] [CrossRef]
  13. Li, D.; Zhang, H.; Xu, E. Spatiotemporal Changes in the Geographic Imbalances between Crop Production and Farmland-Water Resources in China. Agronomy 2022, 12, 1111. [Google Scholar] [CrossRef]
  14. Pérez-Blanco, C.D.; Sapino, F. Economic Sustainability of Irrigation-Dependent Ecosystem Services Under Growing Water Scarcity. Insights From the Reno River in Italy. Water Resour. Res. 2022, 58, e2021WR030478. [Google Scholar] [CrossRef]
  15. Li, S.; Yang, G.; Wang, H.; Song, X.; Chang, C.; Du, J.; Gao, D. A spatial-temporal optimal allocation method of irrigation water resources considering groundwater level. Agric. Water Manag. 2023, 275, 108021. [Google Scholar] [CrossRef]
  16. Kang, S. Accelerating modernization of irrigation districts to make up shortfall of national food security. China Water Resour. 2020, 9, 1–5. (In Chinese) [Google Scholar]
  17. Huang, F.; Liu, Z.; Ridoutt, B.G.; Huang, J.; Li, B. China’s water for food under growing water scarcity. Food Secur. 2015, 7, 933–949. [Google Scholar] [CrossRef]
  18. Peng, S. Water resources strategy and agricultural development in China. J. Exp. Bot. 2011, 62, 1709–1713. [Google Scholar] [CrossRef]
  19. Wang, H.; Wang, L.; Yang, G.; Jia, L.; Yao, Y.; Zhang, Y. Agricultural water resource in China and strategic measures for its efficient utilization. Strateg. Study CAE 2018, 20, 9–15. [Google Scholar] [CrossRef]
  20. Essaid, H.I.; Caldwell, R.R. Evaluating the impact of irrigation on surface water-groundwater interaction and stream temperature in an agricultural watershed. Sci. Total Environ. 2017, 599–600, 581–596. [Google Scholar] [CrossRef]
  21. Chen, X.; Thorp, K.R.; van Oel, P.R.; Xu, Z.; Zhou, B.; Li, Y. Environmental impact assessment of water-saving irrigation systems across 60 irrigation construction projects in northern China. J. Clean. Prod. 2020, 245, 118883. [Google Scholar] [CrossRef]
  22. Xu, X.; Huang, G.; Qu, Z.; Pereira, L.S. Assessing the groundwater dynamics and impacts of water saving in the Hetao Irrigation District, Yellow River basin. Agric. Water Manag. 2010, 98, 301–313. [Google Scholar] [CrossRef]
  23. Xue, J.; Guan, H.; Huo, Z.; Wang, F.; Huang, G.; Boll, J. Water saving practices enhance regional efficiency of water consumption and water productivity in an arid agricultural area with shallow groundwater. Agric. Water Manag. 2017, 194, 78–89. [Google Scholar] [CrossRef]
  24. Sanja Mrazovac, K.; Staletović, N.; Abulsba, K.S.; Dagali, K.S. Possibility of the Application of Danube, Sava and Morava River Area Shallow Aquifer Groundwater (Serbia) in the Irrigation Purposes. Water Resour. 2019, 46, 861–870. [Google Scholar] [CrossRef]
  25. Yang, G.; Tian, L.; Li, X.; He, X.; Gao, Y.; Li, F.; Xue, L.; Li, P. Numerical assessment of the effect of water-saving irrigation on the water cycle at the Manas River Basin oasis, China. Sci. Total Environ. 2020, 707, 135587. [Google Scholar] [CrossRef] [PubMed]
  26. Nazoumou, Y.; Favreau, G.; Adamou, M.M.; Maïnassara, I. La petite irrigation par les eaux souterraines, une solution durable contre la pauvreté et les crises alimentaires au Niger? Cah. Agric. 2016, 25, 15003. [Google Scholar] [CrossRef]
  27. Haj-Amor, Z.; Hashemi, H.; Bouri, S. Soil salinization and critical shallow groundwater depth under saline irrigation condition in a Saharan irrigated land. Arab. J. Geosci. 2017, 10, 301. [Google Scholar] [CrossRef]
  28. Li, P.; Qian, H.; Wu, J. Conjunctive use of groundwater and surface water to reduce soil salinization in the Yinchuan Plain, North-West China. Int. J. Water Resour. Dev. 2018, 34, 337–353. [Google Scholar] [CrossRef]
  29. Zhang, Y.; Hou, K.; Qian, H.; Gao, Y.; Fang, Y.; Tang, S.; Xiao, S.; Ren, W.; Qu, W.; Zhang, Q. Natural-human driving factors of groundwater salinization in a long-term irrigation area. Environ. Res. 2023, 220, 115178. [Google Scholar] [CrossRef]
  30. Aliabad, F.A.; Hakimzadeh, M.A.; Shojaei, S. The impact of drought and decline in groundwater levels on the spread of sand dunes in the plain in Iran. Sustain. Water Resour. Manag. 2017, 5, 541–555. [Google Scholar] [CrossRef]
  31. Rohde, M.M.; Sweet, S.B.; Ulrich, C.; Howard, J. A Transdisciplinary Approach to Characterize Hydrological Controls on Groundwater-Dependent Ecosystem Health. Front. Environ. Sci. 2019, 7, 175. [Google Scholar] [CrossRef]
  32. Ni, Y.; Lv, X.; Yu, Z.; Wang, J.; Ma, L.; Zhang, Q. Intra-annual variation in the attribution of runoff evolution in the Yellow River source area. Catena 2023, 225, 107032. [Google Scholar] [CrossRef]
  33. Wu, D.; Jia, K.; Zhang, X.; Zhang, J.; Abd El-Hamid, H.T. Remote Sensing Inversion for Simulation of Soil Salinization Based on Hyperspectral Data and Ground Analysis in Yinchuan, China. Nat. Resour. Res. 2021, 30, 4641–4656. [Google Scholar] [CrossRef]
  34. Zhang, M. Using HJ-I satellite remote sensing data to surveying the Saline soil distribution in Yinchuan Plain of China. Afr. J. Agric. Res. 2011, 6, 213–223. [Google Scholar] [CrossRef]
  35. Zhang, Y.; Hou, K.; Qian, H.; Gao, Y.; Fang, Y.; Xiao, S.; Tang, S.; Zhang, Q.; Qu, W.; Ren, W. Characterization of soil salinization and its driving factors in a typical irrigation area of Northwest China. Sci. Total Environ. 2022, 837, 155808. [Google Scholar] [CrossRef] [PubMed]
  36. Mi, L.; Tian, J.; Si, J.; Chen, Y.; Li, Y.; Wang, X. Evolution of Groundwater in Yinchuan Oasis at the Upper Reaches of the Yellow River after Water-Saving Transformation and Its Driving Factors. Int. J. Environ. Res. Public Health 2020, 17, 1304. [Google Scholar] [CrossRef]
  37. Wang, Y.; Chen, M.; Yan, L.; Zhao, Y.; Deng, W. A new method for quantifying threshold water tables in a phreatic aquifer feeding an irrigation district in northwestern China. Agric. Water Manag. 2021, 244, 106595. [Google Scholar] [CrossRef]
  38. Noory, H.; Liaghat, A.-M.; Chaichi, M.R.; Parsinejad, M. Effects of water table management on soil salinity and alfalfa yield in a semi-arid climate. Irrig. Sci. 2009, 27, 401–407. [Google Scholar] [CrossRef]
  39. Shokri-Kuehni, S.M.S.; Raaijmakers, B.; Kurz, T.; Or, D.; Helmig, R.; Shokri, N. Water Table Depth and Soil Salinization: From Pore-Scale Processes to Field-Scale Responses. Water Resour. Res. 2020, 56, e2019WR026707. [Google Scholar] [CrossRef]
  40. Yang, R.; Gao, Q. Water-Saving Irrigation Promotion and Food Security: A Study for China. Sustainability 2021, 13, 12212. [Google Scholar] [CrossRef]
  41. Cao, Y.; Zhang, W.; Ren, J. Efficiency Analysis of the Input for Water-Saving Agriculture in China. Water 2020, 12, 207. [Google Scholar] [CrossRef]
  42. Pang, H. Analysis on the status of water-saving irrigation techniques and its development trends in China. Soil. Fertil. Sci. China 2006, 5, 1–6. (In Chinese) [Google Scholar]
  43. Srivastava, P.K.; Singh, R.M. Groundwater Assessment in a Canal Command Area for Sustainable Irrigation in a Part of the Indo-Gangetic Alluvial Plain. Curr. Sci. 2017, 112, 478–489. [Google Scholar] [CrossRef]
  44. Smout, I.K.; Gorantiwar, S.D. Multilevel Approach for Optimizing Land and Water Resources and Irrigation Deliveries for Tertiary Units in Large Irrigation Schemes. I: Method. J. Irrig. Drain. Eng. 2005, 131, 254–263. [Google Scholar] [CrossRef]
  45. Karimov, A.; Molden, D.; Khamzina, T.; Platonov, A.; Ivanov, Y. A water accounting procedure to determine the water savings potential of the Fergana Valley. Agric. Water Manag. 2012, 108, 61–72. [Google Scholar] [CrossRef]
Figure 1. The geographical location of Qingtongxia irrigation area and Helan County: (a) indicates the location of Ningxia within China, (b) shows the location of the study area within Ningxia, (c) presents a basic overview of the study area, including units of water use, groundwater monitoring wells, canal systems, and other relevant details.
Agronomy 14 01611 g001
Figure 2. The spatial distribution of average groundwater depth (a) and changes of groundwater depth at monitoring points in Helan County from 1998 to 2019 (b,c).
Agronomy 14 01611 g002
Figure 3. The flow chart of the optimal allocation method of water resources under the dual control of total water uses and groundwater level.
Agronomy 14 01611 g003
Figure 4. Reasonable groundwater depth ranges in irrigation areas of Helan County for different months.
Agronomy 14 01611 g004
Figure 5. The effect of different single water-saving schemes on the volume and the rate of water shortage.
Agronomy 14 01611 g005
Figure 6. The water shortage rates of each subregion and month under different single water-saving schemes.
Agronomy 14 01611 g006
Figure 7. The acreage with reasonable groundwater depth and differences among the various single water-saving schemes.
Agronomy 14 01611 g007
Figure 8. The comprehensive ranking of the beneficial effects of the single water-saving schemes on both water shortage rate and groundwater.
Agronomy 14 01611 g008
Figure 9. The effect of different comprehensive water-saving schemes on the volume and rate of water shortage.
Agronomy 14 01611 g009
Figure 10. The acreage with reasonable groundwater depth and differences among different comprehensive water-saving schemes.
Agronomy 14 01611 g010
Figure 11. The average water shortage rate and the average area of groundwater within reasonable depth ranges among the different water-saving measures: (a) is the water-saving measures of adjustment of planting structure, (b) is the measure of efficient water-saving irrigation, (c) is the water-saving measures of channel lining, (d) is the measure of efficient water-saving irrigation, (c) is the water-saving measures of controlled irrigation of rice.
Agronomy 14 01611 g011
Table 1. The different scenarios of detailed water-saving measure schemes.
Water-Saving Measures and TypesWater-Saving DegreesSingle SchemesComprehensive Schemes (Z1–Z9)
Z1Z2Z3Z4Z5Z6Z7Z8Z9
The benchmark scheme (S0)
Planting structure adjustment (non-engineering measure)Replace 50% area of rice with cornS1
Replace 75% area of rice with cornS2
Efficient water-saving irrigation (engineering measure)DY (70%), PY (30%)S3
DY (80%), PY (35%)S4
DY (90%), PY (40%)S5
Channel lining to improve water utilization efficiency of channel (engineering measure)Improve to 0.62S6
Improve to 0.64S7
Improve to 0.66S8
Controlled irrigation of rice (non-engineering measure)Irrigation not exceeding 11.85 thousand m3/haS9
Water-Saving Measures and TypesWater-Saving DegreesSingle SchemesComprehensive Schemes(Z10Z18)
Z10Z11Z12Z13Z14Z15Z16Z17Z18
The benchmark scheme (S0)
Planting structure adjustment (non-engineering measure)Replace 50% area of rice with cornS1
Replace 75% area of rice with cornS2
Efficient water-saving irrigation (engineering measure)DY (70%), PY (30%)S3
DY (80%), PY (35%)S4
DY (90%), PY (40%)S5
Channel lining to improve water utilization efficiency of channel (engineering measure)Improve to 0.62S6
Improve to 0.64S7
Improve to 0.66S8
Controlled irrigation of rice (non-engineering measure)Irrigation not exceeding 11.85 thousand m3/haS9
Note: PY (70%) and DY (30%) represent adopting highly efficient water-saving irrigation covering 70% of pump-diverted water irrigation region and 30% of channel-diverted water irrigation region. PY (80%) and DY (35%) represent adopting highly efficient water-saving irrigation covering 80% of pump-diverted water irrigation region and 35% of channel-diverted water irrigation region. PY (90%) and DY (40%) represent adopting highly efficient water-saving irrigation covering 90% of pump-diverted water irrigation region and 40% of channel-diverted water irrigation region.
Disclaimer/Publisher’s Note: The statements, opinions and data contained in all publications are solely those of the individual author(s) and contributor(s) and not of MDPI and/or the editor(s). MDPI and/or the editor(s) disclaim responsibility for any injury to people or property resulting from any ideas, methods, instructions or products referred to in the content.

