Article

Adjusting Irrigation and Phosphate Fertilizer to Optimize Tomato Growth and Production

by
Oswaldo Palma Lopes Sobrinho
1,
Leonardo Nazário Silva dos Santos
1,
Frederico Antônio Loureiro Soares
1,
Marconi Batista Teixeira
1,
Mateus Neri Oliveira Reis
2,
Layara Alexandre Bessa
2 and
Luciana Cristina Vitorino
3,*
1
Hydraulics and Irrigation Laboratory, Instituto Federal Goiano–Campus Rio Verde, P.O. Box 66, Rio Verde 75901-970, Goiás, Brazil
2
Laboratory of Metabolism and Genetics of Biodiversity, Instituto Federal Goiano–Campus Rio Verde, Rio Verde 75901-970, Goiás, Brazil
3
Laboratory of Agricultural Microbiology, Instituto Federal Goiano–Campus Rio Verde, Rio Verde 75901-970, Goiás, Brazil
*
Author to whom correspondence should be addressed.
Agronomy 2024, 14(8), 1616; https://doi.org/10.3390/agronomy14081616
Submission received: 17 June 2024 / Revised: 18 July 2024 / Accepted: 21 July 2024 / Published: 24 July 2024
(This article belongs to the Section Water Use and Irrigation)

Abstract

:
The efficient use of phosphate fertilizers and optimization of the amounts of irrigation water can maximize tomato growth and fruit production. This study aimed to evaluate the effects of different phosphorus (P) doses and sources on the growth and production components of tomato plants of the cultivar Gaúcho Melhorado Nova Seleção subjected to different irrigation water percentages. To achieve this, we set up an experiment using a factorial design to test the effects of four doses of P2O5 (corresponding to 25%, 50%, 100%, and 200% of the recommended dose), two P sources (monoammonium phosphate—MAP and organomineral—OM), and four irrigation water percentages (50%, 75%, 100%, and 125% of field capacity). Tomato plant growth improved when water was supplied at a percentage close to 100% of field capacity, with increased plant height, leaf length, and number of flowers observed (increases of 11.95%, 7.33%, and 13.87%, respectively, compared to 50% of field capacity). However, both excess and deficit irrigation resulted in morphological changes in tomato plants. Additionally, we observed that OM was more effective than MAP in increasing plant diameter and number of flowers, with increases of up to 36.4% and 227.6%, respectively, when using OM. Conversely, tomato growth was negatively affected by higher doses of MAP doses, suggesting that 25% of the recommended dose may yield the best growth rates. We verified that tomato plants can compensate for low phosphorus doses by increasing productivity with higher water amounts (125%–42.40 t ha−1), but high phosphorus doses result in greater fruit production with lower water percentages (50%–41.52 t ha−1).

1. Introduction

Tomato (Solanum lycopersicum L.) is a fruit species belonging to the order Solanales and the Solanaceae family with a wide geographic distribution [1,2,3,4]. The species originates from the Andes, in the South American coastal regions, ranging from northern Ecuador to northern Chile, and from the western Pacific Ocean to the eastern Andes [5,6,7]. It is among the most socioeconomically important vegetables globally due to its high acceptance, consumption, and versatility, as it can be grown in different conditions such as fields, greenhouses, and gardens [8]. The tomato high nutritional value and contains bioactive and functional compounds, including antioxidants, phenolic compounds and carotenoids [9,10,11].
According to the Mordor Intelligence [12] agency, the global tomato market is expected to reach USD 207.17 billion in 2024 and is projected to grow to USD 261.41 billion by 2029. Specifically in Brazil, tomato production is estimated at 4.0 million Mg, with a 2.0% increase in the last survey. The planted area covers 56,874 hectares, and is expected to increase by 2.2%. The states of Goiás and São Paulo are the largest producers, accounting for 28.9% and 25.6% of Brazilian production, respectively. In Goiás, where this study was conducted, most tomato crops are grown in irrigated beds, with an average fruit productivity estimated at 92,394 kg ha−1. In São Paulo, however, most crops are grown on trellis systems, with an average fruit productivity of 78,344 kg ha−1 [13].
Among the many challenges affecting tomato cultivation, the availability and appropriate use of agricultural inputs to meet the nutritional needs of plants considering physiological, morphological processes, and phenological stages are crucial [14]. Success in production is often linked to the availability of water and fertilizers throughout the tomato growth cycle.
Water is essential for plant growth and development, participating in several physiological mechanisms, including nutrition [15]. The water content of the soil is responsible for the movement of nutrients in the soil and from the soil to the plant, with diffusion being the primary mechanism for phosphorus (P) transport in the soil. Therefore, research focused on developing plant production methods under different irrigation management practices and soil nutrient availability, including P, is important to ensure agricultural productivity amidst fertilizer scarcity and climate change [16]. Furthermore, drip irrigation systems are becoming increasingly popular, as they allow greater water saving, reduced environmental impacts, and a decrease in the emergence of pests and diseases compared to traditional irrigation techniques [17,18].
Tomatoes have a high nutritional demand [19]. Thus, their production depends on the availability of large amounts of macronutrients. Although P is absorbed in smaller quantities compared to nitrogen (N) and potassium (K), its availability is essential for plant growth and production. P deficiencies negatively affect fruit development, production, and the nutritional quality of fruits [20].
Organomineral fertilizers are derived from physical processes, such as rock grinding, and exhibit characteristics of both organic and mineral soil fertilizers. They have low nutrient loss due to their organic fraction, resulting in better soil fertilizer utilization and reduce input costs. Additionally, these fertilizers decrease P adsorption, improve plant–mineral interactions, and enhance the propagation of microorganisms responsible for solubilizing mineral fertilizers, which helps release nutrients to plants [21]. The response to organomineral fertilizer applications is the subject of several studies [22,23,24]; however, research focused on optimizing the application of phosphate fertilizers (involving dosage and relationship between dosage and irrigation) is still incipient.
Studies have highlighted challenges in adapting doses and sources of phosphate fertilizer for tomato cultivation, as well as difficulties in determining the appropriate amount of water to apply. Consequently, tomato producers have sometimes applied P in concentrations up to 10 times higher than required and used more water than necessary for the crop [18]. Currently, for irrigated industrial tomato cultivation in the state of Goiás, the recommendation is irrigation at 80% of field capacity and application of phosphate fertilizer at a dose of 40 to 80 kg ha−1 [25]. This fertilization is almost exclusively provided by the application of mineral phosphorus. Therefore, it is urgent to evaluate the use of alternative sources and doses under different percentages of irrigation water. In Goiás, drip irrigation is highly recommended for tomato cultivation, especially for tomatoes intended for industrial processing, to achieve high productivity. However, while drip irrigation ensures greater water use efficiency, reduces losses, and improves application uniformity, its adoption needs to be more widespread [26].
In Goiás, nearly all tomato production for processing uses central pivot irrigation. However, growing evidence highlights the inefficiencies and disadvantages of cultivating tomatoes in open fields. This practice exposes plants to extreme variations in temperature, rain, wind, and hail, facilitates the spread of pests and diseases due to increased exposure to pathogens, and makes irrigation and fertilization less efficient, leading to resource wastage and less uniform plant growth [27]. Consequently, we chose to conduct our tests in a protected cultivation system.
The objective of this study was to evaluate the effects of different doses and sources of P2O5 on the growth and production components of tomato crops subjected to different irrigation water percentages. We aimed to optimize phosphate fertilization and drip-water supply in this crop, testing the hypothesis that phosphorus fertilization from an organomineral source (OM) could replace phosphate fertilization with monoammonium phosphate (MAP).

2. Materials and Methods

2.1. Experimental Area

The experiment was conducted in an agricultural greenhouse at the Hydraulics and Irrigation Laboratory of the Federal Institute of Education, Science and Technology Goiano (IF Goiano, Rio Verde, Brazil), located at geographic coordinates 17°48′ S; 50°55′ W and an altitude of 748 m in the municipality of Rio Verde, State of Goiás, Brazil. A digital thermohygrometer was installed at a central internal point of the greenhouse, allowing the measurement of average temperature and relative humidity values during the tomato cultivation in the 2019 agricultural year: September—25.77 °C and 51.71%; October—25.36 °C and 61.41%; and November—24.22 °C and 71.33%.

2.2. Soil Preparation and Fertilization

Tomatoes were grown in plastic pots filled with 23 kg of soil (ds = 1.3 g cm−3). Soil samples for the pots were collected from the 0.0–0.20 m layer and classified as typical hapludox with a clayey texture (dystroferric red latosol according to the Brazilian Soil Classification System [28]). Soil fertilization was based on the results of soil chemical analyses (Table 1) and recommendations proposed by Sousa and Lobato [29] for tomato crops. Two phosphate sources were evaluated: one based on granulated monoammonium phosphate (MAP) (YARA), NPK 11-52-00, and the other based on organic chicken litter, which was a triple organomineral superphosphate (OM), NPK 06-22-1. The P2O5 applications to the soil consisted of 0.02885 kg of MAP, 0.03248 kg of OM, and 0.00075 kg of P2O5 for a P2O5 rate of 25%; 0.0577 kg of MAP, 0.06486 kg of OM, and 0.0015 kg of P2O5 for a P2O5 rate of 50%; 0.1154 kg of MAP, 0.12976 kg of OM, and 0.003 kg of P2O5 for a P2O5 rate of 100%; and 0.2308 kg of MAP, 0.25952 kg of OM, and 6.00 kg of P2O5 for a P2O5 rate of 200%. P2O5 was applied to the soil two weeks before planting. The number of plants per pot was used as a criterion to calculate the application rates per pot, considering a population of 20,000 plants per hectare.

2.3. Experimental Design and Treatments

A randomized block experimental design was employed using a 4 × 2 × 4 split-split-plot arrangement with three replications (each repetition consisting of two plants per pot), totaling 96 experimental plots. The design considered irrigation supply (50%, 75%, 100%, and 125% of the field capacity) as the main plots, P2O5 sources (monoammonium phosphate—MAP and organomineral—OM) as the subplots, and P2O5 rates (25%, 50%, 100%, and 200% of the recommended rate) as the sub-subplots.
The tomato cultivar used was Gaúcho Melhorado Nova Seleção (a table tomato), which belongs to the salad group and exhibits an indeterminate growth habit. The crops were grown in a trellising system with plastic rope [30]. Management and cultural practices followed the recommendations of Silva and Vale [31] and Clemente and Boiteux [32].

2.4. Irrigation System

A soil water retention curve was determined using undisturbed soil samples. The samples were saturated and subjected to tensions of 1, 2, 4, 6, 8, and 10 kPa in porous funnels. Tensions higher than 1,500 kPa were evaluated using a Richards chamber with ceramic porous plates [33]. Moisture at a potential of 1500 kPa was determined as the permanent wilting point, and moisture at 10 kPa was determined as field capacity (CC).
Following these analyses, van Genuchten parameters [34], fitted by Mualem [35] were determined using the Soil Water Retention Curve program [36] to calculate the soil water content. The equation obtained was: θ = θr + ((θs − θr)/(1 + (0.063.ψm)1.49)0.33).
A surface drip irrigation system with self-compensating emitters (IRRITEC®) was utilized. Irrigation was managed using tensiometry, with four sets of tensiometers installed. The tensiometer rods were placed in the soil of irrigated plots with a water depth of 100% up to 20 cm depth, 15 cm from the emitter. Initial readings began 15 days after the sensors were installed and were subsequently taken daily. The water distribution uniformity of the irrigation system was tested according to the classification of Mantovani [37] for each treatment, showing values above 90%, which is classified as excellent.

2.5. Plant Analysis

Morphological characteristics were analyzed at 96 days after planting. The specimens were evaluated for plant height, number of leaves, leaf length, leaf width, number of flowers per plant, number of ramifications per plant, stem diameter, leaf area, and fruit yield. Total fruit production was calculated by summing commercial and non-commercial fruits. Fruit yield was evaluated based on the planting spacing used (1.00 × 0.50 m), representing a population of 20,000 plants per hectare.

2.6. Statistical Analysis
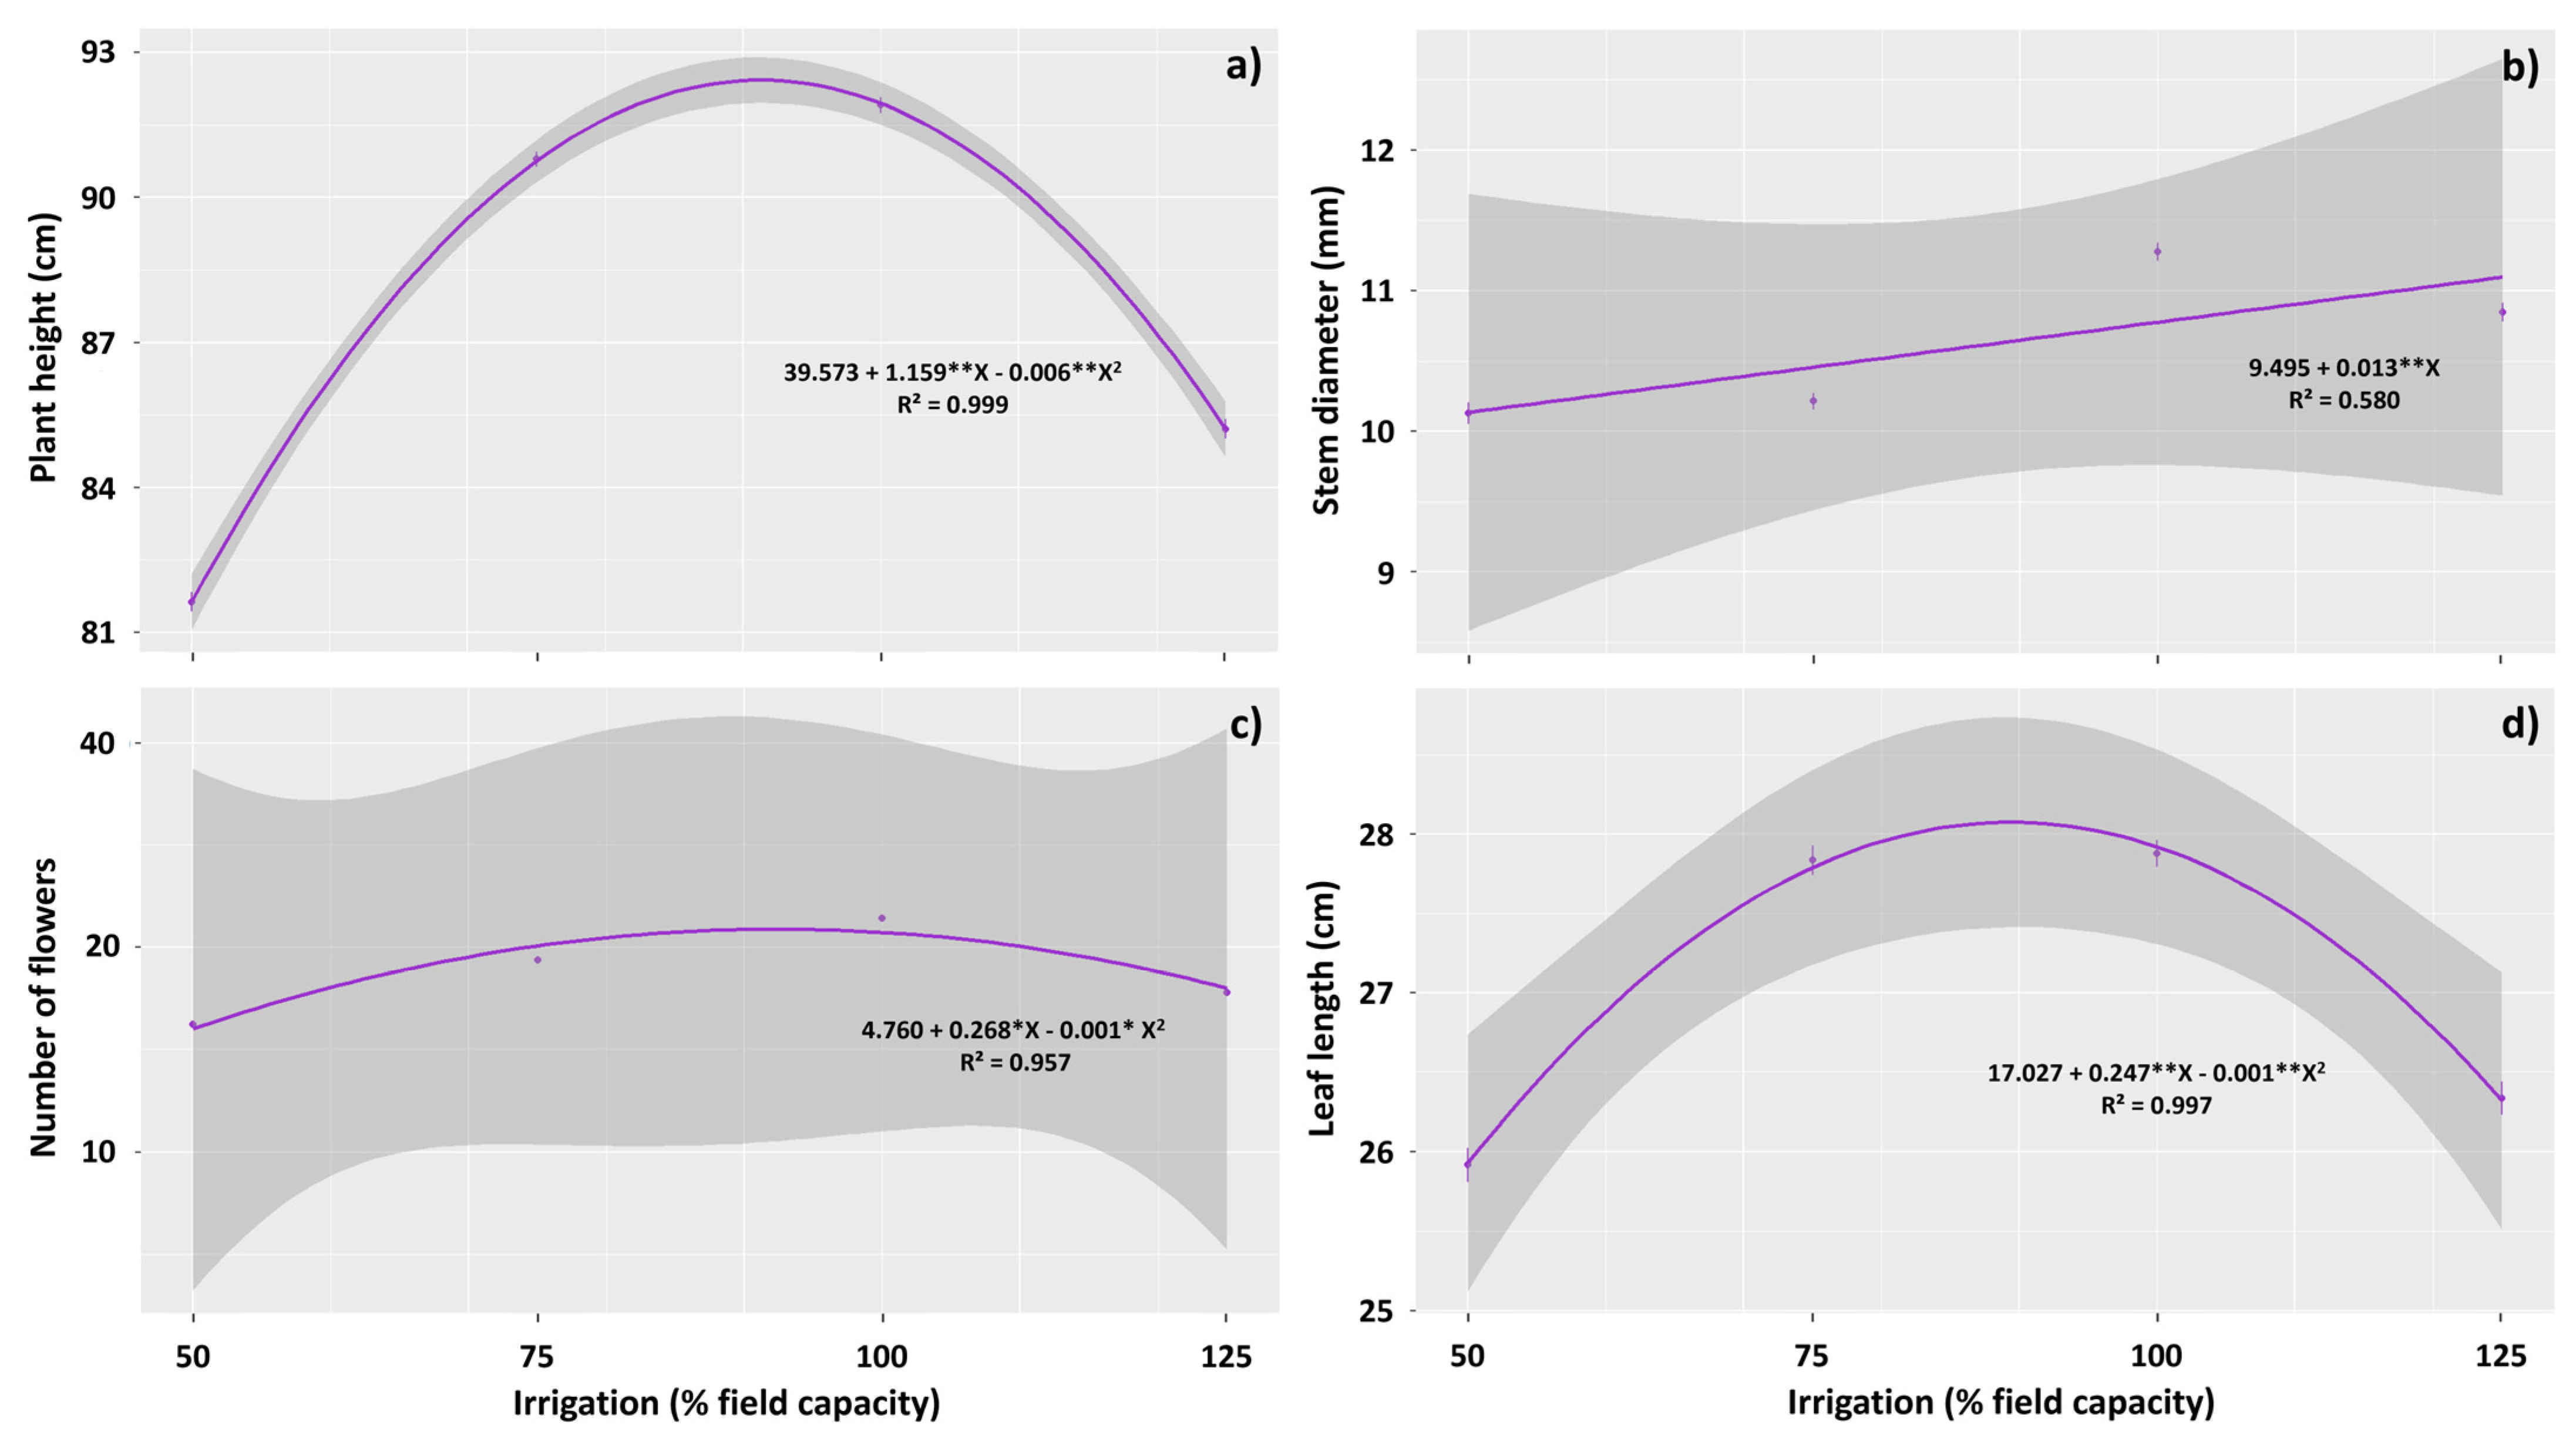
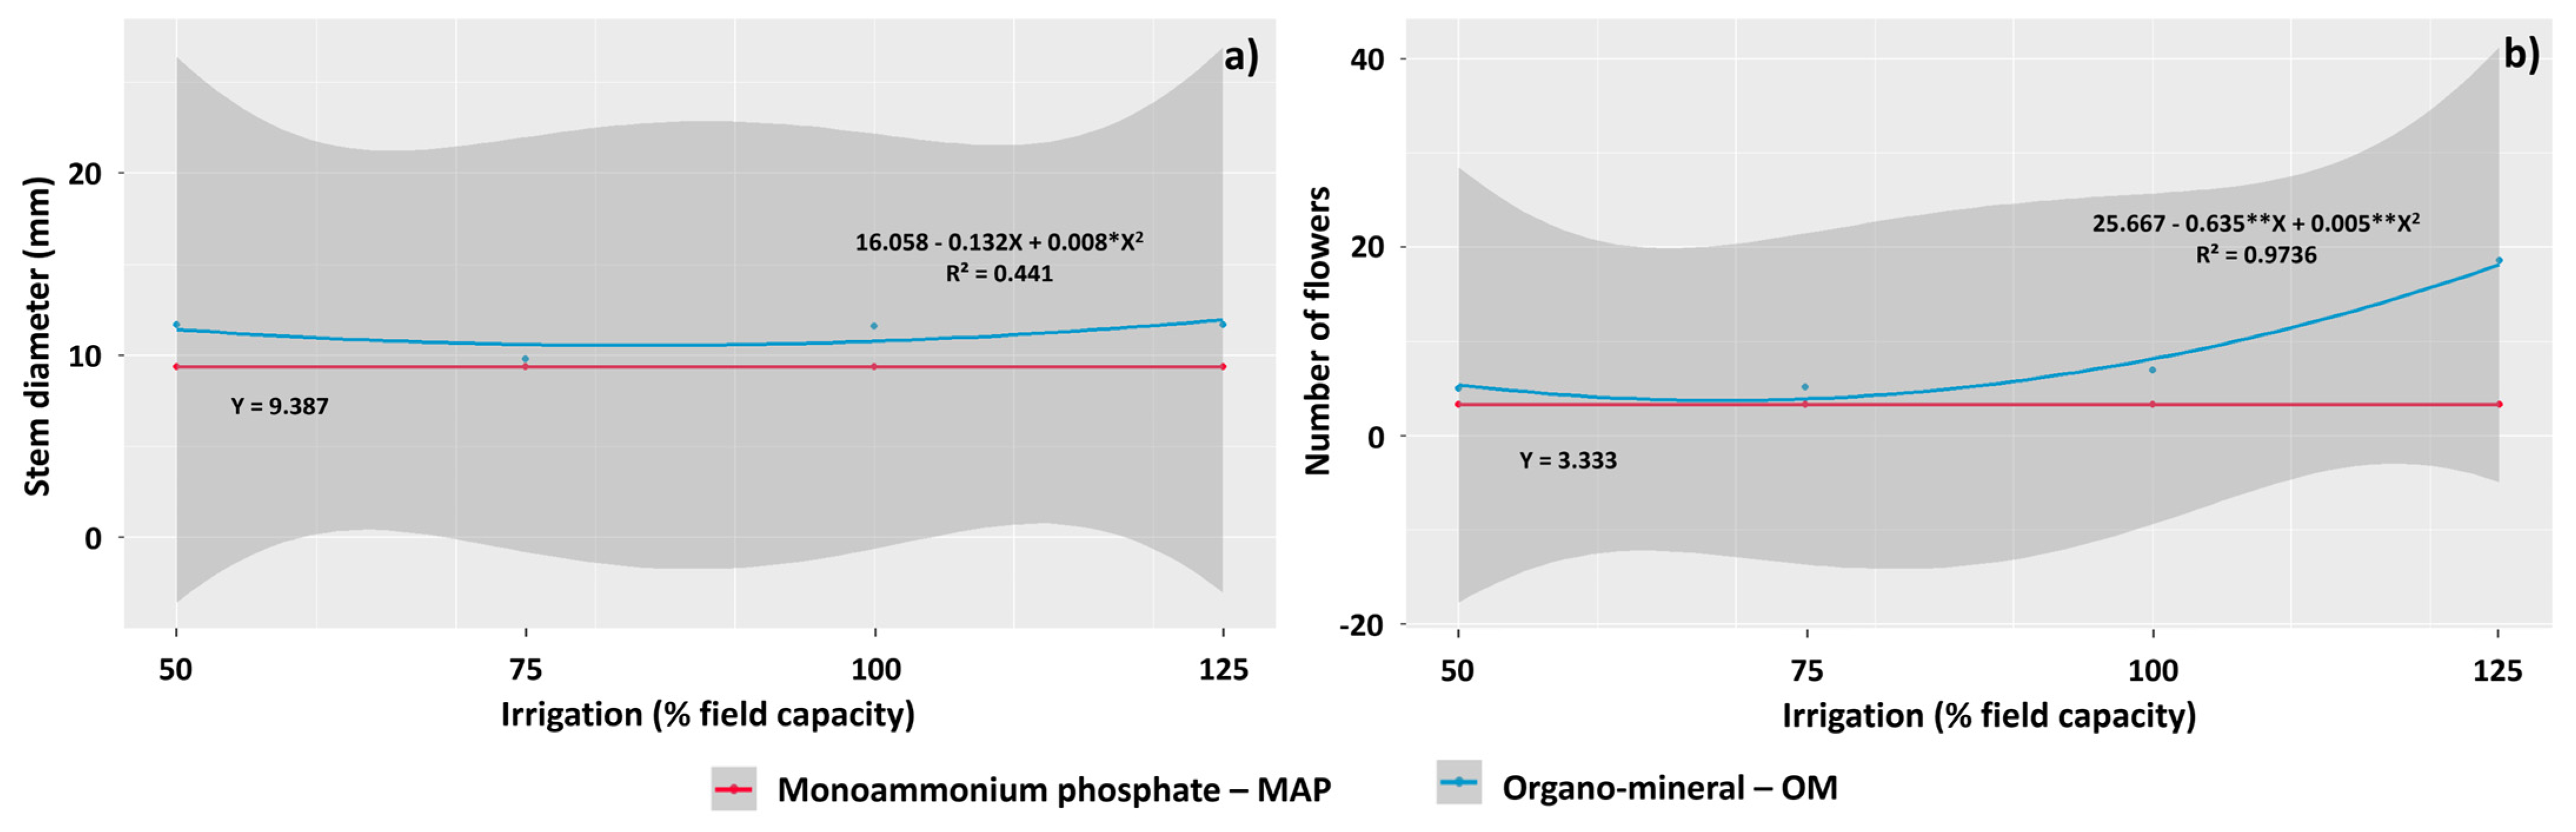
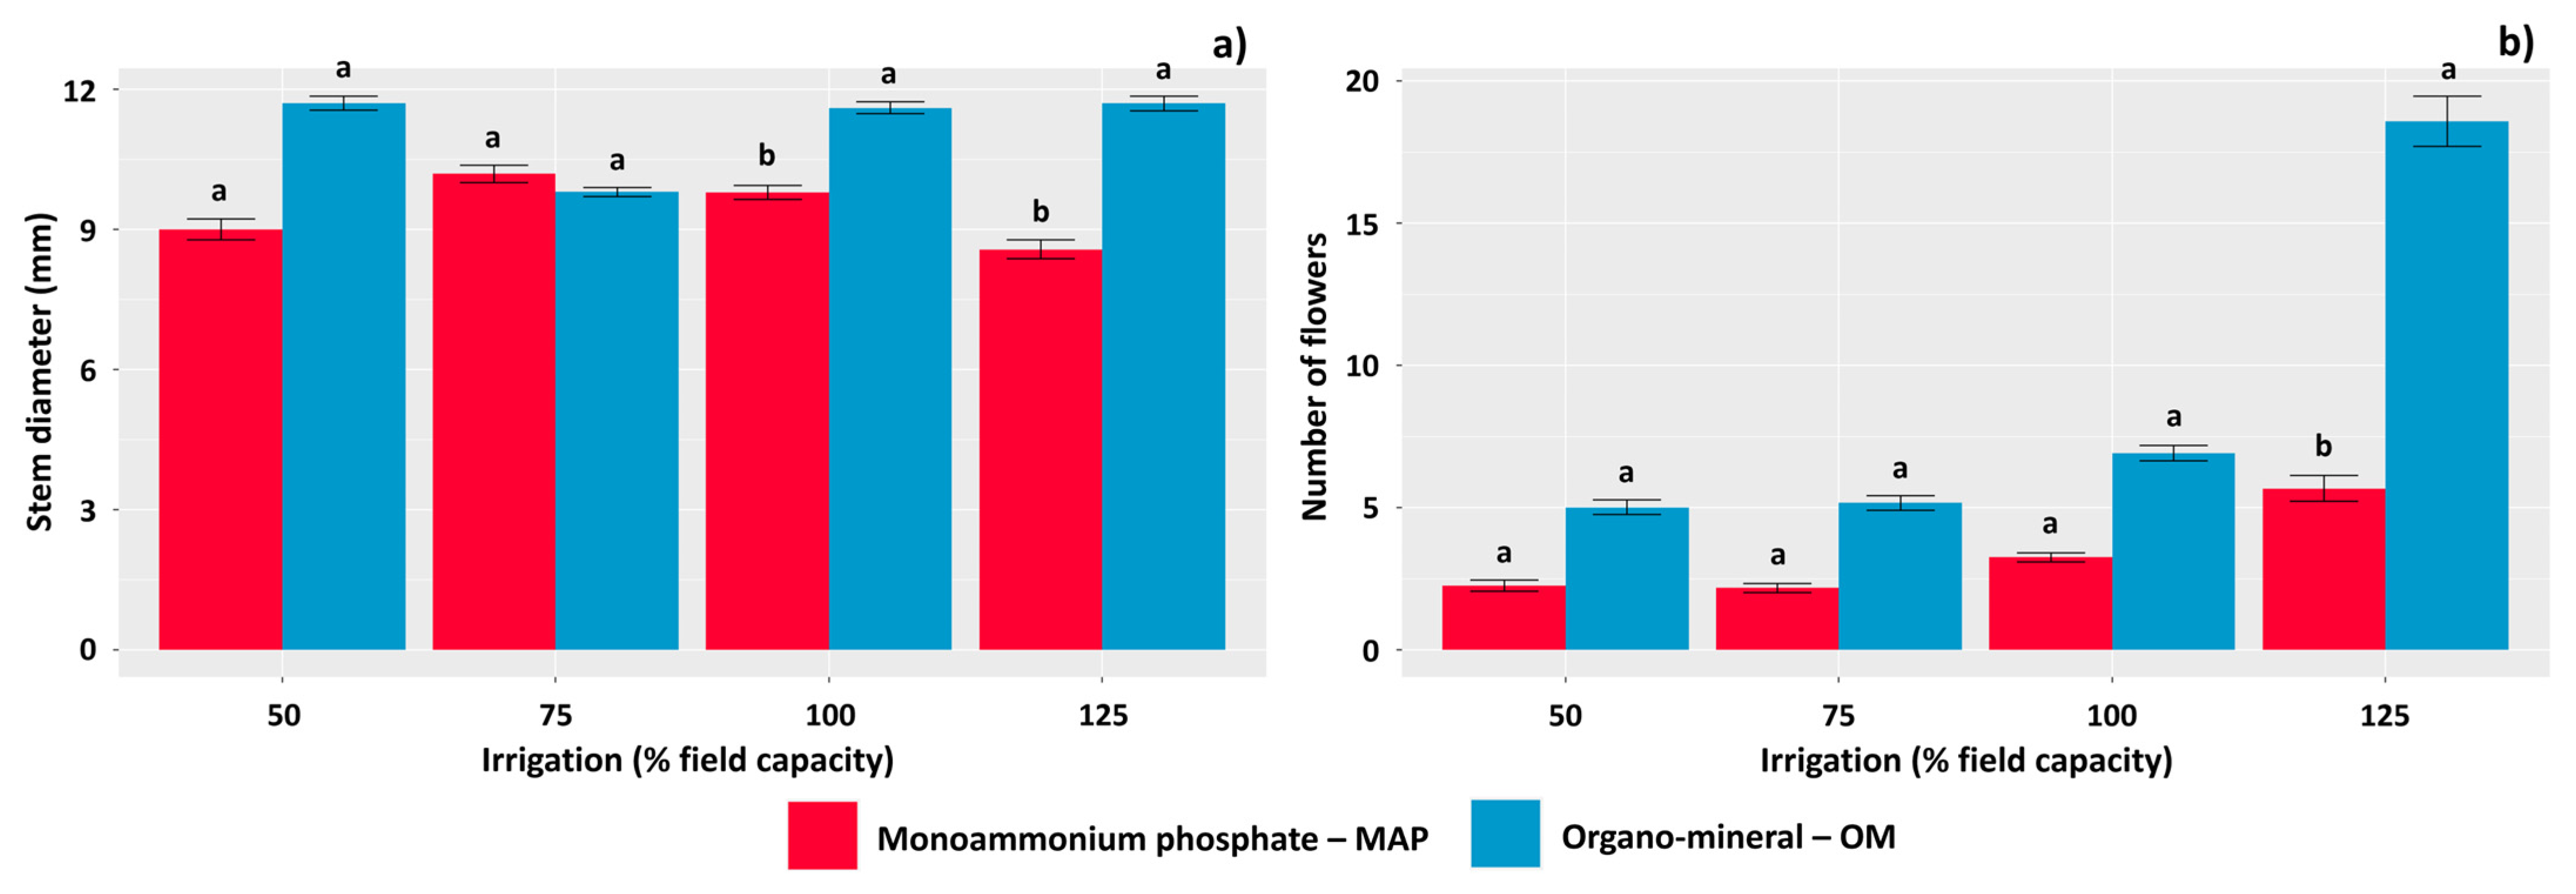
Data were subjected to analysis of variance using the F test at a 5% probability level. When significant differences between means were detected, regression analysis was performed for P2O5 rates and irrigation supply. Differences in the effects of phosphorus sources were compared using Tukey’s test (p < 0.05) if significant. The analyzes were conducted using the SISVAR® statistical program [38].

3. Results

The effect of the irrigation (percentage of the field capacity) factor was significant for plant height, stem diameter, number of flowers, and leaf length, while the phosphorus source (MAP and OM) affected most traits evaluated, except for leaf length and fruit yield (Table S1). However, fruit yield was affected by the interaction between irrigation and P2O5 rates. The interaction between irrigation and phosphorus source significantly affected stem diameter and the number of flowers, while the interaction between P2O5 rates and sources significantly affected height, stem diameter, number of ramifications, number of leaves, leaf length, leaf width, and leaf area.
The data observed for plant height, number of flowers, and leaf length were adjusted to quadratic polynomial mathematical models, with the F test showing a significant effect for the irrigation factor (percentage of field capacity). The highest average plant height (92 cm) was observed with irrigation at 90.5% of field capacity, while the lowest average (81.51 cm) was observed in plants grown with water supply at 50% of field capacity (Figure 1a). Thus, the best performance in plant height is connected to increases in water supply up to 90.5% of field capacity. However, water above 100% of field capacity reduced plant height, causing stress due to excess water.
The stem diameter of tomato plants responded positively to increased water availability. The data were adjusted to a linear model, given the progressive increase in averages due to the increase in irrigation supply (Figure 1b). The highest number of flowers was observed in plants irrigated at 89% of field capacity (16.72), while the lowest production of these reproductive structures was obtained in plants subjected to only 50% of field capacity (14.40) (Figure 1c). The greatest leaf length (27.93 cm) was observed in plants irrigated at 88% of the field capacity, and the lowest average for this variable (25.88 cm) was also obtained in plants irrigated at 50% (Figure 1d). Thus, we verified that the growth responses of tomato plants are better with water close to 100% of field capacity (Figure 2).
When comparing phosphorus sources, the highest averages were consistently observed with the use of OM considering parameters such as plant height, stem diameter, number of flowers, number of ramifications, number of leaves, and leaf width. Therefore, tomato plant growth appears to respond more positively to OM fertilization compared to MAP (Table 1).
Fertilization with OM as a source of P2O5 resulted in tomato plants with a larger stem diameter (11.99 mm) when irrigated at 125% of field capacity. Conversely, the smallest average diameter (10.47 mm) was observed under irrigation of 83% of field capacity (Figure 3a). Additionally, OM fertilization led to tomato plants with a higher average number of flowers (18.16) under irrigation at 125% of field capacity (Figure 3b).
When we compared different phosphorus sources under different water supplies, the use of OM as a source of P2O5 resulted in stem diameters that were 30%, 18.5%, and 36.4% higher than those with MAP when irrigated at 50%, 100%, and 125% of field capacity, respectively (Figure 4a). Similarly, OM significantly promoted flower development in plants irrigated at 50%, 75%, 100%, and 125% of field capacity, resulting in an increase of 227.68% in the average observed in plants irrigated at 125% compared to those treated with MAP (Figure 4b).
When evaluating the interaction between sources (MAP and MO) and doses of P2O5, we observed a negative effect of increasing MAP doses on the growth of tomato plants, with the tallest plants observed in the treatment with 25% MAP, reaching an average height of 145.92 cm. In contrast, plants treated with OM were not significantly affected by the dose, maintaining an average height of 142.62 cm (Figure 5a). Stem diameter was also negatively affected by increasing MAP doses. Thus, the largest average diameter was observed in plants treated with 25% MAP, measuring 10.72 mm. In contrast, plants treated with OM maintained an average diameter of 11.19 mm (Figure 5b). The number of ramifications in tomato plants exhibited a linear reduction with increasing MAP doses, with the highest average observed in plants treated with 25% MAP. Plants treated with OM did not show a significant effect of dose on the number of ramifications, maintaining an average of 5.60 ramifications per plant (Figure 5c).
Increasing P2O5 rates supplied by MAP resulted in a decrease in the number of leaves in tomato plants, showing a linear decline. Thus, the highest number of leaves in this treatment was evidenced using 25% MAP (95.99). Conversely, the means observed with OM were not significantly affected by increasing doses, remaining at 96.18 (Figure 6a). Similarly, increasing MAP doses linearly reduced leaf length in tomato plants. The use of 25% P2O5 supplied by MAP resulted in the highest average leaf length observed (27.72 cm). In contrast, plants treated with OM did not show a significant effect of dose on leaf length, maintaining an average of 24.56 cm in length (Figure 6b).
Leaf width data also followed a linear pattern. The use of MAP at a dose of 25% resulted in the largest leaf width observed (21.57 cm), while OM doses did not affect leaf width. Plants treated with OM maintained an average leaf width of 19.12 cm (Figure 6c). Leaf area data exhibited a similar trend to number, length, and width. The largest leaf area was observed with the application of MAP at a dose of 25% (297.98 cm²). Tomato plants cultivated with OM maintained an average leaf area of 239.09 cm² (Figure 6d).
When we compared phosphate sources within each evaluated dose of P2O5, we found that at the lowest dose (25%), MAP is more effective in stimulating the growth of tomato plants compared to OM. However, at the highest dose (200%), there is a reversal of this effect: OM becomes more effective, resulting in plants that are 15.15% taller (Figure 7a). For doses of P2O5 above 25%, stem diameter was negatively affected by the use of MAP compared to OM. Thus, at concentrations of 50%, 100%, and 200% of P2O5, plants treated with OM exhibited diameters that were 9.35%, 28.36%, and 27.10% larger, respectively (Figure 7b). At the highest doses of P2O5 (100 and 200%), the number of ramifications was significantly higher in plants fertilized with OM. These plants showed a 51.61% and 50.70% greater number of ramifications compared to plants treated with MAP (Figure 7c).
Considering the sources of P2O5, within each tested dose, we observed that at the lowest application dose, MAP induced more leaves compared to OM. However, at higher doses of 100% and 200%, plants treated with OM showed an increase of 30.88 and 43.26 more leaves, respectively (Figure 8a). When evaluating leaf length, width, and area, at a dose of 25% P2O5 (Figure 8b–d), we observed a similar trend. Specifically, plants treated with MAP performed better across all these variables. However, with increasing MAP doses, leaf width and area in particular were negatively affected compared to plants fertilized with OM.
The interaction between P2O5 doses and irrigation percentages showed that these factors jointly affected the productivity of tomato plants. Using P2O5 at a rate of 100% resulted in higher productivity when water was supplied at 125% of field capacity (42.40 t ha−1). A linear trend was observed, with productivity increasing as water percentages increased (Figure 9a). Conversely, when using a high P2O5 rate of 200%, the highest productivity was observed in plants maintained at the lowest water percentage (50%) (41.98 t ha−1). With this fertilization, increased irrigation led to linear decreases in productivity (Figure 9b). Analyzing tomato plants irrigated with only 50% of field capacity, we found that the highest productivity was achieved using a high phosphorus dose (200%) (41.52 t ha−1), indicating a regulatory mechanism (Figure 9c). Our data suggest a compensatory relationship between P dose and irrigation. Under low P doses, the highest fruit production occurred under high water availability (125%), whereas under high P doses, the highest productivity occurred at 50% of field capacity (Figure 9d).

4. Discussion

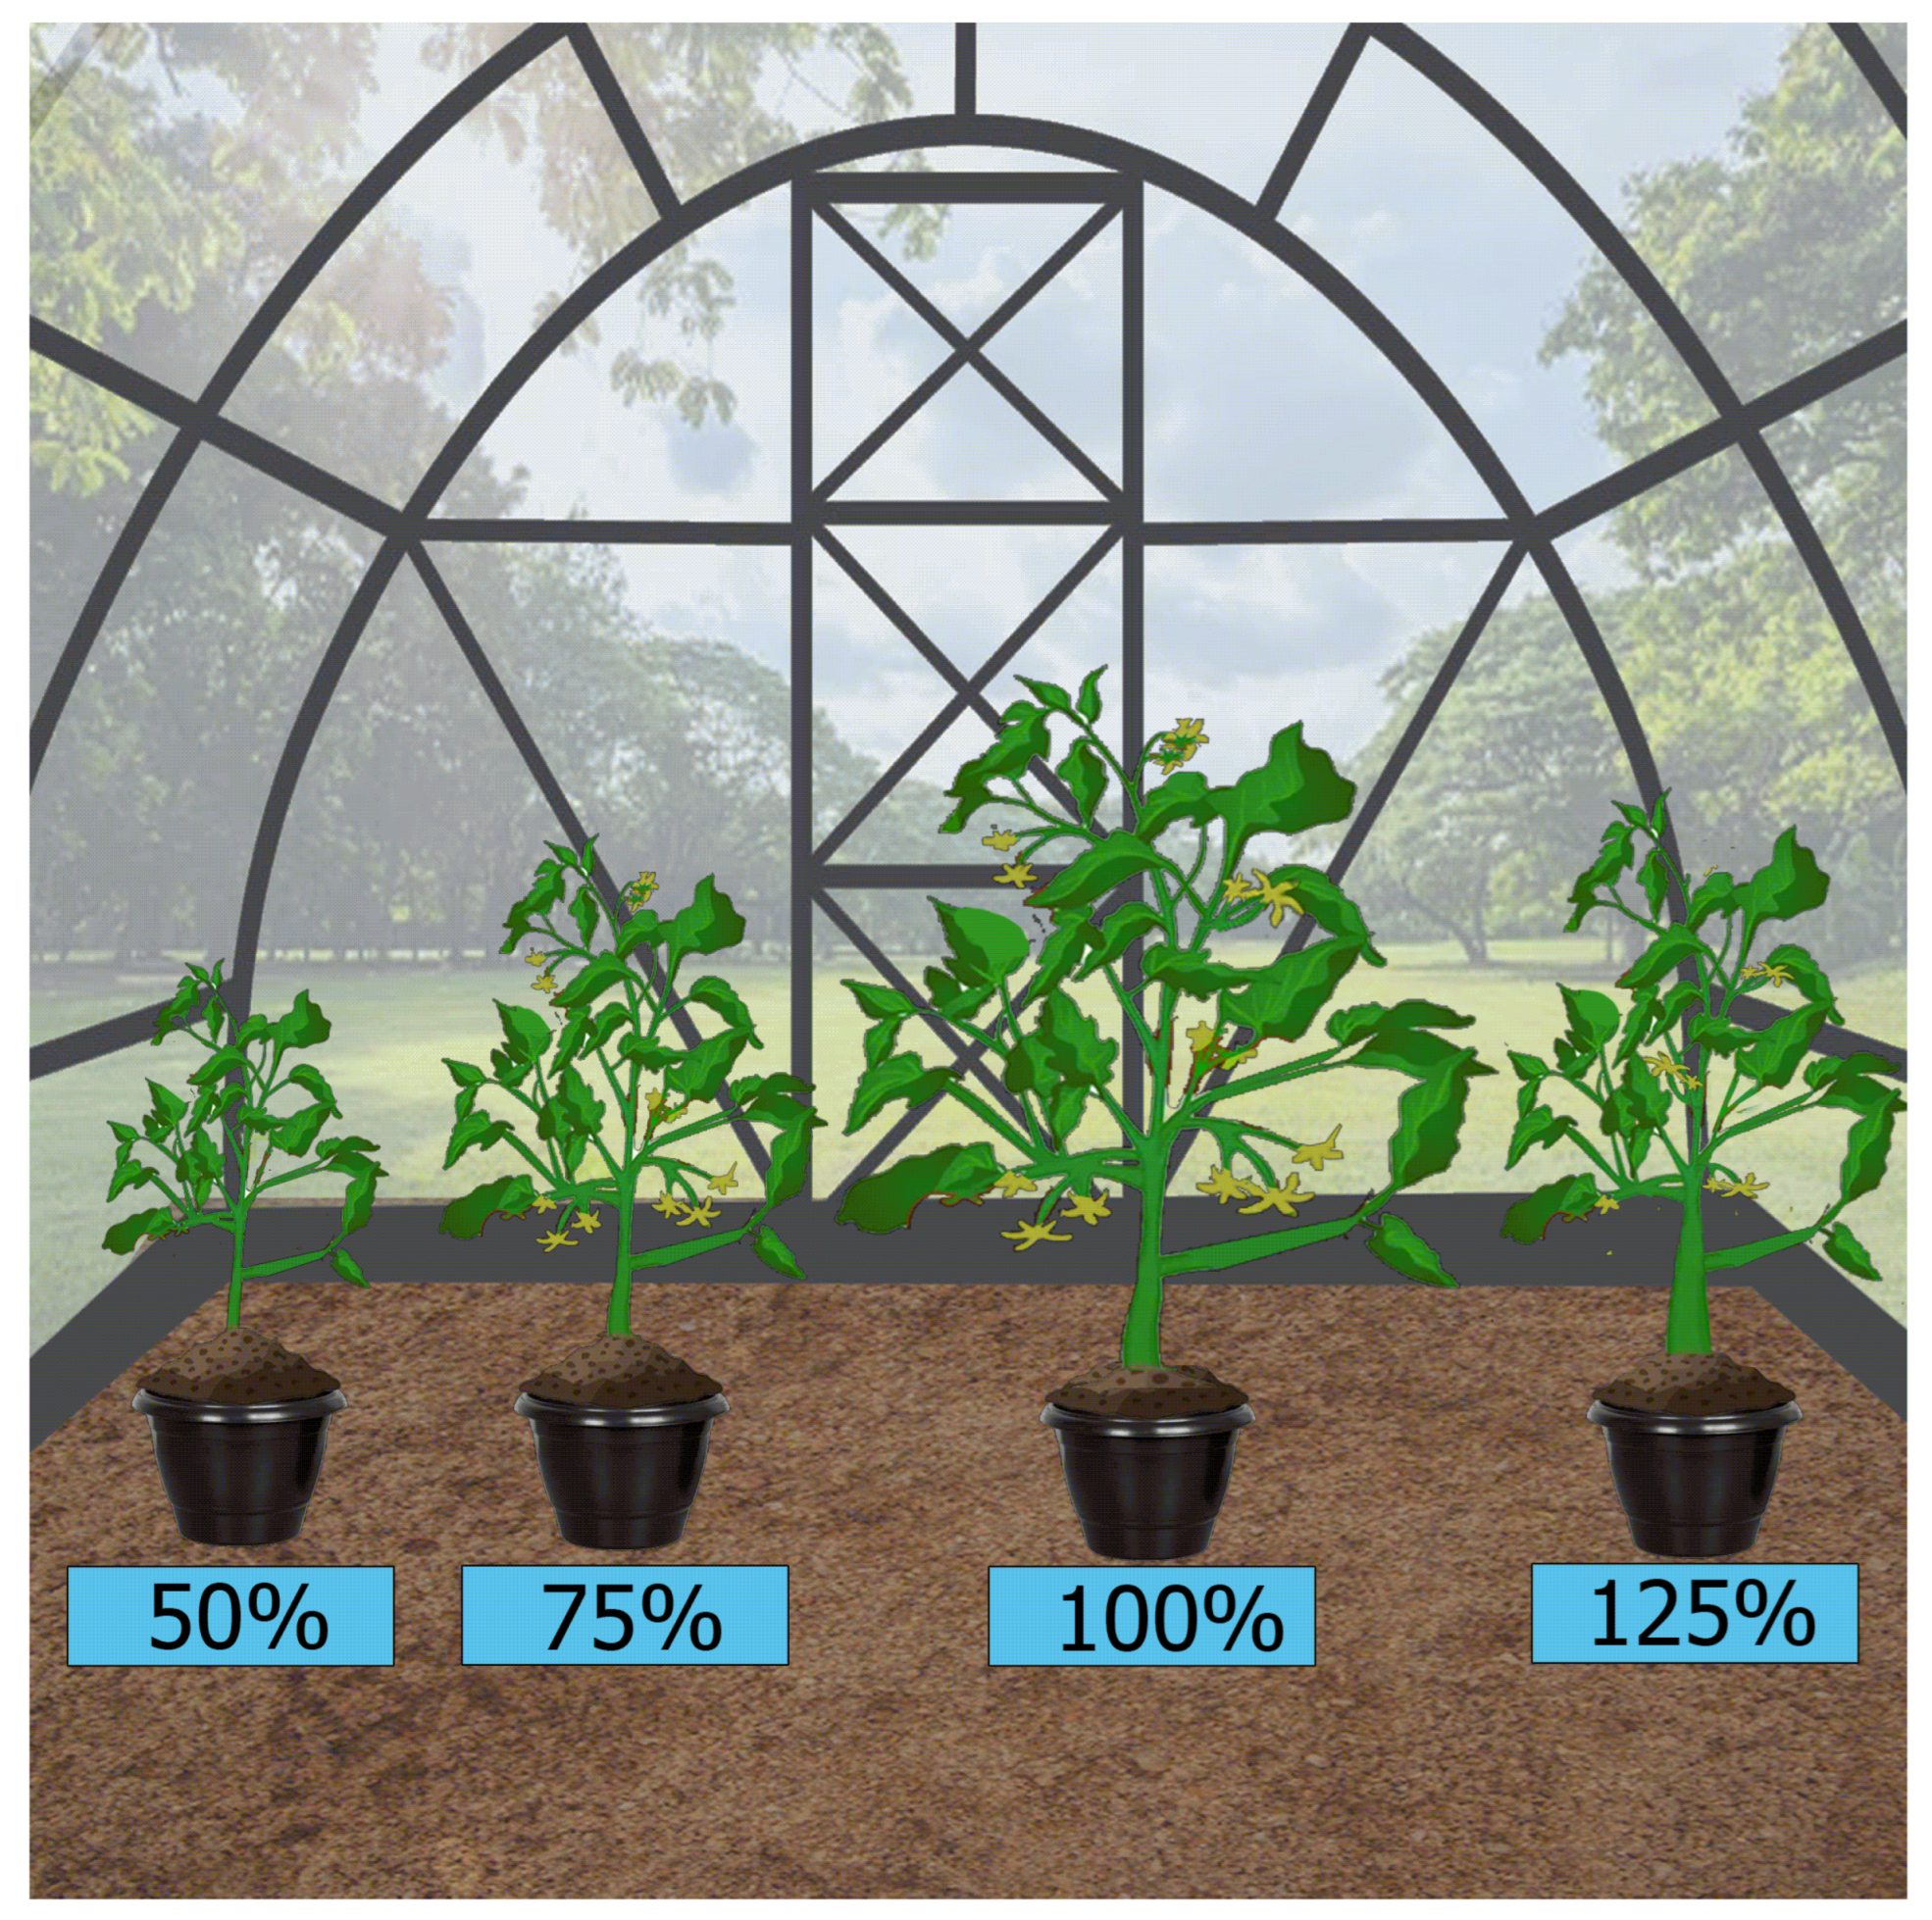
4.1. The Best Growth Responses Were Observed When Water Was Supplied at Approximately 100% of Field Capacity

Both low and high concentrations of water negatively affected most of the biometric variables observed in tomato plants. Specifically, growth, vegetative development, and fruit production are adversely affected under water stress conditions, which alter anatomy, morphology, and metabolic reactions [15,39,40]. Similar findings were obtained by Lima et al. [41] and Sousa et al. [42], who studied the effects of different irrigation levels on tomato growth, development, and fruit production. They found that plant height increased significantly when water was supplied at 100% of field capacity. Additionally, Brito et al. [43] and Silva et al. [44] demonstrated that under water stress conditions and varying irrigation levels, the number of leaves and flowers increased linearly with increasing soil moisture up to 100% of field capacity. These studies confirm that tomato plants respond most favorably to water levels close to 100% of field capacity. In contrast, Soares et al. [39] observed an increase in tomato plant height with increased irrigation water supply up to 120% of actual evapotranspiration.
Water deficit resulted in smaller stem diameters in our study. Santana et al. [45] similarly found larger stem diameters when providing water at 100% of field capacity at 55, 70, 85, and 100 days after planting (DAP). High water availability can increase stem diameter, and it has been suggested that ample water depths can reduce the likelihood of stem breakage in plants under pressure from heavy fruit loads or wind [46]. However, Lima et al. [41] did not observe significant effects of irrigation water levels on stem diameter.
It is generally accepted that irrigation stimulates flowering in tomato plants, while water deficit leads to fewer flowers [47]. Water deficit alters the plant transpiration process, increasing flower abortion, affecting stomatal conductance and altering metabolic processes crucial for plant growth and development [48,49,50,51]. Studies demonstrate that in tomato crops, the number of flowers per plant increases with higher soil water availability [52,53,54]. Our findings support these observations: we observed that supplying water at 50% of field capacity reduces plant height, leaf length, and flower numbers. Conversely, when irrigation approached 100% capacity, these variables increased. However, contrary to other studies, we found that supplying water above 100% of field capacity decreased plant height, leaf length, and flower production, signaling that stress due to excess water can also negatively affect tomato reproduction. Santana et al. [45] also noted that both excess and deficit of water resulted in morphological changes in tomato plants, including smaller stem diameter and reduced plant height under these conditions. The stress caused by excess water induces anaerobic metabolism in the root system. In situations of hypoxia, when the oxygen supply is insufficient, most cellular functions are compromised, which can lead to the plant’s death [55].

4.2. Tomato Growth Responds More Positively to Fertilization with OM Than with MAP

The agronomic efficiency of organomineral fertilizers for tomato cultivation was studied by Públio [56], who observed significant differences in stem diameter between treated and control plants evaluated at 30 and 45 DAP. When evaluating the effects of OM fertilizers under water deficit conditions (drip irrigation) on tomato growth and fruit production, Almeida et al. [57] noted a significant advantage in using these fertilizers, with OM resulting in larger stem diameters. A larger stem diameter guarantees the ability of plants to translocate nutrients and water to the aerial part to be used in vegetative growth, biomass accumulation, and photosynthetic and metabolic processes [58]. We also found that under water deficit conditions (irrigation depth of 50%), OM is more effective than MAP in increasing plant diameter and ensuring a greater number of flowers. Additionally, we verified that the response of tomato plants to OM application improves with increased water availability, as organomineral fertilizers are slow-release [59]. The release of nutrients is gradual and follows the absorption rate of the plants. Thus, the presence of water can increase the chemical reactive potential of these fertilizers.
Alternatively, we observed that tomato plant growth was negatively impacted by increasing MAP doses, but this did not happen when we increased OM doses. Therefore, OM fertilization seems to be safer when we think about biological stability, since unintentional or unreasonable increases in MAP doses can result in losses in plant development. Our findings on fertilization differ from those reported by Naz et al. [60], where they evaluated the effect of different doses of phosphate fertilizers on tomato growth and development. They concluded that the number of ramifications per plant increased proportionally with increasing P doses, with the greatest plant height and number of ramifications obtained using 130 kg ha−1 of P. In contrast, when we fertilized with MAP, higher plant height, leaf development, and number of branches were achieved at lower doses. High concentrations of MAP can potentially compromise plant growth due to its quick-release nature and high ammoniacal nitrogen content [61].
When higher doses of phosphorus are applied, tomato plants exhibit greater leaf development when treated with OM compared to MAP. The large leaf areas in tomatoes are attributed to the plant’s high capacity to provide photosynthates for draining organs such as new leaves and maintenance of existing leaves [62]. In a study by Grunert et al. [63], organic fertilizer proved to be the superior option, stimulating the largest average leaf area in tomato plants (990.3 cm²).
In general, when fertilizer application doses are non-toxic, P tends to be redistributed from old tissues to newer ones [64,65,66,67], influencing the development of the plant’s aerial parts. The use of OM positively impacts stem diameter and flower number in plants under various irrigation conditions, particularly in over-irrigated tomato plants. Phosphate fertilizers typically enhance the development of morphological traits [68]. Furthermore, increasing P doses can linearly enhance tomato productivity and quality, with significant effects on leaf area. Increases ranged from 96.07 to 130.87 cm² when the dose was increased from 0 to 75 mg of P L−1 [69].

4.3. Tomato Plants under Water Deficit (50% of Field Capacity) Produce More under High P Concentrations

This appears to represent an interesting compensatory mechanism. We observed that tomato plants compensate for low phosphorus doses by increasing productivity under higher water supplies. However, when treated with high phosphorus doses, productivity is higher under lower water percentages. Silva et al. [44] also evaluated fruit productivity in tomato plants subjected to different water depths, and found that the highest productivity (105.86 and 58.60 Mg ha−1) occurred with water depths of 125.47% and 132.11% of crop evapotranspiration, respectively. Indeed, the severe effects of water stress on productivity may be mitigated by the abundant availability of P for plants. P plays a crucial role in plant metabolic processes, including cell division, energy generation, macromolecule biosynthesis, membrane integrity, signal transduction, and photosynthesis [70]. Therefore, the limited water availability affecting P translocation from soil to various plant parts could be detrimental if not compensated by ample P availability in the soil.

5. Conclusions

The growth of tomato plants responded better when water was supplied at close to 100% of field capacity, resulting in greater heights, leaf length, and number of flowers. However, we observed that both excessive and insufficient water led to morphologically affected tomato plants. Furthermore, we also observed that OM is more effective than MAP in increasing plant diameter and ensuring a greater number of flowers, supporting the hypothesis that fertilizing tomatoes with OM can replace the use of MAP. Alternatively, increasing doses of MAP negatively affected tomato growth, suggesting that a 25% application of the recommended dose may yield optimal growth rates, but this did not happen when we increased OM doses. When tomato plants were grown under water deficit (50% of field capacity), they produced more fruit under high concentrations of P. Thus, we deduce that the tomato plant compensates for low phosphorus doses, increasing productivity under higher water availability (125%), whereas higher doses of phosphorus result in greater fruit production under lower water availability (50%).

Supplementary Materials

The following supporting information can be downloaded at: https://www.mdpi.com/article/10.3390/agronomy14081616/s1, Table S1. Analysis of variance for plant height, stem diameter, number of flowers, number of ramifications, number of leaves, leaf length, leaf width, and fruit yield of tomato plants (Solanum lycopersicum L.) grown under different phosphorus rates and sources and subjected to different irrigation supply (% of the field capacity).

Author Contributions

Conceptualization, L.N.S.d.S. and M.B.T.; methodology, L.N.S.d.S., M.B.T., F.A.L.S., and O.P.L.S.; formal analysis, O.P.L.S., and M.N.O.R.; investigation, O.P.L.S. and L.C.V.; resources, M.B.T. and L.N.S.d.S.; writing—original draft preparation, O.P.L.S.; writing—review and editing, L.C.V. and L.A.B.; visualization, L.C.V. and M.N.O.R.; supervision, L.A.B. and M.B.T.; project administration, L.N.S.d.S. All authors have read and agreed to the published version of the manuscript.

Funding

This research received no external funding.

Data Availability Statement

All the data relevant to this manuscript are available on request from the corresponding author.

Acknowledgments

The authors thank the National Council for Scientific and Technological Development (CNPq), Center of Excellence in Exponential Agriculture (CEAGRE), Coordination for the Improvement for Higher Level Personnel (CAPES), Research Support Foundation of the State of Goiás (FAPEG), Ministry of Science, Technology, Innovation, and Communications (MCTIC), and Federal Institute of Education, Science, and Technology Goiano (IF Goiano)—Campus Rio Verde for the financial and structural support to conduct this study.

Conflicts of Interest

The authors declare no conflicts of interest. The funders had no role in the design of the study; in the collection, analyses, or interpretation of data; in the writing of the manuscript; or in the decision to publish the results.

References

  1. Nuez, F. El Cultivo Del Tomate; Ediciones Mundi-Prensa: Madrid, Spain; Barcelona, Spain, 1995. [Google Scholar]
  2. Raemaekers, R.H. Crop Production in Tropical Africa; Directorate General for International Co-operation (DGIC), External Trade and International Co-operation, Ministry of Foreign Affairs: Rome, Italy, 2001; 1540p.
  3. Costa, J.M.; Heuvelink, E.P. The global tomato industry. Tomatoes 2018, 27, 1–26. [Google Scholar]
  4. Alvarenga, M.A.R. Tomate: Produção em Campo em Casa de Vegetação e Hidroponia; UFL: Lavras, Brazil, 2013; 455p. [Google Scholar]
  5. Clement, B.D. Water Issues a Top Concern; The Tomato Magazine; Columbia Publishing: Bogotá, Colombia, 2004; 9p. [Google Scholar]
  6. Andrade, D.E.G.T.; Souza, L.T.; Assis, T.C. Murcha-de-fusário: Importante doença do tomateiro no Estado de Pernambuco. An. Da Acad. Pernambucana De Ciência Agronômica 2009, 6, 243–263. [Google Scholar]
  7. Higuti, A.R.O.; Godoy, A.R.; Salata, A.C.; Cardoso, A.I.I. Produção de tomate em função da “vibração” das plantas. Bragantia 2010, 69, 87–92. [Google Scholar] [CrossRef]
  8. Berni, R.; Romi, M.; Parrotta, L.; Cai, G.; Cantini, C. Ancient tomato (Solanum lycopersicum L.) varieties of tuscany have high contents of bioactive compounds. Horticulturae 2018, 4, 51. [Google Scholar] [CrossRef]
  9. Martínez-Valverde, I.; Periago, M.J.; Provan, G.; Chesson, A. Phenolic compounds, lycopene and antioxidant activity in commercial varieties of tomato (Lycopersicum esculentum). J. Sci. Food Agric. 2002, 82, 323–330. [Google Scholar] [CrossRef]
  10. Eviler, E.; Oztan, A. Production of frankfurters with tomato powder as a natural additive. LWT-Food Sci. Technol. 2011, 44, 307–311. [Google Scholar] [CrossRef]
  11. Lopes Sobrinho, O.P.; Santos, L.N.S.; Soares, F.A.L.; Cunha, F.N.; Vidal, V.M.; Texeira, M.B. General aspects of tomato culture and phosphate fertilization: A systematic review. Comun. Sci. 2022, 13, e3369. [Google Scholar] [CrossRef]
  12. Mordor Intelligence. Tamanho do Mercado de Tomate e Análise de Participação–Tendências e Previsões de Crescimento (2024–2029). 2024. Available online: https://www.mordorintelligence.com/pt/industry-reports/tomato-market (accessed on 13 February 2024).
  13. IBGE. Instituto Brasileira de Geografia e Estatística. Levantamento Sistemático da Produção Agrícola. 2021. Available online: https://biblioteca.ibge.gov.br/visualizacao/periodicos/2415/epag_2021_jan.pdf (accessed on 7 January 2022).
  14. Porto, J.S.; Rebouças, T.N.H.; Moraes, M.O.B.; Bonfim, M.P.; Lemos, O.L.; Luz, J.M.Q. Quality and antioxidant activiy of tomato cultivated under different sources and doses 622 of nitrogen. Rev. Caatinga 2016, 29, 780–788. [Google Scholar] [CrossRef]
  15. Taiz, L.; Zeiger, E.; Moller, I.M.; Murphy, A. Fisiologia e Desenvolvimento Vegetal, 6th ed.; Artmed: Porto Alegre, Brazil, 2017; 888p. [Google Scholar]
  16. Azevedo, W.R.; Faquin, V.; Fernandes, L.A.; Oliveira Júnior, A.C. Disponibilidade de fósforo para o arroz inundado sob efeito residual de calcário, gesso e esterco de curral aplicados na cultura do feijão. Rev. Bras. Ciência Do Solo 2004, 28, 995–1004. [Google Scholar] [CrossRef]
  17. Andrade, C.R.; Santos, J.M.A.; Silva, P.M.R.; Campos, N.M. Produção de tomate rasteiro por irrigação localizada. Rev. Saberes–UniAGES 2017, 1, 18–22. [Google Scholar]
  18. Araújo, V.R.; Bôas, R.L.V.; Jacon, C.P.R.P.; Silva, D.M.P.D.A.; Rodrigues, M.T. Eficiência de adubação fosfatada no cultivo do tomateiro. Irriga 2018, 1, 139–154. [Google Scholar] [CrossRef]
  19. Ya-Dan, D.; Hong-Xia, C.; Shi-Quan, L.; Xiao-Bo, G.; Yu-Xin, C. Response of yield, quality, water and nitrogen use efficiency of tomato to different levels of water and nitrogen under drip irrigation in Northwestern China. J. Integr. Agric. 2017, 16, 1153–1161. [Google Scholar] [CrossRef]
  20. Shabnam, R.; Iqbal, M.T. Understanding phosphorus dynamics on wheat plant under split-root system in alkaline soil. Brazilian J. Sci. Techol. 2016, 3, 19. [Google Scholar] [CrossRef]
  21. Parent, L.E.; Khiari, L.; Pellerin, A. The P fertilization of potato: Increasing agronomic efficiency and decreasing environmental risk. Acta Hortic. 2003, 627, 35–41. [Google Scholar] [CrossRef]
  22. Corrêa, J.C.; Grohskopf, M.A.; Nicoloso, R.D.A.S.; Lourenço, K.S.; Martini, R. Fertilizantes orgânicos, organomineral e minerais com inibidores de urease e nitrificação para trigo e milho sob plantio direto. Pesqui. Agropecuária Bras. 2016, 51, 916–924. [Google Scholar] [CrossRef]
  23. Mazeika, R.; Staugaitis, G.; Baltrusaitis, J. Engineered pelletized organo-mineral fertilizers (omf) from poultry manure, diammonium phosphate and potassium chloride. ACS Sustain. Chem. Eng. 2016, 4, 2279–2285. [Google Scholar] [CrossRef]
  24. Antille, D.L.; Godwin, R.J.; Sakrabani, R.; Seneweera, S.; Tyrrel, S.F.; Johnston, A.E. Field-Scale Evaluation of Biosolids-Derived Organomineral Fertilizers Applied to Winter Wheat in England. Agron. J. 2017, 109, 654–674. [Google Scholar] [CrossRef]
  25. Embrapa–Centro de pesquisa agropecuária do trópico semi-árido. Technical Recommendations for Growing Industrial Tomatoes under Irrigated Conditions; Embrapa–CPATSA: Petrolina, Brazil, 1994; 52p. [Google Scholar]
  26. Chávez, C.; Limón-Jiménez, I.; Espinoza-Alcántara, B.; López-Hernández, J.A.; Bárcenas-Ferruzca, E.; Trejo-Alonso, J. Water-use efficiency and productivity improvements in surface irrigation systems. Agronomy 2020, 10, 1759. [Google Scholar] [CrossRef]
  27. Amirahmadi, E.; Ghorbani, M.; Moudrý, J.; Konvalina, P.; Kopecký, M. Impacts of environmental factors and nutrients management on tomato grown under controlled and open field conditions. Agronomy 2023, 13, 916. [Google Scholar] [CrossRef]
  28. Santos, H.G.D.O.S.; Jacomine, P.K.T.; Anjos, L.H.C.D.O.S.; Oliveira, V.A.D.E.; Lumbreras, J.F.; Coelho, M.R.; Almeida, J.A.D.E.; Araujo Filho, J.C.D.; Oliveira, J.B.D.E.; Cunha, T.J.F. Sistema Brasileiro de Classificação de Solos, 5th ed.; Embrapa: Brasília, Brazil, 2018; 355p. [Google Scholar]
  29. Sousa, D.M.G.; Lobato, E. Cerrado: Correção Do Solo e Adubação, 2nd ed.; Embrapa Informação Tecnológica: Brasília, Brazil, 2004; 416p. [Google Scholar]
  30. Becker, W.F.; Wamser, A.F.; Feltrim, A.L.; Suzuki, A.; Santos, J.P.; Valmorbida, J.; Hahn, L.; Marcuzzo, L.L.; Mueller, S. Sistema de Produção Integrada Para o Tomate 495 Tutorado em Santa Catarina, 1st ed.; Empresa de Pesquisa Agropecuária e 496 Extensão Rural de Santa Catarina (EPAGRI): Florianópolis, Brazil, 2016; 149p. [Google Scholar]
  31. Silva, D.J.H.D.A.; Vale, F.X.R.D.O. Tomate: Tecnologia e Produção; UFV: Viçosa, Brazil, 2007; 355p. [Google Scholar]
  32. Clemente, F.M.V.T.; Boiteux, L.S. Produção de Tomate Para Processamento Industrial; Embrapa: Brasília, Brazil, 2012; 344p. [Google Scholar]
  33. Teixeira, P.C.; Donagemma, G.K.; Fontana, A.; Teixeira, W.G. Manual de Métodos de Análise de Solo, 3rd ed.; Embrapa: Brasília, Brazil, 2017; 57p. [Google Scholar]
  34. Van Genuchten, M.T. A closed form equation for predicting the hydraulic conductivity of unsaturated soils. Soil Sci. Soc. Am. J. 1980, 44, 892–898. [Google Scholar] [CrossRef]
  35. Mualem, Y. A new model for predicting the hydraulic conductivity of unsaturated porous media. Water Resour. Res. 1976, 12, 513–522. [Google Scholar] [CrossRef]
  36. Dourado Neto, D.; Nielsen, D.R.; Hopmans, J.W.; Reichardt, K.; Bacchi, O.O.S.; Lopes, P.P. Software to model soil water retention curves (SWRC, version 2.00). Sci. Agric. 2001, 57, 191–192. [Google Scholar] [CrossRef]
  37. Mantovani, E.C. Avalia: Programa de Avaliação da Irrigação por Aspersão e Localizada; UFV: Viçosa, Brazil, 2001. [Google Scholar]
  38. Ferreira, D.F. Sisvar: A computer statistical analysis system. Cienc. Agrotec. 2011, 35, 1039–1042. [Google Scholar] [CrossRef]
  39. Soares, L.A.A.; Lima, G.S.D.E.; Brito, M.E.B.B.; Sá, F.V.D.A.S.; Araújo, T.T.D.E. Crescimento do tomateiro e qualidade física dos frutos sob estresse hídrico em ambiente protegido. Rev. Verde Agroecol. Desenvolv. Sustentável 2011, 6, 203–212. [Google Scholar]
  40. Lopes Sobrinho, O.P.; Santos, L.N.S.; Silva, A.A.; Soares, F.A.L.; Cunha, F.N.; Vidal, V.M.; Teixeira, M.B.; Silva, E.C.; Silva, N.F.; Costa, A.C. Physiological responses of tomato plants subjected to various combinations of irrigation levels with mineral and organomineral sources of phosphorus. Acta Physiol. Plant. 2022, 44, 108. [Google Scholar] [CrossRef]
  41. Lima, T.P.; Gomes Filho, R.R.; Cadore, R.; Freitas, D.S.; Carvalho, C.M.; Aguiar Netto, A.O.A. Lâminas de irrigação e formas de adubação na produção de tomate de mesa. Rev. Agropecuária Técnica 2017, 38, 18–25. [Google Scholar] [CrossRef]
  42. Sousa, F.G.G.; Carvalho, R.S.C.; Melo, M.R.M.; Sartori, M.M.P.; Grassi Filho, H. Desenvolvimento e produção do tomate cereja irrigado com diferentes concentrações e disponibilidade de água residuária. Irriga 2019, 24, 582–593. [Google Scholar] [CrossRef]
  43. Brito, M.E.B.; Soares, L.A.A.; Lima, G.S.; Sá, F.V.S.; Araújo, T.T.; Silva, E.C.B. Crescimento e formação de fitomassa do tomateiro sob estresse hídrico nas fases fenológicas. Irriga 2015, 20, 139–153. [Google Scholar] [CrossRef]
  44. Silva, C.J.D.A.; Frizzone, J.A.; Silva, C.A.D.A.; Golynski, A.; Silva, L.F.M.D.A.; Megguer, C.A. Tomato yield as a function of water depths and irrigation suspension periods. Rev. Bras. Eng. Agrícola Ambient. 2019, 23, 591–597. [Google Scholar] [CrossRef]
  45. Santana, M.J.D.E.; Vieira, T.A.; Barreto, A.C.; Cruz, O.C. Resposta do tomateiro irrigado a níveis de reposição de água no solo. Irriga 2010, 15, 443–454. [Google Scholar] [CrossRef]
  46. Seleguini, A.; Seno, S.; Faria Júnior, M.J.A. Híbridos de tomateiro industrial cultivados em ambiente protegido e campo aberto. Científica 2007, 35, 80–87. [Google Scholar]
  47. Fawzy, Z.F. Effect of irrigation systems on vegetative growth, fruit yield, quality and irrigation water use efficiency of tomato plants (Solanum lycopersicum L.) grown under water stress conditions. Acta Sci. Agric. 2019, 3, 172–183. [Google Scholar]
  48. Picanço, M.; Leite, G.L.D.; Guedes, R.N.C.; Silva, E.A. Yield loss in trellised tomato affected by insecticidal sprays end plant spacing. Crop Prot. 1998, 17, 447–452. [Google Scholar]
  49. Silva, A.C.T.F.; Leite, I.C.; Braz, L.T. Avaliação da viabilidade do pólen como possível indicativo de tolerância a altas temperaturas em genótipos de tomateiro. Rev. Bras. Fisiol. Veg. 2000, 12, 156–165. [Google Scholar] [CrossRef]
  50. Andriolo, J.L. Fisiologia da produção de hortaliças em ambiente protegido. Hortic. Bras. 2000, 18, 26–33. [Google Scholar]
  51. Costa, C.A.; Silva, A.C.; Sampaio, R.A.; Martins, E.R. Productivity of determinate growth tomato lines tolerant to heat under the organic system. Hortic. Bras. 2011, 29, 590–593. [Google Scholar] [CrossRef]
  52. Silva, J.M.D.A.; Ferreira, R.S.; Melo, A.S.D.; Suassuna, J.F.; Dutra, A.D.; Gomes, J.P. Cultivo do tomateiro em ambiente protegido sob diferentes taxas de reposição da evapotranspiração. Rev. Bras. Eng. Agrícola Ambient. 2013, 17, 40–46. [Google Scholar] [CrossRef]
  53. Silva, J.A.; Dutra, A.F.; Cavalcate, N.M.S.; Melo, A.S.; Silva, F.G.; Silva, J.M. Aspectos agronômicos do tomateiro “Caline Ipa 6” cultivado sob regimes hídricos em área do semiárido. Agro@Mbiente-Line 2014, 8, 336–344. [Google Scholar] [CrossRef]
  54. Santiago, E.J.P.; Oliveira, G.M.; Leitão, M.; Rocha, R.C.; Pereira, A.V.A. Yield characteristics of cherry tomato cultivated with and without shading screen at different irrigation levels. Pesqui. Agropecuária Trop. 2018, 48, 374–381. [Google Scholar] [CrossRef]
  55. Loreti, E.; Perata, P. The many facets of hypoxia in plants. Plants 2020, 9, 745. [Google Scholar] [CrossRef]
  56. Públio, A.P.P.B. Desempenho do Tomateiro Híbrido Trucker em Função da Adubação Organomineral. Ph.D. Thesis, Universidade Estadual do Sudoeste da Bahia, Vitória da Conquista, Brazil, 2017; 279p. [Google Scholar]
  57. Almeida, M.J.; Sousa, C.M.; Rocha, M.C.; Benites, V.M.; Polidoro, J.C. Reposição deficitária de água e adubação com organomineral no crescimento e produção de tomateiro industrial. Irriga 2019, 24, 69–85. [Google Scholar] [CrossRef]
  58. Mazzoni-Viveiros, S.C.; Trufem, S.F.B. Efeitos da poluição aérea e edáfica no sistema radicular de Tibouchina pulchra Cogn. (Melastomataceae) em área de mata Atlântica: Associações micorrízicas e morfologia. Rev. Bras. Botânica 2004, 27, 337–589. [Google Scholar] [CrossRef]
  59. Barbosa, N.S.; Luz, M.S.D.; Sousa, N.G.; Santos, K.G.D. Development and evaluation of slow-release organomineral phosphate fertilizer based on coffee waste. Cienc. Agrotec. 2024, 48, e018323. [Google Scholar] [CrossRef]
  60. Naz, N.; Khan, I.; Gul, B.; Ayub, G.; Jan, F.; Jang, N.; And Shuaib, M. Response of tomato (Lycopersicon esculentum Mill.) growth to different phosphorous levels and sowing dates. Acta Ecol. Sin. 2019, 39, 30–35. [Google Scholar] [CrossRef]
  61. Yossıf, A.M.; Gezgin, S. Influence of mono-ammonium and di-ammonium phosphate on phosphorus use efficiency of maize and bread wheat plants. Selcuk. J. Agric. Food Sci. 2019, 33, 99–105. [Google Scholar] [CrossRef]
  62. Martín-Hernández, S.C.; Trejo-Téllez, L.I.; Gómez-Merino, F.C.; Volke-Haller, V.H.; Escalante-Estrada, J.A.; Sánchez-García, P.; Saucedo-Veloz, C. Nitrogen and potassium nutrition differentially affect tomato biomass and growth. Interciencia 2016, 41, 60–66. [Google Scholar]
  63. Grunert, O.; Robles-Aguilar, A.A.; Hernandez-Sanabria, E.; Schrey, S.D.; Reheu, D.; Labeke, M.C.V.; Vlaeminck, S.E.; Vandekerckhove, T.G.L.; Mysara, M.; Monsieurs, P.; et al. Tomato plants rather than fertilizers drive microbial community structure in horticultural growing media. Sci. Rep. 2019, 9, 9561. [Google Scholar] [CrossRef] [PubMed]
  64. Horowitz, N.; Meurer, E.J. Eficiência Agronômica Dos Fosfatos Naturais; Yamada, T., Abdalla, S.R.S., Eds.; Fósforo na Agricultura Brasileira: Piracicaba, Brazil, 2004; 688p. [Google Scholar]
  65. Malavolta, E. Manual de Nutrição Mineral de Plantas; Agronômica Ceres: São Paulo, Brazil, 2008; 638p. [Google Scholar]
  66. Prado, R.M. Nutrição de Plantas; UNESP: São Paulo, Brazil, 2008; 407p. [Google Scholar]
  67. Moura, W.M.; Lima, P.C.; Casali, V.W.D.; Pereira, P.R.G. Eficiência nutricional para fósforo em linhagens de pimentão. Hortic. Bras. 2001, 19, 306–312. [Google Scholar] [CrossRef]
  68. Filgueira, F.A.R. Novo Manual de Olericultura: Agrotecnologia Moderna na Produção e Comercialização de Hortaliças, 3rd ed.; Universidade Federal de Viçosa: Viçosa, Brazil, 2013; 421p. [Google Scholar]
  69. Sousa, M.C.; Rodrigues, L.F.O.S.; Silva, M.B.; Cruz, J.O.; Diamante, M.S.; Martins, B.N.M.; Simonetti, L.M.; Rodrigues, J.D. Productive and qualitative performance of tomato plants as a function of the application of plant growth regulators and mineral nutrients. Rev. Colomb. Cienc. Hortic. 2018, 12, 416–424. [Google Scholar] [CrossRef]
  70. Hawkesford, M.J.; Cakmak, I.; Coskun, D.; De Kok, L.J.; Lambers, H.; Schjoerring, J.K.; White, P.J. Functions of macronutrients. In Marschner’s Mineral Nutrition of Plants; Academic Press: Cambridge, MA, USA, 2023; pp. 201–281. [Google Scholar]
Figure 1. Plant height (a), stem diameter (b), number of flowers (c), and leaf length (d) of tomato (Solanum lycopersicum L.) plants subjected to different irrigation levels (percentage of field capacity). Data observed at 96 DAP. The straight lines represent the fitted model, and the prediction intervals (95%) are in gray. The SE values are associated with the means. In the equations, * significant at 5% and ** significant at 1%.
Agronomy 14 01616 g001
Figure 2. Biometric growth pattern observed in tomato plants (Solanum lycopersicum L.) subjected to different irrigation levels (percentage of field capacity).
Agronomy 14 01616 g002
Figure 3. Stem diameter (a) and number of flowers (b) of tomato plants (Solanum lycopersicum L.) subjected to different irrigation levels (percentage of field capacity) and two phosphorus sources (monoammonium phosphate—MAP and organomineral—OM). Data observed at 96 DAP. The straight lines represent the fitted model, and the prediction intervals (95%) are in gray. The SE values are associated with the means. In the equations, * significant at 5% and ** significant at 1%.
Agronomy 14 01616 g003
Figure 4. Stem diameter (a) and number of flowers (b) of tomato plants (Solanum lycopersicum L.) subjected to different irrigation levels (percentage of field capacity) and two phosphorus sources (monoammonium phosphate—MAP and organomineral—OM). SE values and letters obtained from the Tukey test (p < 0.05) are shown above the bars. In each irrigation level, averages followed by the same letters do not differ significantly from each other.
Agronomy 14 01616 g004
Figure 5. Plant height (a), stem diameter (b) and number of ramifications (c) of tomato plants (Solanum lycopersicum L.) subjected to different doses of P2O5 provided by two phosphorus sources (monoammonium phosphate—MAP and organomineral—OM). Data observed at 96 DAP. The straight lines represent the fitted model, and the prediction intervals (95%) are in gray. The SE values are associated with the means. In the equations, ** significant at 1%.
Agronomy 14 01616 g005
Figure 6. Number of leaves (a), leaf length (b), leaf width (c) and leaf area (d) of tomato plants (Solanum lycopersicum L.) subjected to different doses of P2O5 provided by two phosphorus sources (monoammonium phosphate—MAP and organomineral—OM). Data observed at 96 DAP. The straight lines represent the fitted model, and the prediction intervals (95%) are in gray. The SE values are associated with the means. In the equations, * significant at 5% and ** significant at 1%.
Agronomy 14 01616 g006
Figure 7. Plant height (a), stem diameter (b), and number of ramifications (c) of tomato plants (Solanum lycopersicum L.) subjected to different doses of P2O5 provided by two phosphorus sources (monoammonium phosphate—MAP and organomineral—OM). SE values and letters obtained from the Tukey test (p < 0.05) are shown above the bars. In each irrigation level, averages followed by the same letters do not differ significantly from each other.
Agronomy 14 01616 g007
Figure 8. Number of leaves (a), leaf length (b), leaf width (c), and leaf area (d) of tomato plants (Solanum lycopersicum L.) subjected to different doses of P2O5 provided by two phosphorus sources (monoammonium phosphate—MAP and organomineral—OM). SE values and letters obtained from the Tukey test (p < 0.05) are shown above the bars. In each irrigation level, averages followed by the same letters do not differ significantly from each other.
Agronomy 14 01616 g008
Figure 9. Fruit yield of tomato plants (Solanum lycopersicum L.) subjected to different irrigation levels (percentage of field capacity) and different doses of P2O5 provided by two phosphorus sources (monoammonium phosphate—MAP and organomineral—OM). Data observed at 96 DAP and demonstrated for specific doses of 100% (a) and 200% (b) phosphorus and for 50% of field capacity (c). At a P dose of 100%, the highest fruit productivity occurred under the highest irrigation level (125%), whereas at 200% P, the highest productivity occurred at 50% of field capacity (d). The straight lines represent the fitted model, and the prediction intervals (95%) are in gray. The SE values are associated with the means. In the equations, ** significant at 1%. In (d), the arrows correspond to the increase or decrease in the P dose and the blue bands correspond to the percentage of irrigation water.
Agronomy 14 01616 g009
Table 1. Physicochemical characteristics of the dystroferric red latosol used for planting tomatoes (Solanum lycopersicum L.) grown under different phosphorus rates and sources and subjected to different irrigation supply percentages (percentage of field capacity).
CaMgCa+MgAlH+AlKKSPCaCl2
----------------- cmolc dm−3 -------------------------- mg dm−3 ---------pH
0.940.861.80.032.390.321265.01.095.2
NaFeMnCuZnBCECSBV%m%
--------------- mg dm−3 ------------------cmolc dm−3V%m%
1.021.422.524.251.130.094.512.12471.4
Texture (g kg−1)OMCa/MgCa/KMg/KCa/CECMg/CECK/CEC
ClaySiltSandg dm−3----------------- Relationship between bases -----------------
4508047036.31.12.92.720.8419.077.10
P (phosphorus)—Mehlich 1, K (potassium), Na (sodium), Cu (copper), Fe (iron), Mn (manganese) and Zn (zinc)—Melich 1; Ca (calcium), Mg (magnesium) and Al (aluminum)—KCl 1 mol L−1; S (sulfur)—Ca (H2PO4)2 0.01 mol L−1; OM—colorimetric method; B (boron)—hot water; CEC—cation exchange capacity; SB—sum of bases; V%—base saturation; m%—aluminum saturation; and OM—organic matter.
Disclaimer/Publisher’s Note: The statements, opinions and data contained in all publications are solely those of the individual author(s) and contributor(s) and not of MDPI and/or the editor(s). MDPI and/or the editor(s) disclaim responsibility for any injury to people or property resulting from any ideas, methods, instructions or products referred to in the content.

