Article

Suitable Water–Fertilizer Management and Ozone Synergy Can Enhance Substrate-Based Lettuce Yield and Water–Fertilizer Use Efficiency

by
Qingqing Zhao
,
Shulong Guo
,
Junjie Feng
,
Dongwei Li
,
Shenjiao Yang
and
Xinguo Zhou
*
Farmland Irrigation Research Institute, Chinese Academy of Agricultural Sciences, 380 Hongli Avenue East, Xinxiang 453002, China
*
Author to whom correspondence should be addressed.
Agronomy 2024, 14(8), 1619; https://doi.org/10.3390/agronomy14081619
Submission received: 24 May 2024 / Revised: 10 July 2024 / Accepted: 20 July 2024 / Published: 24 July 2024

Abstract

:
As living standards rise, enhancing quality has become a central objective for many researchers. Soilless cultivation, known for its efficient use of resources, is increasingly used in vegetable production. It is critical to develop effective water and fertilizer management strategies to achieve high-quality yields and promote sustainable development in modern agriculture. This study employed an orthogonal experimental design to assess the impact of varying nutrient solution concentrations (50%, 75%, 100%, and 125% of Hoagland’s), lower irrigation thresholds (40%, 55%, 70%, and 85% field capacity (FC)), and ozone concentrations (0, 1, 2, and 4 mg·L−1) on lettuce growth, yield, quality, and water–fertilizer use efficiency. The results indicated that fixed nutrient solution concentrations and lower irrigation thresholds enhanced growth metrics for lettuce. Similarly, increasing ozone concentrations initially improved, then reduced growth metrics when the lower irrigation threshold was constant. Furthermore, maintaining stable ozone concentrations while raising the nutrient solution concentration initially boosted, then diminished, growth indicators. Optimal conditions for water and fertilizer management were identified at a nutrient solution concentration of 75% to 100% and an ozone concentration of 0 to 1 mg·L−1. Variance analysis highlighted the significant effects of nutrient solution concentration, lower irrigation thresholds, and ozone concentrations on lettuce yield, quality, and water and fertilizer use efficiency. Range analysis revealed the optimal management combination to be a nutrient solution concentration of 100%, an 85% lower FC irrigation threshold, and an ozone concentration of 1 mg·L−1, yielding 16.82 t·ha−1 of lettuce and a water use efficiency of 40.14 kg·m−3. These findings provide theoretical support for the sustainable advancement of soilless cultivation in contemporary agriculture.

1. Introduction

Countries worldwide face challenges due to limited land availability, high population density, and constrained agricultural spaces [1]. In response to growing food demands, producers often overuse water and fertilizers to maximize yields, which in turn leads to inefficiencies and environmental pollution. Soilless culture presents an effective alternative, optimizing the use of natural and land resources. Extensive research has validated its capacity to deliver high yields, superior quality, and ease of management [2,3]. Consequently, developing soilless cultivation models that improve yield, quality, and environmental sustainability is essential for advancing modern agriculture.
Substrate cultivation, a soilless culture technique, supplies plants with nutrients in liquid form [4] and supports lettuce growth in a controlled environments like greenhouses to mitigate adverse conditions [3,5]. This method, particularly when integrated with tidal irrigation, not only conserves resources such as fertilizer, water, and labor but also minimizes pest and disease incidence [6,7]. Additionally, it yields advantages such as reduced growth cycles, cost efficiency, and the possibility of nutrient solution reuse [8,9,10]. Focusing on water and nutrient management is essential in substrate cultivation research, especially regarding irrigation’s impact on lettuce yield and quality. For instance, studies indicate that lettuce grown at 50% field water capacity exhibits significantly higher vitamin C content compared to that grown with other treatments [11]. Further, Yazgan et al. [12] found that optimal yields in greenhouse-grown lettuce in Turkey were achieved at irrigation levels of 100% and 75%, with yields of 15.1 and 12.01 kg·ha−1, respectively. Moreover, nutrient solutions, as opposed to traditional fertilizers, have shown superior results in enhancing lettuce quality over three cycles [13]. Thus, selecting nutrient solutions that meet the specific nutritional needs of lettuce is crucial for maximizing the benefits of substrate cultivation, ensuring a balanced supply of essential nutrients for optimal growth [14]. Research indicates that within optimal ranges, increasing the concentration of nutrient solutions can enhance chlorophyll levels in leaves, boost photosynthesis, improve overall quality [15], and subsequently elevate yields [16]. However, excessively high concentrations may inhibit plant growth [17], diminish root vigor [18], and negatively affect both yield and quality [19]. However, there are conflicting views regarding the influence of nutrient solution on both lettuce yield and quality. It has been noted that the application of nutrient solution substantially decreases nitrate content in lettuce without compromising yield [20]. Therefore, identifying the optimal nutrient solution concentration under substrate cultivation conditions is crucial. To this end, a systematic study is necessary to define effective water–fertilizer optimization strategies while addressing issues related to fertilizer loss and contamination of nutrient solutions.
Ozone, when dissolved in water, acts as a potent oxidant with extensive bactericidal properties [21,22]. It decomposes into oxygen at room temperature, avoiding secondary pollution and leaving no residual toxicity, thus positioning it as an ideal green oxidizing agent. Ozone finds widespread use in various sectors, including medical treatment [23], food preservation [24], chemical production [25], and wastewater treatment [26]. In agriculture, ozone’s applications are expanding as an alternative to traditional pesticides and disinfectants. It is used for disinfecting nutrient solutions and substrates [27,28] and managing soil-borne pests and diseases [29,30,31]. For instance, in tomato cultivation, applying ozone concentrations of 3.0 mg·L−1 in irrigation and 0.6 mg·L−1 in spraying significantly enhances the activity of antioxidant enzymes in tomato leaves [32]. Spraying ozonated water at concentrations below 10 mg·L−1 has been shown to bolster tomato defenses against plant pathogens [33]. Furthermore, ozone concentrations ranging from 10 to 40 mg·L−1 have been found to enhance pepper germination and seedling growth under low-temperature stress [34]. However, exposure to gaseous ozone at 66 ppb can stress soybeans, leading to reduced mid-season yields [35]. In the context of lettuce cultivation, ozone application significantly affects yield outcomes. Under O3-I conditions, an increase in yield is observed, whereas O3-II conditions lead to a notable decrease compared to controls. Despite these variations, high ozone concentrations, up to 4.0 mg·L−1, do not affect lettuce development or root antioxidant capacity [36]. This indicates that ozone oxidation in nutrient solutions could serve as an effective alternative disinfection method, potentially reducing both water wastage and chemical residues from traditional disinfectants. Although ozone has demonstrated promising outcomes in crops such as peppers, tomatoes, and soybeans, research on its applications in substrate-cultivated lettuce remains underemployed. Despite the beneficial results observed in these other crops, the focus has largely been outside lettuce cultivation systems. Consequently, there is a need for further research into optimal water and fertilizer management practices for lettuce, particularly under conditions regulated by ozone application.
This study explored the impact of varying nutrient solution concentrations, lower irrigation thresholds, and ozone concentrations on lettuce growth, yield, quality, and water–fertilizer use efficiency. Utilizing a three-factor, four-level orthogonal test design, this investigation employed a two-crop lettuce growth model with Hoagland’s formulated nutrient solution. The objectives were to: (1) evaluate the influence of different treatments on various parameters including water content of lettuce shoots, NPK concentration and uptake, biomass, plant height and crown diameter, yield, quality, water use efficiency, and NPK use efficiency in lettuce; (2) investigate the mechanisms through which lettuce yield and water–fertilizer use efficiency respond to the interactions among water, fertilizer regulation, and ozone interactions; and (3) determine optimal irrigation and fertilization management practices to improve the quality and efficiency of lettuce in soilless cultivation systems.

2. Materials and Methods

2.1. Location and Environmental Conditions

This research was carried out from March to June 2023 in a greenhouse located at the Institute of Agricultural Irrigation, Chinese Academy of Agricultural Sciences, located at 35°18′13.71″ N, 113°55′15.05″ E on the Huang-Huai-Hai Plain. This region has a warm temperate zone with semi-humid and semi-arid conditions. The area records an average annual precipitation of 580 mm and an annual mean temperature of 13.5 °C, alongside a cumulative temperature sum of 5070 °C. The locality benefits from 2497 h of sunshine per year, a frost-free period of 220 days, and a potential evapotranspiration rate of 2000 mm annually.
The sunlight greenhouse used for this study spans 44 m in length and 25 m in width, covering a total cultivation area of 1000 m2. It is oriented in a north–south direction with crop rows aligned east–west. Manual control of indoor air temperature and relative humidity was achieved through overhead shade nets and side ventilation openings. When indoor temperatures rose above 30 °C, these mechanisms were employed to stabilize temperatures around 25 °C. Conversely, when temperatures fell below 15 °C, the ventilation remained open, except during rainfall, until the experiment’s end. Daily average temperature and relative humidity data for the two cropping cycles are presented in Figure 1.

2.2. Substrate Physical Characteristics

The experimental substrate used in this study was a blend of peat, vermiculite, and perlite at a 2:1:1 volumetric ratio, provided by the QiLu Horticultural Nutrient Soil Company (Dalian, China). This substrate is noted for its excellent water permeability and moisture retention properties. Comprehensive details on its physical and chemical characteristics are presented in Table 1 and Table 2, respectively.

2.3. Plant Material

The lettuce variety ‘Hongsheng 1’ for this experiment was supplied by Zhongshu Seed Industry Technology (Beijing) Co., Ltd. (Beijing, China) Seeds were pre-soaked and then sown in a 128-hole tray filled with the described mixed substrate. The tray was then placed in a smart climate chamber (purchased from Zhejiang Top Cloud Agricultural Technology Co., Ltd., Hangzhou, China, model RTOP-268Y). Chamber conditions were maintained at daytime/nighttime temperatures of 25 ± 3 °C/15 ± 3 °C, relative humidity of 65 ± 5%, a 12-h photoperiod, and a light intensity of 200 µmol·m−2·s−1. Bottom irrigation with a 1/2 Hoagland nutrient solution commenced once the seedling cotyledons were fully spread and was administered twice daily at approximately 1 L per tray. Transplantation occurred when the seedlings had developed 4–5 true leaves, typically around 25 days post-sowing.

2.4. Experimental Design and Treatments

In alignment with previous research [37,38,39], the study employed an orthogonal experiment L16 (43) with three factors: nutrient solution concentration, lower irrigation threshold, and ozone concentration, each at four levels. The levels for each factor were as follows:
Nutrient solution concentration: 50% (F1), 75% (F2), 100% (F3), and 125% (F4) of standard Hoagland’s nutrient solution (see Table 3 for its formula).
Lower irrigation threshold: 40% (W1), 55% (W2), 70% (W3), and 85% (W4).
Ozone concentrations: 0 mg·L−1 (O1), 1 mg·L−1 (O2), 2 mg·L−1 (O3), and 4 mg·L−1 (O4). This setup generated sixteen treatments (see Table 4), each replicated four times. Each treatment comprised 36 pots, with dimensions as follows: bottom diameter 11 cm, top diameter 16 cm, and depth 12 cm. Each pot hosted one lettuce plant, with both plant-to-plant and row spacing maintained at 20 cm.

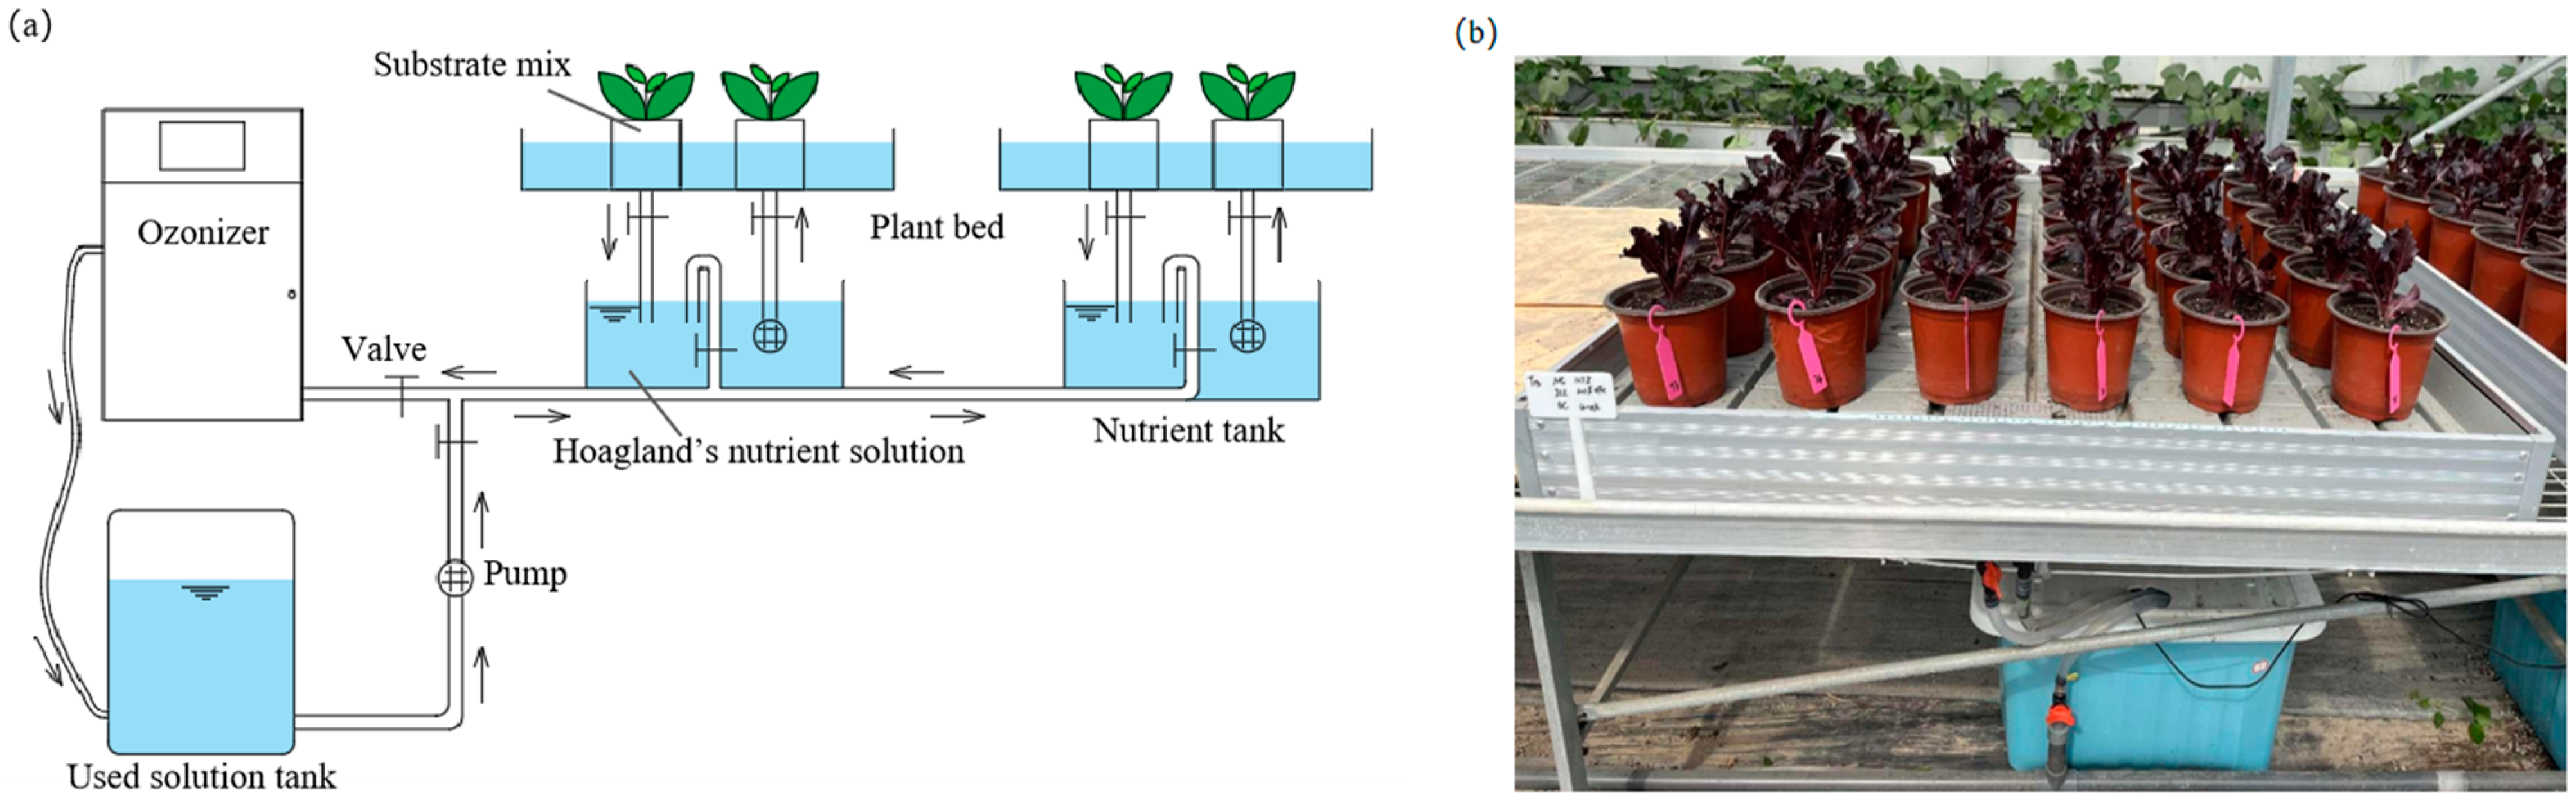
2.5. Soilless Culture Setup

The soilless cultivation system is illustrated in Figure 2 and primarily comprised planting beds, nutrient solution storage tanks, waste liquid tanks, and ozone treatment devices. The planting beds were made from eco-friendly ABS material, measuring 122 × 129 × 5 cm, and equipped with inlet and outlet ports for tidal irrigation. The nutrient solution storage tank, measuring 61 × 43 × 34 cm, featured a 12 V mini DC self-priming water pump with an 8 L·min−1 flow rate. Manual irrigation control was achieved through a water pump switch, with a steel ruler inside the tank to monitor the nutrient solution level (up to 35 cm). A waste liquid tank of identical dimensions collected the used nutrient solution post-ozone disinfection. The ozone treatment setup includes an oxygen generator (200 K, Delixi, Shanghai, China), a high-pressure ozone generator (ZY-A30, Guangzhou, China), and an ozone gas–liquid mixing reactor with a capacity of 120 L. The titanium microscopic aerator within this system maintains a flow rate of 25 L·min−1, producing an ozone concentration between 65 to 85 mg·L−1. After irrigation, the ozone generator is activated to sterilize the nutrient solution.
For all treatments, the upper limit of irrigation aligned with the substrate’s field water holding capacity. Six uniformly grown lettuce pots were selected per treatment. Daily weigh-ins at 8 a.m. determined when irrigation was needed, based on the average weight nearing the per-set lower irrigation threshold. During irrigation, weights were recorded every three minutes. Once the upper irrigation limit was reached, the water pump switch was manually turned off. The drainage valve was then opened to remove any excess nutrient solution, which was collected in the waste liquid tank after ozone disinfection for reuse. This approach effectively recycled the nutrient solution, ensuring sustainable use.

2.6. Nutrient Solution Management

The experiment began with the preparation of stock solutions for each reagent based on Hoagland’s formula in the laboratory. These stock solutions were subsequently diluted according to the specific requirements of each treatment outlined in the experimental design. To ensure uniformity, the diluted nutrient solutions were thoroughly mixed. For optimal lettuce growth conditions, the pH of all nutrient solutions was adjusted to 6.50 ± 0.03 using 1 mol·L−1 H2SO4 or NaOH. The initial electrical conductivity (EC) and pH for each treatment’s nutrient solution were measured using a portable water quality tester (EC: 0–10,000 µS·cm−1; pH: 0–14), as detailed in Table 3. Throughout the experiment, the EC and pH levels were measured twice daily. Adjustments were made as necessary: tap water was added if the EC was too high or fresh nutrient solution was added if the EC was too low, maintaining consistent nutrient concentration and aligning with the initial values throughout the growth period.

2.7. Analysis and Methods

The two rounds of experiments were conducted on 15 March and 27 April, with harvests occurring on 20 April and 2 June, spanning a duration of 37 days. Beginning 7 d after transplantation, four representative lettuce plants were selected from each treatment every 6 d, with each treatment being replicated four times. Specific sampling times are detailed in Table 5. These plants were evaluated for lettuce plant height and crown diameter, shoot fresh and dry weights, root fresh and dry weights, and other related indices. Data collected at lettuce harvesting were compiled and analyzed to draw the corresponding conclusions.
(1)
Measurement of lettuce growth indicators:
Plant height (cm) was measured from the lettuce stem to the highest leaf position using a straightedge (range: 50 cm). Crown diameter was determined by measuring the distance across and from the front to the back of the lettuce using a straightedge (range: 50 cm), averaging these measurements.
(2)
Measurement of lettuce biomass and water content:
Shoot and fresh root weights (g) were acquired by cutting lettuce from the stem and segregating it accordingly. After the root was washed with distilled water and dried with filter paper, fresh weights were measured using a micrometer balance. The dry weights of the lettuce shoot and root parts were calculated by drying cleaned lettuce parts in an oven at 105 °C for 30 min, followed by 85 °C until constant weight. The water content of the lettuce shoot (%) was computed as follows:
W c ( % ) = f w d w d w × 100 %
where ‘fw’ is the fresh shoot weight of an individual lettuce plant (g) and ‘dw’ is the dry shoot weight of an individual lettuce plant (g).
(3)
Measurement of lettuce nutrients:
Nitrogen content was measured using a flow analyzer, phosphorus content using the Mo-Sb colorimetric method, and potassium content using the flame photometric method (dry matter, crushed through a 0.25 mm screen, and decocted with H2SO4-H2O2). Plant uptake of these nutrients was computed as the product of shoot dry matter and nutrient concentration. Fertilizer use efficiency (%) was computed using the following formula for nitrogen, phosphorus, and potassium:
N U E = T N A N F R
where NUE is N use efficiency, TNA is the shoot lettuce nitrogen accumulation (kg·ha−1), and NFR is the amount of N fertilizer applied (kg·ha−1).
(4)
Measurement of lettuce quality:
Vitamin C (VC) content was measured using the 2,6-dichloroindophenol titration method, nitrate content using the colorimetric method with salicylic acid, soluble sugar content using anthrone colorimetry, and soluble protein content using Coomassie brilliant blue G-250 (CB-BG-250).
The water use efficiency (WUE) of a single lettuce plant is computed as follows:
W U E = f w c w
where ‘fw’ is the fresh shoot weight of an individual lettuce plant (kg) and ‘cw’ is the water consumption of a single lettuce plant (m3).

2.8. Data Processing

Statistical analysis, correlation analysis, and significance testing (p < 0.05) were performed on data from the two-crop trials using the GLM program in SPSS (version 21.0, IBM Corporation, Armonk, NY, USA). Duncan’s multiple comparison tests were utilized to compare means. Tukey’s honest significant difference (HSD) test was used to analyze the interaction effects of various factors. The experimental data were statistically and graphically analyzed using Excel 2010 and Origin 2021.

3. Results

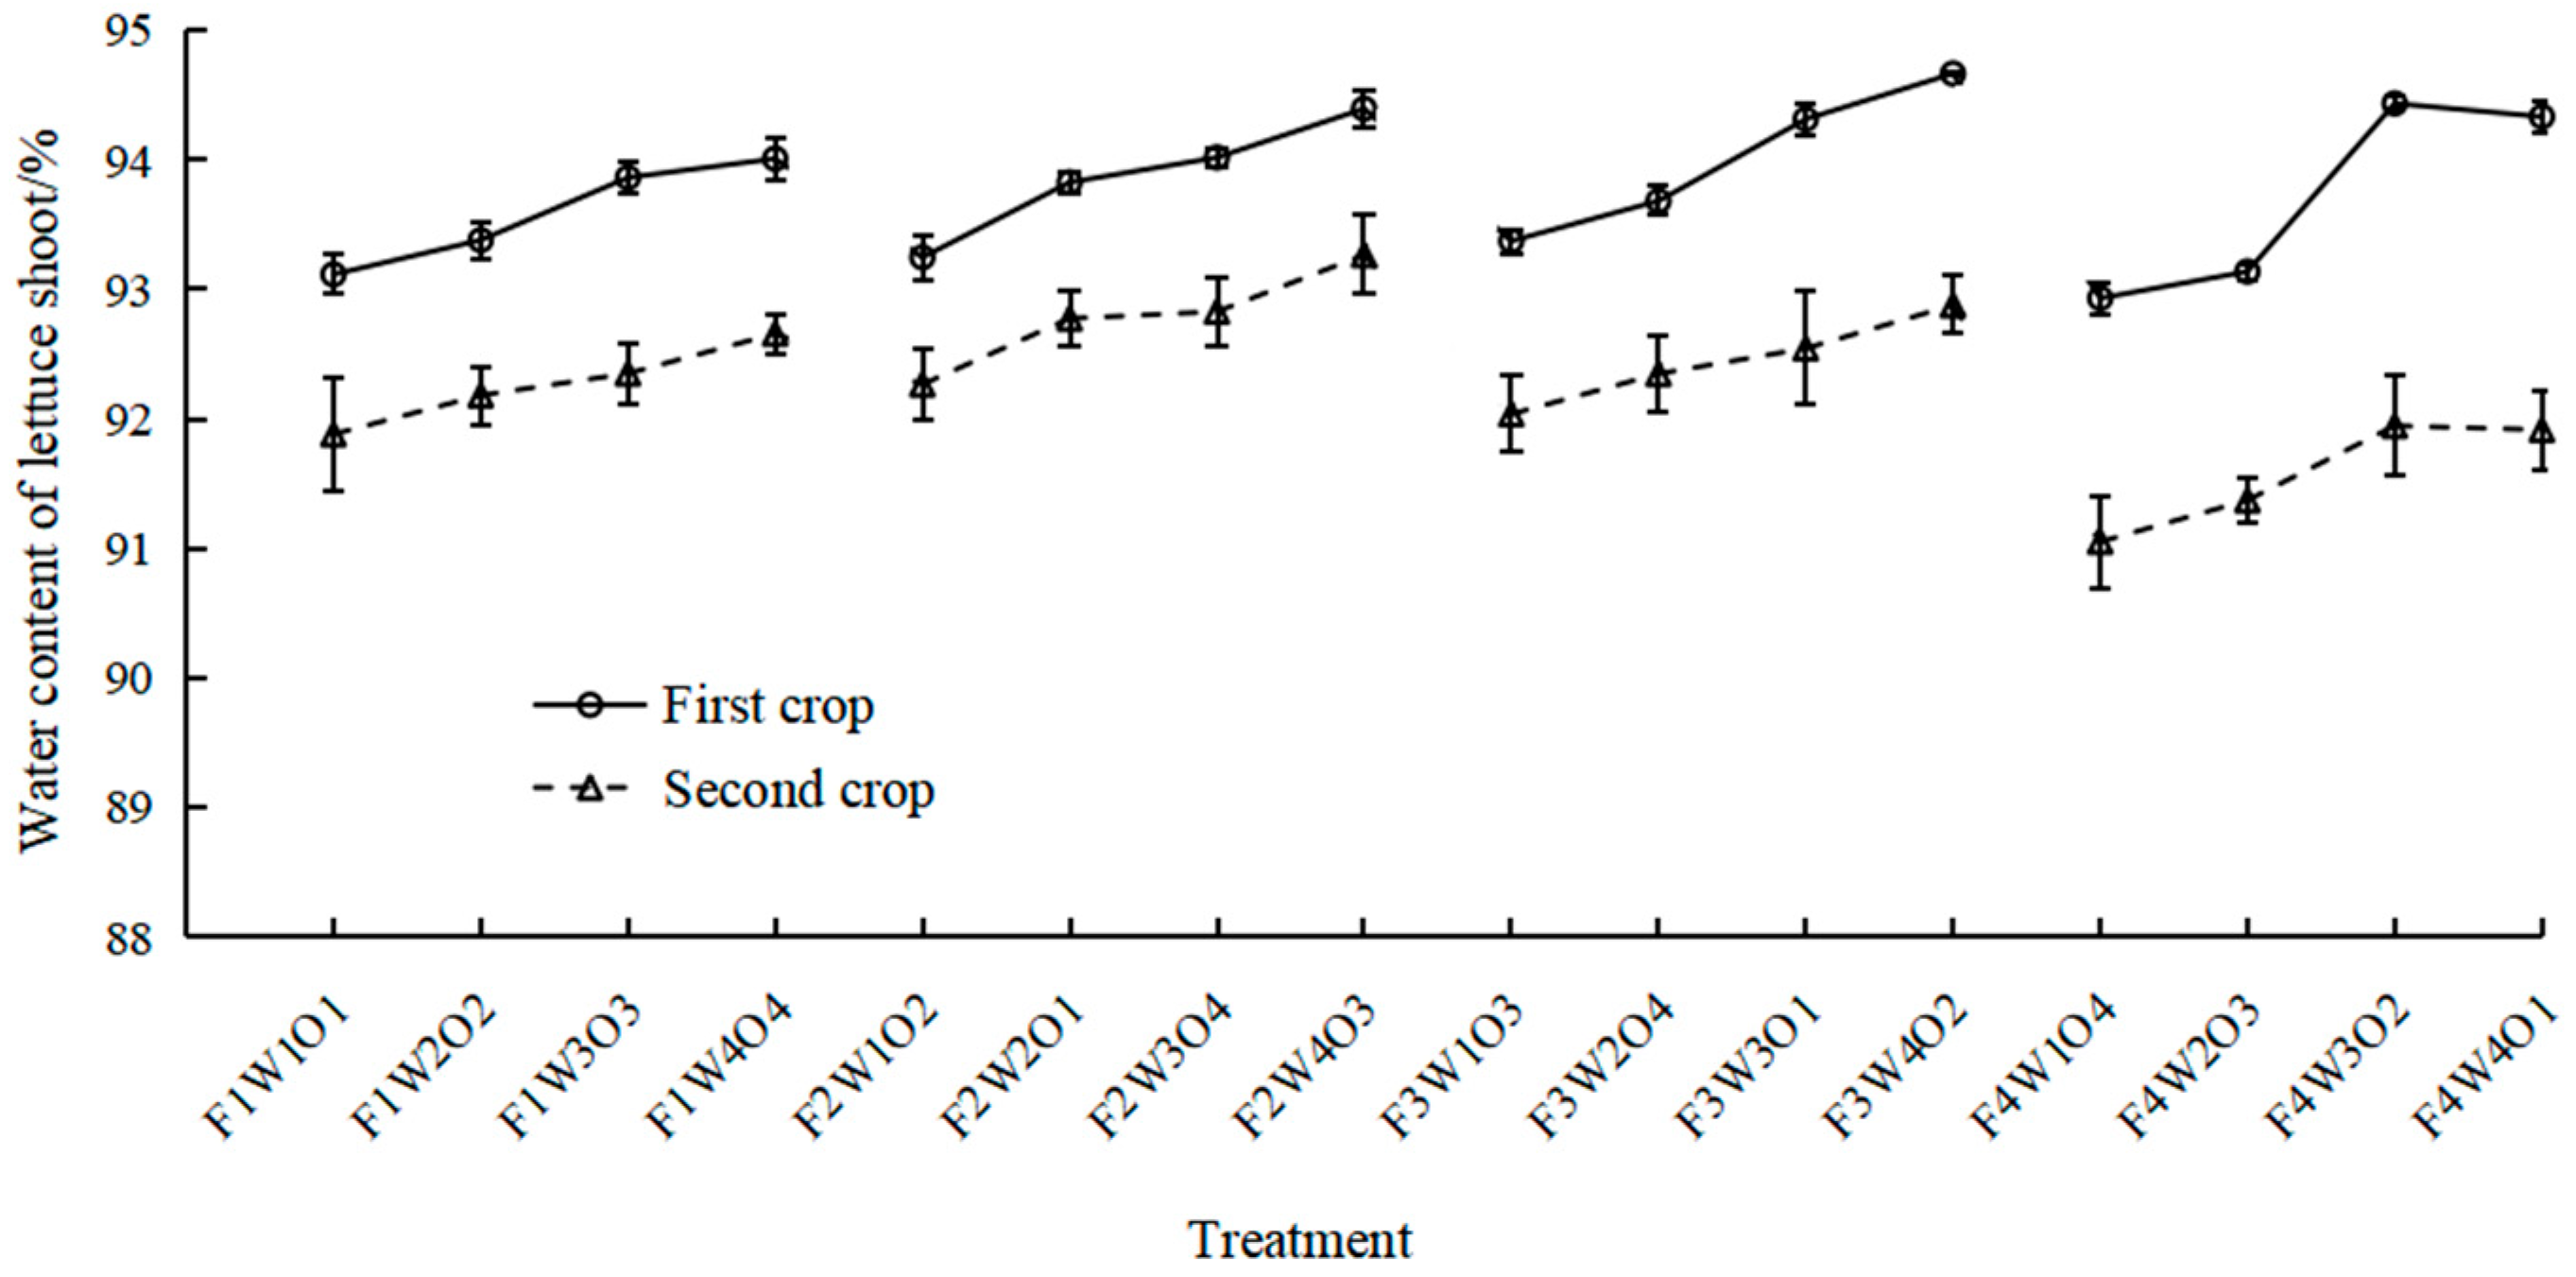
3.1. Effect of Different Treatments on Water Content of Lettuce Shoots

The graph highlights distinct responses to water content based on variations in nutrient solution concentration, irrigation threshold (W), and ozone concentration (O) (Figure 3). The analysis also revealed that shoot water content trends remained stable across different treatment factors. Within the same nutrient solution concentration (F), shoot water content increased with increasing lower irrigation threshold (W). Similarly, with the same nutrient solution concentration (F), increasing ozone concentration (O) initially increased shoot water content before reaching a peak and declining while maintaining the same lower irrigation threshold (W) showed that shoot water content initially increased and then decreased with rising nutrient solution concentration (F). The range of shoot water content was 92.93 to 94.67% in the first crop and 91.05 to 92.67% in the second crop. Additionally, the water content of lettuce shoot in the first crop was higher than that in the second crop. The highest water content values were recorded from the treatments: F3W4O2 (94.67%) in the first crop and F2W4O3 (93.27%) in the second crop.

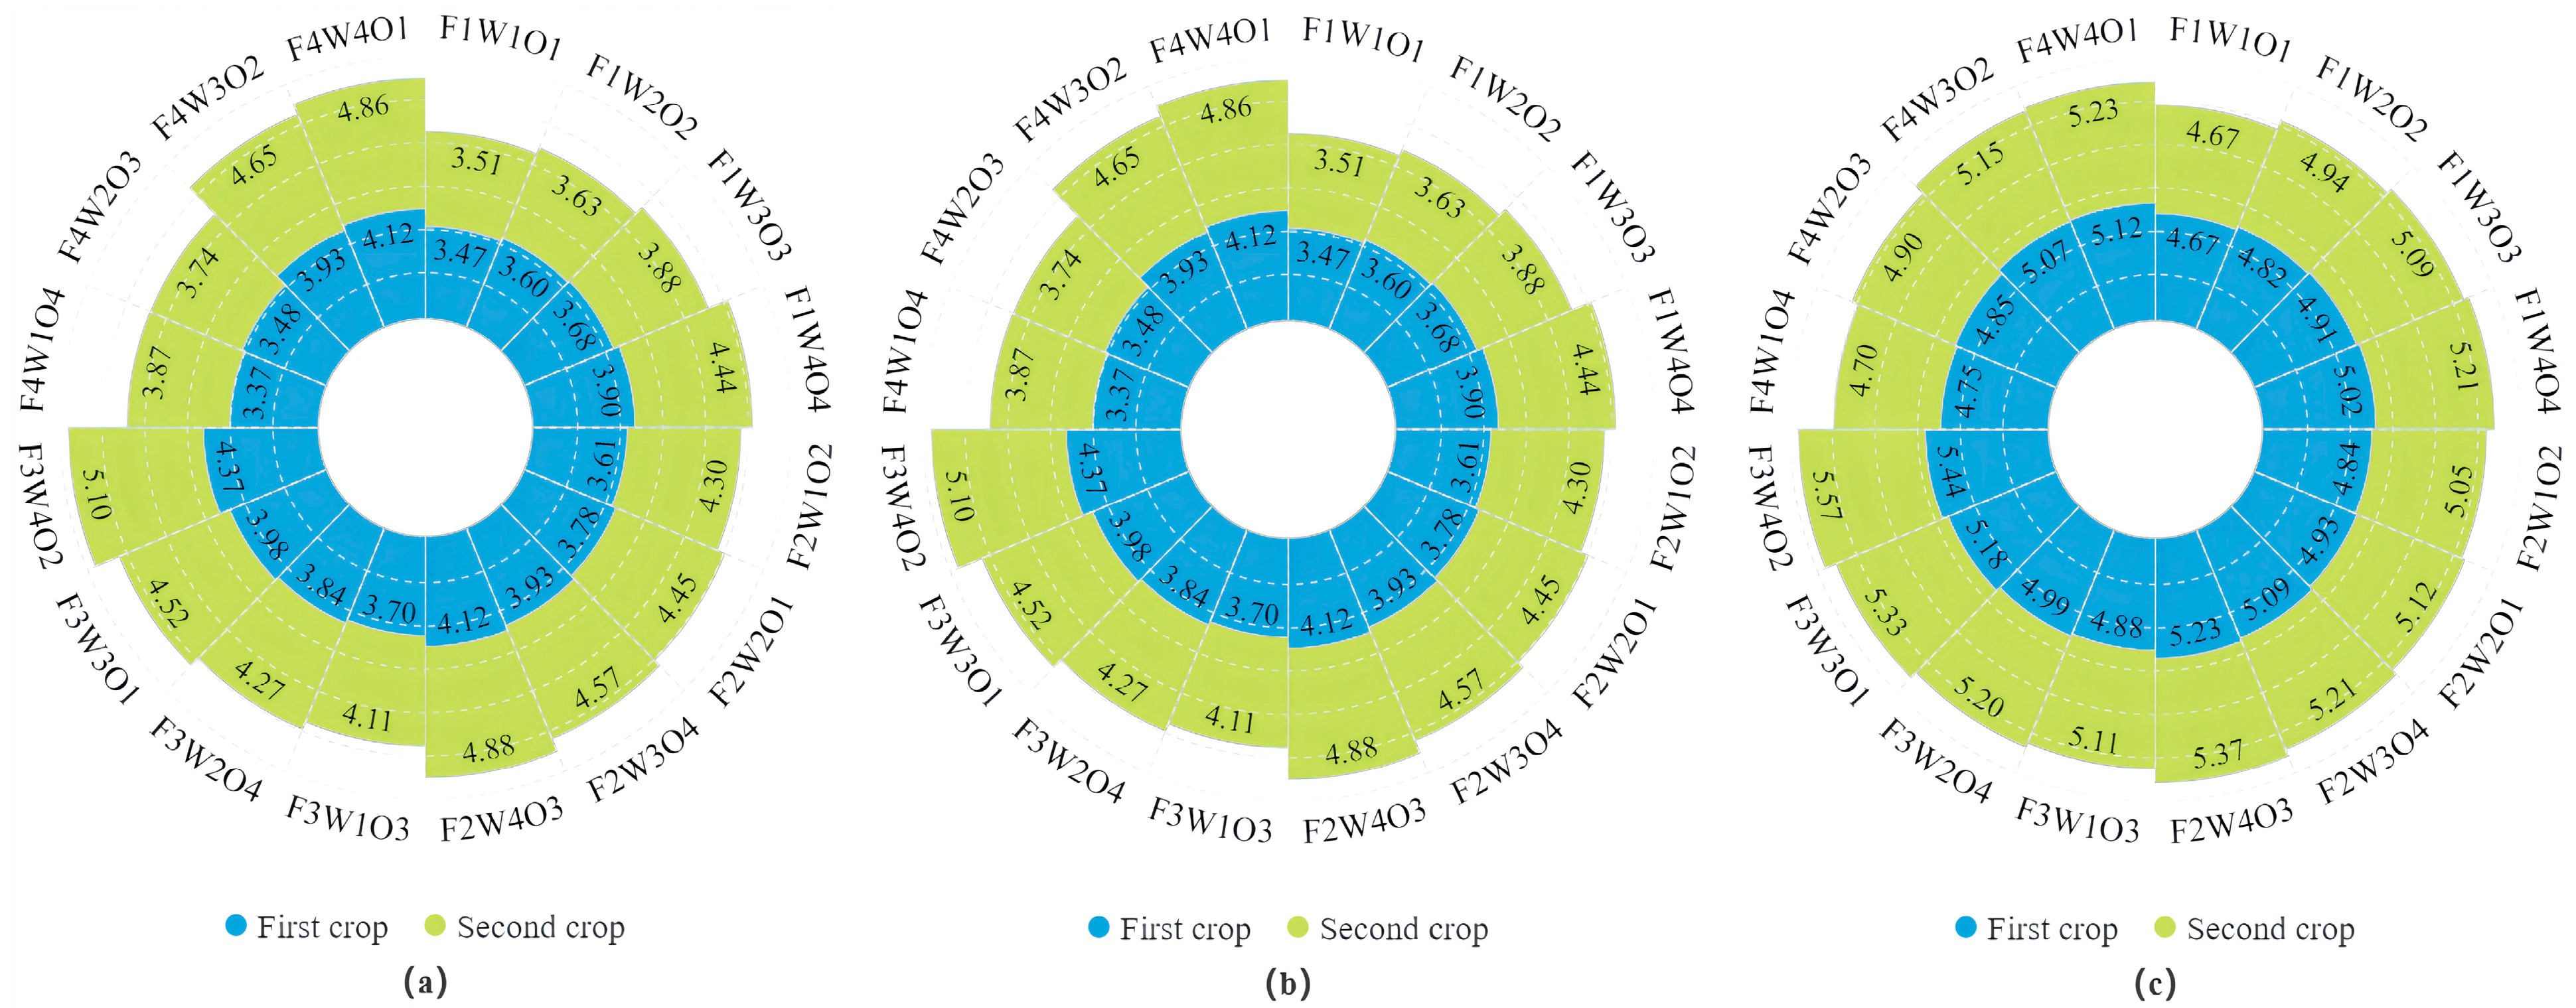
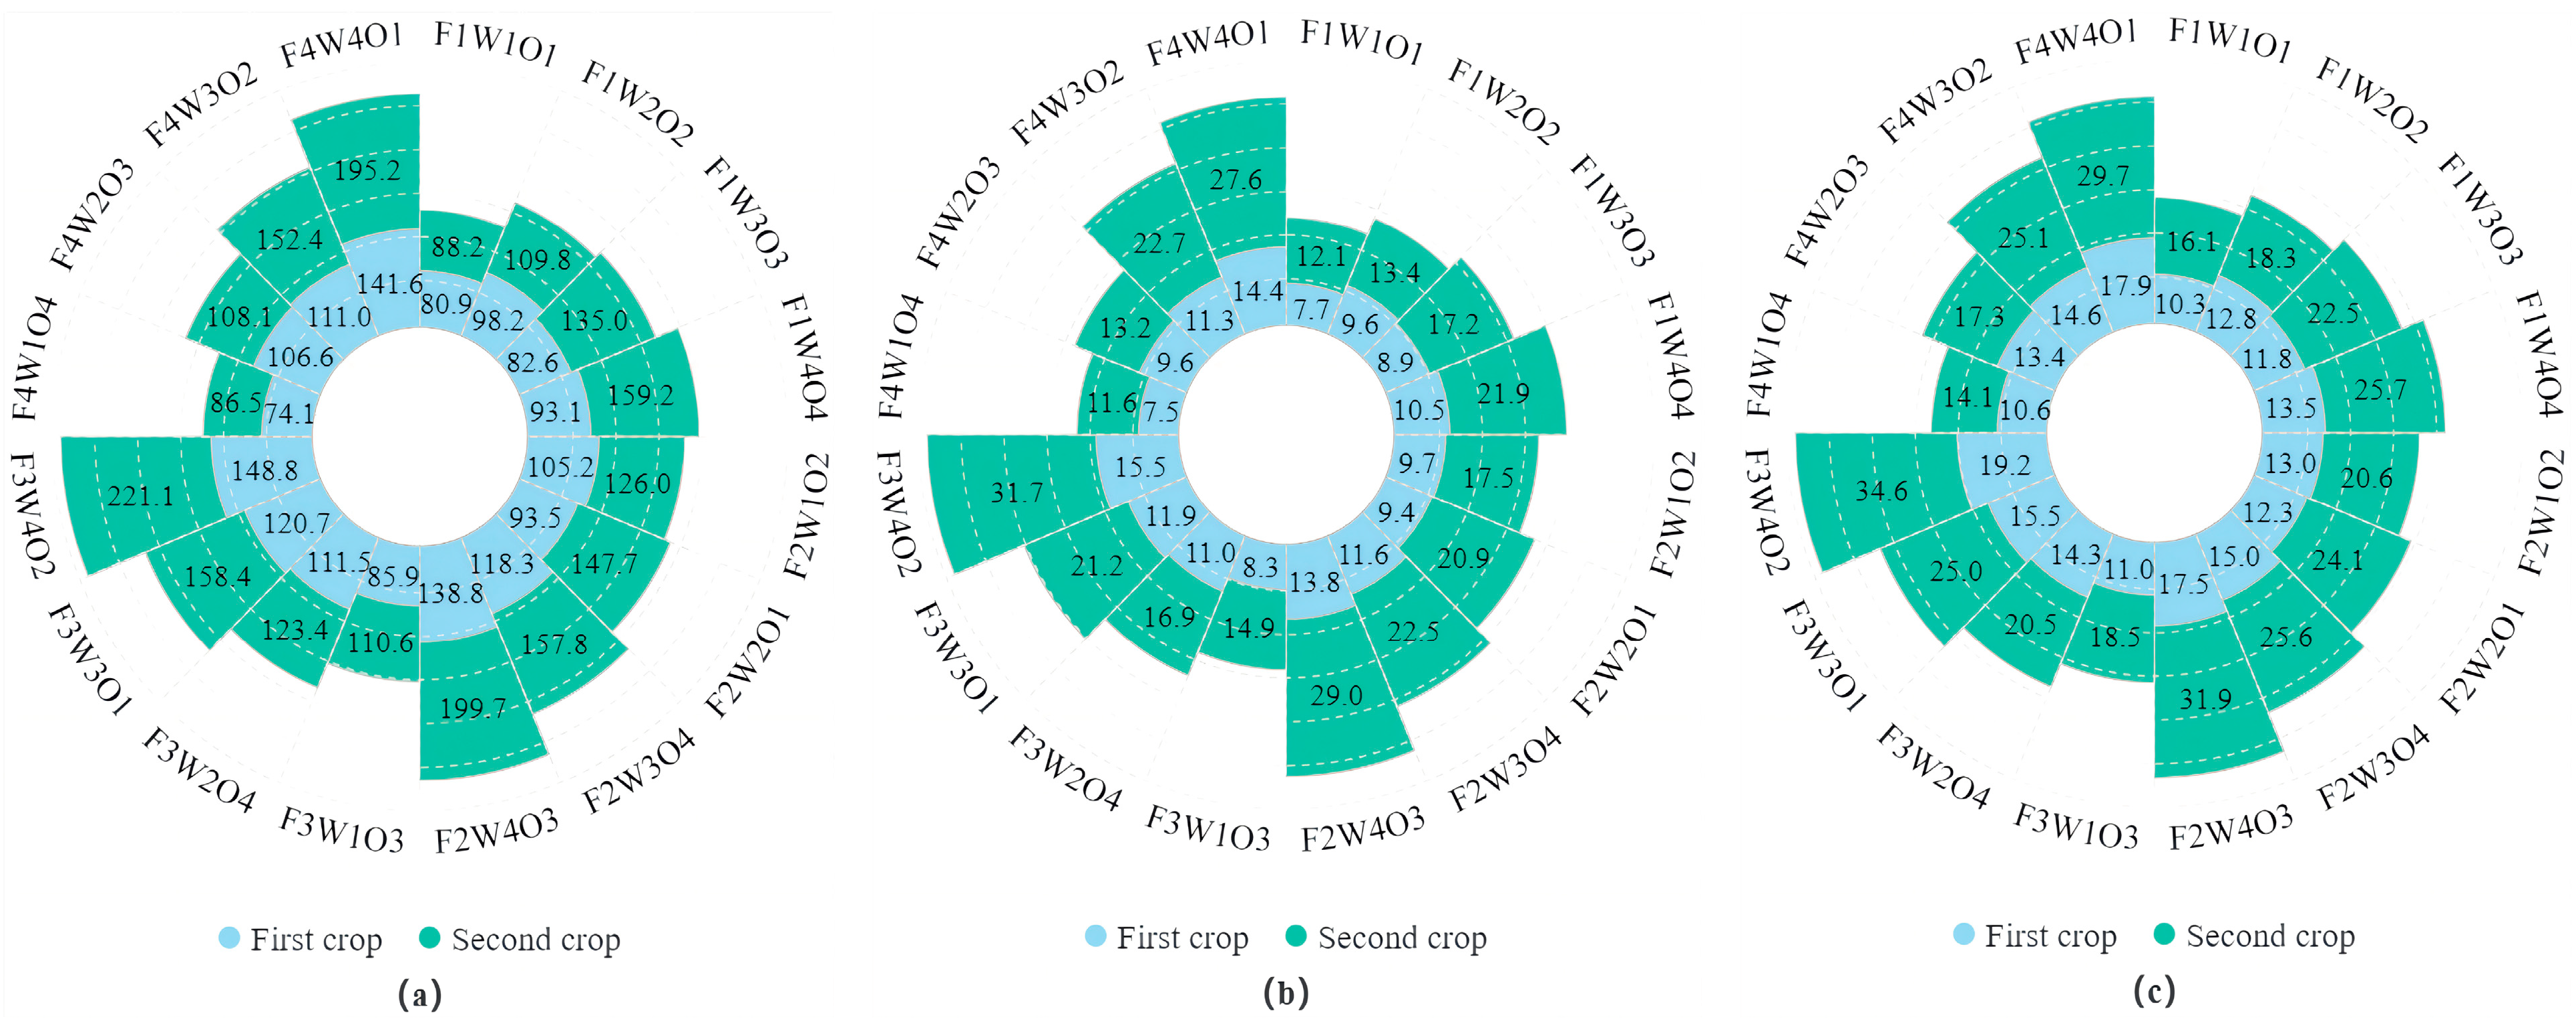
3.2. Effect of Different Treatments on Nutrient Concentration and Uptake in Lettuce

The impacts of various treatments on NPK concentration in lettuce across two cropping cycles were significant and showed consistent trends across different treatments (Figure 4a–c). These concentrations were statistically distinct (p < 0.05). The F3W4O2 treatment resulted in the highest lettuce NPK concentrations at 42.12, 35.61 g·kg−1, 4.37, 5.1 g·kg−1, and 5.44, 5.57 g·kg−1 for the two crops, respectively, significantly outperforming most other treatments (p < 0.01). However, these values were not statistically different from those in the F2W4O3 and F4W4O1 crops (p > 0.05). In the first crop, the F4W1O4 treatment produced the lowest lettuce NP concentrations at 33.12 and 3.37 g·kg−1, respectively. The lowest lettuce K concentration was observed under the F1W1O1 treatment at 4.67 g·kg−1. Conversely, in the second crop, the F1W1O1 treatment consistently produced the lowest lettuce NPK concentrations at 25.70, 3.51, and 4.67 g·kg−1, respectively, marking a significant decrease compared to the highest values observed in the F3W4O2 treatment (p < 0.001).
The trend in NPK uptake was consistent across both lettuce crops as illustrated in Figure 5. The F3W4O2 treatment demonstrated the highest NPK uptake, which was not significantly different from F4W4O1 (p > 0.05), yet it was significantly higher than that of the other treatments (p < 0.01). Conversely, the lowest NPK uptake in both lettuce crops was consistently noted with the F4W1O4 treatment, which was significantly lower than that of other treatments (p < 0.01) except for F1W1O1 (p > 0.05).

3.3. Effect of Different Treatments on Lettuce Biomass

The experimental results illustrate that with a nutrient solution concentration of F1, there is an increase in the fresh shoot weight, dry shoot weight, fresh root weight, and dry root weight of lettuce across both crops as W and O increase (Table 6). Conversely, as the nutrient solution concentration of F4 increases, there is a gradual increase in fresh shoot weight, dry shoot weight, fresh root weight, and dry root weight of lettuce across both crops with an increase in W and a decrease in O. These highlight the influence of the influence of interaction between W and O on the shoot and root fresh and dry weights of lettuce (Table 7).
Furthermore, the F3W4O2 treatment stands out as the most productive, with a fresh shoot weight of 66.19 g, significantly higher than other treatments (p < 0.05). Similarly, the dry shoot weight, wet root weight, and dry weight were 3.53, 8.68, and 0.55 g, respectively, producing no significant difference compared to the F4W4O1 treatment (p > 0.05) but notably higher than other treatments (p < 0.05). Conversely, the F4W1O4 treatment produced a fresh shoot weight and dry weight of 31.57 and 2.23 g, respectively, not significantly different from that obtained with the F1W1O1 treatment (p > 0.05) but notably lower than that obtained with other treatments (p < 0.05). Additionally, the F1W1O1 treatment produced the lowest values for fresh root weight and dry weight at 5.92 and 0.43 g, respectively, significantly lower (p < 0.05) than other treatments, and the highest values for root-to-shoot ratio and shoot dry matter ratio, markedly higher than other treatments (p < 0.05). In the second lettuce crop (Table 6), the F4W1O4 treatment produced minimal values for fresh root weight and dry weight of 6.6 and 0.49 g, respectively, not significantly different from the F4W2O3 treatment (p > 0.05) but notably lower than other treatments (p < 0.05). Trends in other biomass metrics remained consistent with those observed in the first crop.

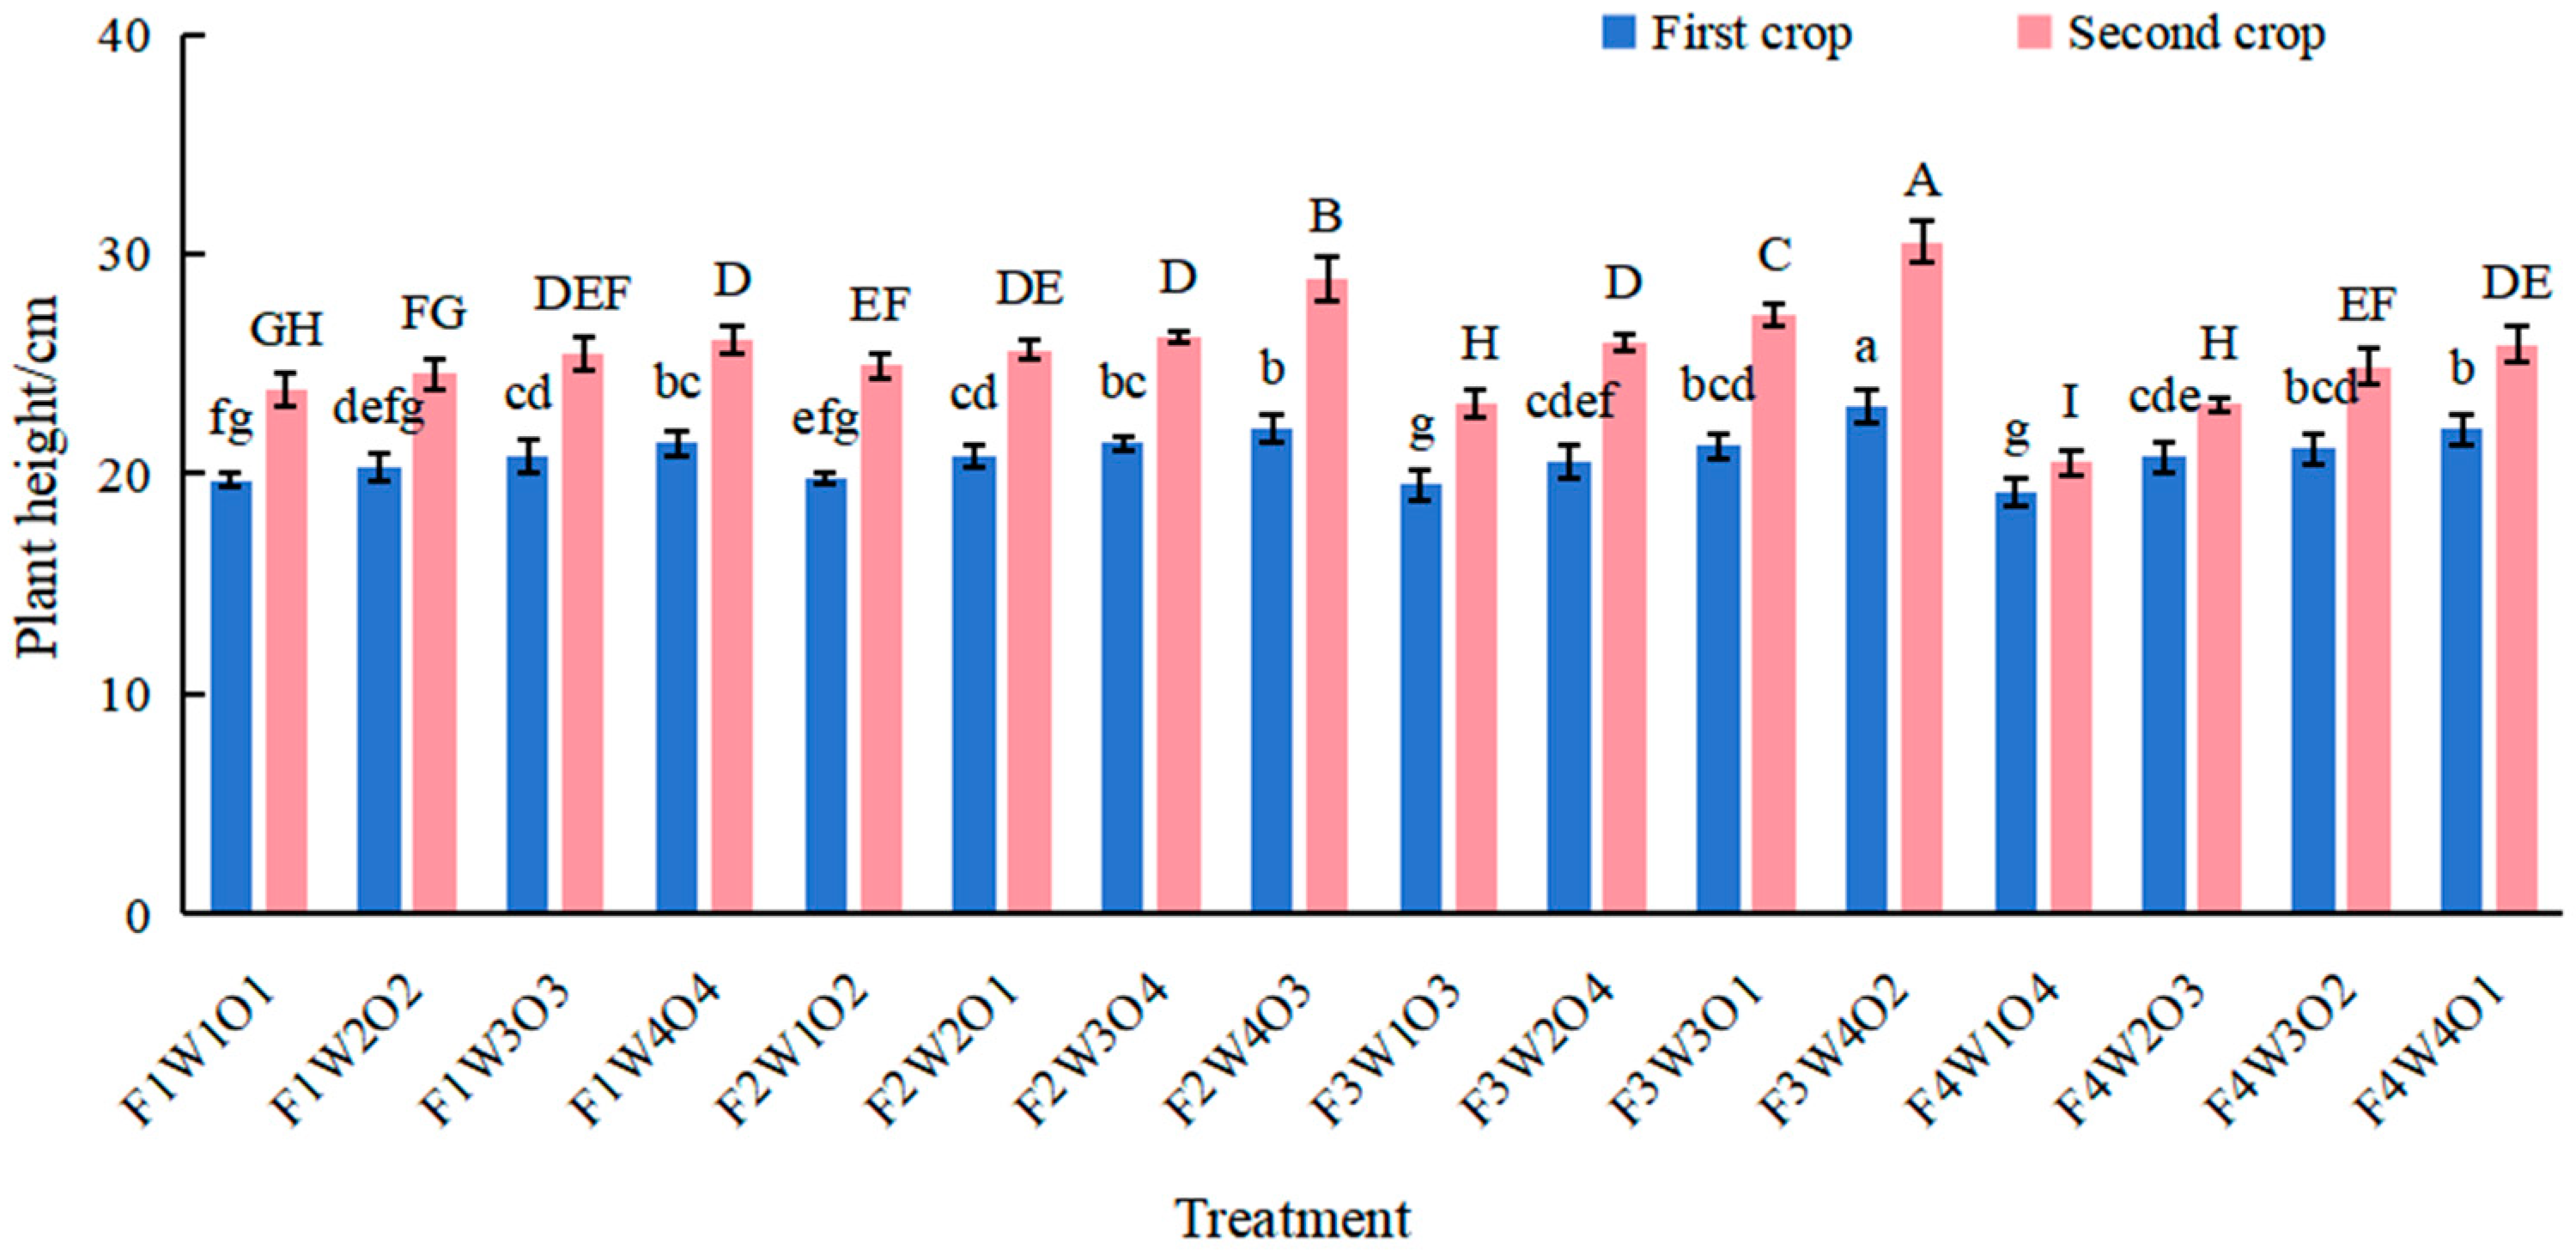
3.4. Effect of Different Treatments on Lettuce Plant Height and Crown Diameter

The plant height and the crown diameter of lettuce in both crops followed consistent trends under different factors. When the nutrient solution concentration (F) remained constant, the plant height and the crown diameter of lettuce increased with the rising lower irrigation threshold (W) (Figure 6 and Figure 7). Similarly, with a constant nutrient solution concentration (F), the plant height and the crown diameter of lettuce initially increased and then decreased with the rising ozone concentration (O). Likewise, when the lower irrigation threshold (W) remained constant, the plant height and the crown diameter of lettuce exhibited a trend of initially increasing and then decreasing with the rising nutrient solution concentration (F). Additionally, from the graph, it is evident that when the nutrient solution concentration was F1, the plant height and the crown diameter of lettuce in both crops increased with the rising W and O. Conversely, when the nutrient solution concentration was F4, the lettuce plant height crown diameter in both crops gradually increased with the rising W and decreasing O. This underscores the influence of the interaction between W and O on the plant height and the crown diameter of lettuce.
The trends in plant height across different treatments were consistent for both crops, with significant differences observed (p < 0.05) (Figure 6). The F3W4O2 treatment produced significantly greater plant height compared to other treatments (p < 0.05), while the F1W4O4, F2W2O1, F2W3O4, and F3W2O4 treatments produced no significant difference (p > 0.05). Conversely, the F4W1O4 treatment produced a significantly smaller plant height than other treatments (p < 0.05). The range of lettuce plant height across both crops was 19.20 to 23.08 cm and 20.53 to 30.53 cm, respectively. The mean differences in lettuce plant height between the highest treatment (F3W4O2) and the lowest treatment (F4W1O4) were 3.88 and 10.00 cm, respectively, with similar trends observed among different treatments.
The lettuce crown diameter under various treatment conditions showed consistent trends across both crops with significant differences among treatments (p < 0.05) (Figure 7). The F3W4O2 crop produced a significantly greater lettuce crown diameter than other treatments (p < 0.05), while the F2W4O3, F4W4O1, F3W3O1, F4W3O2, F1W3O3, and F2W2O1 crops showed no significant difference (p > 0.05). Conversely, the F4W1O4 crop produced significantly lower lettuce crown diameter than other crops (p < 0.05). The range of lettuce crown diameter across both crops was 25.13 to 36.70 cm and 27.93 to 40.53 cm, respectively. The mean differences in lettuce crown diameter between the highest treatment (F3W4O2) and the lowest treatment (F4W1O4) were 11.57 and 12.60 cm, respectively. Overall, the patterns of change in lettuce crown diameter among different treatments were consistent.

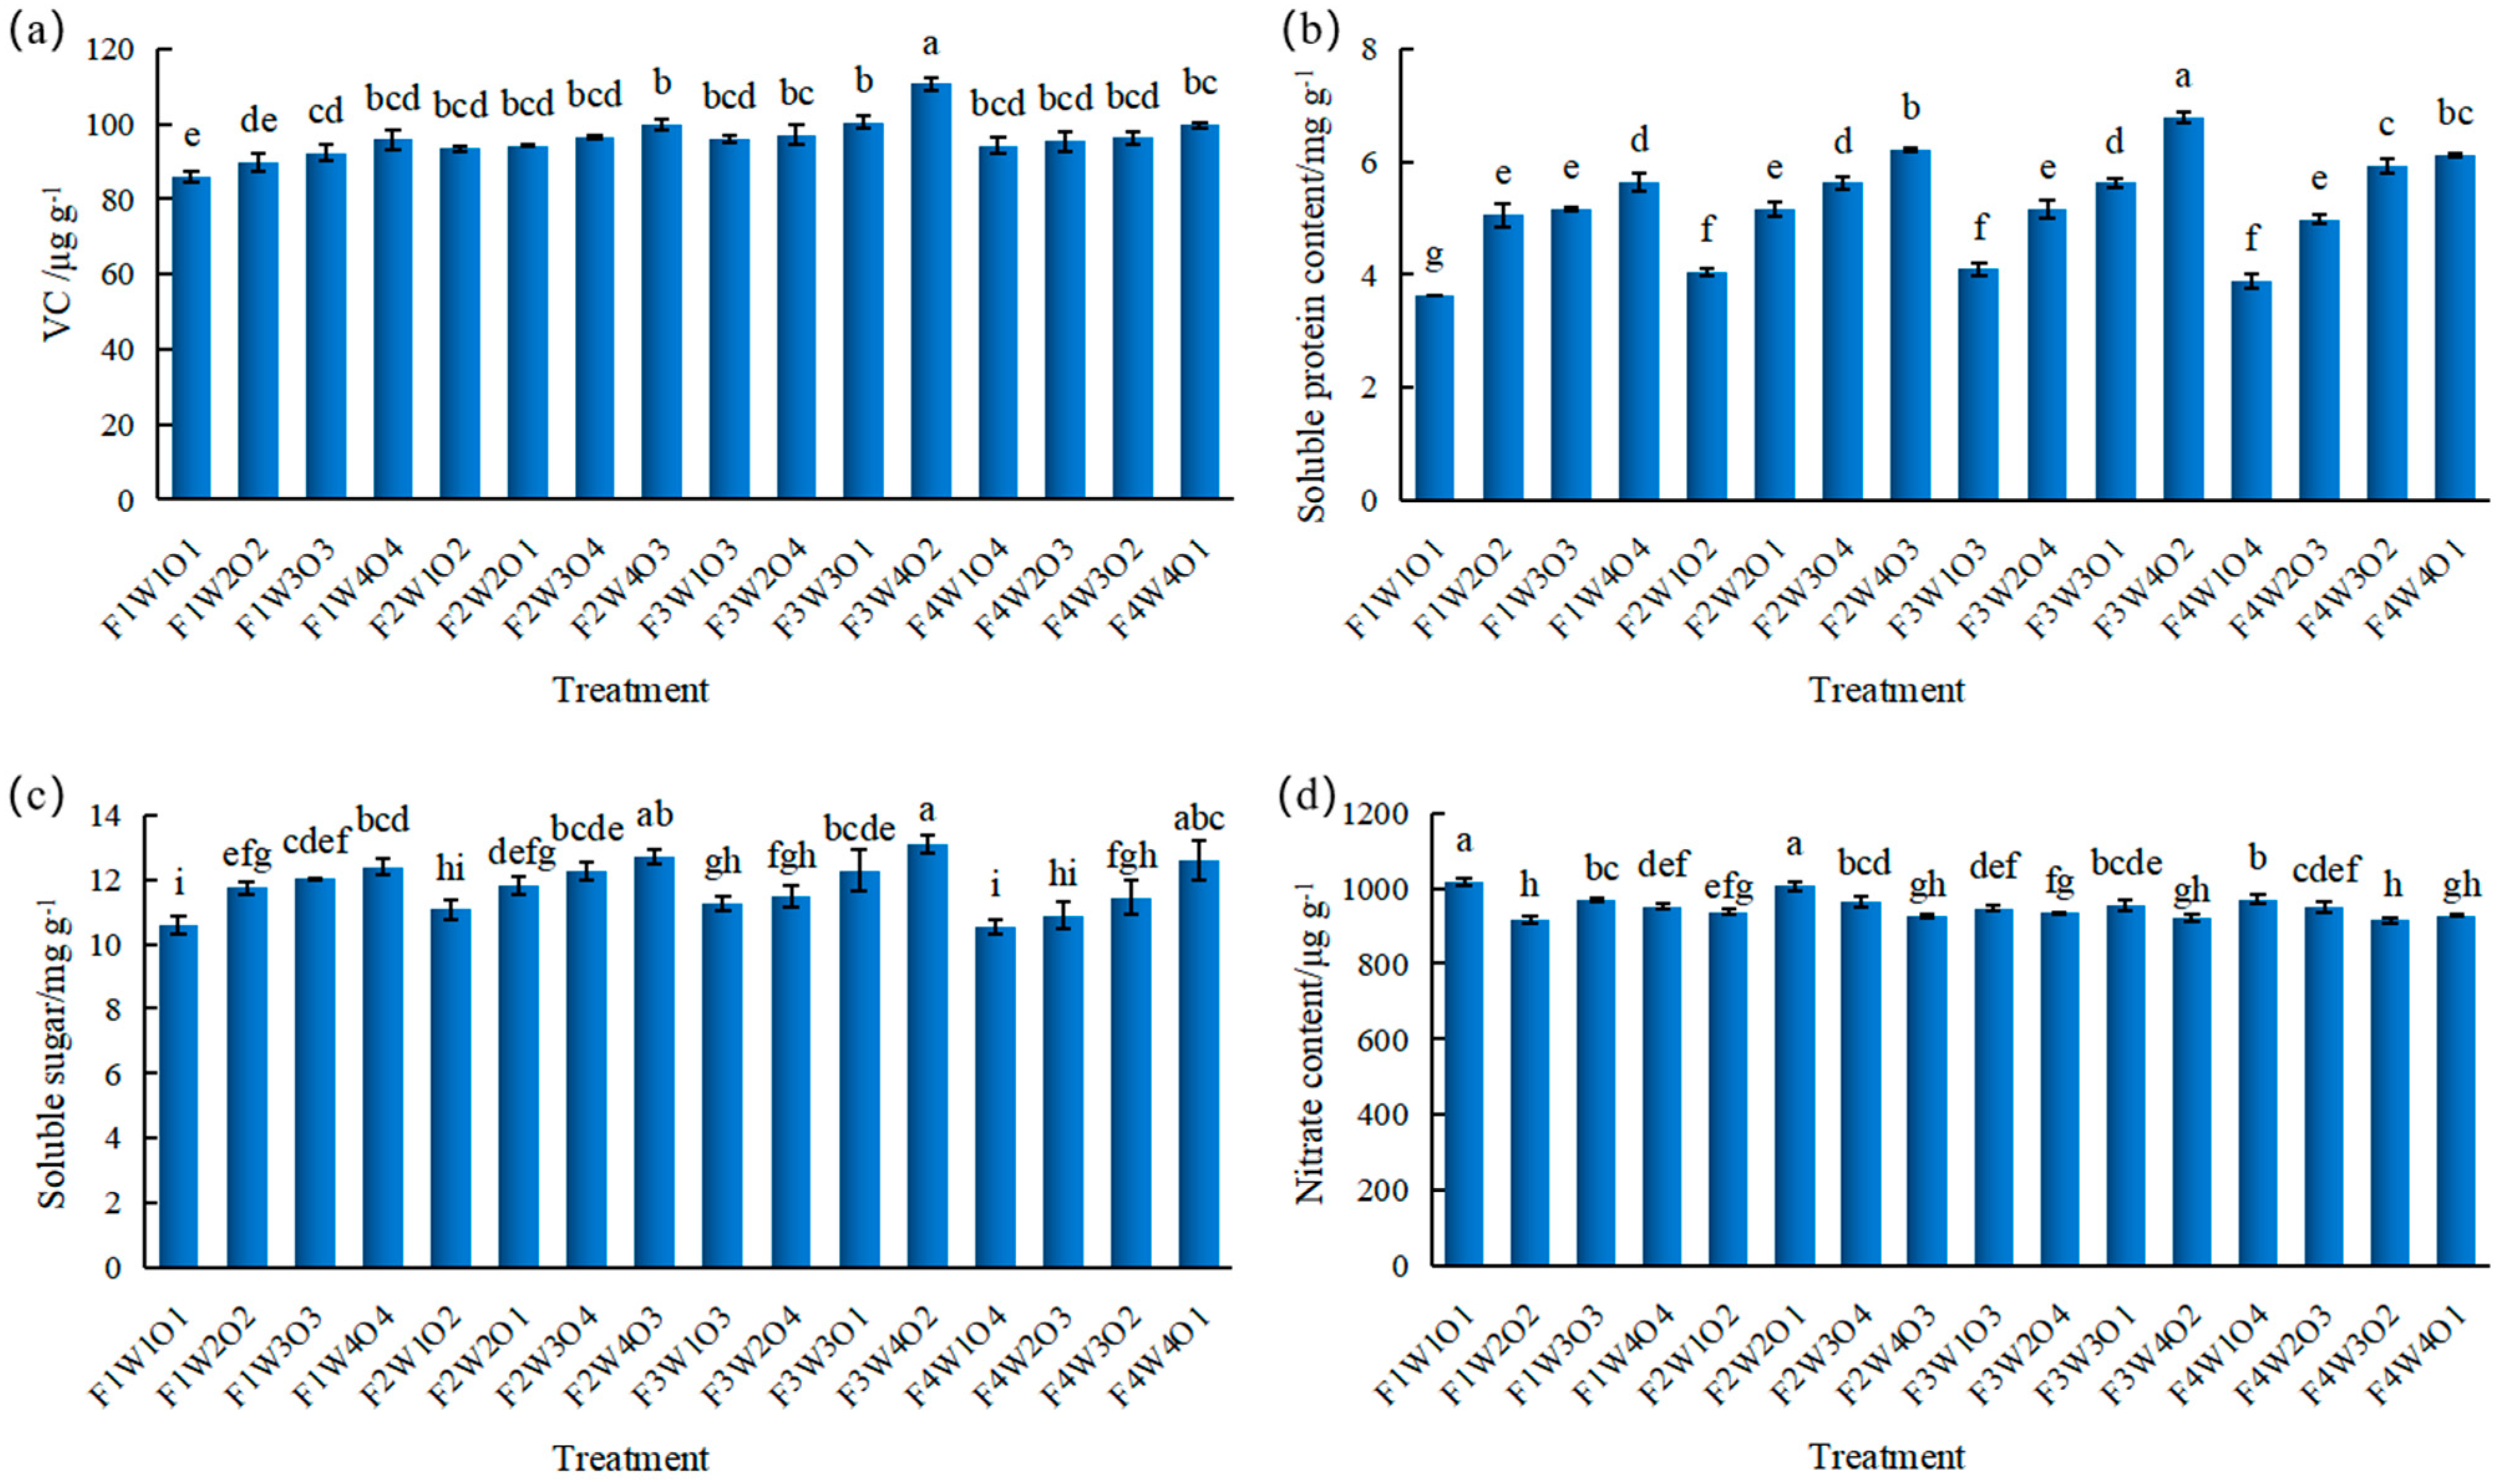
3.5. Effect of Different Treatments on Lettuce Yield and Quality

The yield of lettuce under various treatment conditions showed significant differences (p < 0.05) among plants in two-crop lettuce yields (Table 8). The F3W4O2 treatment produced the highest lettuce yields at 16.82 and 20.70 t·ha−1, respectively, significantly higher than other treatments. Conversely, the F1W2O2, F2W1O2, F1W3O3, F1W4O4, F2W3O4, and F3W3O1 treatments produced no significant differences (p > 0.05). The F4W1O4 treatment produced the lowest yields at 8.02 and 8.52 t·ha−1, respectively, significantly lower than other treatments (p < 0.05). The range of lettuce yield across both crops was 8.02 to 16.82 t·ha−1 and 8.52 to 20.70 t·ha−1, respectively. The mean differences in lettuce yields between the highest treatment (F3W4O2) and the lowest treatment (F4W1O4) were 8.80 and 12.18 t·ha−1, respectively.
The VC content ranged from 85.97 to 110.65 μg·g−1 among plants (Figure 8a). The F3W4O2 treatment produced the highest VC content at 110.65 μg·g−1, significantly higher than other treatments (p < 0.05), while the F1W1O1 treatment produced the lowest VC content at 85.97 μg·g−1, significantly lower than other treatments (p < 0.05). Soluble protein content varied significantly among plants (p < 0.05) (Figure 8b), with the F3W4O2 treatment producing the highest content at 6.78 mg·g−1, significantly higher than other treatments (p < 0.05), and the F1W1O1 treatment producing the lowest content at 3.63 mg·g−1, significantly lower than other treatments (p < 0.05). When the nutrient solution concentration (F) was the same, the soluble protein content increased with an increasing lower irrigation threshold. Moreover, soluble sugar content peaked with the F3W4O2 treatment at 13.09 mg·g−1, not markedly different from the F2W4O3 and F4W4O1 (p > 0.05) treatments and significantly higher than other treatments (p < 0.05). Conversely, the F4W1O4 treatment produced the lowest content at 10.53 mg·g−1, not markedly different from the F1W1O1 treatment (p > 0.05) but significantly lower than other treatments (p < 0.05) (Figure 8c). Nitrate content was the highest with the F1W1O1 treatment at 1017.16 μg·g−1, not markedly different from the F2W2O1 treatment (p > 0.05) but significantly higher than other treatments (p < 0.05). The F4W3O2 treatment produced the lowest content at 915.14 μg·g−1, significantly lower than other treatments (p < 0.05), except for F1W2O2, F3W4O2, and F2W4O3 (p > 0.05) (Figure 8d).

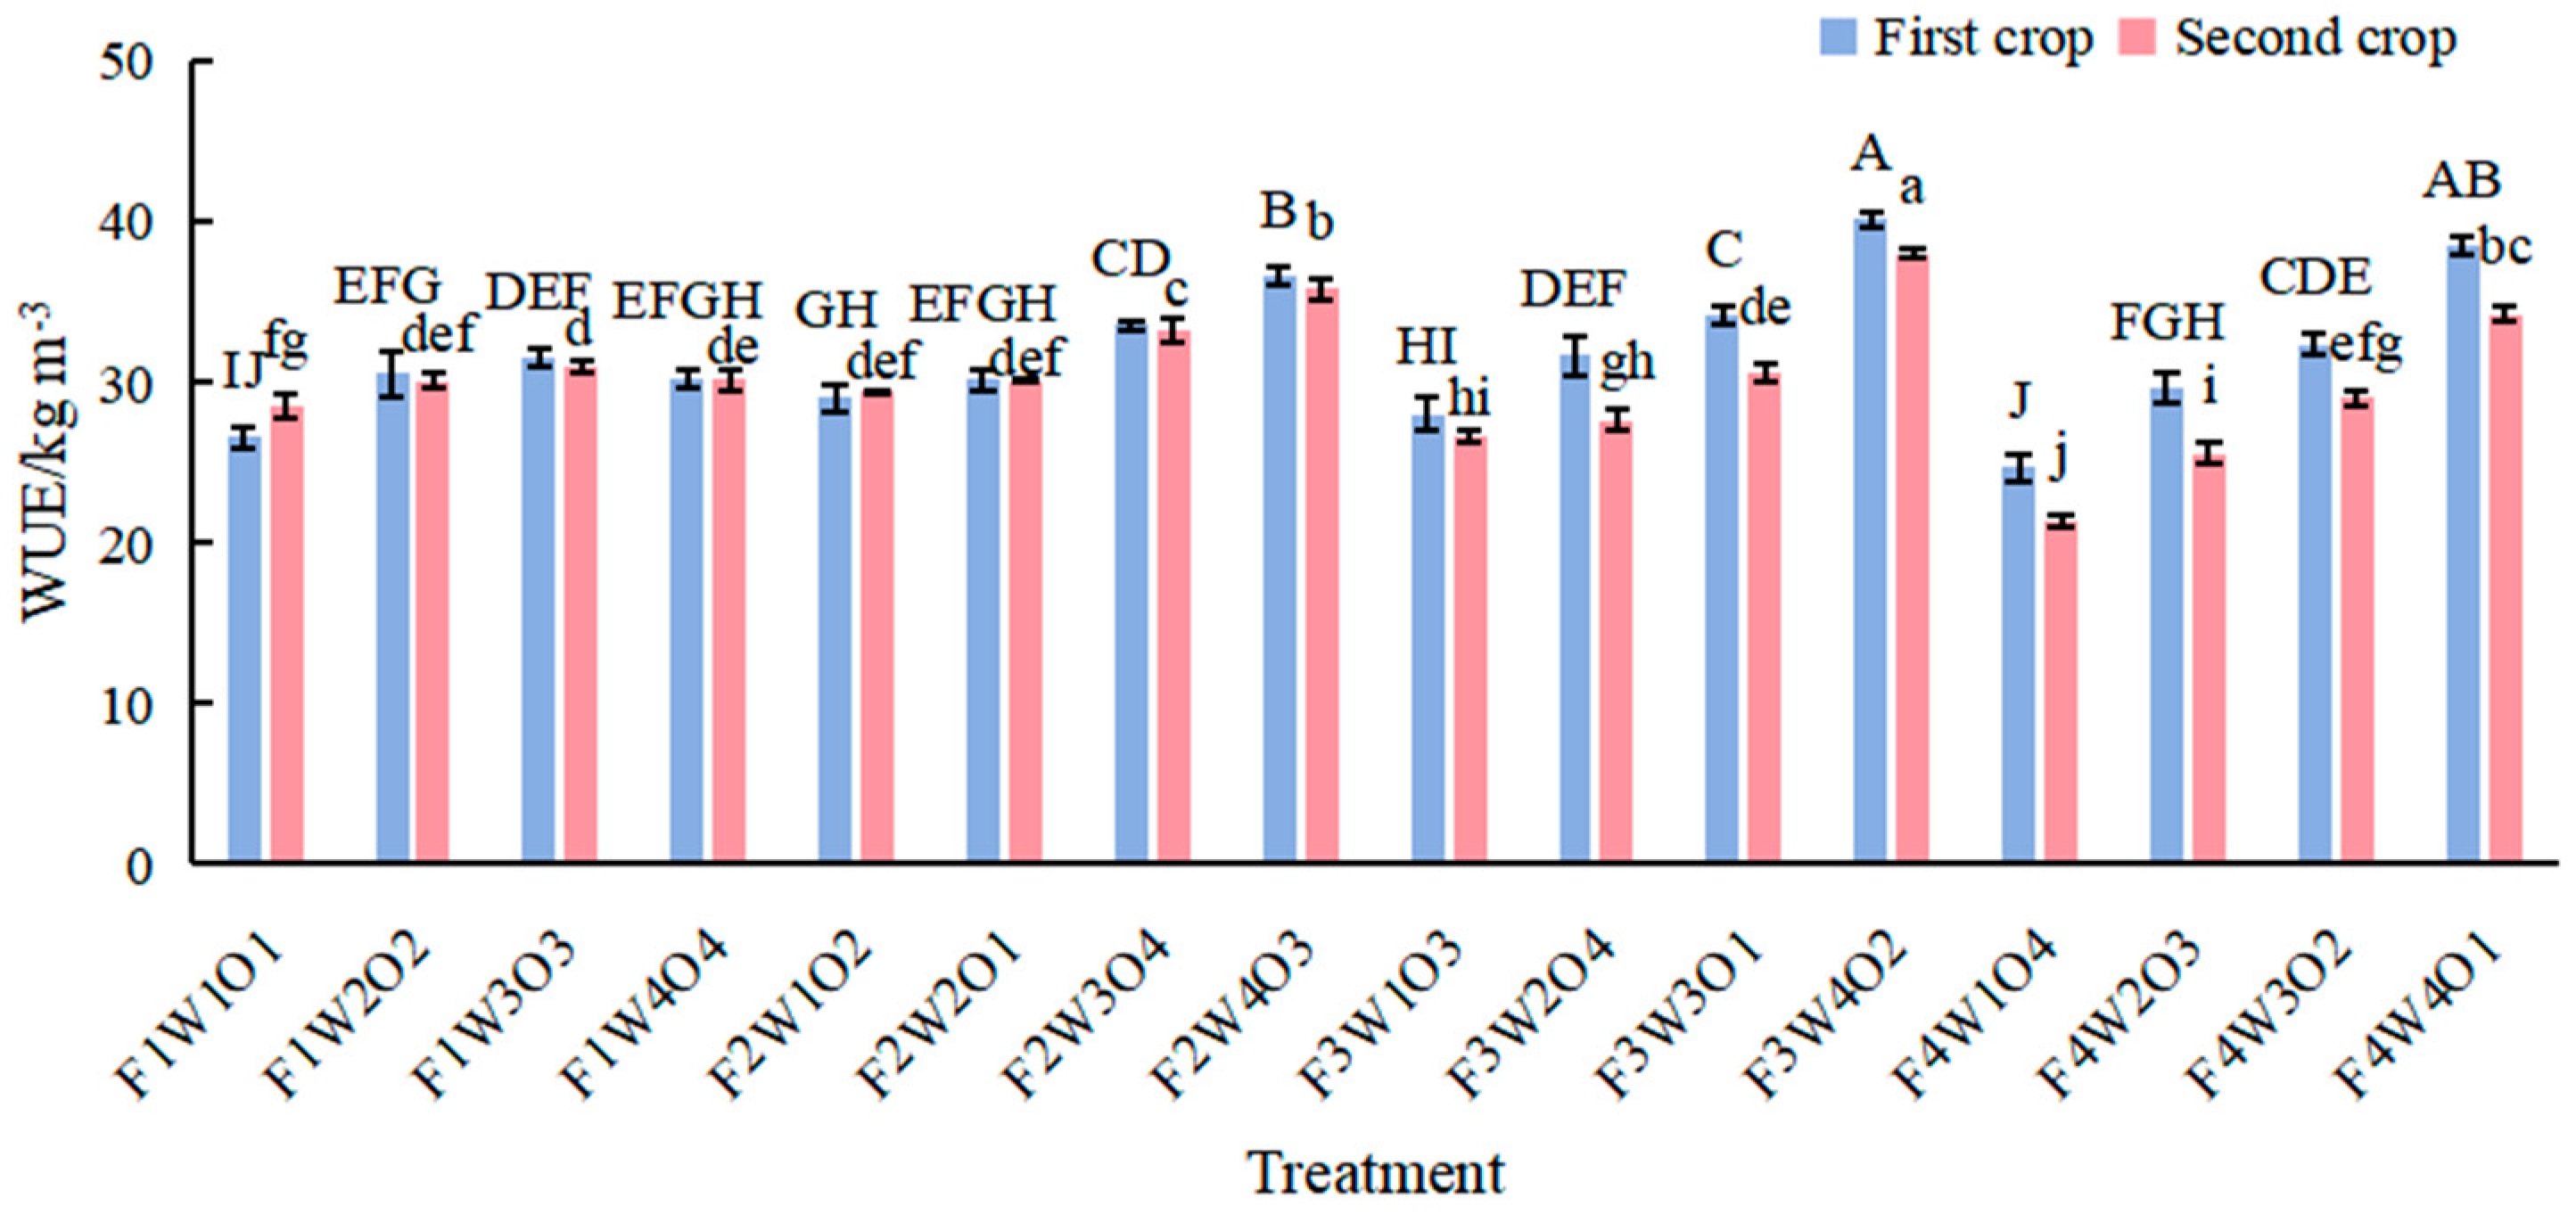
3.6. Effect of Different Treatments on Lettuce WUE

The WUE of two-crop lettuce showed consistent trends across treatments (Figure 9). The F3W4O2 treatment produced the highest WUE at 40.14 and 38.05 kg·m−3, respectively, significantly higher than other treatments (p < 0.01). Conversely, the F4W1O4 treatment produced the lowest WUE at 24.74 and 21.43 kg·m−3, respectively, significantly lower than other treatments (p < 0.01). The F2W2O1 treatment produced no significant difference compared to F1W2O2 and F1W4O4 (p > 0.05), and there was no significant difference between the F1W2O2 and F1W4O4 treatments (p > 0.05).

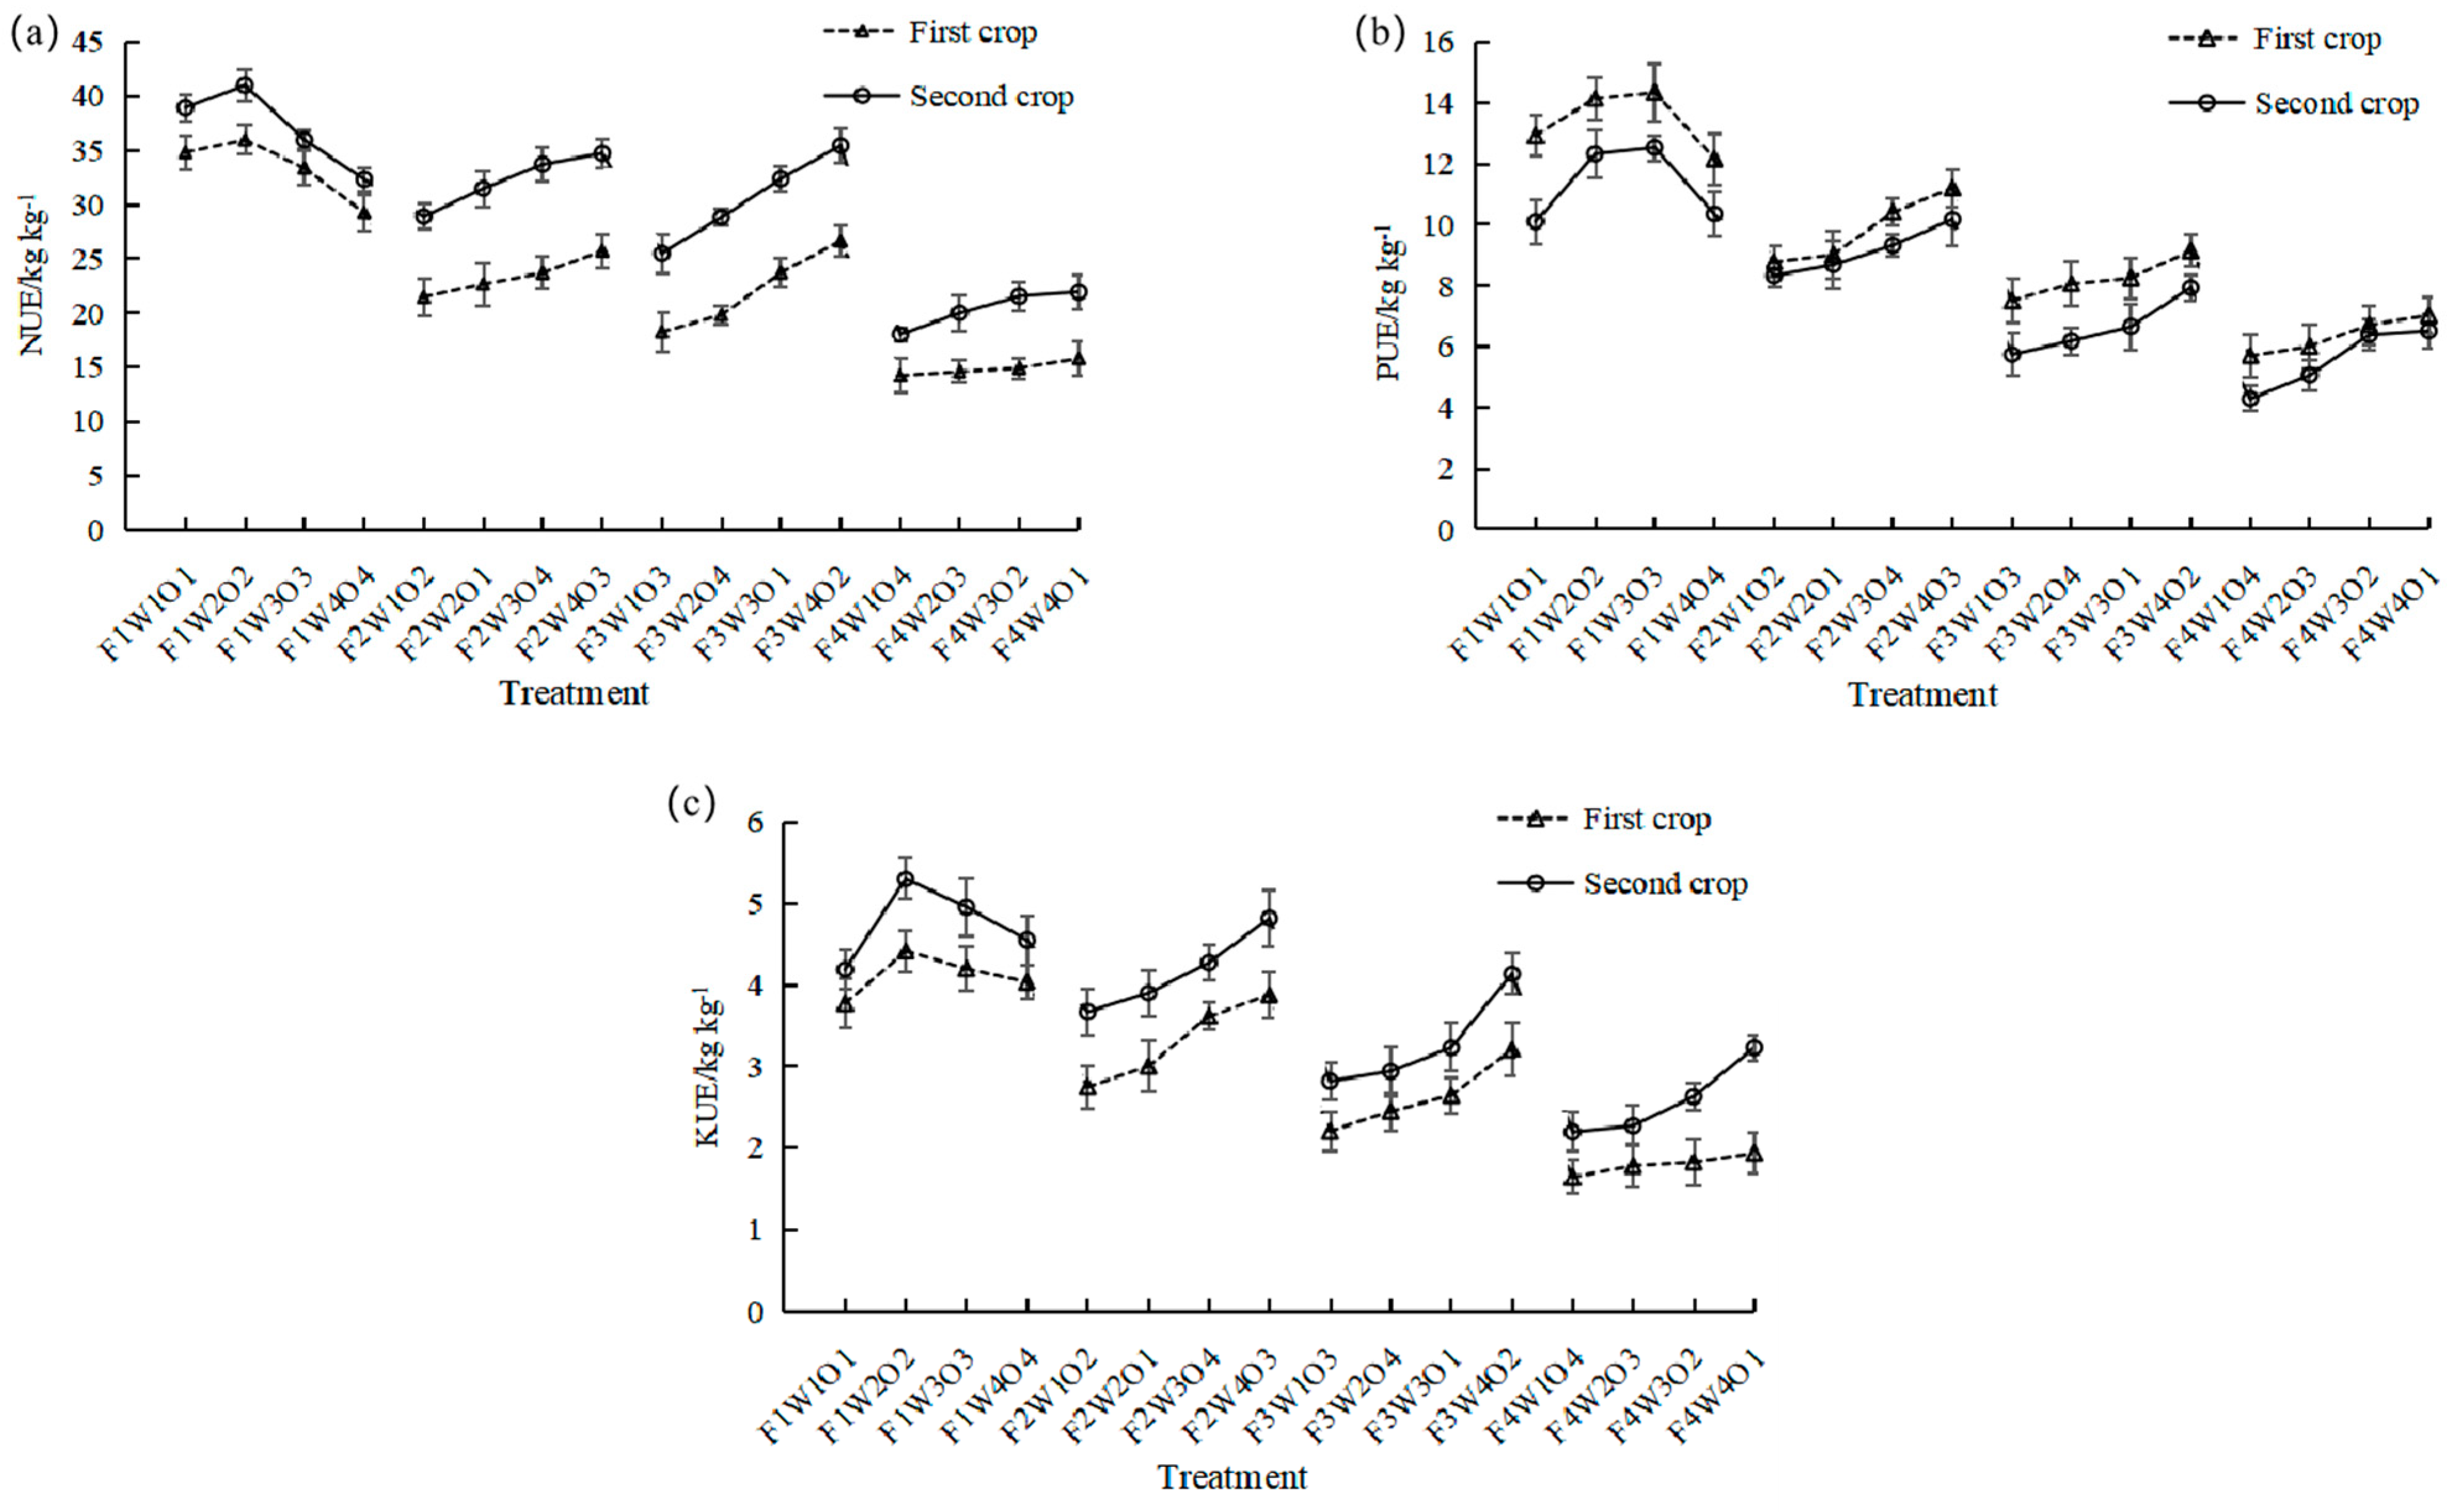
3.7. Effect of Different Treatments on Lettuce NPK Use Efficiency

The patterns observed for NPK use efficiency were consistent among treatments. For nitrogen (N) use efficiency (Figure 10a), the F1W2O2 treatment produced the highest values at 35.98 and 41.01 kg·kg−1, respectively, not markedly different from the F1W1O1 treatment (p > 0.05) but significantly higher than other treatments (p < 0.01). Conversely, the F4W1O4 treatment produced the lowest values at 14.23 and 18.00 kg·kg−1, not significantly different from the F4W2O3 treatment (p > 0.05) but markedly lower than other treatments (p < 0.01). Other treatments produced no significant differences (p > 0.05).
The phosphorus (P) use efficiency of the two lettuce crops ranged from 5.70 to 14.35 kg·kg−1 and 4.29 to 12.54 kg·kg−1, respectively (Figure 10b). The F1W3O3 treatment produced the highest values, significantly different from all other treatments (p < 0.01) except F1W2O2 (p > 0.05). Conversely, the F4W1O4 treatment produced the lowest values, not markedly different from F4W2O3 (p > 0.05) but significantly lower than other treatments (p < 0.05). Other treatments produced no significant differences (p > 0.05).
For K use efficiency, values ranged from 1.64 to 4.42 kg·kg−1 and 2.20 to 5.30 kg·kg−1, respectively (Figure 10c). F1W2O2 produced the highest values, significantly higher than other treatments (p < 0.01) except F1W3O3 (p > 0.05). Conversely, the F4W1O4 treatment had the lowest values, not significantly different from F4W2O3 (p > 0.05) but significantly different from other treatments (p < 0.01). Other treatments produced no significant differences (p > 0.05).

3.8. Range and Variance Analysis

Previous experimental results suggest interactions between nutrient solution concentration, lower irrigation threshold, and ozone concentration significantly affect lettuce growth and yield. To develop a more precise management strategy, we utilized variance and range analysis to quantify the impact of these parameters on lettuce development and to identify optimal parameter combinations. Variance analysis reveals that ozone (O) had no significant effect on soluble sugar content or the potassium use efficiency (KUE) of the first crop (Table 9), but it did significantly impact the phosphorus use efficiency (PUE) of the first crop. Furthermore, factors F, W and O had a highly significant impact on the remaining indicators. Additionally, the interaction between factors F and O, as well as between factors W and O, significantly influenced lettuce yield, quality, and water and nutrient use efficiency. Moreover, the interaction between factors F and W significantly affected soluble sugar content and had a highly significant impact on the remaining indicators.
Range and variance analyses (Table 10) delineated the influence hierarchy of each experimental factor on various parameters. For yield, soluble protein content, soluble sugar content, and WUE, the order of influence was W > F > O. Conversely, for VC, P use efficiency, and K use efficiency, the order was F > W > O. For nitrate content, the order was O > W > F. Similarly, for N use efficiency, the order was O > W > F.
Variance analysis confirmed that nutrient solution concentration and lower irrigation threshold significantly impacted yield, quality, WUE, and NPK use efficiency. However, ozone concentration had a negligible effect on the first crop’s soluble sugar content, PUE, and KUE, but significantly influenced other indicators.
In range analysis, ‘k’ typically represents the average deviation of each factor at every level, serving as a metric to evaluate the influence of factor-level fluctuations on the outcome. To facilitate comparison among different indicators, k values in Table 8 were normalized. Each k-value was divided by kmin to obtain k′, and these k′ values were plotted in Figure 11. Optimization schemes were identified for improving yield and quality while conserving water and fertilizer. Further analysis suggested the optimization and improvement schemes for different factors and levels within the orthogonal experiment were F2W4O2, F3W4O2, and F1W4O2 (Figure 11). Considering economy, water–fertilizer use efficiency, and other comprehensive indicators, the optimal combination was determined to be F3W4O2.

4. Discussion

Properly adjusting water and nutrient parameters for greenhouse lettuce cultivation is an essential factor in enhancing both yield and quality [37,38]. Our experiments consistently demonstrate that increasing the lower irrigation threshold and nutrient solution concentration (F3 for the first crop, F2 for the second crop) benefits lettuce in terms of plant height (Figure 6), crown diameter (Figure 7), dry matter content (Table 6 and Table 7), yield (Table 8), and quality (Figure 8). Furthermore, the experiments reveal that the growth results of the second crop lettuce surpass those of the first crop, possibly due to the slightly higher temperature in the second crop accelerating substrate and organic matter decomposition, enhancing net nitrogen mineralization, and promoting nutrient cycling. This leads to increased physiological activity of substrate microorganisms, consequently accelerating substrate decomposition and respiration [39]. Furthermore, temperature fluctuations may be the reason for the growth differences between two successive crops of lettuce, as studies indicate that as temperature rises, lettuce leaf area and dry weight increase [40]. This is mainly because the maximum values are reached at 25 °C, when the dry matter content is highest. The effect of root zone temperature on lettuce leaf net photosynthetic rate and mineral element content is similar to its effect on yield. However, when the temperature reaches 35 °C, root and leaf growth and the accumulation of mineral elements in the shoots are severely hindered, and lettuce leaf nitrate content significantly decreases [41]. Additionally, studies have shown that as temperature increases, plant height, fresh shoot weight, total soluble sugars, caffeine, and oleanolic acid content all first rise and then fall [42]. These studies all demonstrate the relationship between temperature and lettuce growth, and indirectly explain the potential differences in the results between the two crops in this article. In addition, the lower limit of irrigation changes the frequency of irrigation, indirectly affecting the extent to which crops are affected by water and fertilizer management and ozone. Previous studies have shown that irrigation frequency can alter the distribution and storage of water and heat in the soil (substrate), thereby affecting crop growth. Most research indicates that some crops respond well to high-frequency irrigation, mainly reflected in increased crop yield and improved water and fertilizer use efficiency [43,44,45,46]. The research results of this article confirm that raising the lower irrigation threshold increases irrigation frequency, allowing for rapid root development and creating an environment conducive to absorbing more water and nutrients, thereby enhancing growth parameters. Conversely, when the lower limit of irrigation is low, a smaller irrigation frequency leads to a significant decrease in water stress and yield of lettuce. In terms of irrigation volume and quality research, some studies have found that lettuce treated with 50% field water content had significantly higher VC content than other treatments, a result inconsistent with our study. This discrepancy may be due to the positive effects of the interaction between water and nutrient regulation and ozone on lettuce quality observed in our study. Furthermore, inappropriate nutrient solution concentrations of nutrient solutions inhibited lettuce growth. Low concentrations did not to meet the growth demands of lettuce, while high concentrations elevated osmotic pressure, thereby reducing root system vigor [18] and impeding water and nutrient uptake [17], ultimately compromising yield and quality [19]. Within an appropriate range, an increase in nutrient solution concentration enhanced chlorophyll content in plant leaves, thus improving quality [15] and yield [16]. The growth pattern of lettuce observed in this experiment regarding nutrient solution concentration aligns closely with previous research findings. Hence, selecting optimal nutrient solution concentrations tailored to specific plants is crucial to avoid nutrient deficiency and promote an ecological environment.
In the process of regulating water and nutrient parameters for substrate crop growth, it is crucial not only to consider crop yield and quality but also to pay attention to negative effects such as nutrient loss and environmental pollution [47]. Ozone is considered an environmentally friendly method and has significant advantages in deodorization, food, water, air purification, and industrial wastewater treatment [41,48]. In the results of this study, ozone demonstrates a significant impact on various indicators of lettuce, including plant height, crown diameter, yield, soluble protein, VC, nitrate content, water use efficiency, NUE, and the second crop’s PUE and KUE (Table 8) (p < 0.05). This finding aligns with the research of Fcowors et al. [49] regarding the number and yield of soybean pods. It may be because, on one hand, ozone dissolved in nutrient solution decomposes into oxygen, which promotes aerobic respiration in plant roots, thus increasing nutrient transport in the solution [50,51]. This enhances crop root absorption and utilization of water and nutrients, ultimately improving yield, water use efficiency, and quality [52]. On the other hand, ozone can transform organic matter in the nutrient solution into inorganic substances that can be absorbed and utilized by plants [53]. Additionally, the decrease in ascorbic acid content in lettuce treated with ozone is crucial for enhancing antioxidant capacity under ozone conditions [54]. However, when ozone is used to sterilize nutrient solution, high concentrations can hinder carbon transport to the roots, restrict water and nutrient absorption, and damage crops and vegetation [55], adversely affecting plant growth and yield [56]. Therefore, the function of promoting crop growth can only be achieved under specific conditions [57]. Research findings from Flowers et al. [49] indicate that low concentrations of ozone increase crop yield, while high concentrations inhibit crop growth. This suggests that, on the basis of reasonable water and nutrient regulation, utilizing ozone for nutrient solution sterilization can produce positive effects when combined with water and nutrient regulation, significantly improving lettuce yield and quality.
In the preceding sections, we clarified the combined effects of water and nutrient regulation with ozone on lettuce growth. Furthermore, understanding how various factors interact in affecting lettuce growth will aid in devising a more precise management model. Range analysis reveals the impact sequence of each experimental factor on the yield, soluble protein content, soluble sugar content, and water use efficiency of each treatment combination as follows: W (lower irrigation threshold) > F (nutrient solution concentration) > O (ozone concentration). Similarly, the impact sequence on the VC and PAE and KAE of each treatment combination is F > W > O, while the sequence for nitrate content is O > W > F, and for NAE, it is O > W > F. Moreover, analysis of the interactive effects of water nutrient regulation and ozone on lettuce growth (Table 9) shows that the pairwise interaction of these factors significantly affects lettuce yield, quality, and water and nutrient use efficiency. This is primarily due to previous studies mainly focusing on either the water and nutrient management model for substrate-cultivated lettuce or the concentration and effects of ozone. However, these studies have not reached a unified conclusion, and there has been limited research on the interactive use of water and nutrient regulation with ozone. The findings of this study could enhance the quality and environmental benefits of substrate-cultivated lettuce.
Nevertheless, while this study analyzed the growth indicators, yield, and quality of lettuce under ozone treatment, the mechanism by which ozone enhances lettuce quality and efficiency is still unknown. Further research is needed to explore the differences in substrate environmental indicators and their mechanisms on lettuce root water and nutrient absorption under ozone treatment. Additionally, elucidating the interaction between substrate microorganisms and root exudates in the nutrient cycling and regulation mechanisms explored in this study will be crucial for advancing modern agriculture, which will be a key focus of our future research. Finally, if we conduct research on efficient and green agricultural models, carbon emissions are a factor that we cannot ignore. Although we did not specifically analyze carbon emissions and focused instead on the relationship between water and nutrient management and lettuce yield and efficiency, our results indicated that the most suitable outcome was not achieved with high nutrient solution concentration treatments. Studies by Guo et al. [58], Dejie et al. [59], and Hu et al. [60] demonstrate that appropriate water and nutrient management is an effective measure to reduce carbon emissions, suggesting that we may have inadvertently reduced emission risks as well. Furthermore, Sharma et al. [61] and Pan et al. [62] confirm that the treatment of nutrient solution wastewater is also a crucial step in reducing carbon emissions. The ozone disinfection treatment used in our hydroponic cultivation may have also contributed to reducing carbon emissions. Our final research results indicate that the F3W4O2 treatment may not only enhance yield and efficiency but also reduce the risk of carbon emissions.

5. Conclusions

In this study, we examined the effects of nutrient solution concentration (F), lower irrigation threshold (W), and ozone concentration (O) on various physiological and biochemical indices of lettuce. The results indicated that W had the most significant impact on lettuce growth, whereas O had the least influence. Optimal conditions, with nutrient solution concentrations between 75 and 100% and ozone concentrations ranging from 0–1 mg·L−1 promoted vigorous plant growth, increased yield, improved quality, and enhanced water–fertilizer use efficiency. Furthermore, a higher lower threshold of irrigation, implying more frequent watering, enhanced plant growth. Variance analysis showed that ozone (O) did not significantly affect soluble sugar content and potassium absorption efficiency (KUE) of the first crop (Table 9), but it does significantly impact the phosphorus absorption efficiency (PUE) of the first crop. Furthermore, factors F, W, and O had a highly significant impact on the remaining indicators. Additionally, the interaction between factors F and O, as well as between factors W and O, significantly affected lettuce yield, quality, and water and nutrient use efficiency. The interaction between factors F and W also significantly affected soluble sugar content and had a highly significant impact on the remaining indicators. Range analysis identified F3W4O2 (100% nutrient solution concentration, 85% lower irrigation threshold, 1 mg·L−1 ozone concentration) as the most effective combination, representing the optimal strategy for greenhouse substrate cultivation of lettuce in terms of yield, quality, and resource use efficiency.

Author Contributions

Methodology, D.L.; Software, S.Y.; Investigation, S.G.; Resources, J.F.; Data curation, Q.Z.; Writing—original draft, Q.Z.; Supervision, X.Z. All authors have read and agreed to the published version of the manuscript.

Funding

This work was financed by the Agricultural Science and Technology Innovation Program (ASTIP) of Chinese Academy of Agricultural Sciences.

Data Availability Statement

The data that support the findings of this study are available from the corresponding author upon reasonable request.

Conflicts of Interest

The authors declare that they have no known competing financial interests or personal relationships that could have appeared to influence the work reported in this paper.

References

  1. Liu, S.; Xiao, W.; Ye, Y.; He, T.; Luo, H. Rural Residential Land Expansion and Its Impacts on Cultivated Land in China between 1990 and 2020. Land Use Policy 2023, 132, 106816. [Google Scholar] [CrossRef]
  2. D’Amico, A.; De Boni, A.; Ottomano Palmisano, G.; Acciani, C.; Roma, R. Environmental Analysis of Soilless Tomato Production in a High-Tech Greenhouse. Clean. Environ. Syst. 2023, 11, 100137. [Google Scholar] [CrossRef]
  3. Voutsinos, O.; Mastoraki, M.; Ntatsi, G.; Liakopoulos, G.; Savvas, D. Comparative Assessment of Hydroponic Lettuce Production Either under Artificial Lighting, or in a Mediterranean Greenhouse during Wintertime. Agriculture 2021, 11, 503. [Google Scholar] [CrossRef]
  4. Goren, A.Y.; Eskisoy, D.N.; Genisoglu, S.; Okten, H.E. Microbial Desalination Cell Treated Spent Geothermal Brine as a Nutrient Medium in Hydroponic Lettuce Cultivation: Health Risk Assessment. Sci. Total Environ. 2024, 907, 167778. [Google Scholar] [CrossRef]
  5. Lei, C.; Engeseth, N.J. Comparison of Growth Characteristics, Functional Qualities, and Texture of Hydroponically Grown and Soil-Grown Lettuce. LWT 2021, 150, 111931. [Google Scholar] [CrossRef]
  6. Schmal, J.L.; Dumroese, R.K.; Davis, A.S.; Pinto, J.R.; Jacobs, D.F. Subirrigation for Production of Native Plants in Nurseries-Concepts, Current Knowledge, and Implementation. Nativ. Plants J. 2011, 12, 81–93. [Google Scholar] [CrossRef]
  7. Dumroese, R.K.; Pinto, J.R.; Jacobs, D.F.; Davis, A.S.; Horiuchi, B. Subirrigation Reduces Water Use, Nitrogen Loss, and Moss Growth in a Container Nursery. Nativ. Plants J. 2006, 7, 253–261. [Google Scholar]
  8. Jesse, S.D.; Zhang, Y.; Margenot, A.J.; Davidson, P.C. Hydroponic Lettuce Production Using Treated Post-Hydrothermal Liquefaction Wastewater (PHW). Sustainability 2019, 11, 3605. [Google Scholar] [CrossRef]
  9. Cifuentes-Torres, L.; Mendoza-Espinosa, L.G.; Correa-Reyes, G.; Daesslé, L.W. Hydroponics with Wastewater: A Review of Trends and Opportunities. Water Environ. J. 2021, 35, 166–180. [Google Scholar] [CrossRef]
  10. Majid, M.; Khan, J.N.; Ahmad Shah, Q.M.; Masoodi, K.Z.; Afroza, B.; Parvaze, S. Evaluation of Hydroponic Systems for the Cultivation of Lettuce (Lactuca sativa L., Var. Longifolia) and Comparison with Protected Soil-Based Cultivation. Agric. Water Manag. 2021, 245, 106572. [Google Scholar] [CrossRef]
  11. Pei, Y.; Bie, Z. Effects of Different Irrigation Minima on the Growth and Physiological Characteristics of Lettuce under Plastic Greenhouse. Trans. Chin. Soc. Agric. Eng. 2008, 24, 207–211. [Google Scholar]
  12. Yazgan, S.; Ayas, S.; Demirtas, C.; Büyükangaz, H.; Candogan, B. Deficit Irrigation Effects on Lettuce (Lactuca sativa Var. Olenka) Yield in Unheated Greenhouse Condition. J. Food Agric. Environ. 2008, 6, 357–361. [Google Scholar]
  13. Stamford, N.P.; Felix, F.; Oliveira, W.; Silva, E.; Carolina, S.; Arnaud, T.; Freitas, A.D. Interactive Effectiveness of Microbial Fertilizer Enriched in N on Lettuce Growth and on Characteristics of an Ultisol of the Rainforest Region. Sci. Hortic. 2019, 247, 242–246. [Google Scholar] [CrossRef]
  14. Schmidt, D.; Santos, O.S.; Bonnecarrère, R.A.G.; Mariani, O.A.; Manfron, P.A. Desempenho de soluções nutritivas e cultivares de alface em hidroponia. Hortic. Bras. 2001, 19, 122–126. [Google Scholar] [CrossRef]
  15. Max, J.F.J.; Horst, W.J. Influence of Nighttime Electrical Conductivity of Substrate Solution on Fruit Cracking and Blossom-End Rot of Greenhouse Tomato in the Tropics. J. Plant Nutr. Soil Sci. 2009, 172, 829–838. [Google Scholar] [CrossRef]
  16. Zhang, Y.; Kiriiwa, Y.; Nukaya, A. Influence of Nutrient Concentration and Composition on the Growth, Uptake Patterns of Nutrient Elements and Fruit Coloring Disorder for Tomatoes Grown in Extremely Low-Volume Substrate. Hortic. J. 2015, 84, 37–45. [Google Scholar] [CrossRef]
  17. Li, Y.L.; Stanghellini, C.; Challa, H. Effect of Electrical Conductivity and Transpiration on Production of Greenhouse Tomato (Lycopersicon esculentum L.). Sci. Hortic. 2001, 88, 11–29. [Google Scholar] [CrossRef]
  18. Rouphael, Y.; Cardarelli, M.; Lucini, L.; Rea, E.; Colla, G. Nutrient Solution Concentration Affects Growth, Mineral Composition, Phenolic Acids, and Flavonoids in Leaves of Artichoke and Cardoon. HortScience 2012, 47, 1424–1429. [Google Scholar] [CrossRef]
  19. Neocleous, D.; Savvas, D. Effect of Different Macronutrient Cation Ratios on Macronutrient and Water Uptake by Melon (Cucumis melo) Grown in Recirculating Nutrient Solution. J. Plant Nutr. Soil Sci. 2015, 178, 320–332. [Google Scholar] [CrossRef]
  20. Gonnella, M.; Serio, F.; Conversa, G.; Santamaria, P. Production and nitrate content in lamb’s lettuce grown in floating system. Acta Hortic. 2004, 644, 61–68. [Google Scholar] [CrossRef]
  21. Cheng, G.; Li, Z.; Sun, L.; Li, Y.; Fu, J. Application of Microwave/Electrodeless Discharge Ultraviolet/Ozone Sterilization Technology in Water Reclamation. Process Saf. Environ. Prot. 2020, 138, 148–156. [Google Scholar] [CrossRef]
  22. Diksha; Samandeep; Rehal, J.; Kaur, J. Removal of Pesticide Residues in Food Using Ozone. Food Chem. Adv. 2023, 3, 100512. [Google Scholar] [CrossRef]
  23. Köhne, M.; Hofbauer, L.; Böttcher, D.; Tönissen, A.; Hegger, A.; Görgens, A.; Ulrich, R.; Sieme, H. Comparison of Systemic Trimethoprim-Sulfadimethoxine Treatment and Intrauterine Ozone Application as Possible Therapies for Bacterial Endometritis in Equine Practice. Front. Vet. Sci. 2023, 10, 1102149. [Google Scholar] [CrossRef]
  24. Khanashyam, A.C.; Shanker, M.A.; Kothakota, A.; Mahanti, N.K.; Pandiselvam, R. Ozone Applications in Milk and Meat Industry. Ozone Sci. Eng. 2022, 44, 50–65. [Google Scholar] [CrossRef]
  25. Krylova, L.N. Efficiency of Ozone Application for Extraction of Metals from Mineral Raw Materials. Russ. J. Non-Ferr. Met. 2022, 63, 247–255. [Google Scholar] [CrossRef]
  26. Gao, H.-L.; Wen, Z.-N.; Sun, B.-C.; Zou, H.-K.; Chu, G.-W. Intensification of Ozone Mass Transfer for Wastewater Treatment Using a Rotating Bar Reactor. Chem. Eng. Process.-Process Intensif. 2022, 176, 108946. [Google Scholar] [CrossRef]
  27. Najarian, M.; Mohammadi-Ghehsareh, A.; Fallahzade, J.; Peykanpour, E. Responses of Cucumber (Cucumissativus L.) to Ozonated Water under Varying Drought Stress Intensities. J. Plant Nutr. 2018, 41, 1–9. [Google Scholar] [CrossRef]
  28. Díaz-López, M.; Siles, J.A.; Ros, C.; Bastida, F.; Nicolás, E. The Effects of Ozone Treatments on the Agro-Physiological Parameters of Tomato Plants and the Soil Microbial Community. Sci. Total Environ. 2022, 812, 151429. [Google Scholar] [CrossRef]
  29. Yu, D.-Y.; Kang, N.; Bae, W.; Banks, M.K. Characteristics in Oxidative Degradation by Ozone for Saturated Hydrocarbons in Soil Contaminated with Diesel Fuel. Chemosphere 2007, 66, 799–807. [Google Scholar] [CrossRef]
  30. Aidoo, O.F.; Osei-Owusu, J.; Chia, S.Y.; Dofuor, A.K.; Antwi-Agyakwa, A.K.; Okyere, H.; Gyan, M.; Edusei, G.; Ninsin, K.D.; Duker, R.Q.; et al. Remediation of Pesticide Residues Using Ozone: A Comprehensive Overview. Sci. Total Environ. 2023, 894, 164933. [Google Scholar] [CrossRef]
  31. Garrido, I.; Martínez-Escudero, C.M.; Contreras, F.; Flores, P.; Hellín, P.; Díaz-López, M.; Bastida, F.; Fenoll, J. Degradation of Four Pesticides by Ozonation under Field Conditions and Assessment of Its Influence on Soil Microbial Activity. J. Environ. Chem. Eng. 2023, 11, 110034. [Google Scholar] [CrossRef]
  32. Xu, J.-P.; Yu, Y.-C.; Zhang, T.; Ma, Q.; Yang, H.-B. Effects of Ozone Water Irrigation and Spraying on Physiological Characteristics and Gene Expression of Tomato Seedlings. Hortic. Res. 2021, 8, 180. [Google Scholar] [CrossRef]
  33. Guo, Z.; Wang, Z.; Li, Y.; Wang, Q. Effect of Different Concentrations of Ozone on In Vitro Plant Pathogens Development, Tomato Yield and Quality, Photosynthetic Activity and Enzymatic Activities. Ozone Sci. Eng. 2019, 41, 531–540. [Google Scholar] [CrossRef]
  34. Sharaf-Eldin, M.A.; Alshallash, K.S.; Alharbi, K.R.; Alqahtani, M.M.; Etman, A.A.; Yassin, A.M.; Azab, E.S.; El-Okkiah, S.A.F. Influence of Seed Soaking and Foliar Application Using Ozonated Water on Two Sweet Pepper Hybrids under Cold Stress. Sustainability 2022, 14, 13453. [Google Scholar] [CrossRef]
  35. Burkey, K.; Tisdale, R.; Zobel, R.; Ray, S.; Pursley, W. Interactive Effects of Elevated Ozone and Temperature on Growth and Yield of Soybean (Glycine max (L.) Merr.) under Field Conditions. Agronomy 2020, 10, 1803. [Google Scholar] [CrossRef]
  36. Zheng, L.; Liu, C.; Song, W. Effect of Ozonated Nutrient Solution on the Growth and Root Antioxidant Capacity of Substrate and Hydroponically Cultivated Lettuce (Lactuca sativa). Ozone Sci. Eng. 2020, 42, 286–292. [Google Scholar] [CrossRef]
  37. Chen, H.; Dai, Z.; Jager, H.I.; Wullschleger, S.D.; Xu, J.; Schadt, C.W. Influences of Nitrogen Fertilization and Climate Regime on the Above-Ground Biomass Yields of Miscanthus and Switchgrass: A Meta-Analysis. Sustain. Energy Rev. 2019, 108, 303–311. [Google Scholar] [CrossRef]
  38. Cheng, Q.; Ma, J.; Ren, R.; Zheng, L.; Guo, X.; Sun, X. Effects of Fertilization Management under WSPI on Soil Nitrogen Distribution and Nitrogen Absorption in Apple Orchard in Loess Plateau. Agronomy 2020, 10, 1386. [Google Scholar] [CrossRef]
  39. Belay-Tedla, A.; Zhou, X.; Su, B.; Wan, S.; Luo, Y. Labile, Recalcitrant, and Microbial Carbon and Nitrogen Pools of a Tallgrass Prairie Soil in the US Great Plains Subjected to Experimental Warming and Clipping. Soil Biol. Biochem. 2009, 41, 110–116. [Google Scholar] [CrossRef]
  40. Yan, Y.; Lei, B.; Wang, L.; Bie, Z. Effects of Different Day and Night Temperature on the Growth and Quality of Hydroponic Lettuce. J. Chang. Veg. 2010, 24, 39–42. [Google Scholar]
  41. Li, R.; Zhu, Y.; Takagaki, M.; Yamori, W.; Yang, L. Effects of Root Zone Temperature on the Growth and Mineral Elements Content of Hydroponically-Grown Lettuce. Acta Agric. Shanghai 2015, 31, 48–52. (In Chinese) [Google Scholar]
  42. Chen, Y.; Yang, L.; He, Z. Effects of Temperature on Growth and Quality of Dormancy-Released Sedum aizoon L. IOP Conf. Ser. Earth Environ. Sci. 2019, 310, 052020. [Google Scholar] [CrossRef]
  43. Cheng, M.; Wang, H.; Zhang, F.; Wang, X.; Liao, Z.; Zhang, S.; Yang, Q.; Fan, J. Effects of Irrigation and Fertilization Regimes on Tuber Yield, Water-Nutrient Uptake and Productivity of Potato under Drip Fertigation in Sandy Regions of Northern China. Agric. Water Manag. 2023, 287, 108459. [Google Scholar] [CrossRef]
  44. Ballester, C.; Hornbuckle, J.; Brinkhoff, J.; Quayle, W.C. Effects of Three Frequencies of Irrigation and Nitrogen Rates on Lint Yield, Nitrogen Use Efficiency and Fibre Quality of Cotton under Furrow Irrigation. Agric. Water Manag. 2021, 248, 106783. [Google Scholar] [CrossRef]
  45. Lefever, K.; Laubscher, C.; Ndakidemi, P. The Effects of pH and Phosphorus Concentrations on the Growth Potential of Medicinal Salvia chamelaeagnea in Hydroponic Cultivation. Acta Hortic. 2015, 1104, 29–34. [Google Scholar] [CrossRef]
  46. Ertek, A.; Şensoy, S.; Küçükyumuk, C.; Gedik, İ. Irrigation Frequency and Amount Affect Yield Components of Summer Squash (Cucurbita pepo L.). Agric. Water Manag. 2004, 67, 63–76. [Google Scholar] [CrossRef]
  47. Berners-Lee, M.; Kennelly, C.; Watson, R.; Hewitt, C.N. Current Global Food Production Is Sufficient to Meet Human Nutritional Needs in 2050 Provided There Is Radical Societal Adaptation. Elem. Sci. Anthr. 2018, 6, 52. [Google Scholar] [CrossRef]
  48. Miller, F.A.; Silva, C.L.M.; Brandão, T.R.S. A Review on Ozone-Based Treatments for Fruit and Vegetables Preservation. Food Eng. Rev. 2013, 5, 77–106. [Google Scholar] [CrossRef]
  49. Kleiber, T.; Borowiak, K.; Schroeter-Zakrzewska, A.; Budka, A.; Osiecki, S. Effect of Ozone Treatment and Light Colour on Photosynthesis and Yield of Lettuce. Sci. Hortic. 2017, 217, 130–136. [Google Scholar] [CrossRef]
  50. Liu, Y.; Zhou, Y.; Wang, T.; Pan, J.; Zhou, B.; Muhammad, T.; Zhou, C.; Li, Y. Micro-Nano Bubble Water Oxygation: Synergistically Improving Irrigation Water Use Efficiency, Crop Yield and Quality. J. Clean. Prod. 2019, 222, 835–843. [Google Scholar] [CrossRef]
  51. Sey, B.K.; Manceur, A.M.; Whalen, J.K.; Gregorich, E.G.; Rochette, P. Root-Derived Respiration and Nitrous Oxide Production as Affected by Crop Phenology and Nitrogen Fertilization. Plant Soil 2010, 326, 369–379. [Google Scholar] [CrossRef]
  52. Zhou, Y.; Zhou, B.; Xu, F.; Muhammad, T.; Li, Y. Appropriate Dissolved Oxygen Concentration and Application Stage of Micro-Nano Bubble Water Oxygation in Greenhouse Crop Plantation. Agric. Water Manag. 2019, 223, 105713. [Google Scholar] [CrossRef]
  53. Cengiz, M.; Uslu, M.O.; Balcioglu, I. Treatment of E. coli HB101 and the TetM Gene by Fenton’s Reagent and Ozone in Cow Manure. J. Environ. Manage. 2010, 91, 2590–2593. [Google Scholar] [CrossRef] [PubMed]
  54. Karaca, H.; Velioglu, Y.S. Effects of Ozone Treatments on Microbial Quality and Some Chemical Properties of Lettuce, Spinach, and Parsley. Postharvest Biol. Technol. 2014, 88, 46–53. [Google Scholar] [CrossRef]
  55. Rai, R.; Agrawal, M.; Kumar Choudhary, K.; Agrawal, S.B.; Emberson, L.; Büker, P. Application of Ethylene Diurea (EDU) in Assessing the Response of a Tropical Soybean Cultivar to Ambient O3: Nitrogen Metabolism, Antioxidants, Reproductive Development and Yield. Ecotoxicol. Environ. Saf. 2015, 112, 29–38. [Google Scholar] [CrossRef] [PubMed]
  56. Lee, J.K.; Kwak, M.J.; Jeong, S.G.; Woo, S.Y. Individual and Interactive Effects of Elevated Ozone and Temperature on Plant Responses. Horticulturae 2022, 8, 211. [Google Scholar] [CrossRef]
  57. Wilkinson, S.; Mills, G.; Illidge, R.; Davies, W.J. How Is Ozone Pollution Reducing Our Food Supply? J. Exp. Bot. 2012, 63, 527–536. [Google Scholar] [CrossRef]
  58. Guo, G.; Li, X.; Kuai, J.; Zhang, X.; Peng, X.; Xu, Y.; Zeng, G.; Liu, J.; Zhang, C.; Lin, J. Estimation of Annual Soil CO2 Efflux under the Erosion and Deposition Conditions by Measuring and Modeling Its Respiration Rate in Southern China. J. Environ. Manage. 2024, 351, 119686. [Google Scholar] [CrossRef] [PubMed]
  59. Dejie, K.; Liu, N.; Li, H.; Wang, W.; Li, N.; Ren, G.; Yang, G. Effect of Nitrogen Fertilizer on Soil CO2 Emission Depends on Crop Rotation Strategy. Sustainability 2020, 12, 5271. [Google Scholar] [CrossRef]
  60. Hu, H.; Zhang, L.; Dai, Y.; Di, H.-J.; He, J.-Z. pH-Dependent Distribution of Soil Ammonia Oxidizers across a Large Geographical Scale as Revealed by High-Throughput Pyrosequencing. J. Soils Sediments 2013, 13, 1439–1449. [Google Scholar] [CrossRef]
  61. Sharma, A.; Sepehya, S.; Sharma, R.; Kumar, A. Impact of Various Cropping Systems on the Status and Distribution of Selected Micronutrients in Subtropical Region of Himachal Pradesh, India. Int. J. Plant Soil Sci. 2023, 35, 454–463. [Google Scholar] [CrossRef]
  62. Pan, Z.; He, P.; Fan, D.; Jiang, R.; Song, D.; Song, L.; Zhou, W.; He, W. Global Impact of Enhanced-Efficiency Fertilizers on Vegetable Productivity and Reactive Nitrogen Losses. Sci. Total Environ. 2024, 926, 172016. [Google Scholar] [CrossRef]
Figure 1. Greenhouse average daily temperature and relative humidity map.
Agronomy 14 01619 g001
Figure 2. Schematic diagram of experimental apparatus for the ozone treatment. (a) Diagrammatic drawing; (b) picture of real products.
Agronomy 14 01619 g002
Figure 3. Effect of different treatments on water content of lettuce shoot.
Agronomy 14 01619 g003
Figure 4. N concentration (a), P concentration (b) and K concentration (c) of lettuce plants in response to different treatments.
Agronomy 14 01619 g004
Figure 5. N uptake (a), P uptake (b) and K uptake (c) of lettuce plants in response to different treatments.
Agronomy 14 01619 g005
Figure 6. Effect of different treatments on lettuce plant height. Note: Different uppercase letters after numbers in the same column indicate significant differences at the 0.05 level (First crop). Different lowercase letters after numbers in the same column indicate significant differences at the 0.05 level (Second crop). Means followed by the same letters do not differ significantly.
Agronomy 14 01619 g006
Figure 7. Effect of different treatments on lettuce crown diameter. Note: Different uppercase letters after numbers in the same column indicate significant differences at the 0.05 level (First crop). Different lowercase letters after numbers in the same column indicate significant differences at the 0.05 level (Second crop). Means followed by the same letters do not differ significantly.
Agronomy 14 01619 g007
Figure 8. VC (a), soluble protein (b), soluble sugar (c) and nitrate (d) contents in lettuce leaves. Note: Different lowercase letters after numbers in the same column indicate significant differences at the 0.05 level. Means followed by the same letters do not differ significantly.
Agronomy 14 01619 g008
Figure 9. WUE of lettuce plants in response to different treatments. Note: Different uppercase letters after numbers in the same column indicate significant differences at the 0.05 level (First crop). Different lowercase letters after numbers in the same column indicate significant differences at the 0.05 level (Second crop). Means followed by the same letters do not differ significantly.
Agronomy 14 01619 g009
Figure 10. N (a), P (b), K (c) uptake and utilization efficiency of lettuce plants in response to different treatments.
Agronomy 14 01619 g010
Figure 11. Effect of each experimental index on (a) nutrient solution concentration, (b) lower irrigation threshold and (c) ozone concentration.
Agronomy 14 01619 g011
Table 1. Substrate physical characteristics.
Bulk Density
(g·cm−3)
Total Pore Porosity
(%)
Ventilation Pore Porosity
(%)
Water-Holding Porosity
(%)
0.2267.5220.8446.68
Table 2. Substrate chemical characteristics.
pHEC
(μS·cm−1)
N
(g·kg−1)
P
(g·kg−1)
K
(g·kg−1)
SOM
(g·kg−1)
6.738020.350.215.64164
Table 3. Hoagland’s nutrient solution formula.
Formulation ElementsDissolved SubstanceConcentration (mg·L−1)
Major elementsCa(NO3)2·4H2O945
MgSO4493
(NH4)3PO4115
KNO3607
Ferrous saltDPTA-Fe-1130
Minor elementsHBO32.86
CuSO4·5H2O0.08
ZnSO4·7H2O0.22
MnSO4·4H2O2.13
(NH4)6Mo7O24·4H2O0.02
Table 4. Orthogonal experimental design scheme.
TreatmentNutrient (F) Solution Concentration (%)Lower Irrigation Threshold (W) (%FC)Ozone (O)
Concentration (mg·L−1)
EC (mS·cm−1)pH
N1W1O150 (F1)40 (W1)0 (O1)1.36.52
N1W2O25055 (W2)1 (O2)1.36.53
N1W3O35070 (W3)2 (O3)1.36.52
N1W4O45085 (W4)4 (O4)1.36.51
N2W1O275 (F2)4011.86.51
N2W2O1755501.86.53
N2W3O4757041.86.52
N2W4O3758521.86.51
N3W1O3100 (F3)4022.26.50
N3W2O41005542.26.52
N3W3O11007002.26.51
N3W4O21008512.26.51
N4W1O4125 (F4)4012.66.50
N4W2O31255542.66.49
N4W3O21257022.66.48
N4W4O11258502.66.50
Table 5. Sampling time for each treatment.
CropsSampling Time
FirstSecondThirdFourthFifth
First crop27-March2-April8-April14-April20-April
Second crop9-May15-May21-May27-May2-June
Table 6. Effect of different treatments on lettuce biomass in the first crop.
TreatmentShoot Fresh Weight (g)Shoot Dry Weight (g)Root Fresh Weight (g)Root Dry Weight (g)Root to Shoot RatioShoot Dry Matter Rate (%)
F1W1O134.93 ± 1.20 i2.20 ± 0.11 g5.92 ± 0.14 i0.43 ± 0.06 h0.169 ± 0.003 d6.27 ± 0.51 d
F1W2O241.27 ± 2.19 gh2.65 ± 0.12 de7.46 ± 0.10 de0.49 ± 0.03 cdefg0.181 ± 0.009 c6.41 ± 0.25 cd
F1W3O344.44 ± 1.14 efg2.40 ± 0.11 fg7.00 ± 0.18 fg0.46 ± 0.05 fgh0.158 ± 0.002 f5.39 ± 0.36 i
F1W4O445.16 ± 1.38 ef2.68 ± 0.14 cde7.37 ± 0.17 e0.50 ± 0.03 bcdef0.163 ± 0.002 ef5.93 ± 0.39 ef
F2W1O240.87 ± 1.61 gh2.68 ± 0.17 cde7.87 ± 0.12 c0.52 ± 0.01 bcde0.193 ± 0.005 b6.55 ± 0.45 c
F2W2O143.16 ± 1.27 fgh2.50 ± 0.04 ef7.70 ± 0.29 cd0.49 ± 0.01 cdefgh0.178 ± 0.003 c5.78 ± 0.08 fg
F2W3O450.19 ± 0.95 cd2.95 ± 0.09 b7.43 ± 0.13 e0.47 ± 0.02 efgh0.148 ± 0.000 j5.87 ± 0.06 ef
F2W4O359.48 ± 1.44 b3.34 ± 0.16 a8.32 ± 0.18 b0.54 ± 0.02 abc0.140 ± 0.001 h5.61 ± 0.14 gh
F3W1O339.89 ± 1.82 h2.24 ± 0.11 g7.22 ± 0.19 ef0.46 ± 0.03 fgh0.181 ± 0.004 c5.61 ± 0.57 gh
F3W2O447.53 ± 2.16 de2.86 ± 0.07 bc7.90 ± 0.16 c0.49 ± 0.02 cdefgh0.166 ± 0.006 de6.01 ± 0.34 e
F3W3O152.49 ± 1.29 c2.92 ± 0.02 b7.79 ± 0.14 c0.52 ± 0.01 abcd0.148 ± 0.001 j5.56 ± 0.27 gh
F3W4O266.19 ± 1.37 a3.53 ± 0.07 a8.68 ± 0.27 a0.55 ± 0.04 ab0.131 ± 0.002 i5.33 ± 0.19 i
F4W1O431.57 ± 1.20 i2.23 ± 0.12 g6.52 ± 0.07 h0.47 ± 0.04 efgh0.207 ± 0.006 a7.07 ± 0.13 a
F4W2O340.31 ± 1.42 h2.77 ± 0.10 bcd6.88 ± 0.10 g0.44 ± 0.03 gh0.171 ± 0.004 d6.86 ± 0.06 b
F4W3O251.58 ± 1.27 c2.87 ± 0.07 bc7.76 ± 0.20 c0.48 ± 0.04 defgh0.150 ± 0.002 j5.57 ± 0.05 h
F4W4O161.46 ± 1.09 b3.48 ± 0.13 a8.57 ± 0.16 a0.57 ± 0.05 a0.139 ± 0.004 h5.67 ± 0.12 gh
Note: Different lowercase letters after numbers in the same column indicate significant differences at the 0.05 level. Means followed by the same letters do not differ significantly. The bold font in the table represents the maximum value of each indicator.
Table 7. Effect of different treatments on lettuce biomass in the second crop.
TreatmentShoot Fresh Weight (g)Shoot Dry Weight (g)Root Fresh Weight (g)Root Dry Weight (g)Root to Shoot RatioShoot Dry Matter Rate (%)
F1W1O145.08 ± 1.66 i3.43 ± 0.12 i6.48 ± 0.13 j0.50 ± 0.04 f0.144 ± 0.003 d7.60 ± 0.17 ghi
F1W2O251.95 ± 1.05 gh3.70 ± 0.09 h7.25 ± 0.08 i0.53 ± 0.07 ef0.140 ± 0.001 e7.12 ± 0.03 j
F1W3O359.24 ± 1.34 ef4.41 ± 0.18 f8.26 ± 0.11 g0.63 ± 0.04 bcde0.139 ± 0.002 e7.45 ± 0.17 i
F1W4O462.47 ± 1.89 de4.93 ± 0.08 d9.67 ± 0.09 c0.74 ± 0.01 b0.155 ± 0.003 c7.86 ± 0.22 ef
F2W1O252.69 ± 0.66 g4.07 ± 0.10 g8.24 ± 0.17 g0.64 ± 0.07 bcde0.156 ± 0.002 c7.73 ± 0.56 fgh
F2W2O157.08 ± 0.43 f4.69 ± 0.09 e9.40 ± 0.15 d0.74 ± 0.06 b0.165 ± 0.002 b8.22 ± 0.77 cd
F2W3O463.19 ± 2.02 d4.91 ± 0.07 d8.86 ± 0.14 e0.67 ± 0.11 bcd0.140 ± 0.002 e7.76 ± 0.13 fg
F2W4O376.49 ± 1.65 b5.94 ± 0.13 b10.82 ± 0.14 b0.92 ± 0.08 a0.141 ± 0.002 de7.76 ± 0.39 fg
F3W1O343.35 ± 1.09 i3.62 ± 0.10 h7.11 ± 0.18 i0.57 ± 0.03 def0.164 ± 0.001 b8.35 ± 0.34 bc
F3W2O449.06 ± 1.52 h3.95 ± 0.05 g7.64 ± 0.06 h0.61 ± 0.07 cdef0.156 ± 0.004 c8.05 ± 0.17 de
F3W3O162.10 ± 1.58 de4.69 ± 0.16 e9.00 ± 0.20 e0.71 ± 0.12 bc0.145 ± 0.001 d7.55 ± 0.11 hi
F3W4O281.46 ± 0.90 a6.21 ± 0.15 a11.53 ± 0.06 a1.02 ± 0.10 a0.142 ± 0.001 de7.62 ± 0.19 ghi
F4W1O433.54 ± 0.76 j3.00 ± 0.06 j6.06 ± 0.06 k0.49 ± 0.02 f0.181 ± 0.002 a8.94 ± 0.13 a
F4W2O343.69 ± 1.55 i3.53 ± 0.10 hi6.23 ± 0.07 k0.50 ± 0.08 f0.143 ± 0.003 de8.08 ± 0.05 de
F4W3O257.87 ± 1.16 f4.87 ± 0.13 d7.46 ± 0.23 h0.62 ± 0.08 cde0.129 ± 0.003 f8.42 ± 0.39 b
F4W4O170.46 ± 1.61 c5.67 ± 0.10 c8.53 ± 0.18 f0.69 ± 0.06 bc0.121 ± 0.001 j8.04 ± 0.48 de
Note: Different lowercase letters after numbers in the same column indicate significant differences at the 0.05 level. Means followed by the same letters do not differ significantly. The bold font in the table represents the maximum value of each indicator.
Table 8. Effect of different treatments on lettuce yield.
TreatmentYield (t·ha−1)
First CropSecond Crop
F1W1O110.14 ± 0.46 i11.46 ± 0.42 i
F1W2O210.49 ± 0.56 gh13.20 ± 0.27 gh
F1W3O311.30 ± 0.29 efg15.06 ± 0.34 ef
F1W4O411.48 ± 0.35 ef17.08 ± 0.35 de
F2W1O210.39 ± 0.41 gh13.39 ± 0.17 g
F2W2O110.97 ± 0.32 fgh14.51 ± 0.11 f
F2W3O412.76 ± 0.24 cd16.06 ± 0.51 d
F2W4O315.62 ± 0.28 b20.59 ± 0.46 b
F3W1O38.88 ± 0.30 h11.02 ± 0.28 i
F3W2O412.08 ± 0.55 de12.47 ± 0.39 h
F3W3O113.34 ± 0.33 c15.78 ± 0.40 de
F3W4O216.82 ± 0.35 a20.70 ± 0.23 a
F4W1O48.02 ± 0.30 i8.52 ± 0.19 j
F4W2O310.25 ± 0.36 h11.1 ± 0.39 i
F4W3O213.11 ± 0.32 c14.71 ± 0.30 f
F4W4O115.12 ± 0.37 b17.91 ± 0.41 c
Note: Different lowercase letters after numbers in the same column indicate significant differences at the 0.05 level. Means followed by the same letters do not differ significantly. The bold font in the table represents the maximum value of each indicator.
Table 9. Variance analysis (Tukey (HSD)).
FactorFWOF × OF × WW × O
YieldFirst crop11.34 **37.87 **7.36 **42.82 **13.30 **17.28 **
Second crop0.74 **2.44 **0.47 **2.83 **0.85 **1.12 **
QualityVCFirst crop811.51 **751.33 **49.29 *859.55 **157.51 **919.73 **
Soluble proteinFirst crop2.50 **44.72 **1.45 **45.20 **1.93 **2.98 **
Soluble sugarFirst crop4.19 **29.54 **0.34 ns31.39 **2.19 *6.04 **
NitrateFirst crop7052.55 **10,592.41 **23,398.08 **22,392.49 **3519.16 **18,853.63 **
WUEFirst crop123.45 **735.37 **79.88 **825.00 **169.51 **213.08 **
Second crop175.03 **586.75 **113.55 **678.85 **205.65 **267.14 **
FUENUEFirst crop2774.92 **42.34 *86.72 **234.19 **278.57 **2966.77 **
Second crop2365.07 **109.62 **135.09 **378.69 **404.16 **2634.14 **
PUEFirst crop427.57 **15.36 **5.03 *33.86 **23.53 **446.07 **
Second crop321.16 **28.20 **12.92 **39.25 **23.96 **332.20 **
KUEFirst crop46.38 **3.90 **0.43 ns6.16 **2.69 **48.64 **
Second crop44.04 **7.76 **1.64 **11.16 **5.05 **47.44 **
Abbreviations: F, nutrient solution concentration; W, lower irrigation threshold; O, ozone concentration. * significant. ** extremely significant. ‘ns’ no significant.
Table 10. Range analysis.
FactorIndexYield (t·ha−1)VC
(μg·g−1)
Protein
(mg·g−1)
Soluble Sugar
(mg·g−1)
Nitrate
(μg·g−1)
WUE (kg·m−3)NUE (%)PUE (%)KUE (%)
First CropSecond CropFirst CropSecond CropFirst CropSecond CropFirst CropSecond CropFirst CropSecond Crop
FK143.4056.80364.4119.4846.753856118.88119.77133.39148.2653.5945.3216.4219.00
K249.7364.55384.1121.0547.833836129.31128.5193.55128.8139.4236.5113.2416.66
K351.1259.98404.3221.6448.083760134.03122.9288.39122.1232.9826.5310.5113.12
K446.5052.25385.7620.8945.493765125.27110.2759.4781.4725.4522.257.1810.33
k110.5814.2091.104.8711.6996429.7229.9433.3537.0613.4011.334.104.75
k212.4316.1496.035.2611.9695932.3332.1323.3932.209.859.133.314.17
k312.7814.99101.085.4112.0294033.5130.7322.1030.538.256.632.633.28
k411.6213.0696.445.2211.3794131.3227.5714.8720.376.365.561.802.58
Range1.933.079.980.540.65243.794.5618.4816.707.045.772.312.17
WK137.4343.39369.6815.6443.423874108.36106.0288.73111.3234.9228.4610.3712.88
K243.7951.28376.8120.3645.903811121.99113.3993.04121.3037.2532.2711.6514.41
K350.5161.61385.9022.3348.023803131.67123.8095.67123.6139.7334.9012.2815.09
K459.0476.28406.2224.7550.813729145.47138.2697.37124.4339.5434.9913.0516.73
k19.3611.1092.423.9110.8696927.0926.5022.1827.838.737.122.593.22
k210.9512.8294.205.0911.4895330.5028.3523.2630.339.318.072.913.60
k312.6315.4096.485.5812.0095132.9230.9523.9230.909.938.733.073.77
k414.7619.07101.556.1912.7093236.3734.5724.3431.119.898.753.264.18
Range5.407.979.142.281.85369.288.062.163.281.201.630.670.96
OK149.5759.66380.6220.5547.293907129.43123.4796.96124.7337.2431.9711.3514.55
K250.8162.01390.2421.8047.353693132.10126.6298.96126.8838.7834.9812.2015.74
K346.0457.77384.1120.4546.853794125.77118.9391.91116.1939.0733.5212.0614.87
K444.3454.14383.6320.2846.663823120.18112.4486.97112.8636.3530.1511.7413.96
k112.3914.9195.155.1411.8297732.3630.8724.2431.189.317.992.843.64
k212.7015.5097.565.4511.8492333.0331.6624.7431.729.708.743.053.93
k311.5114.4496.035.1111.7194931.4429.7322.9829.059.778.383.023.72
k411.0813.5395.915.0711.6695630.0528.1121.7428.229.097.542.933.49
Range1.621.972.410.380.17532.983.543.003.510.681.210.210.44
Disclaimer/Publisher’s Note: The statements, opinions and data contained in all publications are solely those of the individual author(s) and contributor(s) and not of MDPI and/or the editor(s). MDPI and/or the editor(s) disclaim responsibility for any injury to people or property resulting from any ideas, methods, instructions or products referred to in the content.

