Article

Physiological Factors Associated with Interspecific Variations in Drought Tolerance in Centipedegrass

1
Chongqing Key Laboratory of Germplasm Innovation and Utilization of Native Plants, Chongqing Landscape and Gardening Research Institute, Chongqing 401329, China
2
College of Agro-Grassland Science, Nanjing Agricultural University, Nanjing 210095, China
3
College of Soil and Water Conservation, Southwest Forestry University, Kunming 650224, China
*
Author to whom correspondence should be addressed.
These authors contributed equally to this work.
Agronomy 2024, 14(8), 1624; https://doi.org/10.3390/agronomy14081624
Submission received: 2 July 2024 / Revised: 20 July 2024 / Accepted: 24 July 2024 / Published: 25 July 2024
(This article belongs to the Section Grassland and Pasture Science)

Abstract

:
Drought stress is a critical abiotic factor that impedes plant growth and development, particularly in arid and semi-arid regions during summer. This study investigated the physiological mechanism of drought tolerance and post-drought recovery in two genotypes of centipedegrass (Eremochloa ophiuroides): the drought-resistant CG101 and the drought-sensitive CG021. The research studied the impacts of drought and subsequent rehydration on turf quality, leaf relative water content, electrolyte leakage rate (EL), photochemical efficiency (Fv/Fm), relative water loss rate (RWLR), and relative water uptake rate as well as the contents of proline, total soluble sugars, betaine, and leaf wax content (LWC) and the morphology of the root system. The findings revealed that the higher drought tolerance of CG101 was primarily associated with the superior cell membrane stability (lower EL), greater Fv/Fm, better water retention capacity (higher LWC and lower RWLR). In addition, the extensive root system of CG101, characterized by greater total root length and surface area, collectively contributed to the stronger drought tolerance of the drought-tolerant CG101 in comparison with the drought-sensitive CG021. During rehydration, the RWC of CG021 did not fully recover to the control levels mainly due to the reduced leaf Fv/Fm, LWC as well as the root length, root surface area, root volume, and the relatively weaker osmotic regulatory ability. This study provides insights into the physiological mechanisms resulting in interspecific variations in drought tolerance and post-drought recovery in centipedegrass, and offers theoretical support for breeding drought-resistant varieties in centipedegrass.

1. Introduction

Drought stress is one of the most important abiotic stresses limiting plant growth and development, particularly during summer in arid and semi-arid regions. Centipedegrass (Eremochloa ophiuroides (Munro) Hack.), a C4 warm-season grass, is extensively used as both forage and turfgrass [1,2]. Originating from China, it is aptly dubbed “Chinese turfgrass” and has become widely used in the southern area of the Yangtze River Basin in China, Southeast Asia, East Asia, and the southern and eastern United States [3,4]. As a turfgrass species, centipedegrass is recognized as a low-input turfgrass due to its reduced maintenance requirements and enhanced tolerance to various environmental stresses including drought [5]. This tolerance is exemplified by its ability to withstand leaf curling and wilting without mortality after 40 days of drought stress, as observed by Guo et al. [6]. Furthermore, in comparison with other warm-season turfgrasses, centipedegrass exhibits superior drought tolerance and post-drought recovery capabilities [7]. The tolerance of centipedegrass is often attributed to its deep and extensive root system, which allows it to access more water from deeper soil layers [8,9]. For example, Huang et al. [8] compared the drought resistance of seven warm-season turfgrasses and found that while drought inhibited the root growth of bermudagrass (Cynodon dactylon), zoysiagrass (Zoysia spp.), and seashore paspalum (Paspalum vaginatum) at a soil depth of 20–40 cm, the root growth of centipedegrass was not suppressed until the soil depth reached 40 cm. After rewatering, the root dry weight rapidly recovered to the control level due to the higher root growth and water uptake ability at the deeper soil layer.
Despite the stress tolerance and recovery capability of centipedegrass, interspecific variations exist within the species, potentially due to differences in stress resistance among various accessions or varieties [6,8,10]. These variations are reflected in the differing responses to drought, which involve multiple physiological factors such as photosynthetic parameters, water retaining capacity, membrane stability, and root growth [6,7,8,11]. A study on five varieties of centipedegrass revealed that the drought stress duration led to a decreased relative water content (RWC) in the leaves and stems and increased the electrolyte leakage (EL), with the extent of these changes varying among varieties, indicating significant interspecific differences in drought resistance and post-drought recovery [12]. Drought-tolerant ecotypes showed greater chlorophyll content and lower EL in centipedegrass [11]. Osmotic adjustment is a crucial physiological mechanism that plants use to cope with drought stress. In plant cells, drought stress promoted the accumulation of compatible solutes such as soluble carbohydrates (e.g., sucrose, fructose, glucose), proline, and glycine betaine (GB) to maintain the cell turgor pressure, which is essential for maintaining cellular functions and overall plant growth under water-deficit conditions [13,14,15,16]. Drought-tolerant plants generally accumulate more compatible solutes than drought-sensitive ones, as shown in soybean (Glycine max) [17], coffee (Coffea arabica L.) [18], sugar beet (Beta vulgaris) [19], and wheat (Triticum aestivum L.) [20]. However, it is important to note that different compatible solutes respond differently to stresses. In wheat, drought-tolerant C306 showed a relatively higher accumulation of proline but lower GB in comparison with drought-sensitive HD2329 under stressed conditions [21]. In rice (Oryza sativa L.) seedlings, the stress-sensitive variety accumulated more proline than the stress-tolerant ones under drought, salt, and chilling stressed conditions [22]. These findings reveal that the changes in different compatible solutes in plants are not uniform and could serve as an indicator of either stress tolerance or injury.
Despite the considerable research on the drought tolerance of centipedegrass, there are limited documents about the physiological mechanisms underlying the drought tolerance and post-drought recovery capabilities between drought-tolerant and drought-sensitive genotypes. Our previous study found that ‘CG101’ and ‘CG021’ were two genotypes of centipedegrass with different tolerance in response to drought stress (unpublished data). This study used the drought-tolerant ‘CG101’ and the drought-sensitive ‘CG021’ to (i) compare the differences between ‘CG101’ and ‘CG021’ from aspects of water retention capacity, osmotic adjustment, and wax content as well as root growth and (ii) elucidate the differential responding mechanism of both genotypes to drought and post-drought recovery treatments at the physiological level. These findings provide the theoretical support and work foundation for the breeding of drought-tolerant varieties of centipedegrass.

2. Materials and Methods

2.1. Plant Materials and Growth Environment

The drought-sensitive genotype CG021 and the drought-tolerant genotype CG101 were obtained from the Zhongying Germplasm Resource Nursery at Nanjing Agricultural University, Nanjing, Jiangsu Province, China. The experiment was conducted in a temperature-controlled glass greenhouse at the Weigang campus of Nanjing Agricultural University, with a temperature of 30/18 °C (day/night), a 12-h photoperiod, and a relative humidity of 60%. Stolon segments were used for propagation, with 15–20 segments per pot. PVC pots (diameter 10 cm and height 25 cm) were used as cultivating containers with a substrate of expanded clay. Materials were watered by tap water every day and trimmed every 2 days, following the 1/3 principle to maintain a height of 4–5 cm. Water-soluble fertilizer with major elements was applied once a week. Turf management practices including trimming and fertilization were ceased in order to avoid interference with treatments during the experimental period.

2.2. Experimental Design

The experiment comprised three treatments for each genotype including the well-watered control, drought stress, and re-watering. Before the initiating treatments, all pots were thoroughly watered to ensure uniform soil moisture conditions. Subsequently, for drought stress, irrigation was stopped when the soil water content (SWC) was below 5% [9]. For the well-watered control, plants were watered once a day until drops of water drained from the bottom of the pots. For re-watering, plants initially exposed to drought stress were fully rehydrated daily, the same as the well-watered control, in order to recover from drought stress. Each treatment was conducted in five pots as five replicates for each genotype. The positions of each pot were changed daily during the experiment to minimize the impact of environmental variations.

2.3. Measurements of Growth and Physiological Indices

The soil water content (SWC) is an indicator of the soil water availability. At 0, 5, 10, 15, 20, re-1 (rehydration for 1 d), and re-5 (rehydration for 5 d) of the experimental period, SWC was measured using time domain reflectometry (Mini Trase Kit 6050X3, Soil Moisture Equipment Corp., Santa Barbara, CA, USA) with a probe length of 20 cm, which obtained the water content of the 0–20 cm soil layer through vertically inserting the probe into the soil [9].
Turf quality (TQ) is an overall turf performance according to the National Turfgrass Evaluation Program (NTEP) system, which considers parameters such as texture, color, uniformity, and density [23]. TQ was evaluated every 5 days, with scores ranging from 1 (the worst with the completely dead plants) to 9 (the best with the green and dense turf canopy). A score of 6 was considered to be acceptable, representing the minimum threshold for TQ.
The leaf water status was estimated by measuring the relative RWC in fully expanded leaves at 0, 5, 10, 15, 20, re-1, and re-5 d, respectively. Leaf RWC (%) was calculated as (FW − DW)/(TW − DW) × 100, where FW is the fresh weight, TW is the turgid weight, and DW is the dry weight. The FW was immediately weighed after the leaves were excised from the plants, then moved into pots filled with deionized water, and left for 12 h in the dark at 4 °C. Leaves were blotted dry to immediately weigh them for the TW. The DW of leaves was immediately weighed after drying in an oven at 80 °C for 72 h [24].
The relative water loss rate (RWLR) and the relative water uptake rate (RWUR) of the detached leaves were measured in order to evaluate the differences between the two genotypes of centipedegrass [9,25]. The leaf RWLR was calculated by the following formula: RWLR (mg·g−1DW·min−1) = (FW − Wt)/(DW × T). Briefly, fully-expanded leaves were detached and weighed immediately for the FW. Then, leaves were moved into Petri dishes in a growth chamber with a temperature of 25 °C, 150 µmol·m−2·s−1 light intensity, and 50% relative humidity. RWLR was determined as the difference of leaf weight (Wt) at a specific time (T) of dehydration (30, 60, 90, 120, 150, 180, and 210 min) from the initial FW relative to the DW. During rehydration, detached leaves exposed to 210 min dehydration were immersed in water again in Petri dishes in order to determine the RWUR at 30, 60, 90, 120, 150, 180, and 210 min of re-watering to measure the RWC of each sample at a specific time in the dehydration process.
Leaf photosynthetic efficiency (Fv/Fm) at 0, 5, 10, 15, 20, re-1, and re-5 d was determined by measuring the chlorophyll fluorescence with a fluorescence induction monitor (OPTI-Sciences, Hudson, NY, USA). The leaf was adapted under dark for 30 min with a leaf clip. Then, Fv/Fm was obtained by the ratio of variable to maximum fluorescence [26].
Leaf wax content (LWC) at 0 and 20 d was assessed using the method described by Yu et al. [9]. In brief, freshly collected leaf samples (0.2 g) were initially weighed (FW0) and then submerged in 30 mL of chloroform for a duration of 15 s. Subsequently, the chloroform extract was evaporated using a boiling water bath, and the final weight (FW1) was measured. The leaves were then subjected to drying in an oven at 80 °C for a minimum of 72 h to obtain the dry weight (DW). The LWC was calculated as (FW0 − FW1)/DW (mg·g−1DW).
Electrolyte leakage (EL) is an extensively used parameter of membrane stability and integrity [27]. Samples (~0.2 g) of leaf and root at 0, 5, 10, 15, 20, re-1, and re-5 d were immersed in 30 mL of deionized water, respectively. After 24 h of constant shaking at a controlled room temperature, the initial electrical conductivity was measured (Cinitial). Then, samples were autoclaved at 121 °C for 15 min, followed by another 24 h of shaking, and the final electrical conductivity was measured (Cmax). EL (%) was calculated as Cinitial/Cmax × 100.
At the twentieth day of the drought stress period and after 5 days of re-watering treatments, plant samples were collected for the analysis of root length, root surface areas, and root volume. Roots of the upper 0–20 cm from each pot were meticulously washed to remove any growth medium and then stained using a 1% crystal violet solution. The stained roots were scanned with an Epson scanner (Version 2.94A; Seiko Epson Corp., Najano, Suwa, Japan) to generate digital root images. These images were later subjected to analysis using WinRHIZO root analysis software (Version Pro2007d; Regent Instruments Inc., Quebec, QC, Canada) to determine the total length of the roots, root surface area, and root volume

2.4. Determination of Osmoregulants

The total soluble carbohydrates (TSC) of the leaves and roots including glucose, fructose, and sucrose were determined using the phenol-sulfuric acid method described by Liu et al. [28] with some alterations. For plants at 0, 20, and re-5 days of growth, 0.05 g of the dry samples were ground into a fine powder. For the extraction of sugars, the powder was combined with 5.0 mL of 80% (v/v) ethanolic solution in a 15 mL centrifuge tube and placed in a water bath at 30 °C for 30 min. These tubes were subsequently centrifuged at 4500 rpm for 10 min to obtain the supernatant. This liquid was then poured into 50 mL centrifuge tubes, to which 2.5 mL of an 80% (v/v) ethanolic solution was added, and the extraction was repeated twice using the same procedure to yield the final extractant. A 1 mL portion of this extractant was combined with 1 mL of 23% (v/v) phenol solution, followed by the addition of 5 mL of 98% (v/v) sulfuric acid, and thoroughly mixed. This mixture was allowed to reach room temperature for 15 min before being placed back into the water bath at 30 °C for an additional 30 min. The absorbance of this mixture at 490 nm was then recorded using a spectrophotometer (Ultrospec 2100 pro, Biochrom Ltd., Cambridge, UK). The contents of glucose, fructose, and sucrose were obtained by their respective standard curves. The total soluble sugars was computed as the sum of glucose, fructose, and sucrose.
Leaf proline content was determined at 0, 20, and re-5 days of treatments, following the method outlined by Dong et al. [29] with some modifications. In brief, 0.2 g of the leaf and root samples collected were immersed in 5 mL of sulfosalicylic acid (3%, w/v) in a pot and heated for 10 min in a boiling water bath. The resulting solution was combined with equal volumes of glacial acetic acid and acidic ninhydrin. Subsequently, the mixture was subjected to 30-min heating in a boiling water bath, followed by cooling, and the addition of 4 mL of methylbenzene. The resulting mixture automatically separated into two phases, and the upper phase was harvested and centrifuged at 3000 rpm for 5 min. The supernatant was then assessed for absorbance at 520 nm using a spectrophotometer (Ultrospec 2100 pro, Biochrom Ltd., Cambridge, UK). The proline concentration in the supernatant was determined by referencing the absorbance gradients caused by methylbenzene. Proline content in the leaves was expressed as micrograms per gram dry weight.
The determination of GB of both the leaves and roots followed the protocol described by Wang et al. [30]. For samples obtained at 0, 20, and re-5 days of treatments, 0.5 g of dry leaf tissue powder was extracted in 12.5 mL of water. The extraction involved shaking the mixture for 30 min, followed by centrifugation at 4000 rpm for 5 min. The resulting supernatant was filtered, and the filtrate was then transferred to solid-phase extraction cartridges (150 mg/6 mL; Poly-Sery MCX, CNW Technologies GmbH, Düsseldorf, Germany). Subsequently, the extraction cartridges underwent a rinsing process using methanol/water (85/15, v/v) and pure methanol. Elution was carried out using a mixture of ammonia water/methanol (5:95, v/v) performed twice. The eluent was evaporated to dryness, and the residue was reconstituted with acetonitrile/water (50%, v/v). This solution was then passed through a 0.45 µm Millipore membrane for further analysis using high-performance liquid chromatography (HPLC) on a Hitachi D2000 system (Hitachi Ltd., Tokyo, Japan). The mobile phase for the HPLC analyses consisted of acetonitrile/water (50%, v/v). GB was analyzed and quantified using an HPLC system equipped with a Waters Atlantis HILIC silica column (4.6 × 150 mm filled with 5 μm particle diameter; Milford, MA, USA). Peak areas were integrated and compared with a standard curve constructed using a glycine betaine standard for quantification.

2.5. Statistical Analysis

The data were subjected to statistical analysis using SPSS 26.0 software (PASW statistics 18.0; IBM Corp., Armonk, NY, USA). One-way analysis of variance (ANOVA) was selected to analyze the data for different treatments. When the F test (homogeneity of variance) was significant, the least significant difference (LSD) test was used to test the means at a probability level of 0.05 for the line charts. The means ± standard error (SE) was used in the bar charts, and Duncan’s test was used for multiple comparisons of means (p < 0.05). All charts were generated with Sigmaplot 14.0.

3. Results

3.1. Soil Moisture Status after Drought and Rehydration

Under the well-watered control conditions, the SWC remained around 31.00% without significant differences in both genotypes (Figure 1). Under drought stress, the SWC of both genotypes rapidly decreased, reaching around 5.00% after 20 days of drought stress. Upon 5 d of rehydration, the SWC promptly recovered to the levels of the well-watered control (Figure 1). Throughout the drought and rehydration processes, there were no significant differences in SWC between the two genotypes, indicating that both genotypes consistently experienced similar levels of water deficit.

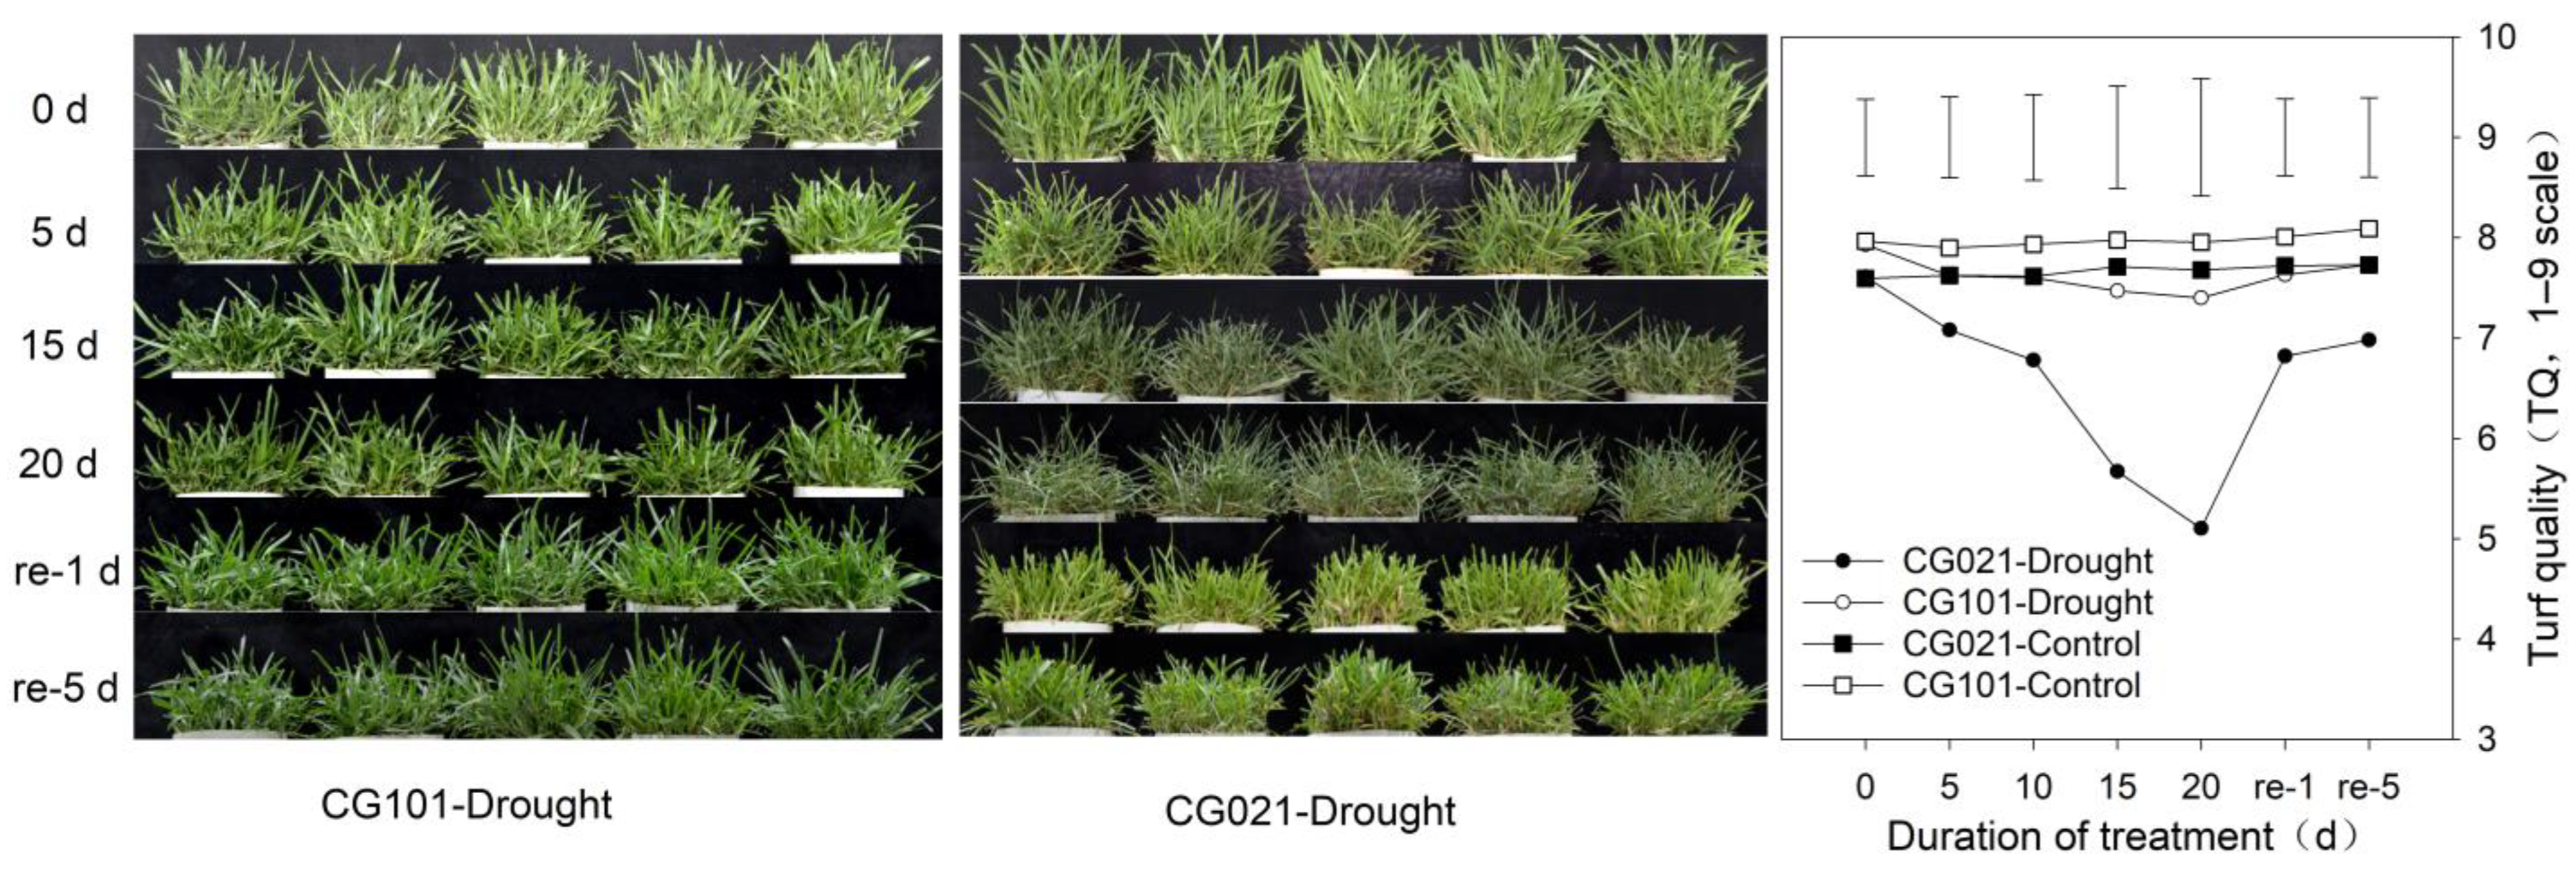
3.2. Effects of Drought and Rehydration on Turf Quality

Under the well-watered control conditions, no significant difference was found in the TQ between the drought-sensitive CG021 and drought-tolerant CG101 (Figure 2). After 5 days of drought stress, the TQ of the drought-sensitive CG021 rapidly declined by 26.52% and 33.59% compared with the control at 15 and 20 d, respectively, and significantly lower than CG101. CG101 did not exhibit a significant decrease in TQ compared to the control throughout the entire drought stressed period. Following rehydration, the TQ of CG021 did not reach the level of the control until after 5 days of rehydration. CG101 consistently maintained a higher level of TQ without significant differences compared to the control (Figure 2).

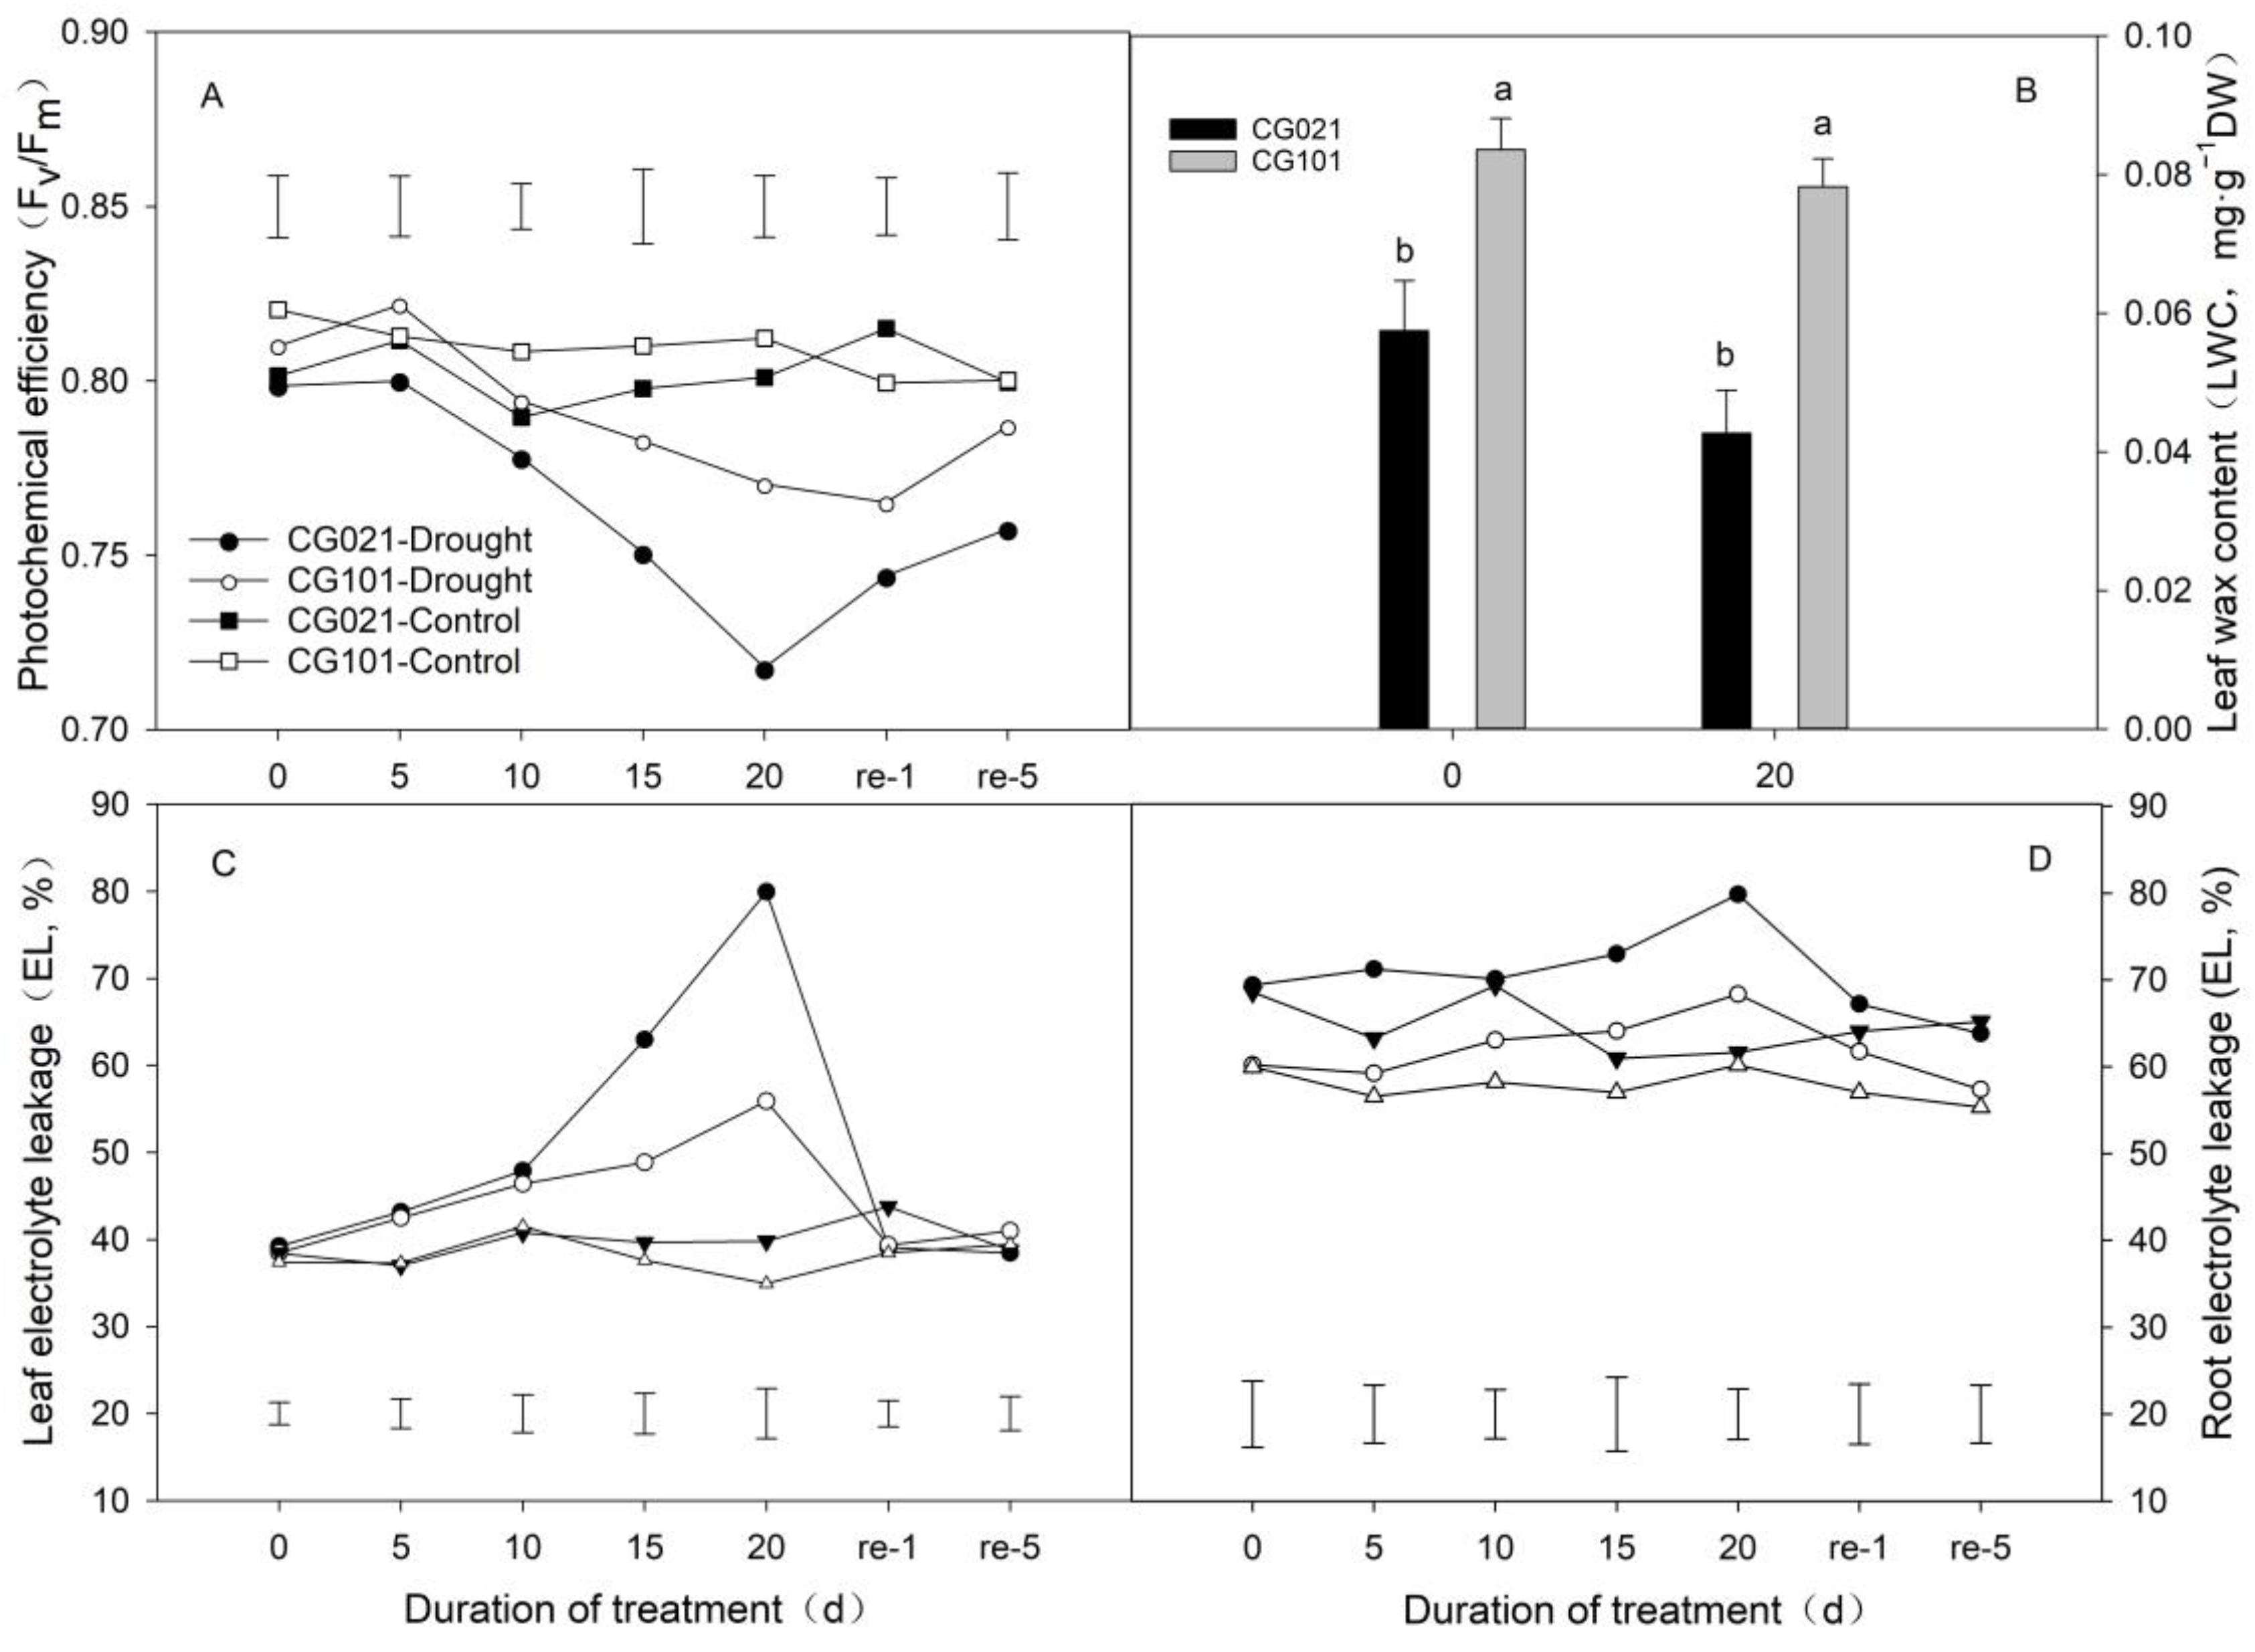
3.3. Impacts of Drought and Rehydration on Photochemical Efficiency, Electrolyte Leakage, and Leaf Wax Content

Under the well-watered control conditions, no significant difference was observed in the Fv/Fm of both genotypes during the entire experimental period (Figure 3A). Drought stress caused a decrease in Fv/Fm of both genotypes after 15 d of drought treatment. The Fv/Fm of the drought-sensitive CG021 and drought-tolerant CG101 was significantly lower than the control on days 15 and 20 of drought stress. Under drought stress, the Fv/Fm of CG021 was significantly lower than CG101 at 15 and 20 d, with a decline by 4.09% and 6.83%, respectively. Following rehydration, the Fv/Fm of CG101 fully recovered to the control conditions after 5 days of rehydration, whereas that of CG021 remained significantly lower than the control and CG101 (Figure 3A).
For the LWC, under both the well-watered control and 20 d of drought stressed conditions, the LWC of the drought-tolerant CG101 was significantly higher than that of the drought-sensitive CG021 (Figure 3B). At 0 d of pretreatment and 20d of drought stress, the LWC of CG101was 45.56% and 83.20% higher than CG021, respectively.
In the leaf, under the normal watering control, no significant differences were found in the EL in both genotypes during the entire experimental period (Figure 3C). EL in leaf increased with intensified drought stress, resulting in a significant increase in CG021 and CG101 from day 5 to 20. CG101 exhibited a significant decline in EL by 22.39% and 30.10%, respectively, compared with CG021 in leaf at 15 and 20 d under drought stress (Figure 3C). After rehydration, the EL of both genotypes in leaf returned to the control levels at 1 d (Figure 3C). In the roots, drought induced a significant increase in the EL of CG021 compared with the well-watered control at 15 and 20 d of treatment, whereas CG101 exhibited an increase in EL only at 20 d of drought stress (Figure 3D). Under drought stressed conditions, there was a significant decrease in EL in CG101 by 16.88%, 14.39%, and 8.16% at 5, 15, and 20 d, respectively, compared with that in CG021. After 5 d of rehydration, EL in both CG101 and CG021 fully recovered to the well-watered control.

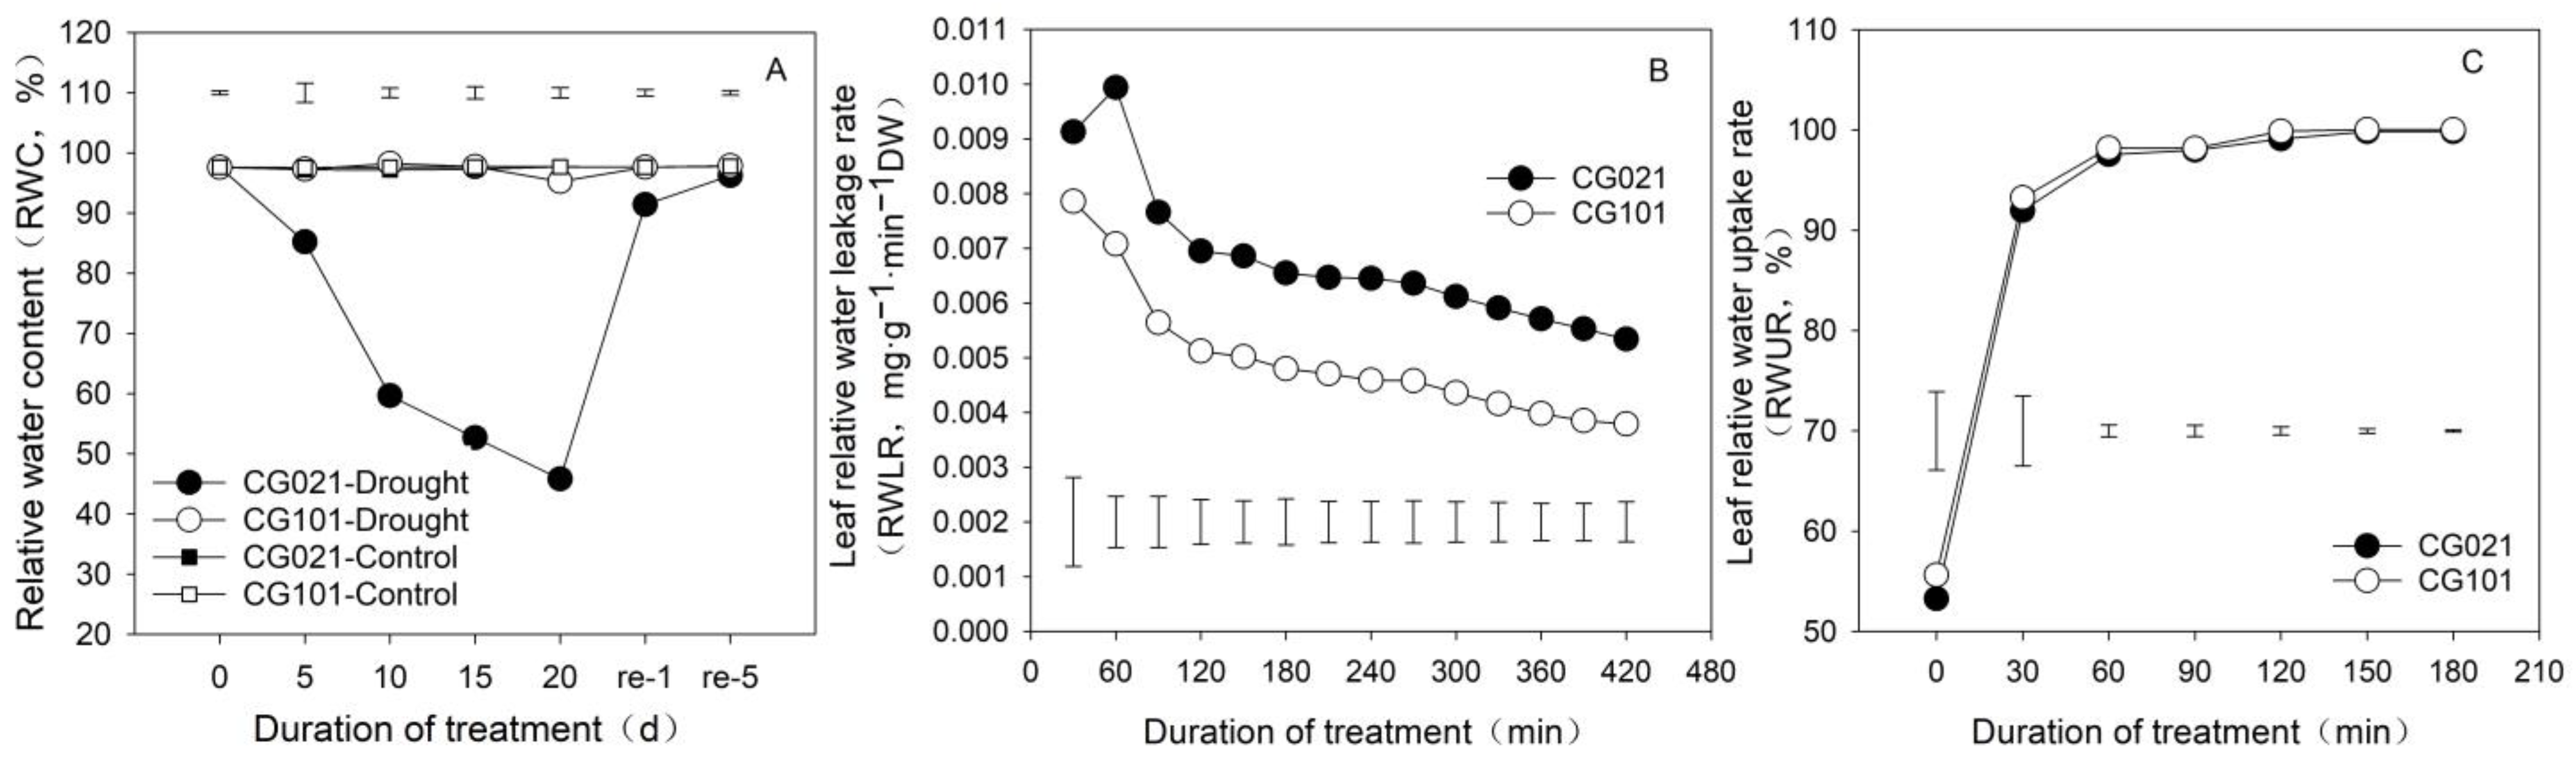
3.4. Influence of Drought and Rehydration on Leaf Water Status

As illustrated in Figure 4A, under the normal watering conditions, no significant differences in the relative water content (RWC) were found in both genotypes of centipedegrass. Drought treatment resulted in a drastic reduction in RWC of the drought-sensitive CG021, which remained significantly lower than the well-watered control from 5 days to 20 days of drought stress. The RWC of the drought-tolerant CG101 was not observed to have changed in comparison with the control treatment until 15 days of drought stress. After 20 days of drought stress, the RWC of CG021 decreased by 53.12% compared to the control, and was lower by 51.91% than that of CG101. Following rehydration, the RWC of CG021 rapidly increased, reaching 93.57% of the control after 1 day of rehydration and 98.44% after 5 days, although not fully recovering to the control levels (Figure 4A).
During the dehydration treatment of detached leaves from 60 to 420 min, the leaf relative water loss rate (RWLR) of the drought-sensitive CG021 was significantly higher than that of the drought-tolerant CG101 (Figure 4B). At 60 and 420 min of dehydration, the RWLR of CG021 was 40.40% and 41.00% higher than CG101, respectively (Figure 4B). Upon the rehydration of detached leaves, both genotypes rapidly absorbed water, as indicated by the RWUR (Figure 4C). At 30 min of rehydration, the RWUR of both CG021 and CG101 significantly increased from 53.27% and 56.63% to 91.97% and 93.24%, respectively. After 60 min of rehydration, the RWUR of both genotypes gradually stabilized, and no difference was found between the two genotypes (Figure 4C).

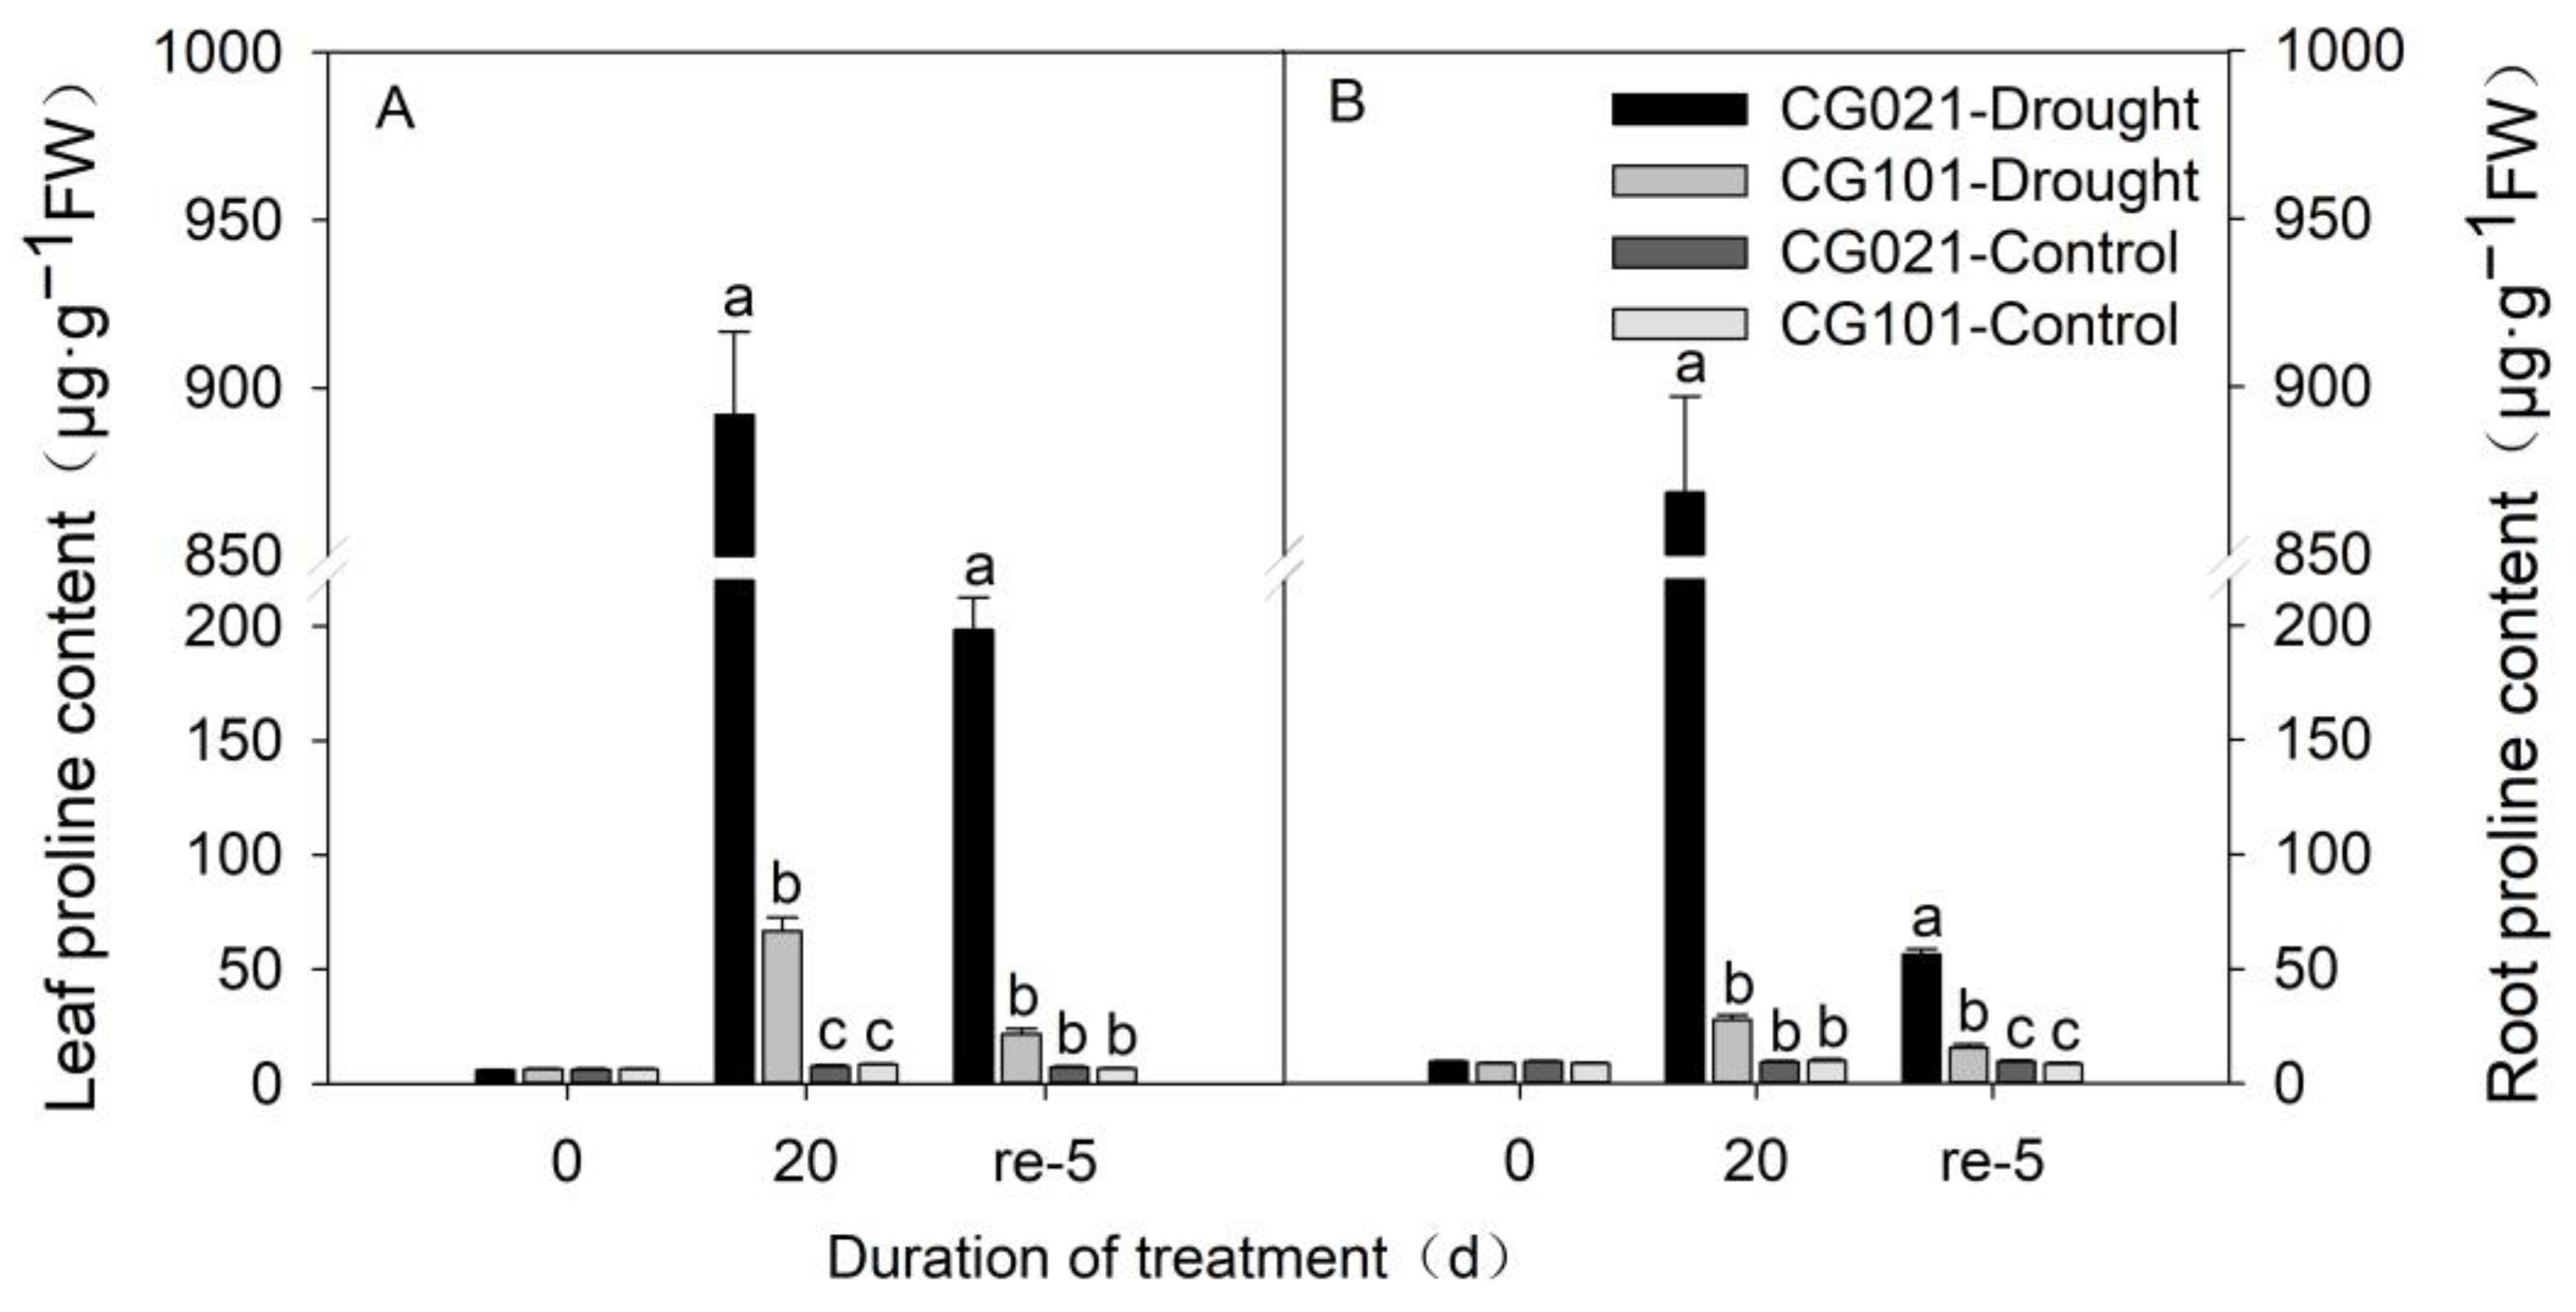
3.5. Impact of Drought and Rehydration on Proline Content in Leaves and Roots

As observed in Figure 5, the proline content in the leaves of both genotypes remained at a relatively low level (6.00~10.00 μg·g−1FW), with no significant differences between different treatments. After 20 days of drought stress, the proline content in the leaves of both CG021 and CG101 significantly increased compared to the control, reaching 148 times and 9 times the control, respectively (Figure 5A). Under drought stress, CG021 exhibited a significantly higher proline content than CG101 in the leaves (Figure 5A). In the roots, CG021’s proline content was significantly higher than the control (90 times), while CG101 showed no significant difference compared to the control (Figure 5B). Under drought stress, the proline content of CG021 in the roots was significantly higher by 30.29 times than that of CG101 (Figure 5B). After 5 d of rehydration, the proline content in both the leaves and roots of both genotypes rapidly decreased. However, the proline content in the leaves and roots of the drought-sensitive CG021 remained significantly higher than that of the control and the drought-tolerant CG101 for the drought-stressed treatments. Moreover, the proline content of both CG021 and CG101 in both the leaves and roots did not return to the control level.

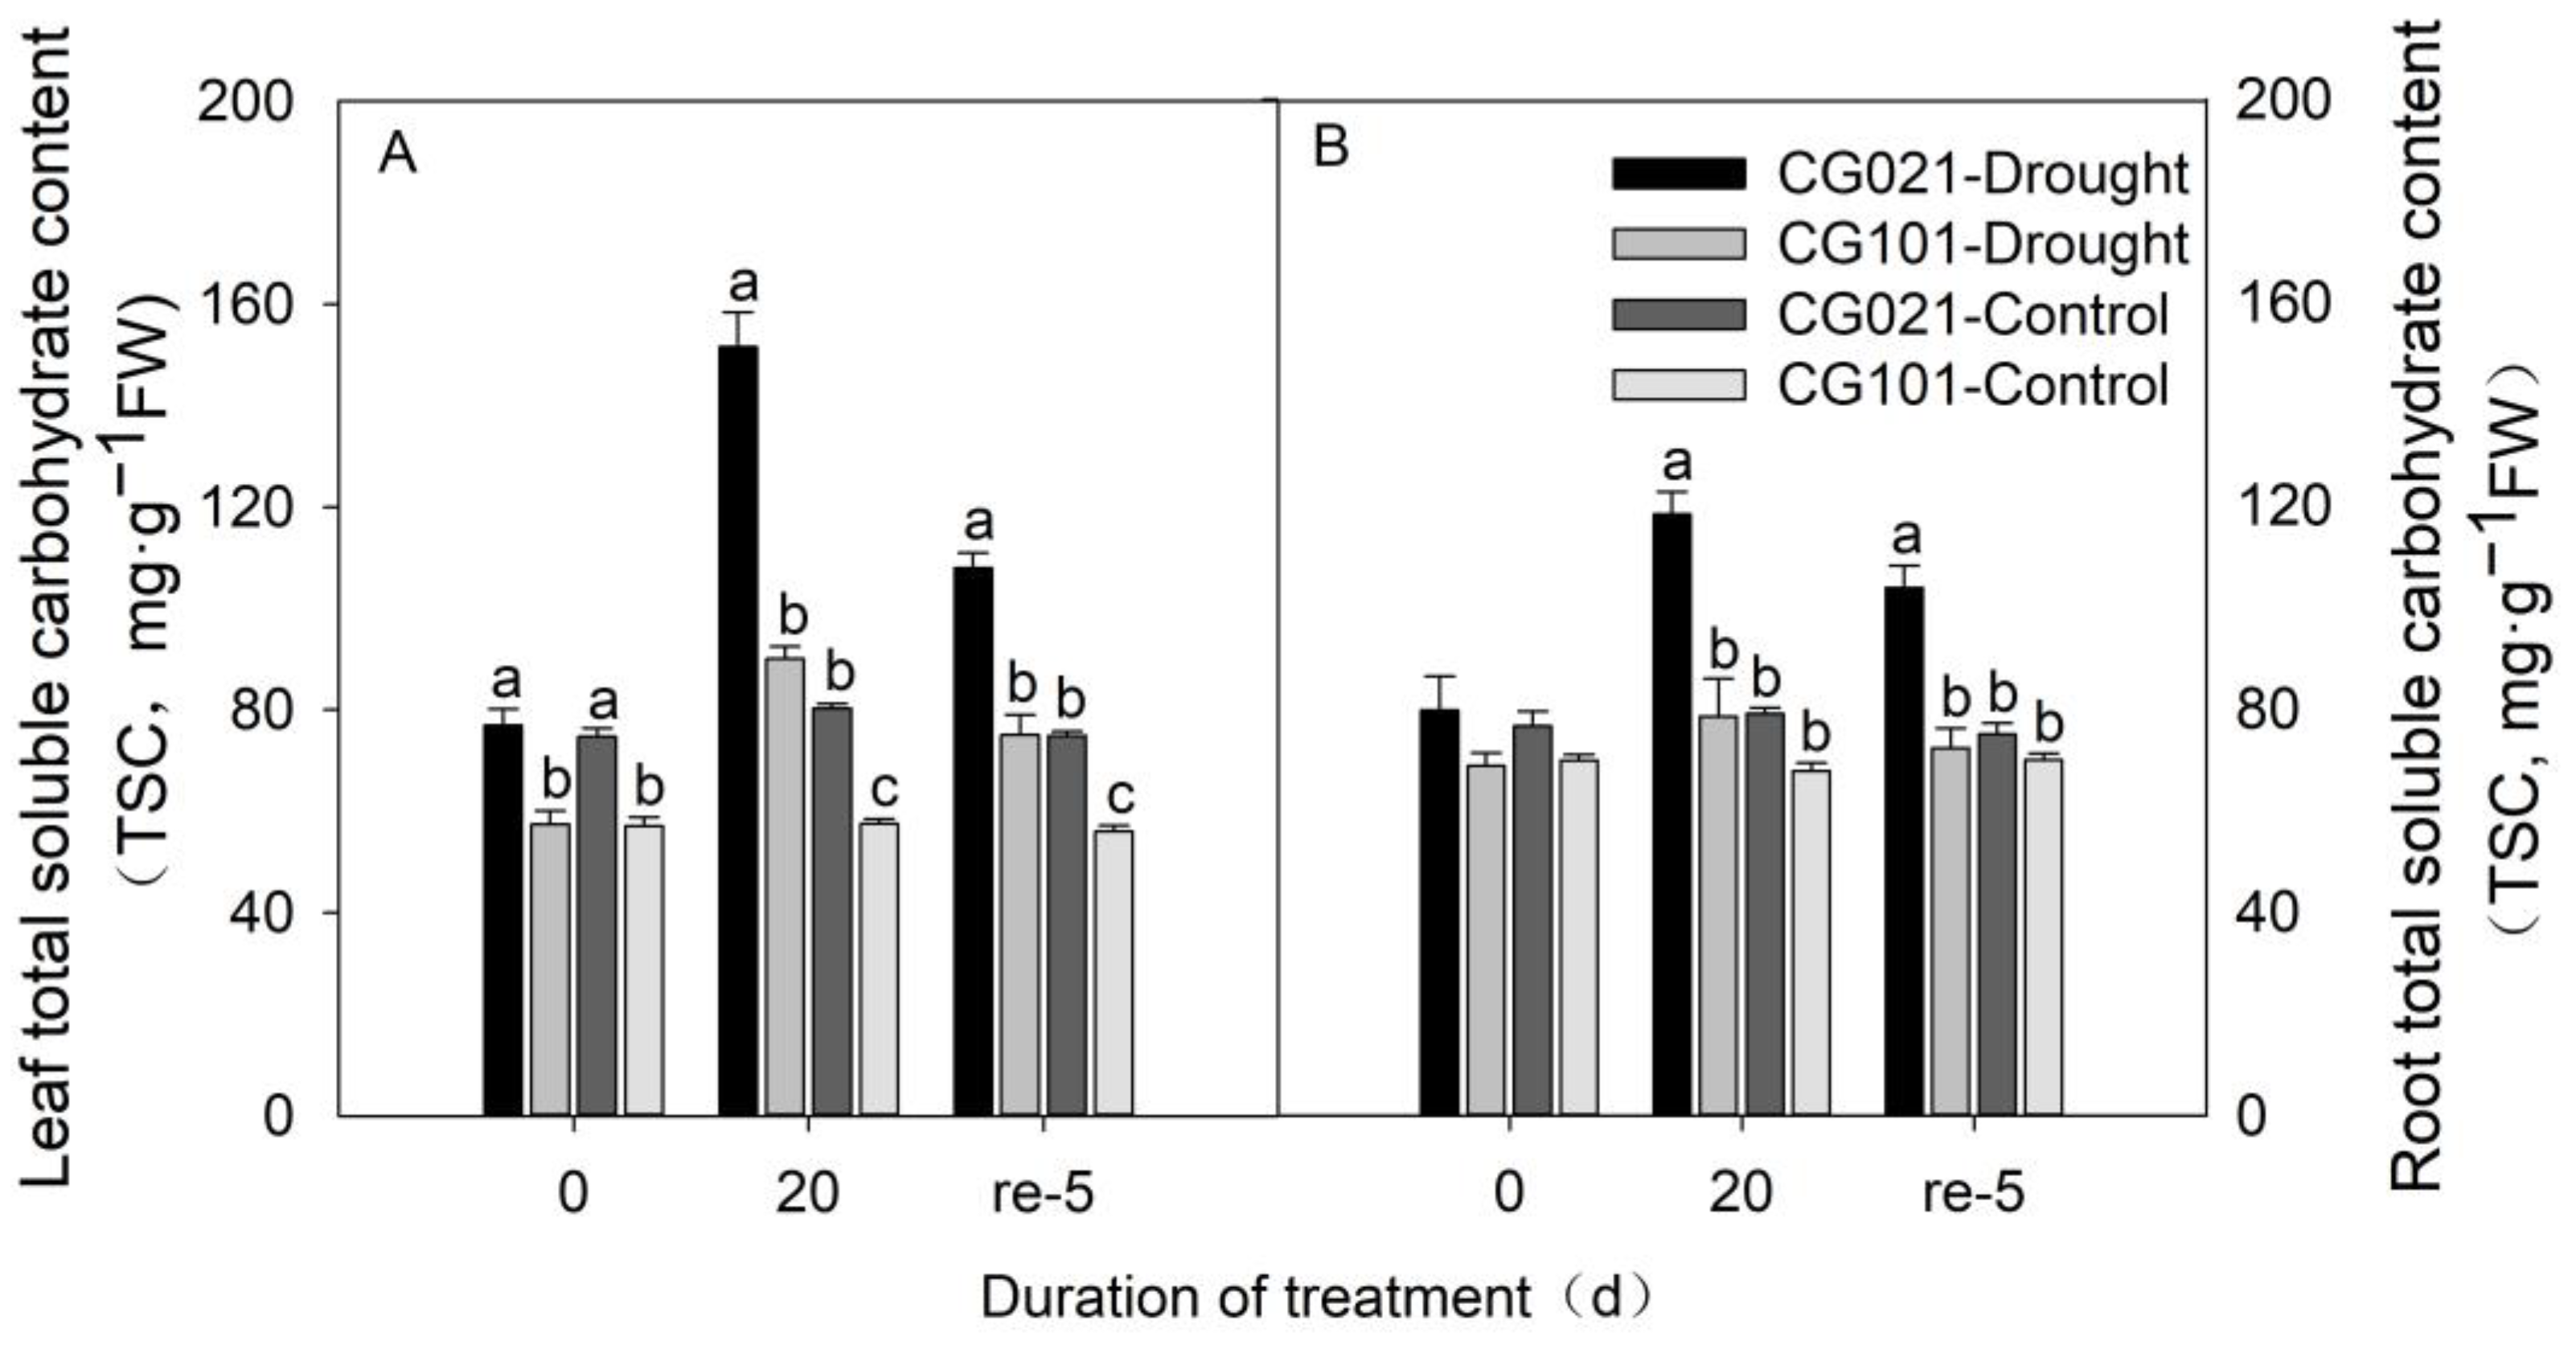
3.6. Influence of Drought and Rehydration on Total Soluble Carbohydrate Content in Leaves and Roots

At 0 d, the TSC content in the leaves of the drought-tolerant CG101 was significantly lower than that of the drought-sensitive CG021 (Figure 6A). In the roots (Figure 6B), there were no significant differences in the TSC content between the two genotypes (Figure 6B). Drought stress led to an increase in TSC content in both the leaves and roots of the drought-sensitive CG021 after 20 d of drought stress. However, the TSC content of the drought-tolerant CG101 was significantly increased by 20 d of drought stress only in the leaves, but not in the roots. After 5 d of rehydration, the TSC content in both the leaves and roots of the drought-sensitive CG021 was still significantly higher that the control treatment. In the drought-tolerant CG101, the TSC content was significantly higher than the control only in the leaves, but not in the roots (Figure 6B).

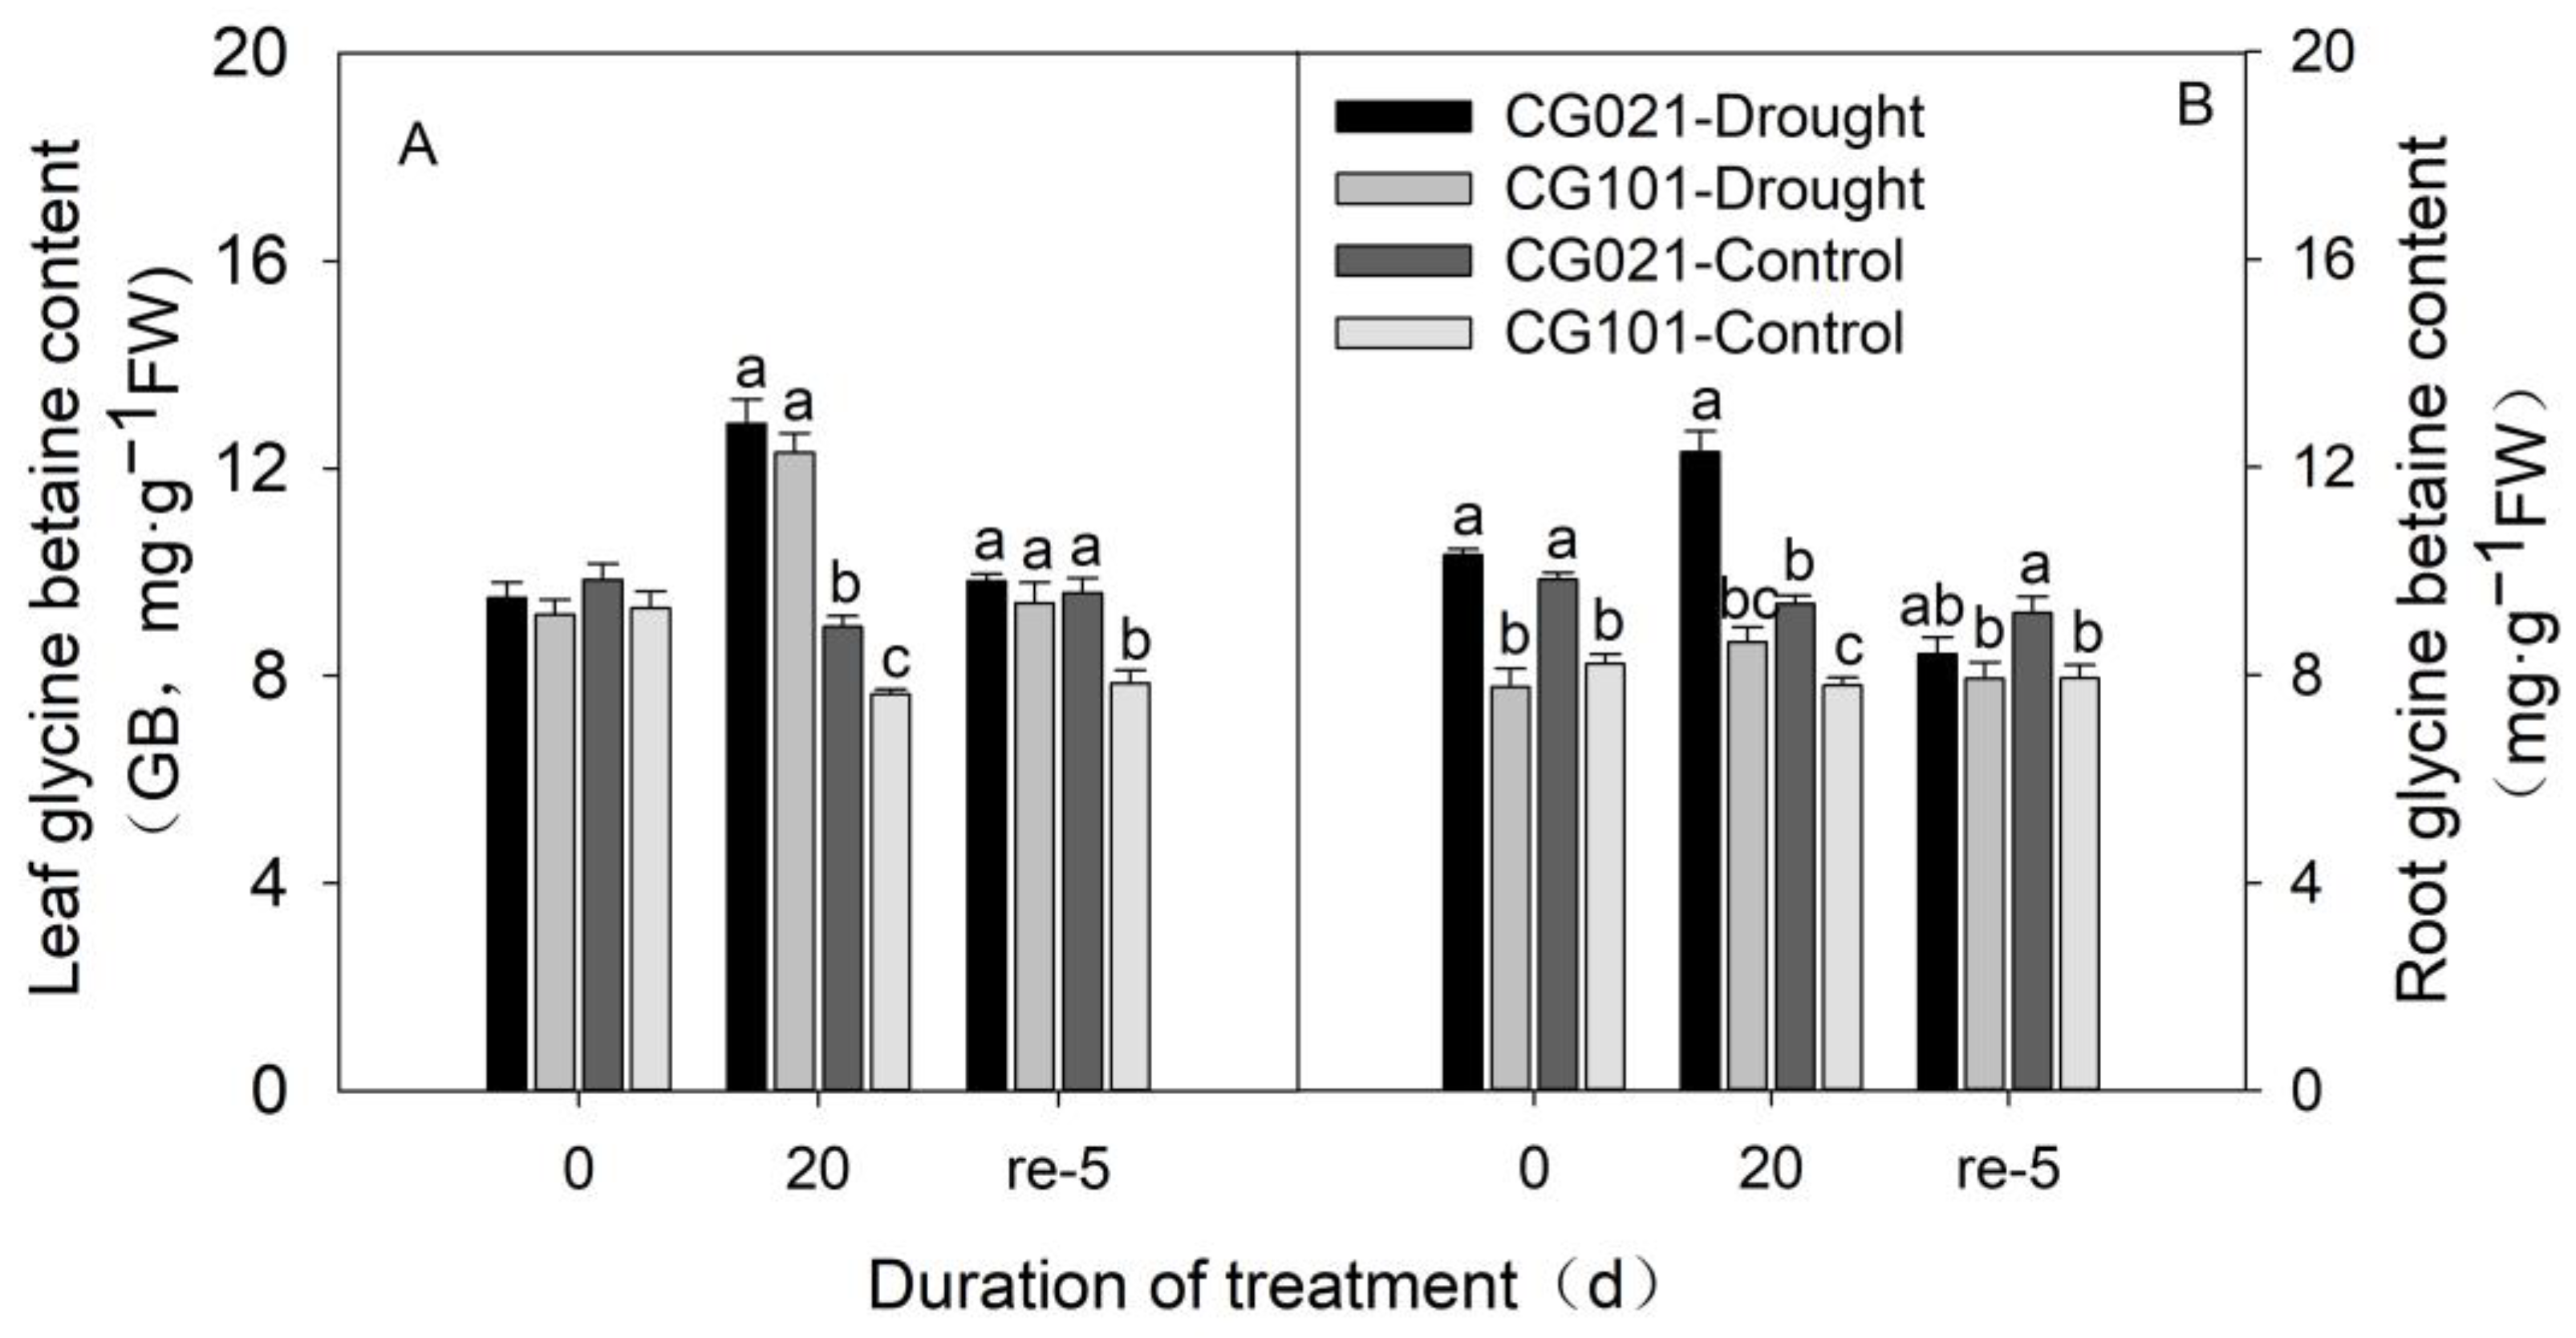
3.7. Impact of Drought and Rehydration on Glycine Betaine Content in Leaves and Roots

The leaf glycine betaine (GB) content in both genotypes remained at the control level at 0 d of treatments (Figure 7A). However, in the roots, there was a significant difference in GB content, with the drought-tolerant genotype CG101 having significantly lower GB content than the drought-sensitive genotype CG021, either under drought stress or the well-watered control (Figure 7B). Drought stress increased the GB content in both the leaves and roots of the drought-sensitive CG021 by 30.52% and 23.74%, respectively. For CG101, the content of GB was significantly higher by 29.78% than the control in the leaves, but not in the roots after 20 days of drought stress. Under 20-d of drought stress, CG021 had a significantly higher GB content compared with CG101 in the roots but not in the leaves (Figure 7B). After 5 days of rehydration, the content of GB recovered to the control level in both the leaves and roots of the drought-tolerant CG101. The drought-sensitive CG021 fully recovered to the well-watered control in the roots but not in the leaves at 5 d rehydration. In the leaves, no significant difference in GB content between the two genotypes was found in the leaves for drought treatments, while in the roots, the content of GB in CG021 was significantly greater than CG101 at 20 d of drought stress.

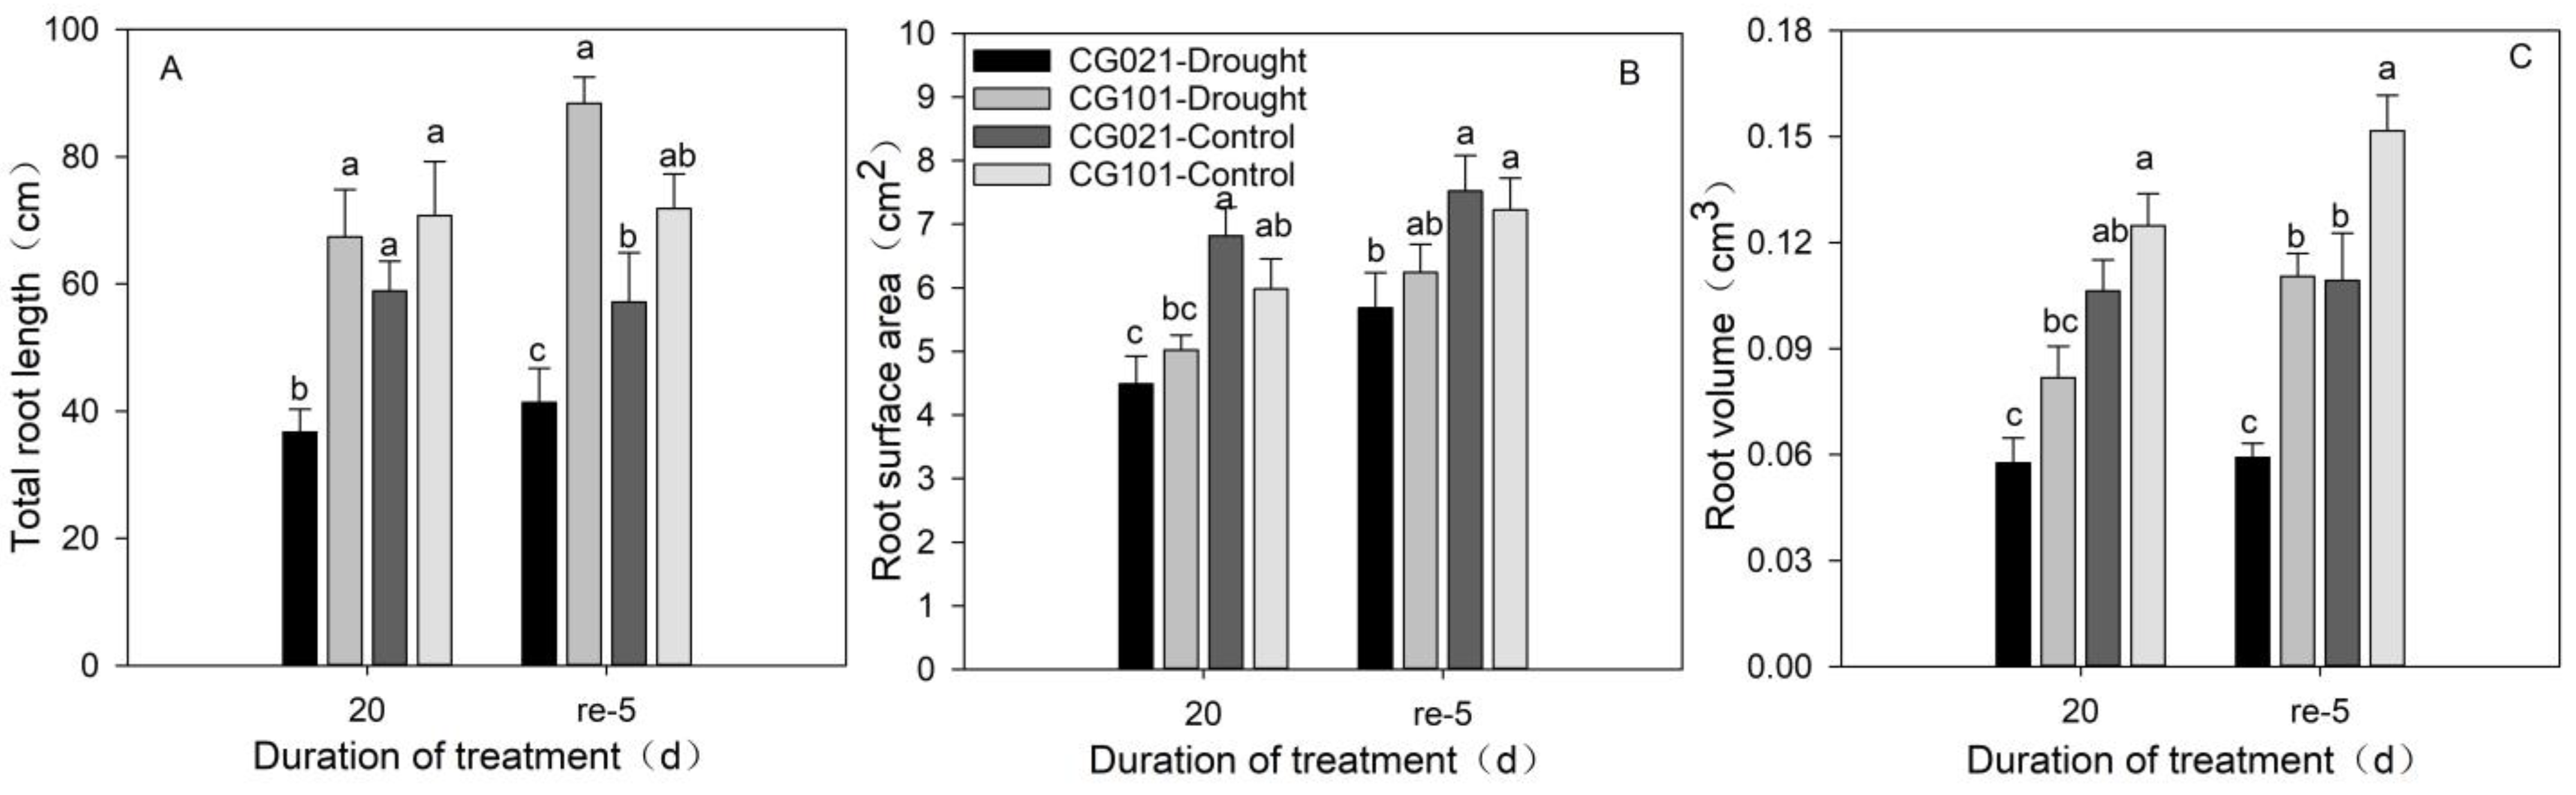
3.8. Effects of Drought and Rehydration on Root Growth

After 20 days of drought stress, the total root length, root surface area, and root volume of the drought-sensitive CG021 were significantly lower than the control by 37.64%, 34.14%, and 45.77%, respectively (Figure 8). The drought-tolerant CG101 exhibited a significant decrease of 34.45% in root volume, while the total root length and root surface area showed no significant differences compared to the control (Figure 8). Under drought stress, the total root length of the drought-sensitive CG021 was significantly lower by 45.51% than that of the drought-tolerant CG101 (Figure 8A). After 5 days of rehydration, the total root length, root surface area, and root volume of the drought treatment in CG021 remained significantly lower than the control level. For CG101, after 5 days of rehydration, the total root length and root surface area of the drought treatment recovered to the level of the control, but the root volume remained significantly lower than the control (Figure 8C). For drought treatments of the two genotypes, the total root length and root volume of the drought-tolerant CG101 were significantly higher by 53.19% and 46.46% than the drought-sensitive CG021, respectively (Figure 8A,C).

4. Discussion

For plants, differential responsive mechanisms exist among different varieties or accessions in response to drought or other stresses [31]. TQ, acting as a comprehensive representation of the color, density, texture, and uniformity, reflects the drought tolerance and post-drought recovery ability of turfgrass [26,32]. In this study, the drought-tolerant CG101 exhibited superior turf performance as reflected by the higher TQ compared to the drought-sensitive CG021 of centipedegrass (Figure 2). The decline in TQ for ‘CG021’ and the maintenance of TQ by ‘CG101’ under drought stress highlights the effectiveness of the drought-tolerant genotype in maintaining TQ, which could be attributed to several factors including a better capacity for leaf water retention, higher Fv/Fm, enhanced membrane stability (EL), increased LWC, and improved root growth, as discussed below.
RWC is a crucial indicator directly reflecting the leaf water status. Warm-season grasses including zoysiagrass (Z. matrella), seashore paspulum, buffalograss (Buchloe dactyloides), and bermudagrass were observed to have superior drought-tolerance as shown by the greater RWC than cool-season grasses such as Kentucky bluegrass, and tall fescue (Festuca arundinacea) [9,33,34,35,36]. In bermudagrass, the drought-tolerant ‘Tifway’ was found to have a lower RWLR than the drought-sensitive ‘C299’ [25]. Similarly, drought-tolerant zoysiagrass exhibited a lower RWLR than drought-sensitive Kentucky bluegrass [9]. In this study, under the same SWC, the whole plant RWC of the drought-tolerant CG101 consistently remained at the level of the control (Figure 4A). However, the drought-sensitive CG021 exhibited a rapid decline in RWC when subjected to drought stress (Figure 4A). The higher RWC of CG101 was directly associated with its lower leaf RWLR but not the RWUR (Figure 4B,C). Therefore, the drought-tolerant CG101 had superior water retaining ability, contributing to better TQ without leaf wilting during the entire experimental period.
Apart from the higher water retaining capacity of the drought-tolerant CG101 than the drought-sensitive CG021, changes in physiological parameters including the increase in photosynthetic capacity (Fv/Fm), the cellular membrane stability (lower EL), and LWC collectively contributed to the stronger drought tolerance of CG101 in this study (Figure 4). Fv/Fm is an indicator extensively used to quantify the efficiency of the primary photochemical conversion of Photosystem II, reflecting the photosynthetic capacity of plants [29]. The higher Fv/Fm was beneficial to maintaining the photosynthetic metabolism, as shown by the larger net photosynthetic rate, thereby improving the biomass of the shoots and roots as well as corresponding vigor in plants under drought stress [16]. Membrane stability can reflect the degree of cellular damage in plants [27,37]. Water deficit injures plant cell membranes, causing the outflow of soluble substances and electrolytes, resulting in cell dehydration and an increase in EL. In the present case, drought stress led to remarkable damage to cellular membranes, as shown by the increase in EL in both the leaves and roots of the two genotypes in centipedegrass at 20-d of the experiment (Figure 3C,D). However, the EL of the drought-tolerant CG101 was significantly lower than CG021, indicating that CG101 could maintain better membrane stability to reduce physiological damage resulting from drought stress. The epidermal wax of plants provides a primary waterproof barrier and serves as a protective layer against adverse environmental conditions including drought stress [38]. A number of studies have indicated a close correlation between the content of epidermal wax and drought tolerance in various plant species [39,40,41]. Zoysiagrass, known for its better drought tolerance, was reported to have a greater LWC than Kentucky bluegrass under both well-watered control and drought stress [9]. Therefore, the LWC in our finding was larger in the drought-tolerant CG101 than in the drought-sensitive CG021 regardless of water conditions, consistent with the results that the leaf RWLR of CG101 was significantly lower than that of CG021 during the entire experimental period (Figure 3B and Figure 4B). In addition, a previous study reported that the content of LWC showed a significant positive correlation with water use efficiency [42]. Therefore, the higher water use efficiency in combination with the water retention capacity collectively contributed to the drought tolerance of CG101. The higher LWX was also related to the reduced EL in CG101 due to the positive correlation between leaf wax and membrane stability, as previously reported in maize and sorghum (Sorghum bicolor) [43,44].
The tolerance of plants to drought stress is also closely associated with the growth and development of root systems. A well-developed root system is a pivotal trait for drought resistance across most plant species [45,46]. In conditions where soil moisture is scarce, turfgrasses extend their roots to absorb water and nutrients from deeper soil layers [8,47]. Drought-tolerant species tend to have roots that are both longer and deeper, as opposed to those that are more sensitive to dry conditions [31]. Zoysiagrass, for instance, has demonstrated superior drought tolerance compared to Kentucky bluegrass through its extensive root system reaching deeper soil layers to access moisture, as reported by Yu et al. [9]. The results of this study showed that under the same level of drought stress, the total root length of the drought-tolerant CG101 was significantly greater than that of the drought-sensitive CG021, while the root surface area and volume remained unchanged (Figure 8). The drought-induced reduction in the root length and surface area was larger in CG021 in comparison with CG101 after 20 days of treatments (Figure 8). These results suggest that CG101 was able to sustain a higher root surface area and extend its roots to access additional moisture from deeper soil layers, thereby maintaining higher internal water content levels compared with CG021, as shown by the higher RWC in CG101. Such deep root development is one of the primary factors contributing to CG101’s enhanced drought resistance relative to CG021. Similar findings have also been reported in tall fescue, where genotypes with deeper and more viable roots showed greater drought resistance [47].
Plants have evolved a range of survival strategies to withstand environmental stresses, among which osmotic regulation resulting from the accumulation of compatible solutes to control cell water and turgor pressure is one of the most important strategies to protect plants from drought damage [48]. During drought conditions, plants with strong osmotic regulating ability typically exhibit higher drought tolerance [28]. For example, drought-tolerant genotypes or lines have been observed to accumulate higher levels of these compatible solutes compared to the drought-sensitive ones in Kentucky bluegrass, creeping bentgrass (Agrostis stolonifera), and bermudagrass [14,28,49]. However, in the present study, the drought-induced increase in the levels of TSC and proline in both the leaves and roots of the drought-sensitive CG021 was greatly higher in comparison with that of the drought-tolerant CG101 after 20 days of experiment (Figure 5 and Figure 6). Although no significant difference in GB content was observed in the leaves of the two genotypes, CG021 exhibited a larger GB content in its roots compared with CG101 (Figure 7). This finding is also consistent with results that the significantly higher EL in CG021 was caused by 20 days of drought treatment compared to CG101 (Figure 3C). The results of the TSC might be associated with the carbohydrate allocation from osmotic adjustment to root growth under drought stress, as indicated by the lower TSC and longer root length of the drought-tolerant CG101 in comparison with CG021 (Figure 6 and Figure 8). Previous studies have reported that the content of proline should not be considered as stress tolerance indicators but as a symptom of injury, reflecting the severe extent of cellular damage to cellular structure and function in plants [50,51,52,53]. Therefore, our results of the solutes imply an increased proline, TSC, and GB content in the leaves and/or roots of CG021 under drought stress, suggesting a role in osmotic adjustment, which is a common response in drought-sensitive plants but not in drought-tolerant ones. The lower content of osmoregulants in CG101 indicated that CG101 endured less severe drought stress and had a more stable osmotic regulation system than CG021, thereby possessing a stronger drought tolerance, as indicated by better turf performance.
Following 5-d of rehydration, although the TQ of the drought-sensitive CG021 rapidly recovered to the control level, the RWC still did not fully resume to the control level, indicating that 20 days of drought stress caused the detrimental injury in physiological processes in the drought-sensitive CG021. The lower leaf Fv/Fm, root length, root volume as well as LWC could be the result of the unrecovered RWC in CG021. Furthermore, CG021 showed a relatively weak osmotic regulation ability, as the content of compatible solutes including TSC and proline in both the leaves and roots was still significantly greater for the drought treatment compared with the control in CG021, even after 5 days of rehydration. Additionally, the GB content for drought treatment was higher than that of the control in the leaves of CG021. These factors collectively caused the reduced post-drought recovery capability of the drought-sensitive CG021. In future, genetic engineering techniques should be employed to transfer genes that positively regulate the wax content of the leaves, root growth, and osmotic regulation into drought-sensitive species of cetipedegrass, thereby effectively enhancing their post-drought recovery capabilities.

5. Conclusions

The stronger drought tolerance of CG101, as shown by its superior TQ and RWC compared with CG021, could be primarily attributed to several key factors including the greater Fv/Fm, LWC, RWLR in the leaves and the lower EL in both the leaves and roots. In addition, the extensive root system of CG101, characterized by a greater total root length and surface area, collectively contributed to the stronger drought tolerance of the drought-tolerant CG101 in comparison with the drought-sensitive CG021. During the post-drought rehydration process, the RWC of CG021 did not fully recover to the control levels, mainly due to the reduced leaf Fv/Fm and LWC as well as the root length, root surface area, and root volume. Additionally, the relatively weaker osmotic regulatory ability resulting from changes in the TSC, proline, and GB was also one of the key factors hindering the full recovery of CG021. Our research not only helps to understand the physiological mechanism of drought tolerance in centipedegrass, but also offers theoretical support for breeding drought-resistant varieties in plants. In the next step, we will further explore the molecular mechanism from the aspects of leaf wax, water retention, and osmoregulants, respectively, in order to provide new insights into the drought-resistant mechanisms in centipedegrass.

Author Contributions

Conceptualization, L.A. and J.Y.; Data curation, Y.S. and J.Y.; Funding acquisition, L.A. and Y.S.; Methodology, Y.S., M.X. and J.H.; Writing—original draft, Y.S., J.Y. and S.W.; Writing—review and editing, J.Y., Y.S., S.W., M.X. and J.H. All authors have read and agreed to the published version of the manuscript.

Funding

The study was supported by the Agricultural Joint Special Project of Yunnan Province (202301BD070001-059) and the Chongqing Key Laboratory of Germplasm Innovation and Utilization of Native Plants (XTZW2021-KF04).

Data Availability Statement

The raw data supporting the conclusions of this article will be made available by the authors on request.

Conflicts of Interest

The authors declare no conflicts of interest.

References

  1. Hirata, M. Development and establishment of centipede grass (Eremochloa ophiuroides) in southwestern Japan. Trop. Grassl. 2007, 41, 100–112. [Google Scholar]
  2. Islam, M.A.; Hirata, M. Centipedegrass (Eremochloa ophiuroides (Munro) Hack.): Growth behavior and multipurpose usages. Grassl. Sci. 2010, 51, 183–190. [Google Scholar] [CrossRef]
  3. Wang, J.; Zi, H.; Wang, R.; Liu, J.; Wang, H.; Chen, R.; Li, L.; Guo, H.; Chen, J.; Li, J. A high-quality chromosome-scale assembly of the centipedegrass [Eremochloa ophiuroides (Munro) Hack.] genome provides insights into chromosomal structural evolution and prostrate growth habit. Hortic. Res. 2021, 8, 201. [Google Scholar] [CrossRef]
  4. Schwartz, B.M.; Harris-Shultz, K.R.; Contreras, R.N.; Hans, C.S.; Milla-Lewis, S.R. Creation of artificial triploid and tetraploid centipedegrass using colchicine and breeding. Int. Turfgrass Res. J. 2013, 12, 327–333. [Google Scholar]
  5. Milla-Lewis, S.R.; Kimball, J.A.; Zuleta, M.C.; Harris-Shultz, K.R.; Schwartz, B.M.; Hanna, W.W. Use of sequence-related amplified polymorphism (SRAP) markers for comparing levels of genetic diversity in centipedegrass (Eremochloa ophiuroides (Munro) Hack.) germplasm. Genet. Resour. Crop Evol. 2012, 59, 1517–1526. [Google Scholar] [CrossRef]
  6. Guo, A.; Liu, J.; Guo, H. The preliminary identification of several drought resistance warm-season turf grasses. Pratacultural Sci. 2002, 19, 61–63. [Google Scholar]
  7. Huang, B.; Duncan, R.R.; Carrow, R.N. Drought-resistance mechanisms of seven warm-season turfgrasses under surface soil drying: I. Shoot response. Crop Sci. 1997, 37, 1858–1863. [Google Scholar] [CrossRef]
  8. Huang, B.; Duncan, R.R.; Carrow, R.N. Drought-resistance mechanisms of seven warm-season turfgrasses under surface soil drying: II. root aspects. Crop Sci. 1997, 37, 1863–1869. [Google Scholar] [CrossRef]
  9. Yu, J.; Liu, M.X.; Yang, Z.M.; Huang, B. Growth and physiological factors involved in interspecific variations in drought tolerance and postdrought recovery in warm- and cool-season turfgrass species. J. Am. Soc. Hortic. Sci. 2015, 140, 459–465. [Google Scholar] [CrossRef]
  10. Yan, J.; Chen, J.; Zhang, T.; Liu, J.; Liu, H. Evaluation of aluminum tolerance and nutrient uptake of 50 centipedegrass accessions and cultivars. J. Am. Soc. Hortic. Sci. 2009, 44, 857–861. [Google Scholar] [CrossRef]
  11. Liu, Y.; Yu, F.; Chen, Z.; Huang, C.; Li, X.; Luo, X.; Liu, P.; Bai, C.; Liu, G. Evaluation of drought tolerance of 15 centipedegrass ecotypes. Trop. Agric. Eng. 2017, 41, 7–15. [Google Scholar]
  12. Zheng, Y.; Cai, Q.; Liu, J. Response of centipedegrass (Eremochloa ophiuroides (Munro.) Hack.) accessions to water stress. Acta Agrestia Sin. 2005, 5, 102–105. [Google Scholar]
  13. Yang, Z.M.; Yu, J.J.; Merewitz, E.; Huang, B.R. Differential effects of abscisic acid and glycine betaine on physiological responses to drought and salinity stress for two perennial grass species. J. Am. Soc. Hortic. Sci. 2012, 137, 96–106. [Google Scholar] [CrossRef]
  14. Yang, Z.M.; Xu, L.X.; Yu, J.J.; DaCosta, M.; Huang, B.R. Changes in carbohydrate metabolism in two kentucky bluegrass cultivars during drought stress and recovery. J. Am. Soc. Hortic. Sci. 2013, 138, 24–30. [Google Scholar] [CrossRef]
  15. Burgess, P.; Huang, B. Effects of sequential application of plant growth regulators and osmoregulants on drought tolerance of creeping bentgrass (Agrostis stolonifera). Crop Sci. 2014, 54, 837–844. [Google Scholar] [CrossRef]
  16. Yu, J.; Fan, N.; Hao, T.; Bian, Y.; Zhuang, L.; Li, Q.; Yang, Z. Ethionine-mitigation of drought stress associated with changes in root viability, antioxidant defense, osmotic adjustment, and endogenous hormones in tall fescue. Plant Growth Regul. 2023, 100, 119–132. [Google Scholar] [CrossRef]
  17. Dong, S.; Dong, Y.; Yang, L.; Qin, X.; Wang, W.; Cui, G.; Liu, L. Effects of drought stress and re-watering on osmotic adjustment ability and yield of soybean. J. Northeast Agric. Univ. 2020, 27, 8. [Google Scholar]
  18. Tamirat, W.; Mengs, B. Role of biochemical traits on coffee for drought: A review article. Eur. J. Biotech. Biosci. 2020, 8, 22–27. [Google Scholar]
  19. Shaw, B.; Thomas, T.H.; Cooke, D.T. Responses of sugar beet (Beta vulgaris L.) to drought and nutrient deficiency stress. Plant Growth Regul. 2002, 37, 77–83. [Google Scholar] [CrossRef]
  20. Iqbal, S.; Bano, A. Effect of drought and abscisic acid application on the osmotic adjustment of four wheat cultivars. J. Chem. Soc. Pak. 2010, 32, 13–19. [Google Scholar]
  21. Nayyar, H. Variation in osmoregulation in differentially drought-sensitive wheat genotypes involves calcium. Biol. Plant. 2003, 47, 541–547. [Google Scholar] [CrossRef]
  22. Liu, E.; Zong, H.; Guo, Z.; Li, Y. Effects of drought, salt and chilling stresses on proline accumulation in shoot of rice seedlings. J. Trop. Subtrop. Bot. 2000, 8, 235–238. [Google Scholar]
  23. Turgeon, A. Turfgrass Management, 8th ed.; Prentice Hall: Upper Saddle River, NJ, USA, 2011. [Google Scholar]
  24. Barrs, H.D.; Weatherley, P.E. A re-examination of the relative turgidity techniques for estimating water deficits in leaves. Aust. J. Biol. Sci. 1962, 15, 413–428. [Google Scholar] [CrossRef]
  25. Hu, L.X.; Wang, Z.L.; Du, H.M.; Huang, B.R. Differential accumulation of dehydrins in response to water stress for hybrid and common bermudagrass genotypes differing in drought tolerance. J. Plant Physiol. 2010, 167, 103–109. [Google Scholar] [CrossRef]
  26. Merewitz, E.B.; Gianfagna, T.; Huang, B.R. Effects of SAG12-ipt and HSP18.2-ipt expression on cytokinin production, root growth, and leaf senescence in creeping bentgrass exposed to drought stress. J. Am. Soc. Hortic. Sci. 2010, 135, 230–239. [Google Scholar] [CrossRef]
  27. Blum, A.; Ebercon, A. Cell membrane stability as a measure of drought and heat tolerance in wheat. Crop Sci. 1981, 21, 43–47. [Google Scholar] [CrossRef]
  28. Liu, N.; Shen, Y.; Huang, B. Osmoregulants involved in osmotic adjustment for differential drought tolerance in different bentgrass genotypes. J. Am. Soc. Hortic. Sci. 2015, 140, 605–613. [Google Scholar] [CrossRef]
  29. Dong, H.; Yu, H.; Bao, Z.; Guo, X.; Peng, J.; Yao, Z.; Chen, G.; Qu, S.; Dong, H. The ABI2-dependent abscisic acid signalling controls HrpN-induced drought tolerance in Arabidopsis. Planta 2005, 221, 313–327. [Google Scholar] [CrossRef]
  30. Wang, G.P.; Zhang, X.Y.; Li, F.; Luo, Y.; Wang, W. Overaccumulation of glycine betaine enhances tolerance to drought and heat stress in wheat leaves in the protection of photosynthesis. Photosynthetica 2010, 48, 117–126. [Google Scholar] [CrossRef]
  31. Kou, X.; Han, W.; Kang, J. Responses of root system architecture to water stress at multiple levels: A meta-analysis of trials under controlled conditions. Front. Plant Sci. 2022, 13, 1085409. [Google Scholar] [CrossRef]
  32. Xu, L.; Han, L.; Huang, B. Antioxidant enzyme activities and gene expression patterns in leaves of kentucky bluegrass in response to drought and post-drought recovery. J. Am. Soc. Hortic. Sci. 2011, 136, 247–255. [Google Scholar] [CrossRef]
  33. Qian, Y.; Fry, J. Water relations and drought tolerance of four turfgrasses. J. Am. Soc. Hort. Sci. 1997, 122, 129–133. [Google Scholar] [CrossRef]
  34. Jiang, Y.; Carrow, R.N. Broadband spectral reflectance models of turfgrass species and cultivars to drought stress. Crop Sci. 2007, 47, 1611–1618. [Google Scholar] [CrossRef]
  35. Du, H.; Wang, Z.; Huang, B. Differential responses of tall fescue and zoysiagrass to heat and drought stress. Acta Hortic. 2008, 783, 207–213. [Google Scholar]
  36. Yu, J.; Li, R.; Liu, M.X.; Yang, Z.M. Ecophysiological mechanisms associated with drought tolerance and post-drought recovery in warm- and cool-season turfgrasses. Acta Prataculturae Sin. 2016, 25, 86–93. [Google Scholar]
  37. Li, Q.; Li, R.; He, F.; Yang, Z.; Yu, J. Growth and physiological effects of chitosan on heat tolerance in creeping bentgrass (Agrostis stolonifera). Grass Res. 2022, 2, 6. [Google Scholar] [CrossRef]
  38. Seo, P.J.; Lee, S.B.; Suh, M.C.; Park, M.J.; Go, Y.S.; Park, C.M. The MYB96 transcription factor regulates cuticular wax biosynthesis under drought conditions in Arabidopsis. Plant Cell 2011, 23, 1138–1152. [Google Scholar] [CrossRef]
  39. Aharoni, A.; Dixit, S.; Jetter, R.; Thoenes, E.; Pereira, A.A. The SHINE clade of AP2 domain transcription factors activates wax biosynthesis, alters cuticle properties, and confers drought tolerance when overexpressed in Arabidopsis. Plant Cell 2004, 16, 2463–2480. [Google Scholar] [CrossRef]
  40. Zhang, J.; Broeckling, C.D.; Blancaflor, E.; Sledge, M.K.; Sumner, L.; Wang, Z. Overexpression of WXP1, a putative Medicago truncatula AP2 domain-containing transcription factor gene, increases cuticular wax accumulation and enhances drought tolerance in transgenic alfalfa (Medicago sativa). Plant J. 2005, 42, 689–707. [Google Scholar] [CrossRef]
  41. Zhang, J.Y.; Broeckling, C.D.; Sumner, L.W.; Wang, Z.Y. Heterologous expression of two Medicago truncatula putative ERF transcription factor genes, WXP1 and WXP2, in Arabidopsis led to increased leaf wax accumulation and improved drought tolerance, but differential response in freezing tolerance. Plant Mol. Biol. 2007, 64, 265–278. [Google Scholar] [CrossRef]
  42. Li, A.; Lv, D.; Zhang, Y.; Zhagn, D.; Zong, Y.; Shi, X.; Li, P. Elevated CO2 concentration enhances drought resistance of soybean by regulating cell structure, cuticular wax synthesis, photosynthesis, and oxidative stress response. Plant Physiol. Biochem. 2024, 206, 108266. [Google Scholar] [CrossRef]
  43. Premachandra, G.S.; Hirofumi, S.; Kounosuke, F.; Shoitsu, O. Leaf water relations, osmotic adjustment, cell membrane stability, epicuticular wax load and growth as affected by increasing water deficits in sorghum. J. Exp. Bot. 1992, 43, 1569–1576. [Google Scholar] [CrossRef]
  44. Yu, H.; Zhang, Y.; Xie, Y.; Wang, Y.; Duan, L.; Zhang, M.; Li, Z. Ethephon improved drought tolerance in maize seedlings by modulating cuticular wax biosynthesis and membrane stability. Agric. Econ. Blackwell 2017, 214, 123–133. [Google Scholar] [CrossRef]
  45. Ran, J.; Ding, Q.; Wang, G.; Shen, Y.; Gao, Z.; Gao, Y.; Ma, X.; Hou, X. The developmental mechanism of the root system of cultivated terrestrial watercress. Plants 2023, 12, 3523. [Google Scholar] [CrossRef]
  46. Zhang, Y.; Wu, X.; Wang, X.; Dai, M.; Peng, Y. Crop root system architecture in drought response. J. Genet. Genom. 2024, in press. [Google Scholar] [CrossRef]
  47. Sun, J.; Meyer, W.; Cross, J.; Huang, B. Growth and physiological traits of canopy and root systems associated with drought resistance in tall fescue. Crop Sci. 2013, 53, 575–584. [Google Scholar] [CrossRef]
  48. Kaur, K.; Gupta, A.K.; Kaur, N. Effect of water deficit on carbohydrate status and enzymes of carbohydrate metabolism in seedlings of wheat cultivars. Indian J. Biochem. Biophys. 2007, 44, 223–230. [Google Scholar]
  49. Wang, Y.G.; Abulaiti, A.; Qi, M. Differing response to drought stress of two Cynodon dactylon varieties. Acta Prataculturae Sin. 2006, 15, 58–64. [Google Scholar]
  50. Hanson, A.D.; Nelsen, C.E.; Pedersen, A.R.; Everson, E.H. Capacity for proline accumulation during water stress in barley and its implications for breeding for drought resistance. Crop Sci. 1979, 19, 489–493. [Google Scholar] [CrossRef]
  51. Richards, R.A.; Thurling, N. Genetic analysis of drought stress response in rapeseed (Brassica campestris and B. napus). III. physiological characters. Euphytica 1979, 28, 755–759. [Google Scholar] [CrossRef]
  52. Moftah, A.E.; Michel, B.E. The effect of sodium chloride on solute potential and proline accumulation in soybean leaves. Plant Physiol. 1987, 83, 238–240. [Google Scholar] [CrossRef] [PubMed]
  53. Liu, J.; Zhu, J.K. Proline Accumulation and salt-stress-induced gene expression in a salt-hypersensitive mutant of arabidopsis. Plant Physiol. 1997, 114, 591. [Google Scholar] [CrossRef] [PubMed]
Figure 1. Soil water content during the experimental period. ‘CG021’ and ‘CG101’ are the drought-sensitive genotype and drought-tolerant genotype, respectively. ‘Drought’ represents the drought treatment. ‘Control’ represents the well-watered treatment. ‘re’ represents the re-watering treatment. Vertical bars indicate the LSD values for comparing the significant difference (p ≤ 0.05) between different treatments on a certain day.
Agronomy 14 01624 g001
Figure 2. Effects of drought and re-watering on the turf quality in centipedegrass. ‘CG021’ and ‘CG101’ are the drought-sensitive genotype and drought-tolerant genotype, respectively. ‘Drought’ represents the drought treatment. ‘Control’ represents the well-watered treatment. ‘re’ represents the re-watering treatment. Vertical bars indicate the LSD values for comparing the significant difference (p ≤ 0.05) between different treatments on a certain day.
Agronomy 14 01624 g002
Figure 3. Effects of drought and re-watering on photochemical efficiency (A), leaf wax content (B), electrolyte leakage of leaf (C) and root (D) in centipedegrass. ‘CG021’ and ‘CG101’ are the drought-sensitive genotype and drought-tolerant genotype, respectively. ‘Drought’ represents the drought treatment. ‘Control’ represents the well-watered treatment. ‘re’ represents the re-watering treatment. Vertical bars indicate the LSD values for comparing the significant difference (p ≤ 0.05) between different treatments on a certain day. Different letters indicate the significant difference (p ≤ 0.05) between different treatments on a certain day. Error bars indicate standard error (SE).
Agronomy 14 01624 g003
Figure 4. Effects of drought and re-watering on the leaf relative water content (A), leaf relative water leakage rate (B), and leaf relative water uptake rate (C) in centipedegrass. ‘CG021’ and ‘CG101’ are the drought-sensitive genotype and drought-tolerant genotype, respectively. ‘Drought’ represents the drought treatment. ‘Control’ represents the well-watered treatment. ‘re’ represents the re-watering treatment. Vertical bars indicate the LSD values for comparing the significant difference (p ≤ 0.05) between different treatments on a certain day.
Agronomy 14 01624 g004
Figure 5. Effects of drought and re-watering on the proline content of leaf (A) and root (B) in centipedegrass. ‘CG021’ and ‘CG101’ are the drought-sensitive genotype and drought-tolerant genotype, respectively. ‘Drought’ represents the drought treatment. ‘Control’ represents the well-watered treatment. ‘re’ represents the re-watering treatment. Different letters indicate the significant difference (p ≤ 0.05) between different treatments on a certain day. Error bars indicate the standard error (SE).
Agronomy 14 01624 g005
Figure 6. Effects of drought and re-watering on the total soluble carbohydrate content of leaf (A) and root (B) in centipedegrass. ‘CG021’ and ‘CG101’ are the drought-sensitive genotype and drought-tolerant genotype, respectively. ‘Drought’ represents the drought treatment. ‘Control’ represents the well-watered treatment. ‘re’ represents the re-watering treatment. Different letters indicate the significant difference (p ≤ 0.05) between different treatments on a certain day. Error bars indicate the standard error (SE).
Agronomy 14 01624 g006
Figure 7. Effects of drought and re-watering on the glycine betaine content of leaf (A) and root (B) in centipedegrass. ‘CG021’ and ‘CG101’ are the drought-sensitive genotype and drought-tolerant genotype, respectively. ‘Drought’ represents the drought treatment. ‘Control’ represents the well-watered treatment. ‘re’ represents the re-watering treatment. Different letters indicate the significant difference (p ≤ 0.05) between different treatments on a certain day. Error bars indicate the standard error (SE).
Agronomy 14 01624 g007
Figure 8. Effects of drought and re-watering on the total root length (A), root surface area (B), and root volume (C) in centipedegrass. ‘CG021’ and ‘CG101’ are the drought-sensitive genotype and drought-tolerant genotype, respectively. ‘Drought’ represents the drought treatment. ‘Control’ represents the well-watered treatment. ‘re’ represents the re-watering treatment. Different letters indicate the significant difference (p ≤ 0.05) between different treatments on a certain day. Error bars indicate the standard error (SE).
Agronomy 14 01624 g008
Disclaimer/Publisher’s Note: The statements, opinions and data contained in all publications are solely those of the individual author(s) and contributor(s) and not of MDPI and/or the editor(s). MDPI and/or the editor(s) disclaim responsibility for any injury to people or property resulting from any ideas, methods, instructions or products referred to in the content.

