Article

Reduction in Chemical Fertilizer Rates by Applying Bio-Organic Fertilizer for Optimization Yield and Quality of Hemerocallis citrina Baroni

1
Institute of Subtropical Agriculture, Fujian Academy of Agricultural Sciences, Zhangzhou 363005, China
2
Department of Biological Science and Technology, Minnan Normal University, Zhangzhou 363000, China
*
Author to whom correspondence should be addressed.
These authors contributed equally to this work.
Agronomy 2024, 14(8), 1627; https://doi.org/10.3390/agronomy14081627
Submission received: 4 July 2024 / Revised: 22 July 2024 / Accepted: 24 July 2024 / Published: 25 July 2024
(This article belongs to the Section Agroecology Innovation: Achieving System Resilience)

Abstract

:
In this study, we investigated if reducing the amount of chemical fertilizer by combining it with organic fertilizer in Hemerocallis citrina Baroni (H. citrina) cultivation could improve plant growth and photosynthetic capacity and, consequently, increase yield and quality. A continuous two-year field experiment was conducted at a research farm in Zhangzhou City, China, during 2021–2022. Six fertilization levels with two locally grown H. citrina cultivars, “Taidong 6” and “Shibage”, were tested. The results showed that 100% of the recommended dose of chemical fertilizer (RDF) with bio-organic fertilizer yielded superior effects in promoting both vegetative and reproductive growth in comparison to RDF alone. However, reducing the application rate of chemical fertilizers, especially by more than 40%, resulted in a significant decline in certain agronomic traits such as plant width, leaf width, and scape length. Compared to RDF, the use of 100% or 80% RDF in combination with bio-organic fertilizer significantly increased chlorophyll content, net photosynthetic rate, and transpiration rate as well as yield production, while excessive reductions in chemical fertilizer rate produced results that demonstrated an opposite trend. The co-application of chemical and bio-organic fertilizer enhanced the contents of soluble sugar and lowered total acidity, whereas excessive chemical fertilizer reduction decreased vitamin C, total flavonoids, and soluble protein levels. Utilizing radar chart analysis for a comprehensive assessment of yield and quality demonstrates that the application of bio-organic fertilizer with 80% RDF could be a better field fertilization regime for H. citrina cultivation.

1. Introduction

Hemerocallis citrina Baroni (H. citrina) is a species of perennial herb belonging to the Asphodelaceae family. The fresh and dried unopened flower buds of H. citrina are commonly referred to as “Golden Needle” or “Huanghua Cai” in Chinese. It has a long history of use as a highly nutritious vegetable in Asian cuisine [1]. In 2018, the cultivation area of H. citrina in China covered approximately 6.04 × 10⁴ ha, yielding a total production of about 5.85 × 10⁵ t and generating an economic value of RMB 4.32 billion [2]. The cultivation industry of H. citrina now benefits farmers by increasing their income and promoting rural revitalization in several regions of China [3].
Fertilizers play a vital role as an indispensable guarantee for national food security and an effective supply of agricultural products. Over the past few decades, the significant escalation in crop production in China has largely been due to the intensive application of fertilizers [4]. China has been the world’s greatest utilizer of chemical fertilizers, using 23% of the world’s total nitrogen fertilizer, 21% of the world’s phosphorus fertilizer, and 26% of the world’s total potassium fertilizer [5]. However, the long-term and excessive use of fertilizers has a negative impact on soil health and the sustainability of agricultural practices [6]. Excessive use of chemical fertilizers not only escalates production costs but also diminishes crop quality and leads to considerable nutrient depletion, degradation of soil quality, and exacerbation of pest and disease issues [7,8,9]. This, in turn, necessitates increased pesticide usage, resulting in residual contamination. The same issues also occur in H. citrina production, where the overuse of a single fertilizer leads to soil compaction, a decline in soil organic matter, the destruction of soil aggregate structure, and a diminished fertilizer utilization rate, which causes decreased yields [10,11]. Therefore, identifying effective fertilization strategies that mitigate the detrimental effects of excessive fertilizer application has become an urgent imperative in agricultural production.
In light of the imperative to sustain stable food production over the long term in China, the total cessation of chemical fertilizer utilization is impracticable. Presently, integrated nutrient management emerges as a viable strategy to mitigate the environmental impacts engendered by the overapplication of chemical fertilizers. This approach is not intended to supplant chemical fertilizers in the near term; rather, it aims to diminish their usage through the concomitant application of organic fertilizers. Evidence has demonstrated that such synergistic application notably enhances soil fertility more effectively than the exclusive use of either chemical or organic fertilizers [12,13]. Bio-organic fertilizer is a novel organic fertilizer formed by adding a variety of beneficial microbial communities, in which the unique microbial community can activate soil, enhance its physicochemical properties, increase soil biodiversity, and improve soil enzyme activity [14]. Previous studies have shown that the combined application of bio-organic fertilizer and chemical fertilizer can increase soil organic matter content, improve crop root vitality and resistance, promote crop nutrient absorption and accumulation, and enhance crop yield and quality [15,16,17]. Qiu et al. [18] reported that the combined application of chemical and bio-fertilizers notably enhanced root growth and optimized nutrient distribution in citrus plants. Shi et al. [19] revealed that reducing the use of chemical fertilizers and appropriately supplementing with bio-organic fertilizers significantly increased soil availability of nitrogen and phosphorus, as well as improved cotton stem diameter and seed yield. Compared to conventional chemical fertilizer application, the total soluble sugars and vitamin C content in tomatoes treated with a 25% reduced application of chemical fertilizer plus Trichoderma-enriched bio-organic fertilizer increased by up to 24% and 57%, respectively, while nitrate accumulation decreased by up to 62% [12].
Currently, the H. citrina industry and its market scale remain relatively limited, and the increase in market value relies on the improvement of production and quality [20]. Adopting reasonable fertilization management practices is the best method to ensure the quality and yield of H. citrina, improve and optimize the industrial structure of H. citrina, as well as promote its upgrading and efficiency [10,11]. Although bio-organic fertilizers have been shown to improve both crop growth and quality as discussed above, information is limited on the impact of reducing chemical fertilizer application and adding bio-organic fertilizers on the yield and quality of H. citrina. Additionally, a comprehensive evaluation method for the yield and quality of H. citrina needs to be perfected. Therefore, this study used locally widely planted varieties (“Taidong 6” and “Shibage”) in the southeast H. citrina planting region in China as experimental materials, with the recommended dose of chemical fertilizer (RDF) as the control, to explore the effects of reducing chemical fertilizer and applying bio-organic fertilizer on the plant growth, yield, and quality of H. citrina and to comprehensively evaluate their yield and quality with the radar chart method. This study provides valuable guidance for the establishment of environmentally friendly green fertilization techniques for H. citrina cultivation in subtropical region of China and the promotion of sustainable development in the H. citrina industry.

2. Materials and Methods

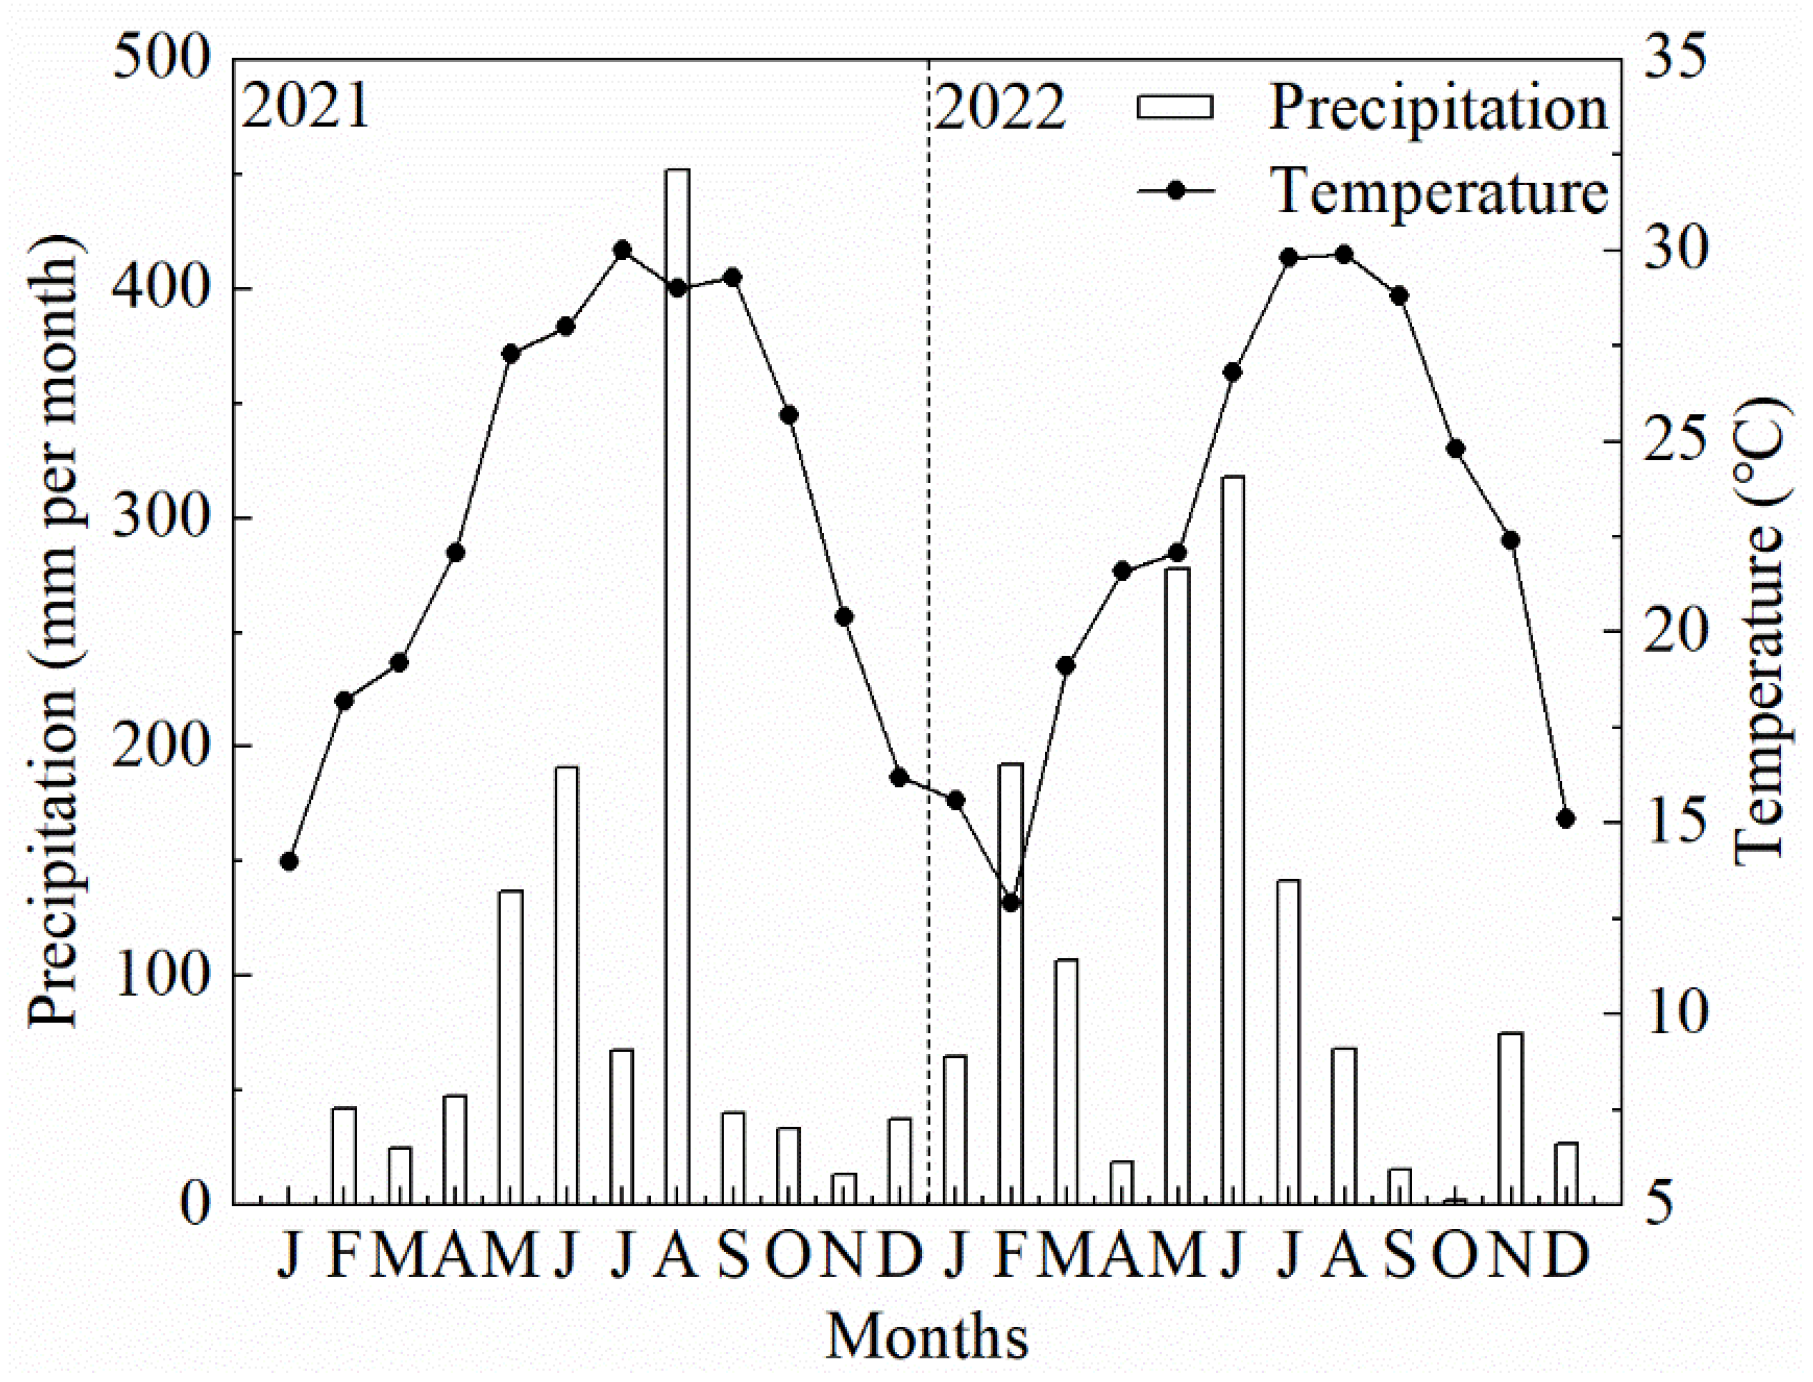
2.1. Site Description

The experiment was conducted at the experimental base of the Institute of Subtropical Agriculture, Fujian Academy of Agricultural Sciences (117°43′ E, 24°32′ N, 18 m AMSL) from 2021 to 2022. The region has a subtropical monsoon humid climate. The average air temperature and precipitation data over the two-year period were obtained from a nearby weather station (Figure 1). The soil tested was a gray sandy loam with 6.57 pH, 14.2 g·kg−1 of organic matter, 68.0 mg·kg−1 of alkali-hydrolysable N, 12.8 mg·kg−1 of Olsen-P, and 177.2 mg·kg−1 of available K in the 0–20 cm soil layer.

2.2. Plant Materials and Experimental Design

The cultivars of H. citrina examined in this study were “Shibage”, a representative cultivar from southern Fujian, and “Taidong 6”, which was introduced from Taiwan. A field plot experiment was conducted to evaluate the effects of various fertilization treatments. Six treatments were established: T0 (no fertilization), T1 (recommended dose of chemical fertilizer, RDF), T2 (100% RDF with bio-organic fertilizer), T3 (80% RDF with bio-organic fertilizer), T4 (60% RDF with bio-organic fertilizer), and T5 (40% RDF with bio-organic fertilizer). The fertilizers evaluated in this study were alginate compound fertilizer and alginate bio-organic fertilizer. The compound fertilizer comprised a balance of N-P2O5-K2O at a 15:15:15 ratio and contained ≥800 mg·kg−1 of alginic acid. The bio-organic fertilizer included alginic acid ≥ 1000 mg·kg−1, organic matter ≥ 45.0%, and specific beneficial microbial strains (including Bacillus subtilis, Bacillus licheniformis, Bacillus mucilaginosus, etc.) with an effective viable count ≥ 108 CFU·g−1. These products were manufactured by Shandong Enbao Biotechnology Co., Ltd. (Qingdao, China). Details regarding the timing and quantity of fertilizer application are provided in Table 1. Both bio-organic and chemical fertilizers were uniformly broadcast into a trench (width of 20 cm and depth of 10 cm) which was placed 10 cm away from the H. citrina plants. Experimental plots each spanned an area of 8 m2 (1.6 m × 5 m, with a ridge width of 1.2 m and furrow width of 0.4 m). On 26 January 2021, H. citrina seedlings were transplanted, with two plants per hole. The row spacing was set at 40 cm and the hole spacing at 30 cm, resulting in a planting density of 62,500 holes·ha−1. The experimental design was a randomized complete block with three replicates.

2.3. Plants Observation, Sampling and Measurement

The agronomic characteristics of each treatment plot at the flowering stage were assessed by selecting six representative plants for measurement. Parameters included plant height and width, leaf length and width, along with scape length, defined as the distance from the base of the main scape to the top of the inflorescence, and floral bud length, measured from the pedicel of the central bud in the inflorescence to the bud’s apex. These dimensions were gauged using a ruler. The diameters of the main scape and the floral bud at their widest points were measured with a vernier caliper. Additionally, three uniform, disease-free H. citrina plants of comparable size and development were chosen. Measurements of net photosynthetic rate (Pn) and transpiration rate (Tr) were determined by a portable photosynthesis system (GFS-3000, Heinz Walz, Effeltrich, Germany) and conducted on the central section of the third newest leaf on each plant. The SPAD, indicative of total chlorophyll, was measured by portable chlorophyll meter (SPAD-502 Plus, Konica Minolta, Tokyo, Japan) and calculated using average values from the upper, middle, and lower leaf sections. The yield was determined during the harvest period by demarcating a 2 m2 central area within each treatment plot and harvesting daily. Records included the fresh weight of floral buds, total fresh yield, and counts of scapes and floral buds. Bud samples were stored at −80 °C for further analysis.
The nutritional analysis of H. citrina involved fresh sample assessments. Soluble protein content was determined by the Coomassie brilliant blue G250 method [21]. Soluble sugars were quantified using the anthrone colorimetric method [22]. Vitamin C concentration was measured via the phosphomolybdic acid spectrophotometric method [23]. Total flavonoid content was ascertained with the sodium nitrite–aluminum nitrate spectrophotometric method [24]. The total acid content was determined according to the pH meter potentiometric titration method [25].

2.4. Basic Procedure of Improved Radar Chart Method

Radar chart analysis is a visual technique that translates multidimensional information about an evaluation subject into a two-dimensional space [26]. This method visually represents the strengths and weaknesses of the subject across multiple indicators. To obtain quantifiable results suitable for comparison, Chinese scholars have constructed a comprehensive evaluation function by calculating the area and perimeter of radar chart feature vectors. This function is utilized to compute the scores of the evaluation targets, which are then ranked according to the magnitude of their scores to generate the final evaluation outcome [27,28]. The specific analytical procedures are delineated as follows.

2.4.1. Establishing the Comprehensive Evaluation Index Matrix

The data matrix R, representing the evaluation samples and indexes, was established as follows: there were 2 × 2 × 6 (two years, two cultivars, and six fertilization levels) evaluation samples and nine (scape number, floral bud number, floral bud weight, yield, vitamin C, total flavonoids, total acid, soluble sugar, and soluble protein) evaluation indexes:
R = (rij)m×n
where rij is the original data of the jth evaluation index in the ith sample, with m = 24 and n = 9.

2.4.2. Normalization of Evaluation Index

In order to ensure the comparability of different indicators, considering the potential differences in types and dimensions, it is necessary to standardize the data. The standardization process is typically conducted according to the following equation:
r′ij = rij/maxrij
Here, r′ij, rij, and maxrij represent the transformed data, original data, and the maximum value of the jth evaluation index of the ith evaluation sample, respectively. The standardization result transforms the indicator values into the interval [0, 1], where a value closer to 1 indicates a better trait.

2.4.3. Construction of the Evaluation Function and Comprehensive Assessment

In the radar chart consisting of n evaluation indicators, its area is composed of n triangles, and the two sides of each triangle are formed by any two of the n axes, with the angles between them calculated as the average of 360 degrees divided by n indicators. The average area and average perimeter of the radar chart remain invariant with respect to the sequence of evaluation indicators; therefore, these two parameters have been chosen as feature vectors for quantifying the comprehensive evaluation. The calculation formulas of the two are as follows:
S i = n p = 1 n 1 q > p n 1 2 r i p   r i q sin θ   C n 2
L i = n p = 1 n 1 q > p n r i p 2 + r i q 2 2 r i p r i q cos θ   C n 2
where Si and Li represent the average area and average perimeter of the closed graph in the radar chart of the ith evaluation sample, respectively; n is the number of evaluation indexes and is also the number of triangles; r′ip and r′iq are the transformed values of the pth and qth evaluation indexes of the ith evaluation sample, respectively; θ is the angle between the two index axes (that is θ = 2π/n); and C n 2 represents the combination number of selecting any two evaluation indexes from n evaluation indicators.
The evaluation vector was constructed based on the average area and perimeter of the radar chart, denoted as V = (Vi1, Vi2). The computation formulas are the following:
Vi1 = Si/π
Vi2 = 4πSi/Li2
where Vi1 represents the relative size of the radar chart area of the ith evaluation sample, with higher values signifying a stronger overall advantage possessed and, conversely, smaller values indicating a less competitive position. Vi2 is employed to reflect the inhomogeneity degree of all indices within the ith evaluation treatment; a higher value indicates better balanced indices, whereas a lower value suggests more poorly balanced indices.
Various methods exist for constructing evaluation functions, with the most common approach involving the calculation of the geometric mean of the evaluation variables. Its formula is as follows:
Y i = V i 1 V i 2
where Yi is the comprehensive evaluation value of the ith evaluation treatment. It was assumed that the larger the value of Yi is, the greater the indication of better overall characteristics of the evaluated objective.

2.5. Statistical Analysis

Statistical analyses were conducted using Microsoft Excel 2016 and SPSS 27.0. Graphs were plotted using Origin 2021b. The LSD test was used to assess the differences among all treatments at the p < 0.05 level. Spearman’s correlation coefficients were used to assess the relationships between plant growth traits and yield parameters of H. citrina. The water use efficiency (WUE) was calculated as the ratio of Pn and Tr. In addition, both yield- and quality-related parameters were analyzed using an improved radar chart method; all parameters were normalized through a maximum transformation to ensure consistency in the data representation.

3. Results

3.1. Plant Growth Characteristics

Table 2 presents the results for the effects of various fertilization treatments on the vegetative and reproductive growth indexes of H. citrina over a two-year period. Both “Taidong 6” and “Shibage” demonstrated similar trends across the duration of the study. Fertilization significantly enhanced both vegetative growth and reproductive development in H. citrina when compared to the non-fertilized control (T0). Compared with the RDF alone (T1), all tested agronomic traits showed improvement under T2 treatment, with increases ranging from 0.1% to 6.2%. Conversely, T3–T5 treatments exhibited a descending trend in PH, LL, SL, SD, and FBL, with average reductions of 4.1–9.8%, 1.0–11.2%, 4.7–10.5%, 2.8–9.0%, and 0.2–2.9%, respectively. The mean traits of PW and LW for both H. citrina cultivars initially increased and then decreased under treatments T3–T5, whereas FBD consistently increased by 1.4–5.9% relative to T1 results. This suggests that reducing chemical fertilizer application and using bio-organic fertilizer can effectively inhibit the excessive growth of vegetative organs of H. citrina and promote the transformation of buds from slender to robust types.

3.2. Leaf Chlorophyll Content (SPAD Value)

Compared to the control treatment (T0), an increase in leaf SPAD values was observed with the application of chemical fertilizer alone (T1) or in combination with bio-organic fertilizer (T2–T5). Specifically, in the T2 and T3 treatments, the “Taidong 6” and “Shibage” cultivars exhibited the highest SPAD values, showing an increase of 2.7–7.3% and 2.4–7.1%, respectively, relative to the T1 treatment. Notably, the “Taidong 6” cultivar demonstrated more remarkable fluctuations in chlorophyll content across different fertilization treatments compared to “Shibage”, indicating a greater sensitivity to fertilization (Figure 2).

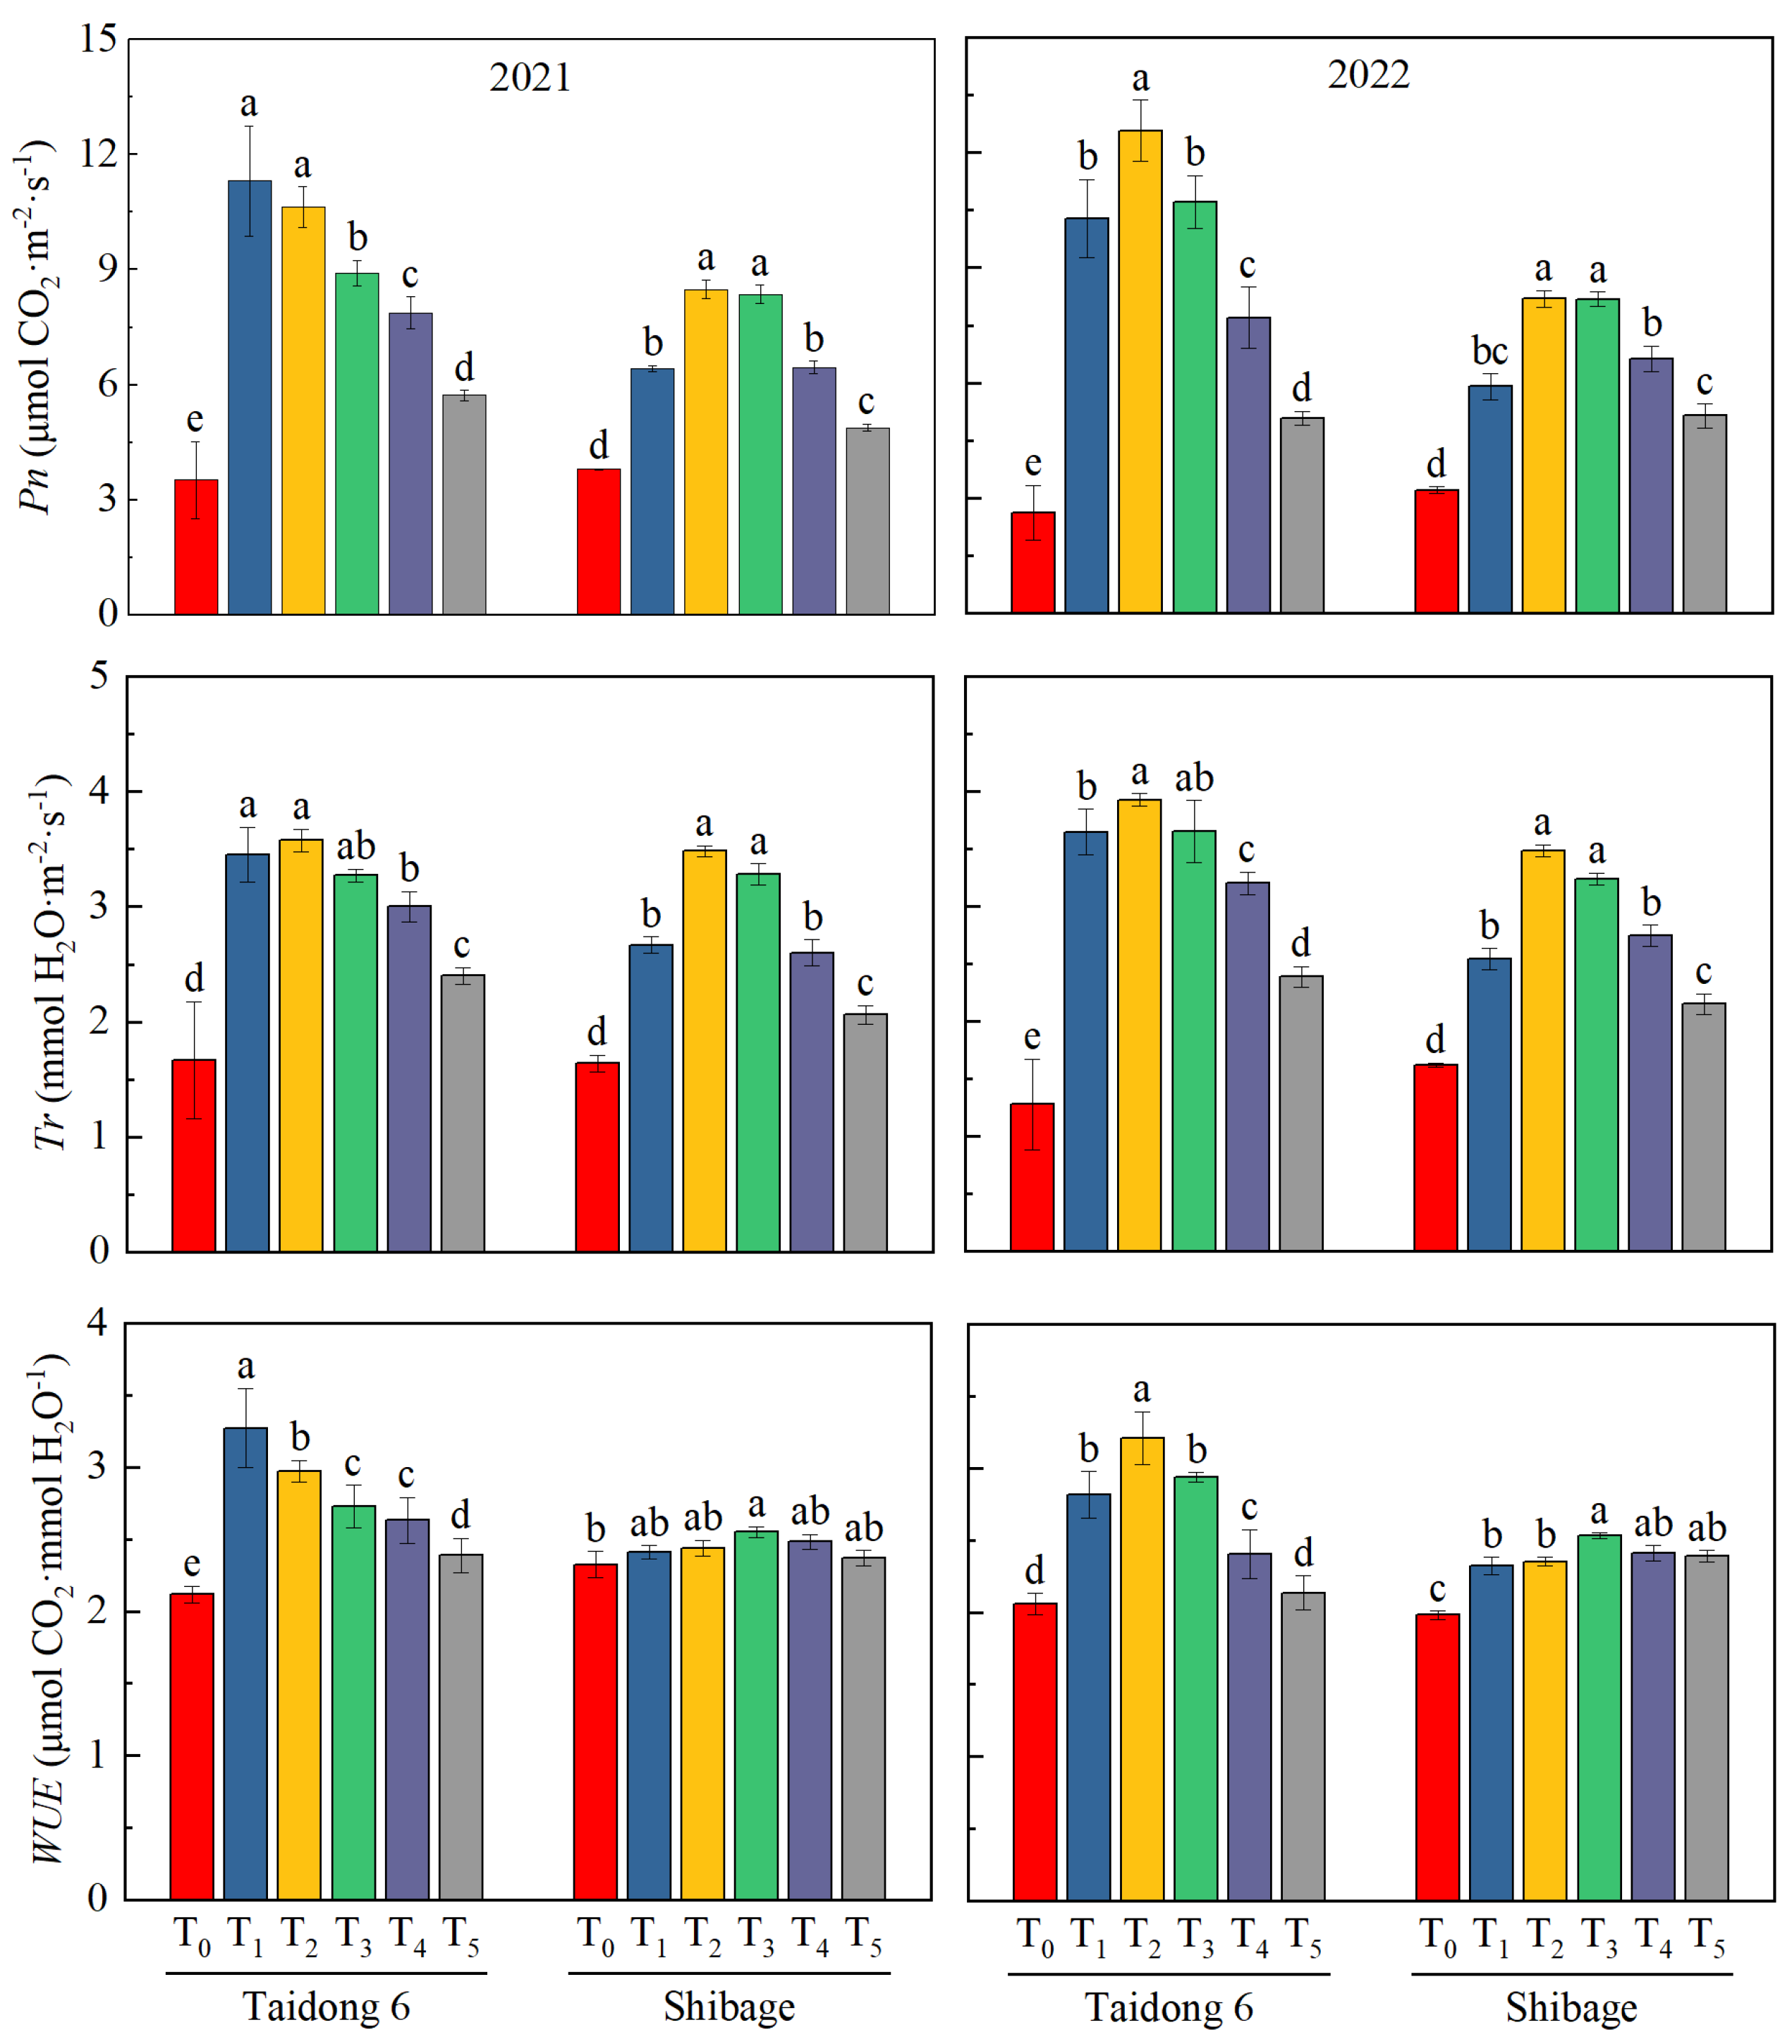
3.3. Leaf Photosynthetic Parameters

As shown in Figure 3, significant differences were observed in the Pn, Tr, and WUE of H. citrina across all fertilized treatments compared to the unfertilized treatment. The highest values for leaf Pn and Tr were recorded in the T2 treatment, followed by T3 and T1 treatments, respectively. In the two years of experiments, the “Shibage” cultivar exhibited the highest WUE under the T3 treatment; conversely, the “Taidong 6” cultivar showed the highest WUE values under the T1 and T2 treatments, respectively. The impact of different fertilization treatments on the WUE of the “Taidong 6” cultivar was more significant than that observed in the “Shibage” cultivar.

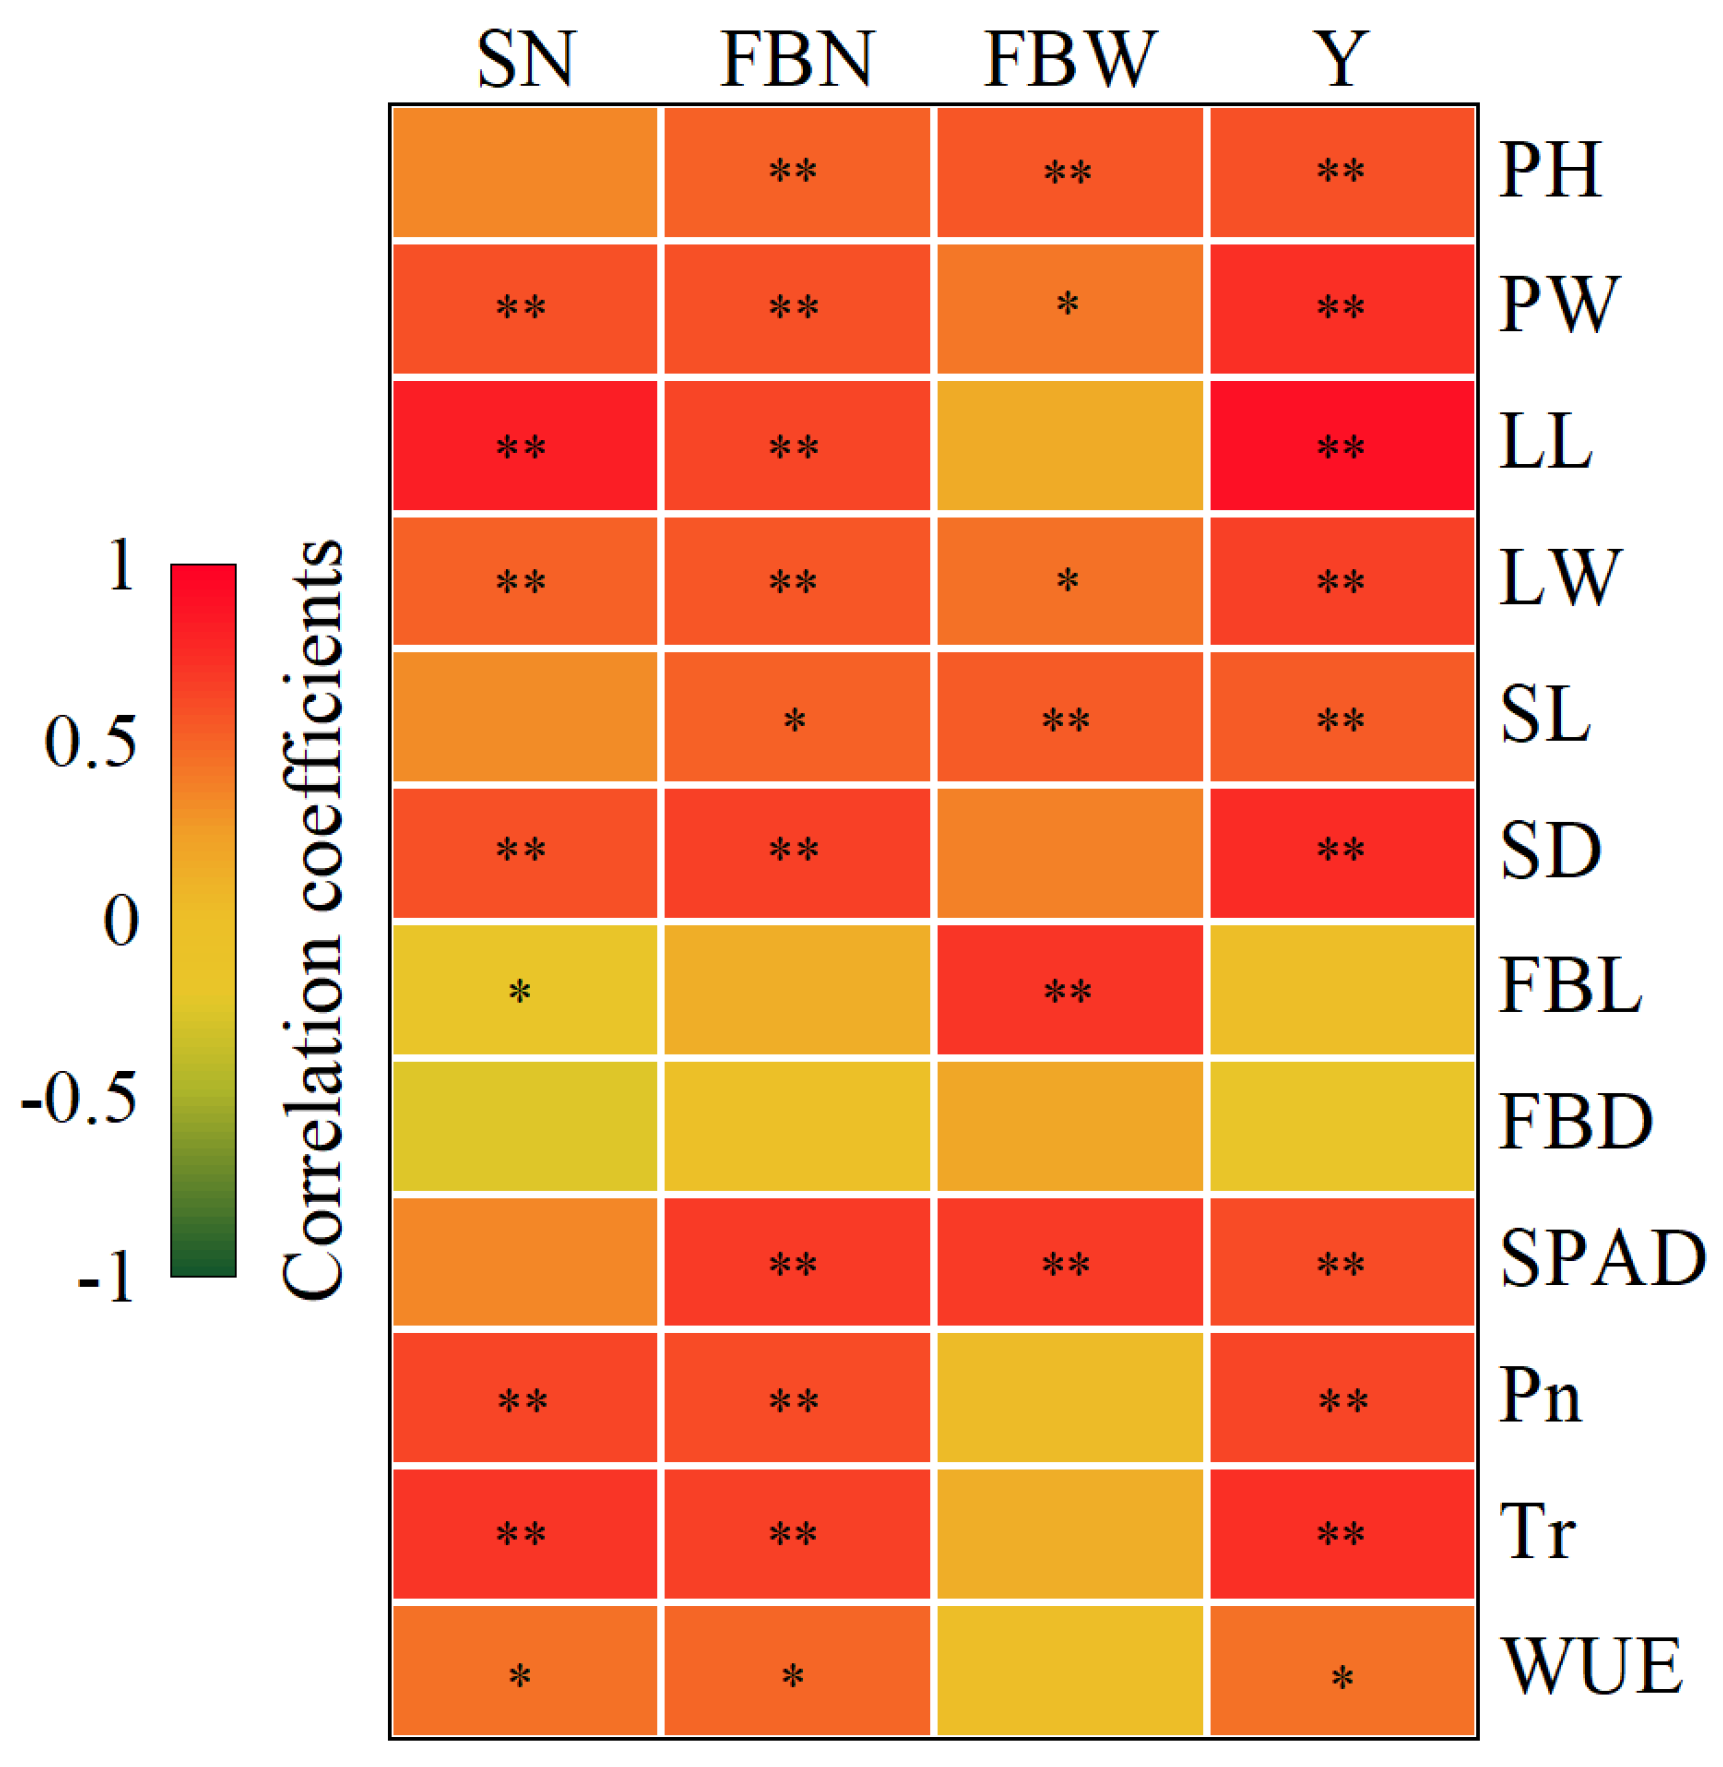
3.4. Yield Performance and Correlation Analysis

From Table 3, one can observe that all fertilizer treatments enhanced the yield, scape number, floral bud number and floral bud weight in both H. citrina cultivars compared to the treatment with no fertilizer. In detail, the “Taidong 6” cultivar showed increases of 108.9–446.4% in yield, 76.5–250.0% in scape number, 14.9–83.8% in floral bud number, and 3.6–11.9% in floral bud weight following fertilizer application. Similarly, the “Shibage” cultivar exhibited improvements of 109.6–341.2% in yield, 50.0–200.0% in scape number, 21.1–53.3% in floral bud number, and 5.6–18.7% in floral bud weight when fertilized. Overall, fertilization had a more significant effect on yield, scape number, and floral bud number for “Taidong 6”, while it had a greater impact on floral bud weight for “Shibage”. Compared with the T1 treatment, the average yield of T2 and T3 treatments increased by 14.9% and 17.6%, respectively, whereas the yield of T4 and T5 treatments decreased by 10.3% and 34.9%, respectively. The scape number showed a declining trend with the reduction in chemical fertilizer use, while both the floral bud number and floral bud weight first increased, and then decreased, with the changes in the floral bud number being particularly significant. In two years of experimental results, different fertilization treatments showed similar trends in their effects on the yield and its components of H. citrina. This suggests that an appropriate reduction in chemical fertilizer combined with the application of bio-organic fertilizer (especially T3 which contains 80% RDF) can achieve higher yields by increasing the floral bud number while maintaining the scape number.
Through the correlation analysis of the agronomic traits and yield parameters (Figure 4), it was found that there were seven growth indexes exhibiting significant (p < 0.01) positive correlations with the scape number of H. citrina, with leaf length demonstrating the highest correlation coefficient (0.824), followed by transpiration rate (0.692) and photosynthetic rate (0.624). The floral bud number showed significant (p < 0.01) positive correlations with eight agronomic traits, with the strongest correlations observed for SPAD value (0.668), transpiration rate (0.665), and scape diameter (0.661). Floral bud weight was positively correlated with four growth parameters; the highest correlation coefficients were associated with floral bud length (0.712), SPAD value (0.680), and plant height (0.570). Furthermore, yield was positively correlated with nine agronomic traits. The strongest correlations were found for leaf length (0.881), scape diameter (0.757), and transpiration rate (0.722).

3.5. Quality Analysis

The data reveal that the application of different fertilizer treatments significantly affected all assessed quality parameters over two consecutive growing seasons (Table 4). Bio-organic fertilizer applications exhibited higher values in certain measured indexes than that of chemical fertilizer alone and unfertilized treatments. In general, the combined use of bio-organic fertilizers was associated with an initial increase, followed by a decrease, in the levels of vitamin C, total flavonoids, soluble sugars, and soluble proteins in H. citrina as the rate of reduced chemical fertilizer increased. The highest concentrations of these components were predominantly observed under the T3 treatment, followed by the T4 and T2 treatments. Conversely, the total acid content showed a consistent decline across treatments involving bio-organic fertilizers, with reductions ranging from 9.8% to 22.5% compared to the T1 treatment. The findings indicate that a moderate reduction in chemical fertilizers combined with the use of bio-organic fertilizers improves the nutritional value and taste of H. citrina.

3.6. Overall Evaluation of H. citrina Yield and Quality by Radar Chart

The yield and quality parameters of H. citrina cultivars were dimensionless-processed and plotted onto a radar chart (Figure 5), and then the evaluation function was constructed based on the average area and perimeter of the radar chart to comprehensively assess the effects of different fertilization treatments (Table 5). A higher value of the evaluation function result (Yi) indicates better comprehensive traits of yield and quality in H. citrina. From the radar chart, it is evident that several indicators (especially total flavonoids and soluble sugar) for the year 2022 significantly improved compared to 2021, demonstrating enhanced overall advantages and greater balance. Among the different fertilization treatments, the T3 treatment showed the most significant advantage in indicators, followed by the T2 and T4 treatments. The comprehensive evaluation results indicate that, with the exception of the “Taidong 6” cultivar in 2021 (which performed better under the T2 treatment than the T3 treatment), all other instances exhibited the highest rankings under the T3 treatment, followed by the T2 and then the T1 or T4 treatments. These results suggest that a moderate reduction in chemical fertilizers, combined with the application of bio-organic fertilizers, significantly improves both the yield and quality of H. citrina.

4. Discussion

Fertilizers play a crucial role in modern agricultural practices, as they are deemed essential for addressing land degradation and food insecurity in densely populated areas [29,30]. By combining the use of chemical fertilizers and organic fertilizers, it is possible to adjust and optimize the fertilizer application structure, thus reducing the amount of chemical fertilizers used [19]. Research has demonstrated that integrating a 10–20% reduction in chemical fertilizer usage with the appropriate application of bio-organic fertilizer can enhance soil fertility, promote the growth and development of plants, and increase the yield of Brassica campestris ssp. [31]. In the present study, compared with the RDF alone, reducing chemical fertilizer by 20% combined with an appropriate amount of bio-organic fertilizer was able to increase yield by 10.2–26.0%. However, when the reduction in chemical fertilizer usage exceeded 40%, even when combined with bio-organic fertilizer, the H. citrina yield exhibited a downward trend (Table 3). This is consistent with the results of the study by Rose et al. [32], who found that bio-fertilizer could replace 23–52% of nitrogen fertilizer without a loss of yield. The bio-organic fertilizer application in this study used seaweed extract as a carrier and contained multiple plant growth-promoting rhizobacteria (PGPR) strains, including various Bacillus species. Among them, Bacillus mucilaginosus can decompose potassium feldspar and apatite through mechanisms such as acidolysis, alkaline hydrolysis, capsule adsorption, and comprehensive actions, thus increasing the content of phosphorus (P) and potassium (K) in soil [33]. Bacillus subtilis has been documented to significantly enhance nitrogen fixation and induce pathogen resistance in plants [34]. Therefore, PGPR-containing bio-organic fertilizers can improve nutrient availability by activating the soil nutrient system. Since chemical fertilizers have the advantage of rapid nutrient release, the combined application of bio-organic fertilizer and chemical fertilizer can compensate for the slow release of nutrients in bio-organic fertilizer, balancing soil nutrients, and thereby meeting the nutrient demands of crops throughout their entire growth period. This facilitates the formation of crop yields.
The yield components of H. citrina include the number of scapes, the number of floral buds per scape, and the weight of floral buds. Experimental analysis of the different fertilization results revealed that increasing the number of floral buds and preserving the number of scapes is crucial for achieving optimal yield. This is similar to the findings of Song et al. [10]. Correlation analysis suggested that the plant width, leaf length, leaf width, transpiration rate, photosynthetic rate, and scape diameter of H. citrina were significantly (p < 0.01) related to the number of floral buds and the number of scapes (Figure 4). Integrating various parameters, it is evident that the growth of the leaves and the photosynthetic capacity of daylilies are key agronomic traits in yield formation. The application of bio-organic fertilizers can significantly enhance soil microbial activity, leading to the production of various metabolites such as enzymes, vitamins, hormones and growth stimulants during their decomposition, as well as promote root growth and nutrient absorption, which might promote accumulation of photosynthates, reduce ineffective tillering, and facilitate a more efficient distribution of photosynthetic products to reproductive organs [15,35,36,37]. This was supported by our finding that photosynthetic efficiency, scape number, and floral bud number significantly increased under bio-organic fertilization (Figure 3, Table 3). Furthermore, a comparison between the two H. citrina cultivars revealed that “Taidong 6” exhibited higher sensitivity to various fertilization treatments in terms of SPAD values, WUE, and yield compared to the “Shibage” cultivar (Figure 2 and Figure 3, Table 3). This may be explained by the fact that “Taidong 6” bloomed earlier (about 50 days ahead of the “Shibage” cultivar); the bio-organic fertilizer applied was not fully released, and the excessive reduction in chemical fertilizer led to an insufficient soil nutrient supply, thereby affecting the growth and development of “Taidong 6”, particularly in the first year. Therefore, the application of bio-organic fertilizers should be appropriately advanced for early-blooming cultivars of H. citrina.
Quality refers to the comprehensive set of multi-level quality characteristics of crops and is the direct factor determining their economic benefits [38]. The enhancement of fruit and vegetable quality primarily encompasses three key aspects: visual appeal, nutritional value, and taste and flavor [39,40]. Previous studies have demonstrated that the appropriate application of bio-organic fertilizers in combination with chemical fertilizers enhances soil properties and alters bacterial and fungal communities, so that the quality of banana crops is yet to be improved [34]. The present study showed that in H. citrina, the levels of vitamin C, total flavonoids, soluble sugars, and soluble proteins increased to varying degrees in the T2–T4 treatment groups (Table 4). Similar results have also been found in lettuce [41] and edible Roses [42]. Compared to chemical fertilizers, the application of bio-organic fertilizer significantly increased the nutritional content of purslane, including soluble sugars and total flavonoids, while reducing the levels of antinutritional compounds such as nitrates and soluble oxalic acid [43]. In this study, we observed a continuous decline in the total acid content of H. citrina as the amount of chemical fertilizer decreased across all treatments involving the application of bio-organic fertilizer (Table 4). Bio-organic fertilizers that provide organic nutrients are more efficient than nutrients from chemical sources in supporting plant functions, such as protein and enzyme synthesis [44]. Moreover, their slow-release properties may help prevent excessive nitrogen uptake, which could lead to increased levels of amino acids and polyphenols at the expense of reduced sugars in H. citrina, thereby contributing to the improvement of flavor [45]. The application of Bacillus-based bio-organic fertilizer has been reported to significantly increase the levels of tea polyphenols and amino acids, which are crucial indicators for assessing tea quality [33]. It is interesting to note that these microorganisms might induce the production of hormones such as gibberellins (GAs) due to the high carbon/nitrogen ratios in the soil [46]. In addition, the PGPR strains can prevent some soil-borne diseases through the coordinate release of antibiotics, and the production of minute active substances can also stimulate and induce crop resistance, thus effectively improving quality [47]. Consequently, future investigations should primarily focus on the impact of the combination of bio-organic fertilizers with reduced chemical fertilizers on the rhizosphere ecology of H. citrina, with the aim of further elucidating the underlying mechanisms governing their relationship with both yield and quality.
Radar chart analysis is increasingly used in the natural sciences, especially within the fields of agricultural and biomedical research [26]. Huang et al. [28] employed radar charts to effectively visualize the resistance characteristics of various rice varieties against the white-backed planthopper, providing a clear distinction of their resistance performances. Xin et al. [48] visually represented and quantitatively analyzed the synergistic interactions between roots, water, and soil nutrients by utilizing radar charts, intuitively revealing that root development is a limiting factor for improving soil moisture and nutrient supply efficiency. When plotting a radar chart, the shape of the chart varies with the order of the indicators, consequently affecting the area and perimeter of the radar chart. Given the one-to-one correspondence between the combination of indicators and the radar chart, Wang [49] introduced the concepts of “average area” and “average perimeter”, that is, exhausting all possible combinations of indicator arrangements, plotting all potential radar charts, and then calculating their average area and perimeter. We used the improved radar chart method to provide an integrated analysis of H. citrina yield and quality. Results showed that a moderate reduction in chemical fertilizer combined with the application of bio-organic fertilizer enhanced both the yield and quality of H. citrina, and the T3 treatment demonstrated superior comprehensive performance, with the highest Yi value of 0.820 in the radar chart evaluation (Table 5). This indicates that a 20% decrease in chemical fertilizer usage complemented by bio-organic fertilizer not only conserves resources and decreases fertilizer costs but also stimulates crop growth, resulting in both quality improvement and increased production, thereby maximizing economic benefits. Based on these findings, we identified the T3 treatment (80% RDF with bio-organic fertilizer) as the optimal fertilization strategy.

5. Conclusions

A moderate reduction in the use of chemical fertilizers, especially by 20%, combined with the application of bio-organic fertilizer, can significantly promote plant growth, improve photosynthetic efficiency, and increase both the yield and quality of H. citrina production. This integrated fertilization approach, as opposed to the exclusive use of chemical fertilizers, is environmentally sustainable and increases the economic value of H. citrina. The T3 treatment, which involves applying 80% of the recommended dose of chemical fertilizer plus bio-organic fertilizer, has been identified as the optimal fertilization management practice, particularly for the “Taidong 6” and “Shibaige” cultivars of H. citrina. This finding provides a theoretical basis for selecting rational fertilization techniques to boost both the production and quality of H. citrina and paves the way for further research on the effects of reduced chemical fertilizer rates by applying bio-organic fertilizers on nutrient uptake, utilization, and the rhizospheric soil ecosystem of H. citrina.

Author Contributions

Conceptualization, S.W., Z.L. (Zhou Li) and J.H.; methodology and investigation, Y.Y., J.S., D.L. and Z.L. (Zhengfeng Lai); data curation and analysis, S.W. and D.L.; visualization, Y.Y. and Z.L. (Zhou Li); writing—original draft preparation, Z.L. (Zhou Li); writing—review and editing, S.W.; supervision, J.H. All authors have read and agreed to the published version of the manuscript.

Funding

This research was funded by the Basic Research Special Foundation of Public Research Institutes of Fujian Province, China (2020R1030006, 2021R1030002); the Program for Innovative Research Team of Fujian Academy of Agricultural Sciences, China (CXTD2021006-3); the Special Project for Science and Technology Innovation Platform of Fujian Academy of Agricultural Sciences, China (CXPT2023003); and the Project to Freely Explore Science and Technology Innovation in Fujian Academy of Agricultural Sciences (ZYTS202207).

Data Availability Statement

Data are contained within the article.

Conflicts of Interest

The authors declare no conflicts of interest.

References

  1. Xie, Y.; Chen, T.; Ren, H. Rhizome weight and number of sectioning per rhizome determine plantlet growth and propagation rate of Hemerocallis citrina Baroni in cutting propagation. Agronomy 2022, 11, 2777. [Google Scholar] [CrossRef]
  2. Li, S.; Ji, F.; Hou, F.; Shi, Q.; Xing, G.; Chen, H.; Weng, Y.; Kang, X. Morphological, palynological and molecular assessment of Hemerocallis core collection. Sci. Hortic. 2021, 285, 110181. [Google Scholar] [CrossRef]
  3. Li, Z.; Tan, F.; Zhao, Y.; Zhang, D.; Hong, J.; Wu, S. Screening and evaluation of superior germplasm based on yield and quality characteristics of Hemerocallis citrina. J. Trop. Subtrop. Bot. 2024, 32, 82–92. (In Chinese) [Google Scholar]
  4. Geng, Y.; Cao, G.; Wang, L.; Wang, S. Effects of equal chemical fertilizer substitutions with organic manure on yield, dry matter, and nitrogen uptake of spring maize and soil nitrogen distribution. PLoS ONE 2019, 14, e0219512. [Google Scholar] [CrossRef]
  5. FAOSTAT. Faostat Database Collections (Rome: Food and Agriculture Organization of the United Nations). Available online: https://www.Fao.Org/faostat/en/#data/rfn (accessed on 12 October 2020).
  6. Huang, C.; Zhang, K.; Guo, W.; Huang, H.; Gou, Z.; Yang, L.; Chen, Y.; Oh, K.; Fang, C.; Luo, L. The effects of partial substitution of fertilizer using different organic materials on soil nutrient condition, aggregate stability and enzyme activity in a tea plantation. Plants 2023, 12, 3791. [Google Scholar] [CrossRef]
  7. Shi, C.H.; Wang, X.Q.; Jiang, S.; Zhang, L.Q.; Luo, J. Revealing the role of the rhizosphere microbiota in reproductive growth for fruit productivity when inorganic fertilizer is partially replaced by organic fertilizer in pear orchard fields. Microb. Biotechnol. 2023, 16, 1373–1392. [Google Scholar] [CrossRef] [PubMed]
  8. Sun, B.; Zhang, L.; Yang, L.; Zhang, F.; Norse, D.; Zhu, Z. Agricultural non-point source pollution in China: Causes and mitigation measures. Ambio 2012, 41, 370–379. [Google Scholar] [CrossRef]
  9. Han, Z.; Leng, Y.; Sun, Z.; Li, Z.; Xu, P.; Wu, S.; Liu, S.; Li, S.; Wang, J.; Zou, J. Substitution of organic and bio-organic fertilizers for mineral fertilizers to suppress nitrous oxide emissions from intensive vegetable fields. J. Environ. Manag. 2024, 349, 119390. [Google Scholar] [CrossRef]
  10. Song, Z.; Duan, J.; Liang, Z.; Jia, M.; Li, Y.; Cao, D. Effects of different nitrogen application rates on growth, photosynthetic characteristics and yield of daylily (Hemerocallis citrina Baroni) at bolting stage. North. Hortic. 2023, 13, 8–14. (In Chinese) [Google Scholar]
  11. Xie, M.; Huo, Y.; Zhang, Z.; Xia, H.; Zhang, X.; Tian, S.; Zheng, X. Production history and present situation of daylily. J. Shanxi Datong Univ. Sci. 2024, 40, 12–16. (In Chinese) [Google Scholar]
  12. Ye, L.; Zhao, X.; Bao, E.; Li, J.; Zou, Z.; Cao, K. Bio-organic fertilizer with reduced rates of chemical fertilization improves soil fertility and enhances tomato yield and quality. Sci. Rep. 2020, 10, 177. [Google Scholar] [CrossRef]
  13. Song, H.; Wang, J.; Zhang, K.; Zhang, M.; Hui, R.; Sui, T.; Yang, L.; Du, W.; Dong, Z. A 4-year field measurement of N2O emissions from a maize-wheat rotation system as influenced by partial organic substitution for synthetic fertilizer. J. Environ. Manag. 2020, 263, 110384. [Google Scholar] [CrossRef]
  14. Qi, Y.; Jiang, F.; Zhou, R.; Wu, Y.; Hou, X.; Li, J.; Lin, W.; Wu, Z. Effects of reduced nitrogen with bio-organic fertilizer on soil properties, yield and quality of non-heading Chinese cabbage. Agronomy 2021, 11, 2196. [Google Scholar] [CrossRef]
  15. Yao, R.; Bai, R.; Yu, Q.; Bao, Y.; Yang, W. The effect of nitrogen reduction and applying bio-organic fertilisers on soil nutrients and apple fruit quality and yield. Agronomy 2024, 14, 345. [Google Scholar] [CrossRef]
  16. Liu, H.; Xiong, W.; Zhang, R.; Hang, X.; Wang, D.; Li, R.; Shen, Q. Continuous application of different organic additives can suppress tomato disease by inducing the healthy rhizospheric microbiota through alterations to the bulk soil microflora. Plant Soil 2017, 423, 229–240. [Google Scholar] [CrossRef]
  17. Guo, L.; Wu, G.; Li, Y.; Li, C.; Liu, W.; Meng, J.; Liu, H.; Yu, X.; Jiang, G. Effects of cattle manure compost combined with chemical fertilizer on topsoil organic matter, bulk density and earthworm activity in a wheat–maize rotation system in eastern China. Soil Tillage Res. 2016, 156, 140–147. [Google Scholar] [CrossRef]
  18. Qiu, F.; Liu, W.; Chen, L.; Wang, Y.; Ma, Y.; Lyu, Q.; Yi, S.; Xie, R.; Zheng, Y. Bacillus subtilis biofertilizer application reduces chemical fertilization and improves fruit quality in fertigated Tarocco blood orange groves. Sci. Hortic. 2021, 218, 110004. [Google Scholar] [CrossRef]
  19. Shi, Y.; Niu, X.; Chen, B.; Pu, S.; Ma, H.; Li, P.; Feng, G.; Ma, X. Chemical fertilizer reduction combined with organic fertilizer affects the soil microbial community and diversity and yield of cotton. Front. Microbiol. 2023, 14, 1295722. [Google Scholar] [CrossRef] [PubMed]
  20. Qing, Z.; Liu, J.; Yi, X.; Liu, X.; Hu, G.; Lao, J.; He, W.; Yang, Z.; Zou, X.; Sun, M.; et al. The chromosome-level Hemerocallis citrina Borani genome provides new insights into the rutin biosynthesis and the lack of colchicine. Hortic. Res. 2021, 8, 89. [Google Scholar] [CrossRef] [PubMed]
  21. Sedmak, J.J.; Grossberg, S.E. A rapid, sensitive, and versatile assay for protein using Coomassie brilliant blue G250. Anal. Biochem. 1977, 79, 544–552. [Google Scholar] [CrossRef]
  22. Fan, H.M.; Li, T.; Sun, X.; Sun, X.Z.; Zheng, C.S. Effects of humic acid derived from sediments on the postharvest vase life extension in cut chrysanthemum flowers. Postharvest Biol. Technol. 2015, 101, 82–87. [Google Scholar] [CrossRef]
  23. Wang, M.; Lv, J.; Zhou, Z. Determination vitamma C in fruits and vegetables by spectrophometric of phosphomolybdic heterpolyacids. Food Sci. 2003, 24, 129–131. (In Chinese) [Google Scholar]
  24. Guo, Y.; Li, Y.; Zhang, S.; Wu, X.; Jiang, L.; Zhao, Q.; Xue, W.; Huo, S. The effect of total flavonoids of epimedium on granulosa cell development in laying hens. Poult. Sci. 2020, 99, 4598–4606. [Google Scholar] [CrossRef]
  25. GB/T 12456—2021; National Health Commission, State Administration for Market Regulation. National Standard for Food Safety–Determination of Total Acids in Foods. China Standards Press: Beijing, China, 2021; pp. 3–4. (In Chinese)
  26. Wang, Y.; Su, J.; Liu, L.; Liu, Z.; Sun, G. Waste cooking oil based capsules for sustainable self-healing asphalt pavement: Encapsulation, characterization and fatigue-healing performance. Constr. Build. Mater. 2024, 425, 136032. [Google Scholar] [CrossRef]
  27. Chang, S.; Geng, Z.; Yang, Q.; Shu, W.; Li, J.; Li, Q.; Zhang, B.; Zhang, D. Application of improved radar chart analysis method in soybean variety selection and breeding. Soybean Sci. 2020, 39, 862–868. (In Chinese) [Google Scholar]
  28. Huang, Y.; Jiang, C.; Liu, C.; Liu, H.; Yang, Q.; Wang, H.; Zeng, W.; Ouyang, J.; Xu, K.; Li, Q. Overall evaluation of resistance capability of different rice varieties to Sogatella furcifera (Hemiptera: Delphacidae) using radar charts. Euphytica 2019, 215, 58. [Google Scholar] [CrossRef]
  29. de Souza, R.; Beneduzi, A.; Ambrosini, A.; da Costa, P.B.; Meyer, J.; Vargas, L.K.; Schoenfeld, R.; Passaglia, L.M.P. The effect of plant growth-promoting rhizobacteria on the growth of rice (Oryza sativa L.) cropped in southern Brazilian fields. Plant Soil 2013, 366, 585–603. [Google Scholar] [CrossRef]
  30. Tittonell, P.; Vanlauwe, B.; Corbeels, M.; Giller, K.E. Yield gaps, nutrient use efficiencies and response to fertilisers by maize across heterogeneous smallholder farms of western Kenya. Plant Soil 2008, 313, 19–37. [Google Scholar] [CrossRef]
  31. Zhai, C.; Cheng, Y.; Qiu, L.; Wang, X.; Ge, L. Effects of combined application of bio-organic fertilizer with reduced chemical fertilizer on growth, yield and quality of Brassica campestris ssp. chinensis var. rosularis. Chin. Agric. Sci. Bull. 2024, 40, 35–43. (In Chinese) [Google Scholar]
  32. Rose, M.T.; Phuong, T.L.; Nhan, D.K.; Cong, P.T.; Hien, N.T.; Kennedy, I.R. Up to 52% N fertilizer replaced by biofertilizer in lowland rice via farmer participatory research. Agron. Sustain. Dev. 2014, 34, 857–868. [Google Scholar] [CrossRef]
  33. Liu, W.; Cui, S.; Wu, L.; Qi, W.; Chen, J.; Ye, Z.; Ma, J.; Liu, D. Effects of bio-organic fertilizer on soil fertility, yield, and quality of tea. J. Soil Sci. Plant Nutr. 2023, 23, 5109–5121. [Google Scholar] [CrossRef]
  34. Li, Z.; Jiao, Y.; Yin, J.; Li, D.; Wang, B.; Zhang, K.; Zheng, X.; Hong, Y.; Zhang, H.; Xie, C.; et al. Productivity and quality of banana in response to chemical fertilizer reduction with bio-organic fertilizer: Insight into soil properties and microbial ecology. Agric. Ecosyst. Environ. 2021, 322, 107659. [Google Scholar] [CrossRef]
  35. Xiao, X.; Li, J.; Lyu, J.; Feng, Z.; Zhang, G.; Yang, H.; Gao, C.; Jin, L.; Yu, J. Chemical fertilizer reduction combined with bio-organic fertilizers increases cauliflower yield via regulation of soil biochemical properties and bacterial communities in northwest China. Front. Microbiol. 2022, 13, 922149. [Google Scholar] [CrossRef] [PubMed]
  36. Anisuzzaman, M.; Rafii, M.Y.; Jaafar, N.M.; Izan Ramlee, S.; Ikbal, M.F.; Haque, M.A. Effect of organic and inorganic fertilizer on the growth and yield components of traditional and improved rice (Oryza sativa L.) genotypes in Malaysia. Agronomy 2021, 11, 1830. [Google Scholar] [CrossRef]
  37. Zahedyan, A.; Aboutalebi Jahromi, A.; Zakerin, A.; Abdossi, V.; Mohammadi Torkashvand, A. Nitroxin bio-fertilizer improves growth parameters, physiological and biochemical attributes of cantaloupe (Cucumis melo L.) under water stress conditions. J. Saudi Soc. Agric. Sci. 2022, 21, 8–20. [Google Scholar] [CrossRef]
  38. Deng, Z.; Qu, L.; Wu, Y.; Zhang, J.; Wang, T. Current progress and prospect of crop quality research. Sci. Sin. Vitae 2021, 51, 1405–1414. (In Chinese) [Google Scholar] [CrossRef]
  39. Drava, G.; Iobbi, V.; Govaerts, R.; Minganti, V.; Copetta, A.; Ruffoni, B.; Bisio, A. Trace elements in edible flowers from Italy: Further insights into health benefits and risks to consumers. Molecules 2020, 25, 2891. [Google Scholar] [CrossRef] [PubMed]
  40. Zheng, P.; Zhang, M.; Wang, Z.; Wang, T.; Tang, L.; Ma, E.; Liu, J.; Shi, F. Comprehensive evaluation of the fruit quality of the main cultivars of pear (Pyrus spp.) in North China. Erwerbs-Obstbau 2021, 64, 219–227. [Google Scholar] [CrossRef]
  41. Jin, N.; Jin, L.; Wang, S.; Li, J.; Liu, F.; Liu, Z.; Luo, S.; Wu, Y.; Lyu, J.; Yu, J. Reduced chemical fertilizer combined with bio-organic fertilizer affects the soil microbial community and yield and quality of lettuce. Front. Microbiol. 2022, 13, 863325. [Google Scholar] [CrossRef]
  42. Liu, X.; Zhang, Y.; Jiang, Z.; Yue, X.; Liang, J.; Yang, Q.; Li, J.; Li, N. Micro-moistening irrigation combined with bio-organic fertilizer: An adaptive irrigation and fertilization strategy to improve soil environment, edible Rose yield, and nutritional quality. Ind. Crop. Prod. 2023, 196, 116487. [Google Scholar] [CrossRef]
  43. Yang, Y.; Syed, S.; Mao, S.; Li, Q.; Ge, F.; Lian, B.; Lu, C. Bioorganic–mineral fertilizer can remediate chemical fertilizer-oversupplied soil: Purslane planting as an example. J. Soil Sci. Plant Nutr. 2020, 20, 892–900. [Google Scholar] [CrossRef]
  44. Gao, C.; El-Sawah, A.M.; Ali, D.F.I.; Alhaj Hamoud, Y.; Shaghaleh, H.; Sheteiwy, M.S. The integration of bio and organic fertilizers improve plant growth, grain yield, quality and metabolism of hybrid maize (Zea mays L.). Agronomy 2020, 10, 319. [Google Scholar] [CrossRef]
  45. An, R.; Jiang, S.; Li, H.; Qin, X.; Hu, X.; Chen, T.; Xie, C.; Xu, Y.; Dong, C.; Shen, Q. Effects of reduced chemical fertilizer with organic fertilizer application on growth, yield, quality and fertilizer utilization rate in Litchi. Soils 2021, 53, 1174–1184. (In Chinese) [Google Scholar]
  46. Francisco, J.G.r.-M.; Beatriz, R.-S.; Agustı’n, P.; Jalel, M.; Francisco, R.T.; Manuel, T. The plant-growth-promoting rhizobacteria Bacillus pumilus and Bacillus licheniformis produce high amounts of physiologically active gibberellins. Physiol. Plant. 2001, 111, 206–211. [Google Scholar]
  47. Wu, L.; Chen, J.; Wu, H.; Qin, X.; Wang, J.; Wu, Y.; Khan, M.U.; Lin, S.; Xiao, Z.; Luo, X.; et al. Insights into the regulation of rhizosphere bacterial communities by application of bio-organic fertilizer in Pseudostellaria heterophylla monoculture regime. Front. Microbiol. 2016, 7, 1788. [Google Scholar] [CrossRef]
  48. Xin, X.; Sun, Z.; Xiao, J.; Bai, W.; Zhang, Z.; Yan, H. Efficient utilization mechanism of soil moisture and nutrients with ridge film furrow seeding technology of sloping farmlands in semi-arid and rain-fed areas. Agriculture 2023, 13, 1940. [Google Scholar] [CrossRef]
  49. Wang, Y. The problem and measures for improvement on the synthetically quantitative appraisal method of radar chart. Stat. Educ. 2007, 1, 18–20. (In Chinese) [Google Scholar]
Figure 1. Mean monthly precipitation and temperature in the experimental site from 2021 to 2022.
Agronomy 14 01627 g001
Figure 2. Effects of different chemical fertilizer reductions combined with bio-organic fertilizer on leaf SPAD value of H. citrina. T0–T5 represent different chemical fertilizer reductions combined with bio-organic fertilizer (see details in Table 1). Vertical bars represent standard deviations. With each cultivar in the trial, vertical bars marked by the different letters are significantly different at p < 0.05 according to LSD testing.
Agronomy 14 01627 g002
Figure 3. Effects of different chemical fertilizer reductions combined with bio-organic fertilizer on leaf photosynthetic characteristics at the full-flowering stage of H. citrina. Pn, net photosynthetic rate; Tr, transpiration rate; WUE, water use efficiency. T0–T5 represent different chemical fertilizer reductions combined with bio-organic fertilizer (see details in Table 1). Vertical bars show standard deviations; different letters denote significant differences at p < 0.05 according to LSD testing.
Agronomy 14 01627 g003
Figure 4. Correlation coefficients between growth and yield parameters of H. citrina. PH, plant height; PW, plant width; LL, leaf length; LW, leaf width; SL, scape length; SD, scape diameter; FBL, floral bud length; FBD, floral bud diameter; SPAD, chlorophyll content; Pn, net photosynthetic rate; Tr, transpiration rate; WUE, water use efficiency; SN, scape number; FBN, floral bud number; FBW, floral bud weight; Y, yield. ** and * represent p < 0.01 and 0.05 according to Pearson correlation analysis, respectively.
Agronomy 14 01627 g004
Figure 5. Radar chart showing the overall performance of H. citrina yield and quality under different chemical fertilizer reductions combined with bio-organic fertilizer. All variables were normalized using division by their maximum value. SN: scape number; FBN: floral bud number per scape; FBW: floral bud weight; Y: yield of fresh floral buds.
Agronomy 14 01627 g005
Table 1. Fertilizer application rates to H. citrina in different growing periods (kg·ha−1).
TreatmentBasal DressingSide-Dressing at Seedling StageSide-Dressing at Bolting Stage
T0000
T1CF450CF375CF375
T2CF450 + BOF1200CF375 + BOF750CF375
T3CF360 + BOF1200CF300 + BOF750CF300
T4CF270 + BOF1200CF225 + BOF750CF225
T5CF180 + BOF1200CF150 + BOF750CF150
CF, chemical fertilizer; BOF, bio-organic fertilizer; the capital letters followed by numbers are the different levels of fertilizer input.
Table 2. Effects of various fertilization treatments on the growth index of H. citrina.
CultivarTreatmentPH
(cm)
PW
(cm)
LL
(cm)
LW
(cm)
SL
(cm)
SD
(cm)
FBL
(cm)
FBD
(cm)
2021
Taidong 6T045.7 e45.9 d33.6 e1.03 e35.4 d0.36 d9.49 a1.01 c
T154.2 b53.2 a47.0 a1.17 b44.9 a0.46 a9.63 a1.05 bc
T257.5 a53.3 a43.9 b1.22 a43.9 a0.43 b9.59 a1.10 a
T353.8 b50.3 b41.2 c1.16 b41.7 b0.40 c9.24 b1.09 ab
T451.7 c49.5 b38.9 d1.12 c38.9 c0.40 c9.19 b1.09 ab
T549.5 d48.6 c38.1 d1.08 d38.3 c0.38 cd9.00 c1.08 ab
ShibageT072.8 d62.8 d46.1 d1.32 d61.8 d0.46 d9.78 d0.76 c
T184.9 a75.9 b52.9 b1.46 b70.7 a0.51 c10.40 ab0.87 b
T283.2 ab80.8 a57.4 a1.51 a69.3 a0.59 a10.43 ab0.95 a
T381.1 b75.6 b54.2 b1.50 ab67.3 b0.56 ab10.58 a0.93 a
T478.2 c70.8 c52.5 bc1.42 c66.2 bc0.53 bc10.27 bc0.88 b
T576.6 c68.4 c50.5 c1.41 c65.3 c0.51 c10.13 c0.86 b
2022
Taidong 6T052.6 e52.4 d43.9 e1.17 d43.1 e0.42 d7.94 d0.76 d
T162.5 bc62.6 b55.5 cd1.25 c53.3 b0.53 a8.22 c0.85 c
T267.1 a68.5 a58.7 b1.30 b56.5 a0.54 a8.44 abc0.90 ab
T362.7 b67.0 a62.2 a1.36 a51.8 bc0.50 b8.57 ab0.90 a
T461.2 c63.3 b57.6 bc1.25 c51.1 c0.48 c8.67 a0.87 bc
T558.2 d58.6 c53.2 d1.22 c48.2 d0.47 c8.39 bc0.86 c
ShibageT085.3 d66.7 d47.3 d1.29 d83.7 e0.53 e8.49 d0.75 d
T1106.3 a77.1 b67.0 a1.44 a99.1 a0.61 ab9.26 ab0.79 c
T2105.4 a80.3 a68.8 a1.43 a98.7 a0.63 a9.22 ab0.83 ab
T397.8 b77.3 b62.6 b1.41 ab94.7 b0.59 c9.06 bc0.85 a
T494.0 c73.7 c58.6 c1.37 bc91.0 c0.60 bc9.34 a0.82 ab
T593.5 c72.3 c55.8 c1.35 c88.1 d0.56 d8.92 c0.81 bc
PH, plant height; PW, plant width; LL, leaf length; LW, leaf width; SL, scape length; SD, scape diameter; FBL, floral bud length; FBD, floral bud diameter. T0–T5 represent different chemical fertilizer reductions combined with bio-organic fertilizer (see details in Table 1). Different letters within the same column indicate significant differences (p < 0.05) according to LSD testing across the different treatments for each cultivar.
Table 3. Effects of different chemical fertilizer reductions combined with bio-organic fertilizer on yield and its components of H. citrina.
CultivarTreatmentSN
(Per Cave−1)
FBN
(Per Scape−1)
FBW
(g)
Y
(g·m−2)
2021
Taidong 6T00.8 c8.0 e2.60 c182.5 e
T12.0 b12.8 b2.87 a773.5 b
T22.8 a11.7 c2.84 ab987.3 a
T32.0 b14.7 a2.91 a896.3 a
T41.8 b11.3 c2.87 a625.3 c
T51.5 bc10.0 d2.75 b434.2 d
ShibageT01.8 b9.0 c2.69 d466.4 d
T13.2 a12.2 b2.95 b1194.5 abc
T23.0 a13.8 a2.94 b1281.0 ab
T33.2 a13.2 ab3.01 a1316.5 a
T42.8 ab12.7 ab2.85 c1074.1 bc
T52.7 ab12.3 ab2.84 c977.8 c
2022
Taidong 6T01.7 e8.7 d2.23 e341.9 e
T14.1 c14.8 a2.33 cd1483.1 b
T25.3 a13.2 b2.39 bc1749.2 a
T35.2 ab14.3 ab2.39 ab1868.1 a
T44.6 bc10.8 c2.45 a1284.8 c
T53.0 d10.0 cd2.31 d714.3 d
ShibageT01.4 d10.9 c2.62 c409.0 d
T13.6 ab13.8 ab2.97 b1553.4 b
T24.2 a13.2 b2.97 b1732.5 a
T34.0 a14.4 ab2.98 b1804.4 a
T43.0 bc15.4 a3.11 a1503.0 b
T52.6 c13.9 ab2.98 b1130.9 c
SN, scape number; FBN, floral bud number; FBW, floral bud weight; Y, yield. T0–T5 represent different chemical fertilizer reductions combined with bio-organic fertilizer (see details in Table 1). Different letters within the same column indicate significant differences (p < 0.05) according to the LSD test across the different treatments for each cultivar.
Table 4. Effects of different chemical fertilizer reduction combined with bio-organic fertilizer on quality of H. citrina.
CultivarTreatmentVC
(mg·g−1)
TF
(mg·g−1)
TA
(mg·g−1)
SS
(mg·g−1)
SP
(mg·g−1)
2021
Taidong 6T01.285 d0.611 d1.08 b18.54 e0.498 e
T11.434 b0.640 d1.318 a22.79 d0.537 cd
T21.554 a0.717 c1.028 bc26.03 b0.561 b
T31.456 b0.856 a0.970 c27.27 a0.588 a
T41.362 c0.766 b0.764 d24.02 c0.532 d
T51.335 cd0.689 c0.822 d24.04 c0.547 c
ShibageT00.919 d2.720 d1.131 c31.06 d0.329 c
T11.005 c3.137 bc1.421 a36.94 bc0.379 b
T21.210 b3.635 a1.274 b39.39 b0.387 b
T31.361 a3.674 a1.163 c44.35 a0.410 a
T41.346 a3.334 b1.099 c42.15 a0.387 b
T51.262 b3.062 c0.96 d34.49 c0.338 c
2022
Taidong 6T01.286 d0.336 d1.792 a19.11 c0.277 c
T11.387 c0.367 d1.564 b21.93 c0.536 ab
T21.795 a0.628 ab1.479 b38.67 a0.570 ab
T31.617 b0.556 bc1.365 c41.92 a0.607 a
T41.365 cd0.681 a1.337 c40.59 a0.505 b
T51.354 cd0.529 c1.308 c28.30 b0.353 c
ShibageT01.070 d2.893 d1.479 a57.19 d0.239 c
T11.492 b3.860 b1.337 b63.55 c0.458 b
T21.594 a3.857 b1.308 b67.56 bc0.593 a
T31.668 a3.888 b1.252 b68.89 b0.642 a
T41.243 c4.246 a1.308 b76.15 a0.431 b
T51.321 c3.465 c1.28 b66.52 bc0.314 c
VC, vitamin C; TF, total flavonoids; TA, total acid; SS, soluble sugar; SP, soluble protein. T0–T5 represent different chemical fertilizer reductions combined with bio-organic fertilizer (see details in Table 1). Different letters within the same column indicate significant differences (p < 0.05) according to LSD testing across the different treatments for each cultivar.
Table 5. Value of comprehensive assessment of different chemical fertilizer reductions combined with organic fertilizer on yield and quality of H. citrina.
CultivarTreatmentSiLiVi1Vi2YiRank
2021
Taidong 6T00.5684.3500.1810.3770.2616
T11.0024.9560.3190.5130.4053
T21.0804.8600.3440.5750.4451
T31.0835.0480.3450.5340.4292
T40.8134.5040.2590.5040.3614
T50.7254.4230.2310.4650.3285
ShibageT00.7923.8590.2520.6690.4116
T11.3444.5290.4280.8240.5944
T21.4804.7510.4710.8240.6232
T31.5624.7940.4970.8540.6521
T41.3444.5000.4280.8340.5973
T51.1464.2820.3650.7850.5355
2022
Taidong 6T00.6204.4030.1970.4020.2826
T11.3165.4840.4190.5500.4804
T21.6915.8180.5380.6280.5812
T31.7085.8570.5440.6260.5831
T41.2854.8750.4090.6790.5273
T50.8334.1920.2650.5960.3975
ShibageT00.9694.5830.3090.5800.4236
T11.9515.1800.6210.9140.7533
T22.2105.4530.7030.9340.8102
T32.3185.6510.7380.9120.8201
T41.9805.5040.6300.8210.7204
T51.5394.9550.4900.7880.6215
Si, Li, Vi1, Vi2, and Yi denote the average area of radar chart, the average perimeter of radar chart, the relative area radar chart, the inhomogeneity degree of all parameters of radar chart and comprehensive evaluation index, respectively. T0–T5 represent different chemical fertilizer reduction combined with bio-organic fertilizer (see details in Table 1).
Disclaimer/Publisher’s Note: The statements, opinions and data contained in all publications are solely those of the individual author(s) and contributor(s) and not of MDPI and/or the editor(s). MDPI and/or the editor(s) disclaim responsibility for any injury to people or property resulting from any ideas, methods, instructions or products referred to in the content.

