Article

Design and Test of Novel Uniform Application Equipment with Nozzles Swinging Horizontally Used for UAVs

1
College of Engineering, Huazhong Agricultural University, Wuhan 430070, China
2
Key Laboratory of Agricultural Equipment in Mid-Lower Yangtze River, Ministry of Agriculture and Rural Affairs, Wuhan 430070, China
*
Author to whom correspondence should be addressed.
Agronomy 2024, 14(8), 1631; https://doi.org/10.3390/agronomy14081631
Submission received: 17 May 2024 / Revised: 10 July 2024 / Accepted: 21 July 2024 / Published: 25 July 2024

Abstract

:
Given the problems such as insufficient control on pests and diseases or pesticide damage on plants caused by uneven distribution of pesticide droplets during the current application process by UAVs, this paper designed novel uniform application equipment with nozzles swinging horizontally based on a UAV platform in order to improve the distribution uniformity of droplets volume. Nozzles swinging periodically are able to increase the overlap probability of spray fans generated from nozzles. It is helpful to further the spray deposition uniformity improvement. Through droplet motion analysis, CFD simulation, and spray tests, it was determined that the key factors affecting uniformity were the oscillating rod length, spray height, and nozzle angle. The best parameter combination was explored as the length of 175 mm, the height of 1.5 m, and the angle of 15°. Based on this combination, the prototype was produced and installed on the UAV platform. A field test was carried out to verify its performance. The results showed that the CV of the improved UAV was 26.41%, which was 6.43 percentage points lower than the traditional UAV, and the decrease was 19.58%, meaning that it is feasible to use this equipment to improve uniformity.

1. Introduction

Diseases, pests, and weeds are important factors affecting the safety and effective supply of crops. Currently, the main method to control them is spraying chemical pesticides with plant protection machinery [1,2]. However, when efficient ground-based agricultural machinery such as large boom sprayers [3,4,5] or orchard air-assisted sprayers [6,7,8] are applied in environments such as paddy fields, hills, mountains, or small plots, there are challenges such as low efficiency and difficulty in reaching certain areas [9]. In comparison, plant protection UAVs, with their advantages of high operational efficiency, ability to traverse different terrains, and effective pest control, have become an important means of crop protection in China [10,11].
Compared to ground-based agricultural machinery, agricultural drones spray at higher altitudes, typically within the range of 1 m to 3 m [12]. When using a hydraulic flat-fan nozzle for spraying, the distribution of pesticide droplets within the target plane is less uniform compared to traditional sprayers. Non-uniform distribution of the droplets during the crop protection process can seriously affect the effectiveness of pesticides, and the uniformity of droplet deposition within the canopy is significantly correlated with pest control effectiveness [13]. Therefore, improving the uniformity of droplet deposition is necessary for UAVs [4]. By far, researchers have proposed several methods to enhance the uniformity of droplet deposition by agricultural drones, including adjusting operational parameters [14,15,16,17], optimizing flight paths [18,19,20,21], and rationally arranging nozzles [22,23,24]. Inspired by the reciprocating cutters of combine harvesters [25,26,27], we designed a novel uniform spraying device for drone platforms. This device swings nozzles horizontally and periodically to increase the overlap probability of spray sheet trajectories, thereby addressing the issue of uneven distribution of spray within a single spray swath and further improving the uniformity of droplet deposition along the direction that is perpendicular to the flight direction and referred to as lateral distribution.
In this paper, the design of this device was introduced, and mechanical modeling, CFD simulation, and spray experiments were conducted to analyze key factors affecting droplet deposition distribution, explore the optimal parameter combinations for uniform distribution, and provide a research foundation for the development of efficient agricultural drones.

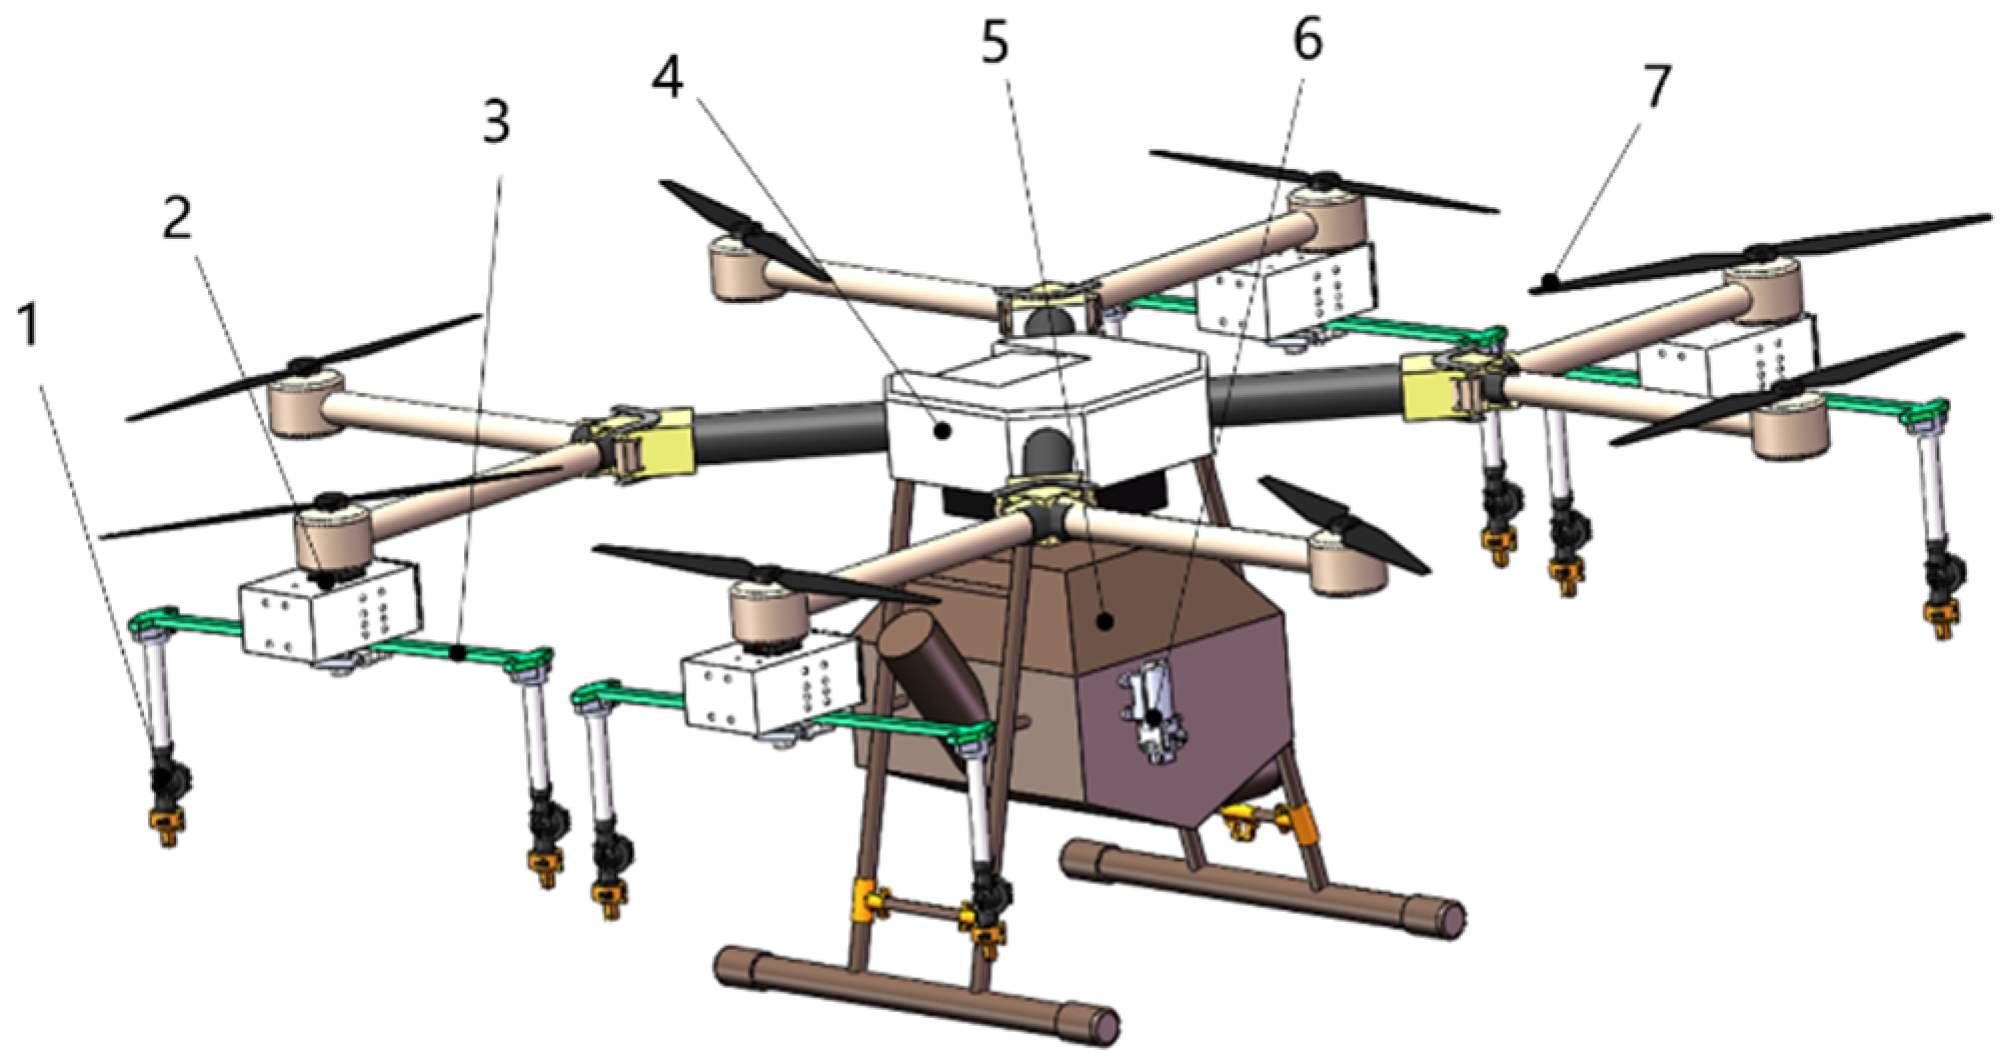
2. Machine Structure and Working Principle

In this paper, periodic reciprocating swinging nozzles were employed to increase the overlap probability of spray sheet trajectories, enabling mutual compensation of droplet quantities at different moments and different fans in space. Consequently, it enhanced the uniformity of lateral droplet distribution on the target plane. The uniform spraying device with horizontally swinging nozzles designed in this article is mainly used for UAV platforms. It mainly consists of four major parts: a swinging device, a spraying device, a control system, and a quick detachable device, as shown in Figure 1.
The quick detachable device adopts a pull-type hooking structure to achieve fast assembly of the spraying device with different types of UAVs, facilitating folding for transportation. The spraying device mainly consists of a tank, pump, tubing, pressure-regulating valve, nozzle body, and nozzles. The hardware composition of the control system is shown in Figure 2, consisting of a DC motor, motor drive module, GPS module, PWM speed controller, diaphragm pump, remote controller, receiver, flow meter, and 12 V lithium battery. The control system was mainly used for adjusting the motor speed of the swinging device and the flow rate of the pump. The swinging device is the core component, used to drive the nozzle for periodic reciprocating swinging.

3. Design of Key Component

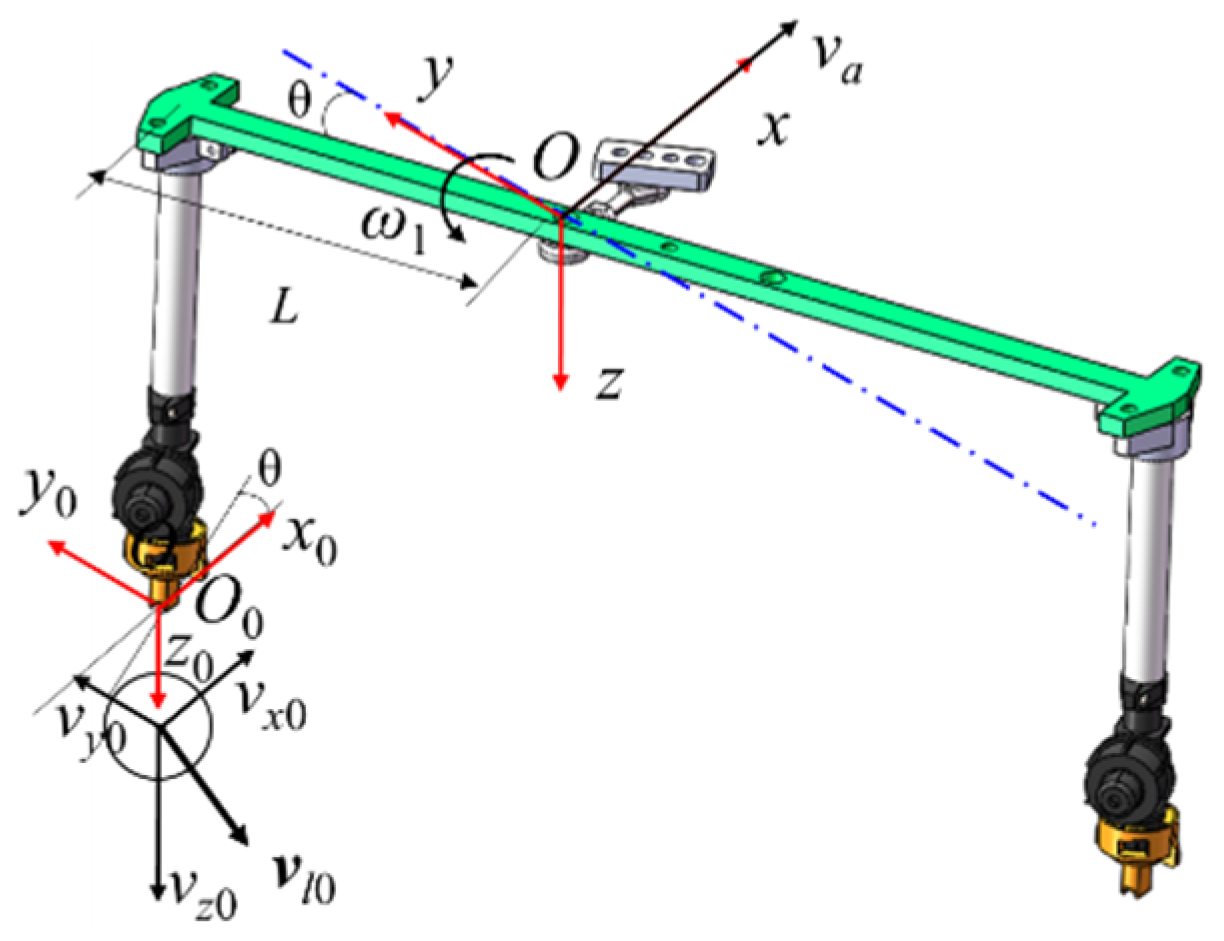
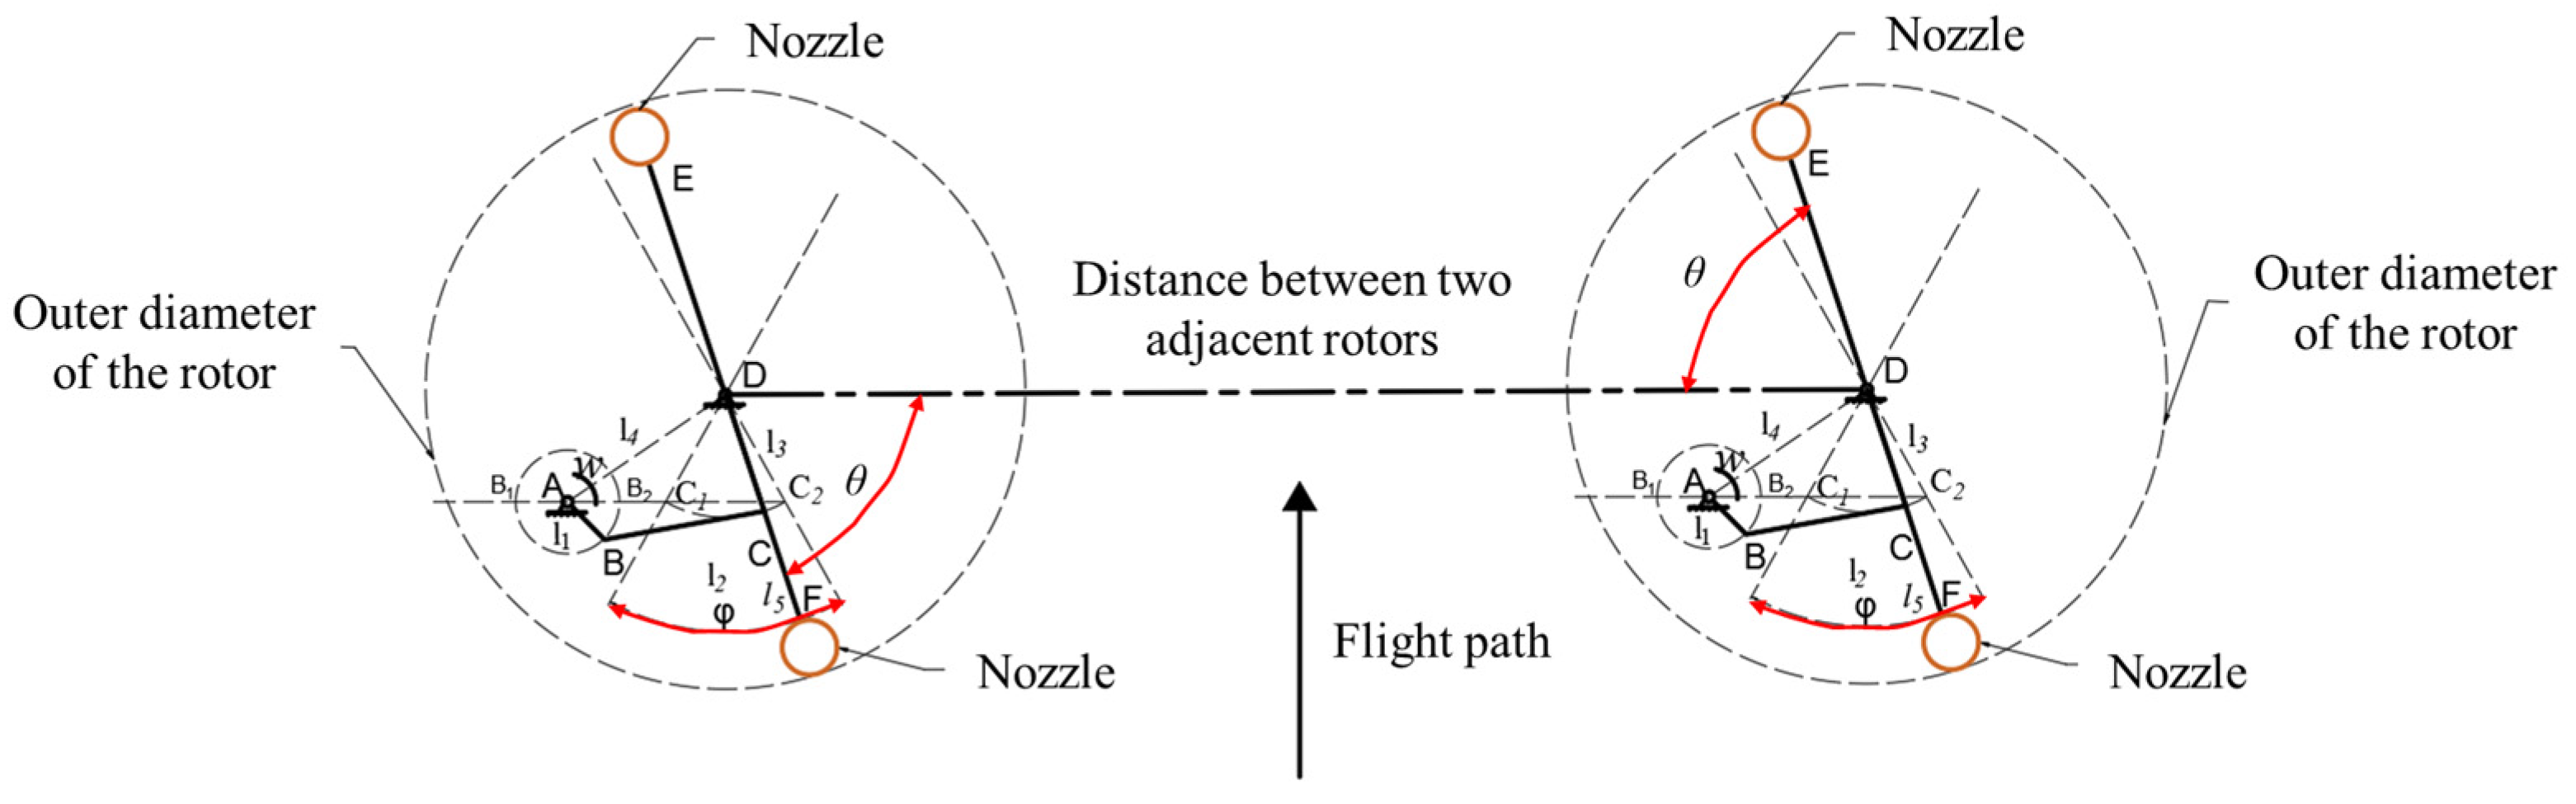
3.1. Structural Design of the Swinging Device

UAVs operate at high altitudes and experience significant inherent vibration frequencies during flight [28]. To ensure the safety of UAV operations by stabilizing mechanical motion, the mechanism should exhibit non-sudden return characteristics. In this study, a non-sudden return characteristic crank-rocker mechanism was employed for the swing mechanism, which could avoid problems such as slow speed strokes leading to the omission and fast speed strokes leading to excessive spraying caused by different average speeds during the back-and-forth motion. The swing mechanism mainly consists of a motor, diamond bearing seat, vertical bearing seat, housing, cylindrical pin, connecting rod, oscillating rod, crank, nozzle body, and pipe clamp. The overall structure and photo are shown in Figure 3, and a schematic diagram of the mechanism is shown in Figure 4. The crank was connected to the motor via a threaded connection, where the distance from the installation hole B to the motor center A was the length of the crank AB, i.e., l1. The connecting rod BC was connected to the crank via internal and external screws of a ball joint bearing at point B and connected to the oscillating rod CF at point C. The length of the connecting rod BC was l2. The center point D of the rod EF, where the oscillating rod was located, was fixed to the housing via cylindrical pins connected to the diamond bearing seat and vertical bearing seat. The nozzle body was fixedly connected to both ends of the oscillating rod via pipe clamps. The entire equipment includes four sets of oscillating devices with identical configurations.
The swing mechanism used in this study could transfer the motion mode from the motor rotation to nozzles oscillating. The oscillating rod, serving as an intermediate support component connected to the nozzle body, directly influenced the motion laws and trajectories of the nozzle based on its length and installation position. During motion, the oscillating rod reached two extreme positions, and the angle of its sweep was referred to as the swing angle. When the crank reached the extreme positions AB1 and AB2, with the crank angle between extreme positions of 0° and the stroke speed ratio coefficient of 1, points B1, A, B2, C1, and C2 lay on a straight line parallel to the side of the housing. This arrangement ensured that the oscillating rod moved at the same angle along the left and right directions to meet the motion requirements.

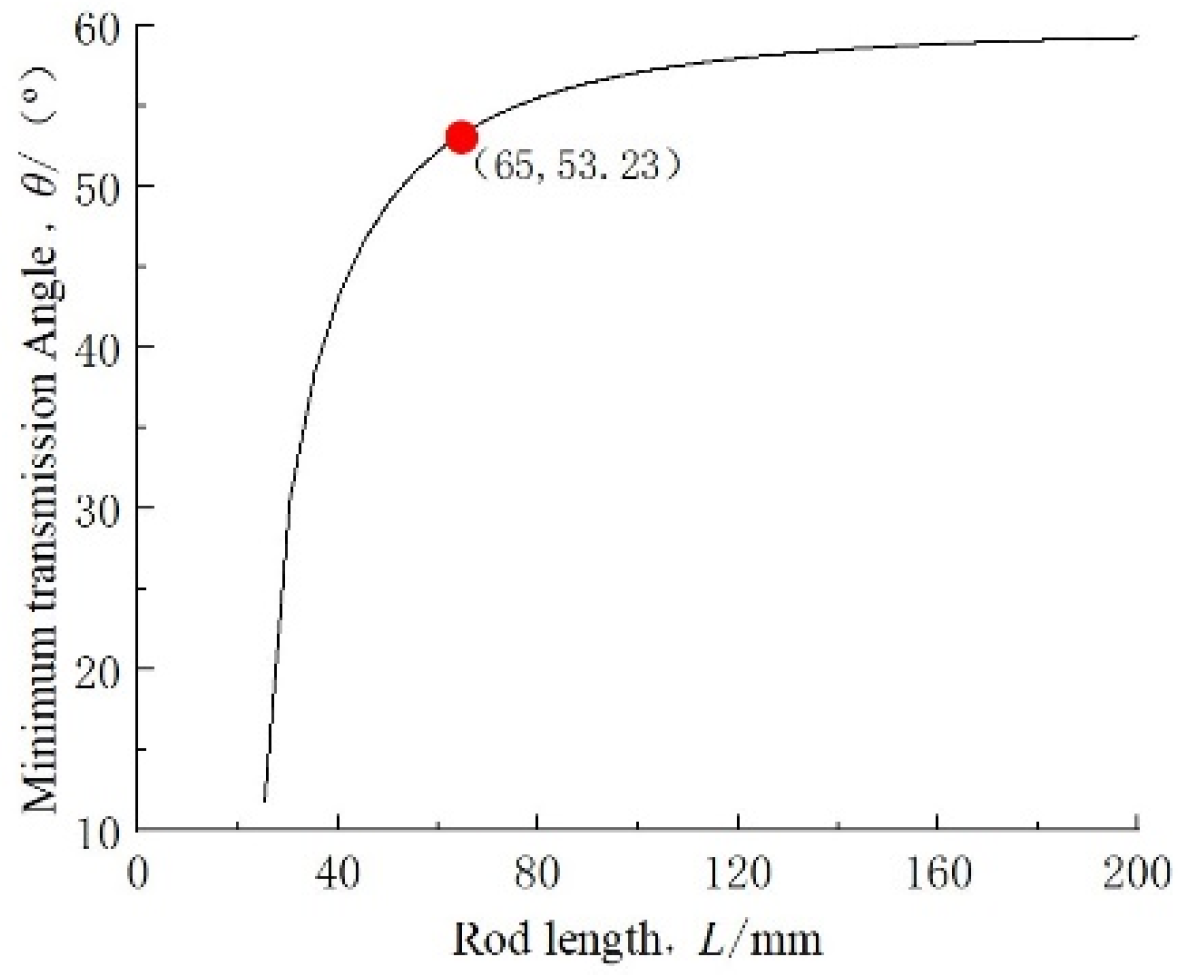
3.2. Dimensional Design of the Oscillating Device

According to the design principles of the non-sudden return crank-rocker mechanism [27], Equation (1) was obtained. Considering the flexibility of the device during operation, as well as its lightweight and structural strength, l1 was taken as 20 mm in this study. According to the “Handbook of Agricultural Machinery Design”, the swing angle of swing-type seeders is typically between 30° and 60°. During motion, a larger swing angle led to a wider swinging range, which increased the likelihood of omission; conversely, a smaller swing angle reduced the visibility of swinging, resulting in minimal changes in spray uniformity and thus negligible effects. Therefore, a swing angle of 50° was chosen, and the length of CD, denoted as l3, was calculated as 20 mm from Equation (1).
l 1 2 + l 4 2 = l 2 2 + l 3 3 sin φ 2 = l 1 l 3 l e n g t h   o f   t h e   l o n g e s t   r o d + l e n g t h   o f   t h e   s h o r t e s t   r o d l e n g t h   s u m   o f   o t h e r   t w o   r o d s l 3 + l 5 r a d i u s   o f   t h e   r o t o r
In the linkage mechanism, the transmission angle γ is used to measure the transmission performance of the mechanism. A larger value indicates better transmission performance. By introducing the functional relationship of the minimum transmission angle γmin from Equation (2) into the Origin 2021 software, the result was shown in Figure 5, telling that the γmin gradually increased and then stabilized with the increase in the connecting rod length l2. l2 was chosen as 65 mm in this study, resulting in a γmin of 53.23°, which satisfied the requirement of being greater than the allowable transmission angle [γ] of 50° [29]. According to Equation (2), the length AD, denoted as l4, was calculated as 77 mm.
γ = arccos l 1 l 4 l 2 l 3 l 4 = 1809 + l 2 2 γ min = arccos 1809 + l 2 2 2 l 2
Figure 5. Relationship between the length of connecting rod and the minimum transmission angle.
Agronomy 14 01631 g005

3.3. Parameters Affecting the Performance of the Uniform Application Equipment

The oscillating device was the core component of the uniform application equipment, and its structure and operating parameters could affect the uniformity of droplet distribution. To identify the key factors affecting droplet deposition distribution, the authors conducted a motion analysis of droplet settling.
Droplets settle in the air in three-dimensional space. To understand the motion of droplets, a right-handed coordinate system, Oxyz, was established with the center of the oscillating rod as the origin, O, as shown in Figure 6. The direction of UAV flight was taken as the positive x-axis direction. The direction perpendicular to the flight direction and away from the nozzle was taken as the positive y-axis direction. The vertical downward direction was taken as the positive z-axis direction. Simultaneously, an auxiliary right-handed coordinate system was established with the center of the nozzle hole as the origin O0. The vertical downward direction was taken as the positive z0-axis direction. The two symmetric axes of the cross-section of the nozzle hole were defined as the x0-axis and y0-axis. The axis along the direction of UAV flight at the initial position was taken as the x0-axis, and it was positive in the same direction as the flight. The axis perpendicular to it was the y0-axis, and it was positive away from the nozzle. The rotation of the motor in the uniform application equipment drove the oscillating rod to swing periodically, causing the initial velocity of droplets in this equipment to differ from that of droplets in traditional equipment whose nozzles were fixed. The initial velocity of droplets in this equipment, denoted as vl0, was expressed as shown in Equation (3).
v l 0 = ( v x 0 cos θ v y 0 sin θ + v a ω 1 L sin θ ) 2 + ( v x 0 sin θ + v y 0 cos θ + ω 1 L cos θ ) 2 + ( v z 0 ) 2
where ω1—angular speed of the oscillating rod is directly related to motor speed n, with the unit of rad·s−1.
v x 0 , vy0, vz0—the initial velocities in the x, y and z directions of droplets generated from the traditional equipment, with the unit of m·s−1.
v a —the UAV speed relative to air, with the unit of m·s−1.
L—the length of the oscillating rod, L = l3 + l5, with the unit of mm.
θ—the nozzle angle, that is, the angle between the long axis of the nozzle orifice and the lateral direction when the nozzle swings horizontally around a plumb line, and the nozzle angle was positive while it was opposite to the motor rotation direction, with the unit of °.
Figure 6. Schematic diagram of droplet velocity. Note: The thin-dot-dash line is a horizontal line connecting two transversely distributed adjacent rotor axes.
Agronomy 14 01631 g006
Combining the droplet velocity model established by Miller et al. [30], i.e., v d = v l 0 e λ h , the velocity of droplets, denoted as vd, ejected by the swing spraying device at a distance h, which was the distance from the nozzle orifice to the position of liquid film rupture into droplets, was directly related to the droplet diameter d and the momentum relaxation coefficient λ [30,31]. In order to better express the formula, physical quantities with the same physical meaning were unified into the same physical symbol. Thus, it was observed that the motor speed n, nozzle angle θ, oscillating rod length L, spray height H, droplet diameter d, and flight speed va all affected droplet velocity vd, altering the axial motion state of droplets and consequently influencing droplet deposition distribution.

4. Parameter Optimization of the Oscillating Device

To further enhance the performance of the uniform application equipment, computational fluid dynamics (CFD) simulation and indoor spray tests were conducted to determine the significant effects of various structural and operating parameters of the swing mechanism on droplet deposition distribution uniformity. Subsequently, parameter optimization was performed on the key factors identified.

4.1. Single-Factor Analysis of the Influence of Parameters on the Droplet Deposition Patterns Using CFD Simulation

4.1.1. Simulation Model and Parameter Settings

Fluent 19.2 software (ANSYS, Inc., Canonsburg, PA, USA) was utilized to conduct two-phase flow simulations of the motion in space and deposition of droplets ejected by a single oscillating device. The computational domain was a rectangular prism measuring 3 m × 2 m × 2 m, filled with air, with a total of 187,500 grids. The discrete phase method (DPM) model was employed to simulate the droplet settling process in air [32]. Water parameters at room temperature were used to represent pesticides in the discrete phase, with a density of 998.2 kg·m−3, viscosity of 0.00103 Pa·s, and a surface tension of 0.072 N·m−1. The flow condition adopted the Standard k-ε turbulence model, and the nozzle model adopted a flat fan nozzle model. Considering the realism of the droplet descent process, the atomization breakup model utilized the linearized unstable liquid film atomization model, and the droplet collision secondary breakup model adopted the TAB (Tayler-Analogy-Breakup) model [33]. According to the results of pre-tests for the oscillating device, we found that the device shook obviously when the motor speed was higher than 240 r·min−1. While the speed was slower than 100 r·min−1, the device did not swing nozzles well. Therefore, the motor should work at a speed of 100 r·min−1–240 r·min−1. In this simulation, a middle speed of 170 r·min−1 was selected for the motor. The angular velocity of the nozzle was shown in Figure 7. The angular velocity curve was obtained after the movement simulation using the MSC ADAMS 2020 software (Hexagon A B, Stockholm, Switzerland). The swing of a nozzle causes the spray fan to appear in different positions at different times. To simulate that, we set 21 injections for each nozzle on its motion trajectory, shown in Figure 8. The boundary conditions and wall conditions for discrete phase were shown in Table 1.
The simulation used unsteady-state modeling, with gravity direction aligned with reality and the gravitational acceleration set to 9.8 m·s−2. The convergence criterion was set to 10−5. For transient calculations, the time step was set to 0.005 s, with a total of 1000 time steps, and a maximum of 20 iterations per time step. The simulation duration was 5 s. To allow sufficient time for the dispersed-phase particles to collide or combine in the air after spraying, a delay of 4 s was introduced after the spraying. Afterward, the position information of all particles within the sampling surface was collected for statistical analysis.

4.1.2. Methods of Simulation Experiments

To investigate the lateral distribution characteristics of the droplet deposition during the operation of a single swing mechanism and the influence of individual factors on droplet distribution, single-factor simulation experiments were conducted with the oscillating rod length (L), nozzle angle (θ), and spray height (H) as factors. The values of the single factor being examined were varied, while the other factors were set to the middle values of their respective ranges. The ranges of all parameters were determined by pre-tests and ADAMS motion simulations. The levels of each factor were shown in Table 2.
The deposition area on the ground was divided into grids with a size of 4 cm × 4 cm for each cell, resulting in a statistical area with 50 rows longitudinally and 75 columns laterally, as illustrated in Figure 9. Using the amount of droplet deposition as the index, the study investigated the influence of each individual factor on the lateral distribution of droplet deposition.

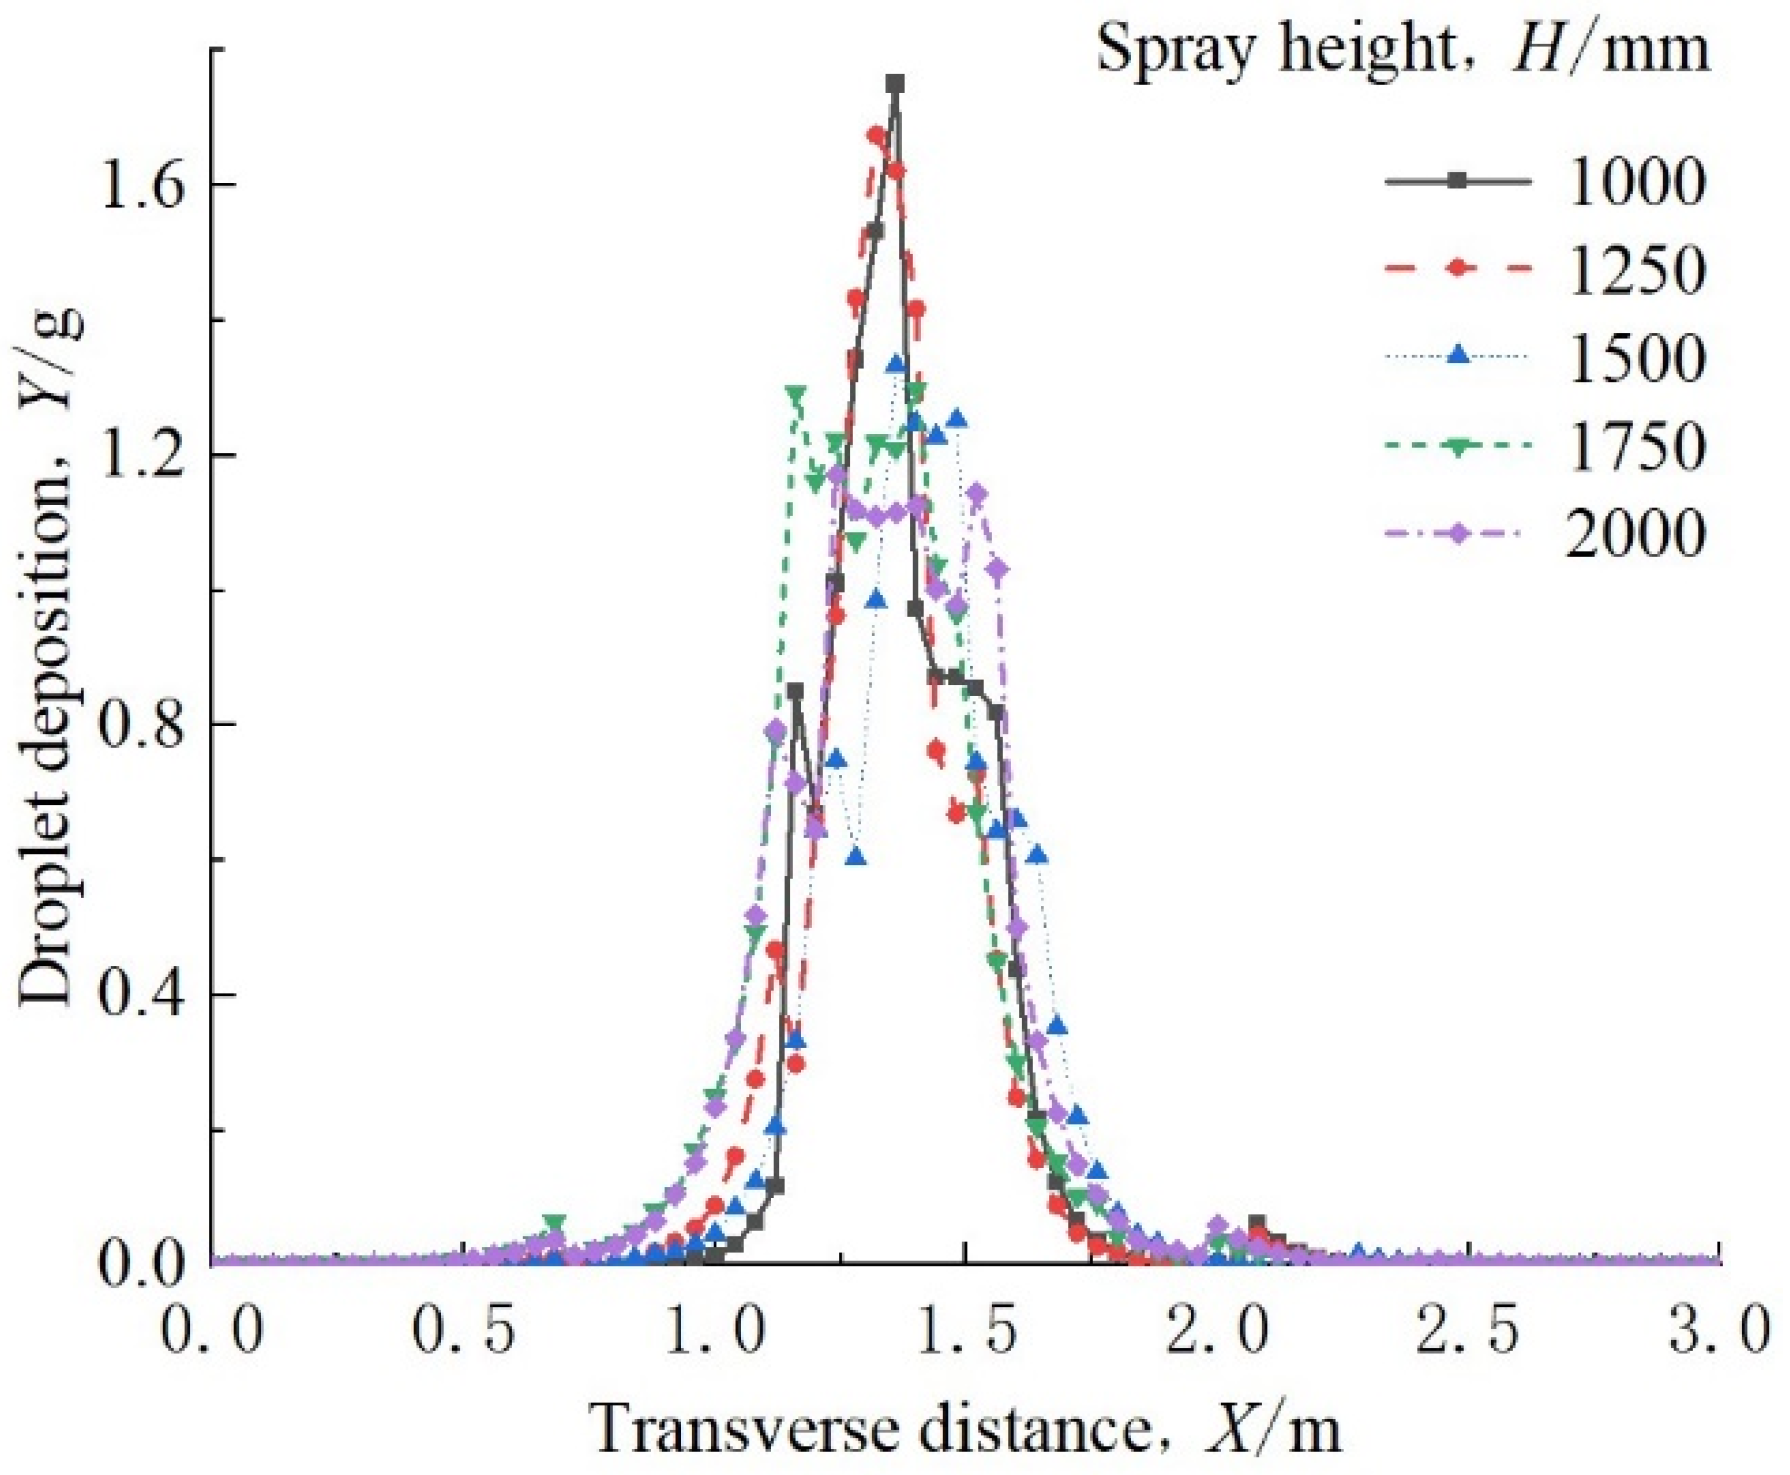
4.1.3. Results and Analysis of the Single-Factor Simulation Experiments

When H was set to 1.5 m and θ was set to 0°, the lateral distribution of droplets under different oscillating rod lengths was depicted in Figure 10. It was observed that the lateral distribution varied with different lengths. When L was relatively short, the droplet distribution was more concentrated, resulting in a higher peak. As L increased, the deposition distribution curve generally transitioned from a pyramid shape to a trapezoid shape and then to an “M” shape, with the peak gradually decreasing. The reason for this phenomenon may be that when L was short, the swinging area was limited, and the swinging phenomenon was not significant. Conversely, when L was long, the distance between the nozzle and the swing rod end increased, leading to excessive droplet deposition at the two ends. Therefore, the L was set within the range of 90 mm to 190 mm in subsequent experiments, to achieve good uniformity of deposition.
With L set to 140 mm and H set to 1.5 m, the transverse distribution of droplets under different nozzle angles is depicted in Figure 11. As θ increased, the peak of droplet deposition gradually shifted from the left side to the right side. According to Equation (3), θ affected droplet velocity and thus had a significant impact on spraying position. However, when the absolute value of θ was too large, the probability of droplet collision increased, leading to an increase in droplet size, which was not conducive to crop protection. Therefore, this study selected the range of θ to be between −15° and 15°.
With L set to 140 mm and θ set to 0°, the transverse distribution under different spray heights is depicted in Figure 12. It was shown that as the spray height increased, the peak of droplet deposition gradually decreased, and the range of droplet distribution expands. However, after increasing to a certain value, the optimization effect of H on droplet distribution uniformity became smaller than the effect of droplet evaporation and drift caused by the increase in height. As a result, H was chosen from the range of 1 m to 2 m in the subsequent experiments.

4.2. Optimization of the Oscillating Device Structure and Operating Parameters

4.2.1. Experimental Method and Equipment

To further investigate the influence of structural parameters L, θ, and operating parameter H on the spray performance of the uniform application equipment and to optimize the parameters, a secondary regression orthogonal test was conducted. The experiment was carried out using a self-built spray test stand, as shown in Figure 13. The test stand consisted of a tank, an air compressor, air delivery tubes, liquid delivery tubes, a pressure regulator, a pressure gauge, oscillating devices, nozzle bodies, and a V-shaped droplet collecting device. The droplet collector was 1.5 m × 3 m, with 25 troughs in total. The space between two adjacent troughs was 120 mm. The collector was tilted 15° relative to the horizontal plane, facilitating the collection and flow of droplets into graduated cylinders. The experiment was set with a spray pressure of 0.3 MPa, a motor speed of 170 r·min−1 for the oscillating device, and a nozzle type of IDK120-01 made by Lechler GmbH, Mezingen, Germany, given that the IDK nozzles have good anti-drift performance as mentioned in references [34,35,36]. Before the experiment, the swing spray device was installed directly above the droplet collector, and cylinders were used as receivers. Each trough was assigned a number of 1, 2, 3, …, 25. The duration of each spray was 1 min, followed by a 3 min wait after spraying to ensure that all water from the troughs flowed into the cylinders. The mass of water collected in each cylinder was recorded sequentially according to the numbering. The experimental index, the coefficient of variation (CV) of lateral droplet deposition uniformity within the effective spray width, was calculated using Equation (4). Based on the range of values for L, θ, and H obtained from Section 4.1.3, a response surface analysis experiment plan was designed by Design-Expert 13.1 software (Stat-Ease Inc., Minneapolis, MN, USA), according to the Box–Behnken principle, with 3 factors and 3 levels, resulting in a total of 17 experiments. The encoding of each factor was shown in Table 3, and each experimental group was repeated three times.
C V = i = j k X i X ¯ 2 / k j 1 X ¯ × 100 %
where Xi—the measured value of the ith sample, i = j, j + 1, j + 2, ……, k, with the unit of g. j, j + 1, j + 2, … …, k were the label numbers of samples collected in the effective spray width which was determined by the method of 50% effective deposition stipulated in reference [37].
X ¯ —The mean of all sample measurements, with the unit of g.
Figure 13. Schematic diagram of the spraying test platform for parameter optimizing. 1. Air compressor. 2. Gas tube. 3. Tank. 4. Switch. 5. Pressure regulating valve. 6. Pressure gauge. 7. Liquid pipe. 8. Support frame. 9. Oscillating device. 10. Nozzle body. 11. Droplet collecting device. 12. Graduated cylinder.
Agronomy 14 01631 g013
Table 3. Factors and coding of experiments for optimizing parameters.
CodeL/(mm)θ/(°)H/(m)
−190−151
014001.5
+1190152

4.2.2. Results and Analysis of Parameter Optimization Experiments

The CV results of lateral droplet deposition uniformity within the effective spray width are presented in Table 4. The results of the variance analysis are shown in Table 5.
The variance analysis, as shown in Table 5, indicated that the regression model was extremely significant p < 0.01 and the lack-of-fit test was not significant. The factors θ, H, and the square term H2 had an extremely significant impact on the CV value, p < 0.01, while L and the interaction term θH had a significant impact on the CV value, 0.01 < p < 0.05. The remaining terms had no significant impact on this experimental index p > 0.05. The main order of the influence of each factor on the CV was as follows: θ, H, and L. After eliminating non-significant terms, the quadratic regression equation between each factor and the CV was obtained, as shown in Equation (5). The fitted value of CV was denoted as Y1, with an R2 of 0.9681, indicating a high degree of fitting.
Y1 = 22.54 − 1.66L − 2.74θ − 2.29H − 1.64θH + 7.72H2
In order to visually analyze the influence of interaction effects between factors on the CV, one factor was fixed at the middle level, and response surface analysis was used to investigate the impact of the other two factors on the CV, as shown in Figure 14.
When H was set to 1.5 m, the interaction effect between θ and L on the CV of deposition was depicted in Figure 14a. When L was fixed, as θ increased, the CV gradually decreased. Similarly, when θ was fixed, as L increased, the CV gradually decreased, but L should not be excessively large considering the diameter of the UAV rotor.
When θ was set to 0°, the interaction effect between H and L was illustrated in Figure 14b. When L was fixed, the CV first decreased and then increased with increasing H. Conversely, when H was fixed, the CV gradually decreased with increasing L.
When L was 140 mm, the interaction effect between θ and H was shown in Figure 14c. When θ was fixed, the CV first decreased and then increased with increasing H, with the optimal value of H being in the middle. Conversely, when H was fixed, the CV gradually decreased with increasing θ.
To obtain the optimal parameter combination for a single oscillating spray device, optimization analysis was conducted using Design-Expert 13.1 software with the minimum CV in deposition as the objective. The optimal parameter combination obtained was: L of 175 mm, θ of 15°, and H of 1.5 m. At this point, the predicted result was 19.88%. To verify the reliability of the optimization results, validation experiments were conducted using the optimized parameters and repeated three times. The average result was 21.14%, with a relative error of 6.34% compared to the predicted value. The small error indicated that the regression model was accurate and reliable.

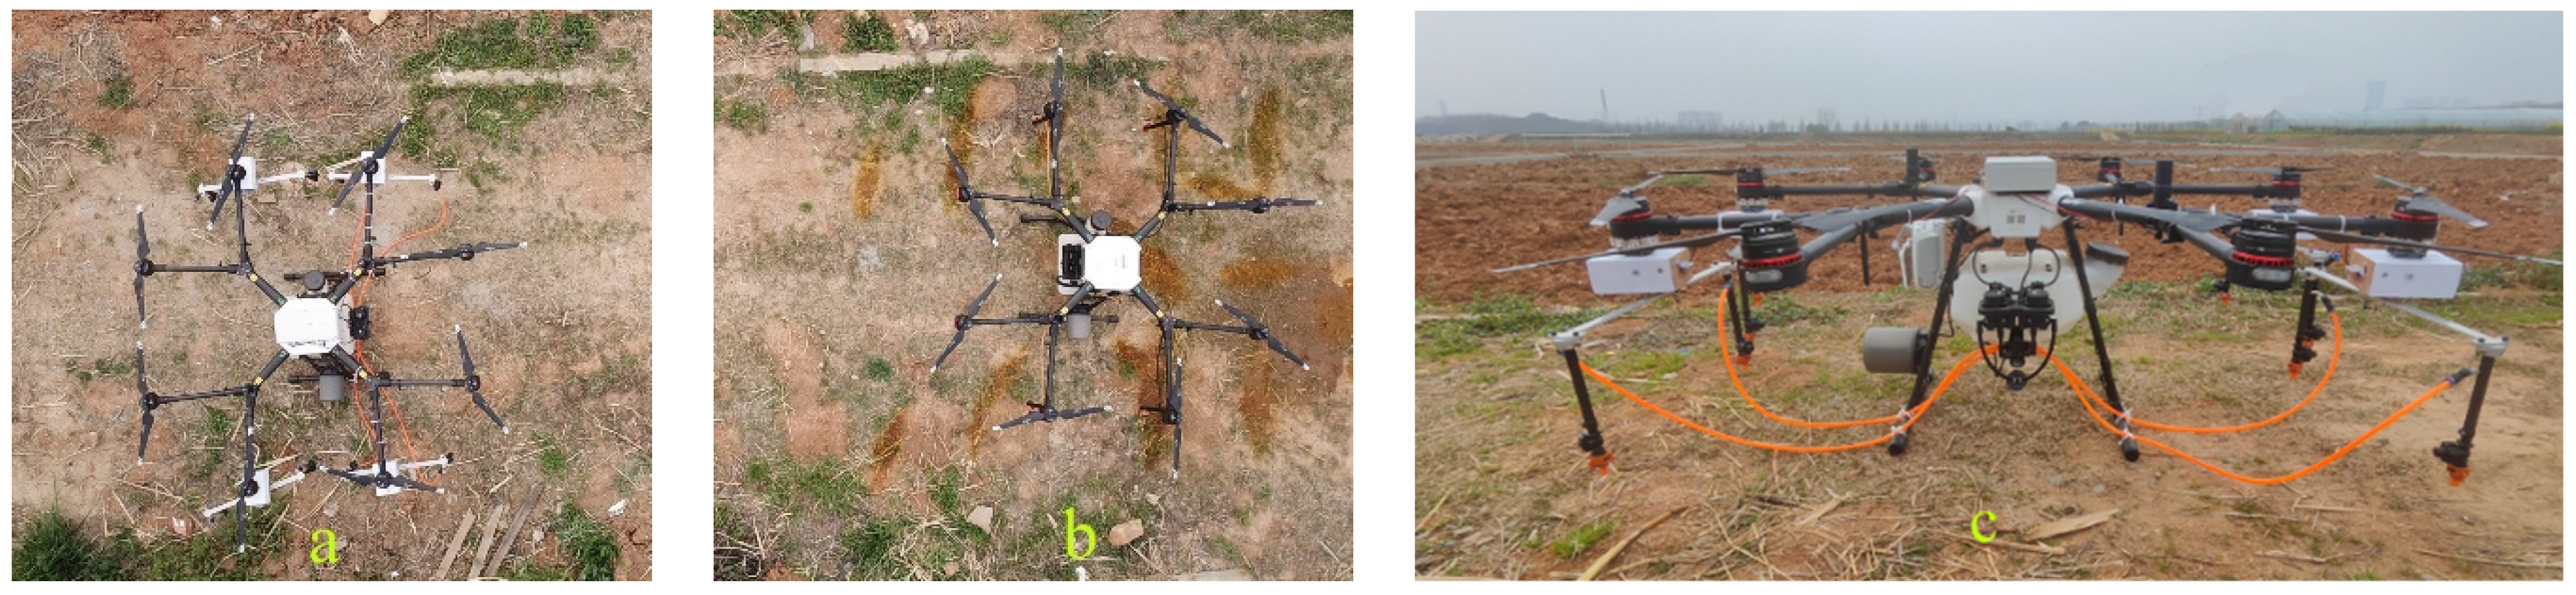
5. Comparative Experiments in the Field

Based on the optimal parameter combination determined in Section 4.2.2, the prototype of the uniform application equipment with nozzles swinging horizontally was manufactured. To verify the actual effect of the droplet deposition distribution, a field comparative experiment was conducted. The equipment was installed on the existing UAV of our lab, whose model was DJI MG-1P (Shenzhen Dajiang Innovation Technology Co., Ltd., Shenzhen, China). As shown in Figure 15a,c, four oscillating devices were installed symmetrically in four positions to ensure the stable operation of the UAV. Each oscillating device’s oscillating rod center coincided with the rotor center. During the experiment, the four nozzles of the two adjacent oscillating devices along the lateral direction were opened, while another pair of oscillating devices served only as counterweights and did not open the nozzles. The experiment was conducted on 8 March 2023, in a small experimental field on campus. The average temperature during the experiment was 22.3 °C, the relative humidity was 67%, the environmental wind speed was 1.1 m·s−1, and the wind direction was southeast. In order to know the performance of the uniform equipment, the original UAV with nozzles fixed was tested with the same operating parameters and environmental conditions. Each case was tested three times.

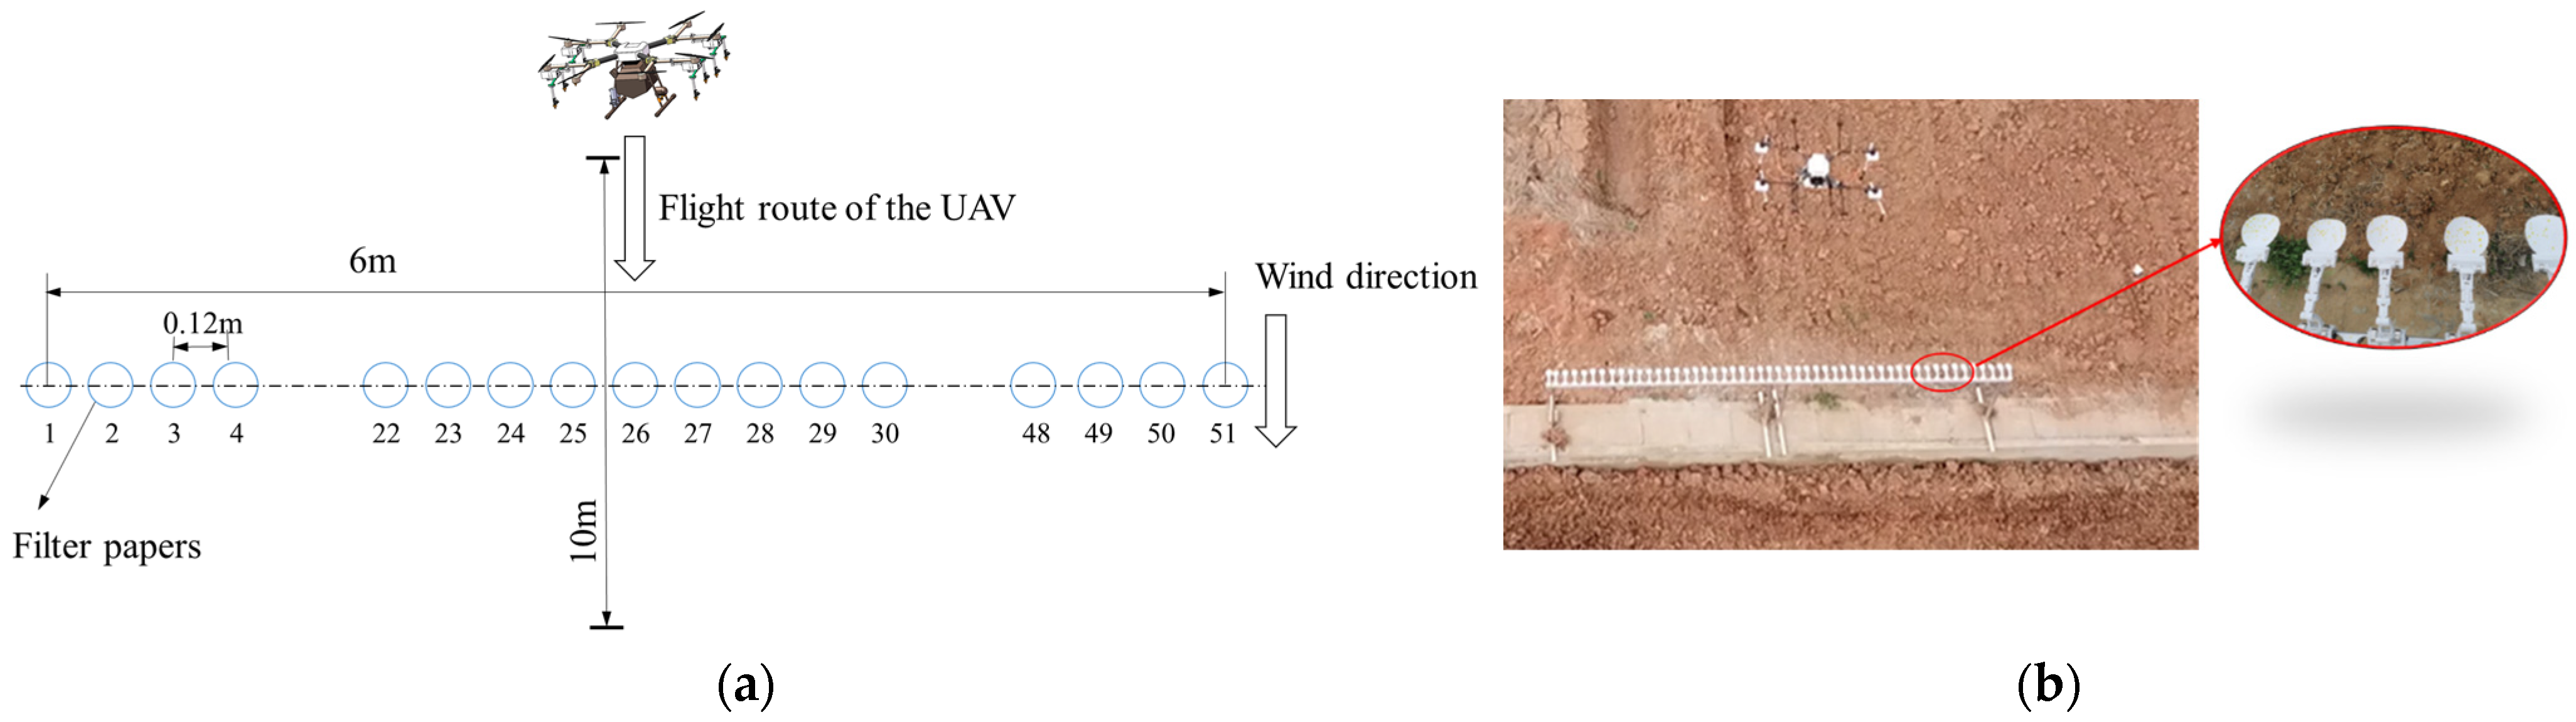
5.1. Experimental Method and Equipment

The spraying parameters used in the experiment were consistent. The nozzles used were IDK120-01. The spraying height was set at 1.5 m, the flight speed was 3 m·s−1, and the spraying pressure was maintained at 0.3 MPa. During spraying, there were 4 nozzles spraying for each test.
The experiment was carried out on a vacant field. The field was 30 m × 40 m. Buffer zones for acceleration and deceleration were set at both ends of the flight route, each measuring 15 m. The 10 m section in the middle was designated for sampling and was sprayed by the UAV flying at a constant speed. The sampling width was 6 m, and qualitative filter papers with a diameter of 7 cm were arranged at sampling points. The sampling points were spaced at intervals of 0.12 m, totaling 51 positions. All sampling points were at the same height. The arrangement of sampling points is illustrated in Figure 16. To minimize the influence of ground effects caused by rotor airflow, the filter papers were fixed to aluminum alloy target frames with T-shaped magnets at a height of 1 m above the ground.
Tartrazine dye produced by Shanghai Dyestuffs Research Institute Co., LTD (Shanghai, China) was used as a tracer. Its aqueous solution was prepared as the spraying solution with a concentration of 10 g·L−1 and filled into the tank. After the drone took off, the spraying system was activated once the flight was stable. The flight direction was aligned with the environmental wind direction. Upon the drone flying 5 m past the target area, the spraying system was immediately shut off, and the drone gradually landed to end the operation. After each set of operations, samples were placed into corresponding self-sealing bags using clean tweezers when the filter paper samples were dry. Then, the sample bags were stored in a black plastic bag to avoid light and kept at a low temperature. The spray solution was collected before and after each set of experiments. Because of the photolysis of the tartrazine dye, in order to improve the accuracy of the test results, the average concentration of the tracer in the spraying liquid before and after each set of spray tests was used to calculate the droplet deposition amount. Each set of experiments was repeated three times. There were 6 sprays in total.
A standard curve of the dye was calibrated using a 722S visible spectrophotometer at a wavelength of 478 nm. The spectrophotometer was produced by INESA Analytical Instrument Co., Ltd., Shanghai, China. The standard curve was: Z = 0.01891Ce + 0.001623, with an R2 of 0.9972, where Ce was the mass concentration of the tartrazine solution in mg·L−1 and Z was the absorbance value of the measured solution. To determine the deposition amount of droplets on the filter paper, 10 mL of deionized water was added to each sample bag for elution. And then the bag was shaken for 60 s to fully elute the sample, obtaining the eluate. Next, the sample’s absorbance value was measured and recorded. Then, the deposition volume per unit area and the CV of lateral distribution within the effective spray width were calculated using the formula provided by the reference [38] ISO 24253-1: 2015 “Crop protection equipment—Spray deposition test for field crop—Part 1: Measurement in a horizontal plane”.

5.2. Results and Analysis of the Comparative Experiments

The lateral distribution of droplets sprayed by UAVs before and after improvement is illustrated in Figure 17. The original UAV’s distribution exhibited a bimodal distribution with high peaks near the nozzle area, presenting an overall “M” shape distribution. In contrast, the distribution of the improved UAV showed a smoother middle segment with smaller fluctuations than the original one’s, presenting an overall trapezoidal distribution. The results showed that the average CV after improvement was 26.41%, while the one before improvement was 32.84%. This reduction of 6.43 percentage points represented a decrease of 19.58%. It indicates that using the swinging-type uniform spraying device can effectively improve the uniformity of lateral droplet deposition distribution.

6. Discussion

Instead of the CV computed with the overlapping working width, the CV within the effective spray width, described by Equation (4), was used as the experimental index in this paper. It can be seen from Figure 2 in the reference [20] that overlapping the working widths is helpful for improving droplet distribution uniformity. However, this procedure will require more flights than the spray mode, with no overlap, to spray the same target width. In this study, we hope to improve the uniformity in every spray width to reduce the working width overlap and improve the work efficiency, so all the experiments were conducted in one working width. In Section 4.2, the width of the patternator was designed at 3 m to be suitable for multiple test scenarios with different parameters. As we see in Figure 10, Figure 11 and Figure 12, the actual spray width of a single oscillating device with two nozzles was less than 1 m, so every CV value listed in Table 4 was calculated by less than nine sample values. All the CV values listed in Table 4 and obtained from Figure 17 are lower than 35%, meaning that the transversal distribution was acceptable in China, according to the national standard GB/T 43071-2023 [39]. This is different from ISO 16122-2 [40].
To maximize the benefits of pesticides and minimize their environmental and public health risks, it is necessary to deposit the highest possible amount of the active ingredient onto the target and drift the lowest droplet amount off the target [41,42]. To achieve this goal with UAVs, this study developed novel uniform application equipment with nozzles swinging horizontally and tested its performance with IDK nozzles. The oscillating devices were symmetrically installed under the rotors, and the nozzles were always in the area below the rotor in the process of motion. Therefore, good uniformity of droplet distribution was obtained, which agrees well with the reference [22]. This reference shows that the nozzles should be symmetrically arranged under the rotor because the nozzle below the fuselage has the most drift of droplets, led by the strong vortex. For the indoor test, the droplets fell naturally without wind. For the field trial, the flight direction and the environmental wind direction were the same, and the downwash wind field was symmetrical with the symmetrical distribution of droplet deposition. Figure 10, Figure 11 and Figure 12 show that the effective spray width for a single device was about 1 m less than expected. This may be caused by the wind field of the single rotor blade, as shown in references [43,44]. Figure 7 in reference [43] shows that the axial velocity component is quite larger than the radial and tangential velocity components, with the effect of shrinking the spray width. Figure 17 shows that the effective spray width for the improved UAV with two working devices is larger than 3 m. The spray plumes of two adjacent swing devices of the improved UAV had an overlap of droplet deposition, causing the UAV’s working width to be larger than twice that of the single device’s width. In Figure 11, there was a shift of the curves by changing the nozzle angle. According to the definition of the nozzle angle in this paper, we can think of the nozzle angle as a phase angle at the beginning of the oscillation. In the oscillating process, different phase angles always lead to different relative angles and positions of spray fans when they overlap in space, which affects the deposition overlap location of droplets and further shifts the distribution curve. Therefore, compared with the indoor CV of 19.88%, the field test could be influenced by the airstream of propellers and environmental wind, with a result of 26.41%, which is higher than the indoor result. In the early stages, the authors simulated the effect of environmental wind direction and velocity on the UAV wind field. Some results were found. When the environmental wind direction was perpendicular to the flight direction, the flow field was very disordered, and the wind field below the UAV appeared as large vortices. When the environmental wind direction was in the same direction as the flight direction, the downwash wind field was symmetrical. When the ambient wind direction was opposite to the flight direction, the near-earth vortex decreased and the height of the vortex increased. With the increase in crosswind velocity, the stability of downwash flow deteriorated, and the angle of inclination to the right gradually increased. It can be seen that in the actual plant protection operations, no wind or light wind should be selected for spraying operations to improve the uniform distribution of droplets. In the next study, the mechanism of the airstream affecting droplet distribution should be explored.
To realize even droplet deposition, some studies [18,19,20] start from the perspective of improving the overall uniformity in the target area and study the flight path planning of the plant protection UAV, adjusting the overlap area between the adjacent spray width. As a result, for a given target area size, the actual number of flights will be greater than the quotient of the total width divided by the spray widths. In this study, Figure 17 reveals that the lower CV was obtained by the UAV after improvement compared to the UAV before improvement without sacrificing the spray width. Given the above, it is meaningful to use the uniform application equipment described in this paper to improve the uniformity of droplet distribution. It is quite necessary to further an advance in the subsequent research.

7. Conclusions

To enhance the uniformity of droplet deposition in plant protection UAVs, this study proposed novel uniform application equipment with nozzles horizontally swinging for UAV platforms. The equipment consists of the oscillating device, spraying system, control system, and quick-detachable mechanism. The equipment was studied through theoretical analysis, CFD simulations, and experimental studies, resulting in the key parameters being determined, optimized, and experimentally validated. The specific conclusions are as follows:
  • Through mechanical analysis, the main factors affecting the distribution of droplet deposition in the uniform equipment were identified as motor speed, nozzle angle, oscillating rod length, spray height, airflow velocity, and droplet size.
  • Single-factor influence analysis of working parameter H and structural parameters L, θ through flow field simulation revealed favorable parameter ranges for achieving even droplet deposition: rod length between 90 and 190 mm, nozzle angle between −15° to 15°, and spray height between 1 and 2 m.
  • By conducting a three-factor and three-level quadratic orthogonal test on the experimental platform, fitting formulas between working parameter H, structural parameters L, θ, and the index CV value were obtained. The optimal parameter combination was determined as follows: L of 175 mm, θ of 15°, and H of 1.5 m.
  • Using the optimal parameter combination, a prototype was developed, and field comparative experiments were conducted by only changing the application equipment on the plant protection UAV while keeping other parameters constant. The application equipment designed in this study showed good performance in the uniform distribution of droplet deposition. The distribution of the UAV before improvement exhibited an “M” shape with a CV value of 32.84%. After improvement, the distribution showed a trapezoidal shape with a CV value of 26.41%, representing a decrease of 6.43 percentage points and a decrease of 19.58% in CV value. It demonstrates the feasibility of using this equipment for spraying to improve the uniformity of droplet deposition in the spray width for the measured plant protection UAV. Subsequent research will further advance related studies.

Author Contributions

Conceptualization, S.W. and G.Z.; methodology, S.W.; equipment and parts design, H.Z.; software and CFD simulation, H.Z.; tests and data analysis, S.W., H.Z. and H.L.; writing—original draft preparation, S.W. and H.Z.; writing—review and editing, S.W., G.Z. and H.L.; supervision, S.W. and G.Z. All authors have read and agreed to the published version of the manuscript.

Funding

This research was funded by National Natural Science Foundation of China, grant number 32301713; National Characteristic Vegetable Industry Technology System Special Project, grant number CARS-24-D-02 and Fundamental Research Funds of the Central Universities, grant number 2662020GXPY012, 2662015QD045 and BC2023113.

Data Availability Statement

The data presented in this study are available on request from the corresponding author.

Acknowledgments

The authors would like to give special thanks to Quanyuan Zhou, Nian Liu, Fang Liang and Jiahao Li of College of Engineering of Huazhong Agricultural University for parts manufacturing with CNC and 3D printing, data analyzing and idea improving of the article, respectively, and Jianguo Man of College of Plant Science & Technology of Huazhong Agricultural University for providing trial fields.

Conflicts of Interest

The authors declare no conflicts of interest.

References

  1. Xue, X.; Yang, Z.; Liang, X.; Luo, Q.; Lv, S.; Li, Z. Application and experiments of the atomization mesh used on the plant protection spraying in orchards. Trans. CSAE 2022, 38, 1–10. [Google Scholar] [CrossRef]
  2. Xiao, Y.; Wu, C.; Wu, K. Agricultural pest control in China over the past 70 years: Achievements and future prospects. Chin. J. Appl. Entomol. 2019, 56, 1115–1124. [Google Scholar] [CrossRef]
  3. Cui, L.; Xue, X.; Le, F.; Ding, S. Design and evaluation method of testing bench for spray boom suspension systems. Trans. CSAE 2019, 35, 23–31. [Google Scholar] [CrossRef]
  4. He, X. Research and development of efficient plant protection equipment and precision spraying technology in China. J. Plant Prot. 2022, 49, 389–397. [Google Scholar] [CrossRef]
  5. Zhai, C.; Zhang, Y.; Zou, W.; Song, J.; Han, C.L.; Dou, H. Design and test of precision variable-rate spray monitoring and control system based on pesticide spraying traceability. Trans. CSAM 2024, 55, 160–169. [Google Scholar] [CrossRef]
  6. Qiu, W.; Li, X.; Li, C.; Ding, W.; Lv, X.; Liu, Y. Design and test of a novel crawler-type multi-channel air-assisted orchard sprayer. Int. J. Agric. Biol. Eng. 2020, 13, 60–67. [Google Scholar] [CrossRef]
  7. Qiu, W.; Sun, H.; Sun, Y.; Liao, Y.; Zhou, L.; Wen, Z. Design and test of circulating air-assisted sprayer for dwarfed orchard. Trans. CSAE 2021, 37, 18–25. [Google Scholar] [CrossRef]
  8. Ru, Y.; Chen, X.; Liu, B.; Wang, S.; Lin, Y. Optimized design and performance test of axial flow orchard sprayer air delivery system. Trans. CSAM 2022, 53, 147–157. [Google Scholar] [CrossRef]
  9. Xing, Q. The Design and Performance Test on Height Gap Narrow-Shaped Rubber Crawler and Wide Crop Protection Fertilization Machine for Dual-Purpose in Floods or Droughts. Master’s Thesis, Nanjing Agricultural University, Nanjing, China, 2013. [Google Scholar]
  10. Gao, Y. Study on Distribution of Pesticide Droplets in Gramineous Crop Canopy and Control Effect Sprayed by Unmanned Aerial Vehicle. Master’s Thesis, Northeast Agricultural University, Harbin, China, 2013. [Google Scholar]
  11. Zheng, J.; Xu, Y. Development and prospect in environment-friendly pesticide sprayers. Trans. CSAM 2021, 52, 1–16. [Google Scholar] [CrossRef]
  12. Zhang, P.; Deng, L.; Lyu, Q.; He, S.; Yi, S.; Liu, Y.; Yu, Y.; Pan, H. Effects of citrus tree-shape and spraying height of small unmanned aerial vehicle on droplet distribution. Int. J. Agric. Biol. Eng. 2016, 9, 45–52. [Google Scholar] [CrossRef]
  13. Liu, X.; Liu, X.; Cui, H.; Yuan, J. Research progress and trend analysis of crop canopy droplet deposition. Trans. CSAM 2021, 52, 1–20. [Google Scholar] [CrossRef]
  14. Wang, C.; Song, J.; He, X.; Wang, Z.; Wang, S.; Meng, Y. Effect of flight parameters on distribution characteristics of pesticide spraying droplets deposition of plant-protection unmanned aerial vehicle. Trans. CSAE 2017, 33, 109–116. [Google Scholar] [CrossRef]
  15. Wang, L.; Cai, D.; Wu, J.; Ding, G.; Zhu, Z.; Qiu, B. Experimental study of small unmanned helicopter spray deposition. J. Agric. Mech. Res. 2013, 35, 183–185. [Google Scholar] [CrossRef]
  16. Chojnacki, J.; Pachuta, A. Impact of the parameters of spraying with a small unmanned aerial vehicle on the distribution of liquid on young cherry trees. Agriculture 2021, 11, 13. [Google Scholar] [CrossRef]
  17. Tang, Q.; Chen, L.; Zhang, R.; Deng, W.; Xu, M.; Xu, G.; Li, L.; Hewitt, A. Effects of application height and crosswind on the crop spraying performance of unmanned helicopters. Comput. Electron. Agric. 2021, 181, 105961. [Google Scholar] [CrossRef]
  18. Biglia, A.; Grella, M.; Bloise, N.; Comba, L.; Mozzanini, E.; Sopegno, A.; Pittarello, M.; Dicembrini, E.; Alcatrão, L.E.; Guglieri, G.; et al. UAV-spray application in vineyards: Flight modes and spray system adjustment effects on canopy deposit, coverage, and off-target losses. Sci. Total Environ. 2022, 845, 157292. [Google Scholar] [CrossRef] [PubMed]
  19. Xu, M.; Zhang, R.; Chen, L.; Tang, Q.; Xu, G. Key technology analysis and research progress of UAV intelligent plant protection. Smart Agric. 2019, 1, 20–33. [Google Scholar] [CrossRef]
  20. Anken, T.; Saravanan, G.; Waldburger, T.; Werthmüller, J.; Wohlhauser, R.; Sanderson, G. Transversal distribution of a spray drone applying different nozzles and measuring methods. Crop Prot. 2024, 179, 106603. [Google Scholar] [CrossRef]
  21. Bonds, J.A.S.; Brad, F.; Thistle, H.W. Calculation of swath width and swath displacement for unscrewed aerial spray systems. J. ASABE 2023, 66, 523–532. [Google Scholar] [CrossRef]
  22. Zhang, J.; Zhang, C.; Chen, Q.; Zhou, H.; Yang, F.; Ru, Y. Effect of ambient wind speed on downwash airflow and droplet deposition for six-rotor UAV. Trans. CSAM 2022, 53, 74–81. Available online: http://www.nyjxxb.net/index.php/journal/article/view/1412 (accessed on 10 July 2024).
  23. Liu, Q.; Lan, Y.; Shan, C.; Mao, Y. The influence of spraying parameters of aerial application on droplet deposition characteristics for apple fields. J. Agric. Mech. Res. 2020, 42, 173–180. [Google Scholar] [CrossRef]
  24. OECD. Report on the State of the Knowledge—Literature Review on Unmanned Aerial Spray Systems in Agriculture; OECD Series on Pesticides, No. 105; OECD Publishing: Paris, France, 2021. [Google Scholar] [CrossRef]
  25. Ran, J.; Wu, C. Research status and prospect of cutting mechanism of grain harvester. J. Chin. Agric. Mech. 2019, 40, 25–34. [Google Scholar] [CrossRef]
  26. Xia, P.; Yin, S.; Chen, L.; Zhu, D.; Li, B. Numerical simulation of cutting pattern of a reciprocating cutter. Trans. CSAM 2007, 38, 65–68. [Google Scholar]
  27. Liu, Z.; Wang, D.; Zhai, G.; Liu, G.; Zhang, N.; Hao, X. Design and experiment on reciprocating double knife shrub harvester. Trans. CSAM 2013, 44, 102–106. [Google Scholar] [CrossRef]
  28. Zhang, S. Design and Test of Air-Aspirated Rapeseed Seeding System. Master’s Thesis, Huazhong Agricultural University, Wuhan, China, 2022. [Google Scholar]
  29. Feng, L.; Guan, T.; Tian, S.; Cui, B. Design of quick-return crank-rocker mechanism with optimum transmission performance. Mach. Des. Manuf. 2018, 66–69. [Google Scholar] [CrossRef]
  30. Miller, P.C.H.; Ellis, M.C.B.; Tuck, C.R. Entrained air and droplet velocities produced by agricultural flat-fan nozzles. At. Sprays 1996, 6, 693–707. [Google Scholar] [CrossRef]
  31. Ru, Y.; Zhu, C.; Bao, R. Spray drift model of droplets and analysis of influencing factors based on wind tunnel. Trans. CSAM 2014, 45, 66–72. [Google Scholar] [CrossRef]
  32. Wang, L. Research on Low-Attitude Droplets Deposition and Technology of Variable Spraying Measurement and Control System Based on Multi-Rotor Crop Protection UAV. Ph.D. Thesis, China Agricultural University, Beijing, China, 2017. [Google Scholar]
  33. Ren, Y.; Li, X. Assessment and validation of liquid breakup models for high-pressure dense diesel sprays. Front. Energy 2016, 10, 164–175. [Google Scholar] [CrossRef]
  34. Ma, Y.; Gong, C.W.; Zhang, Y.Z.; Li, B.; Wang, X.G. Effects of spray nozzles and spray adjuvant on the deposition of droplets of plant protection unmanned aerial vehicle (UAV) in paddy fields and the control efficacy against Asiatic rice borer Chilo suppressalis. J. Plant Prot. 2021, 48, 518–527. [Google Scholar] [CrossRef]
  35. Feng, Y.; Wang, X.; Xu, S.; Yu, X.; Li, T.; Han, L.; Song, J. Research on the application of air induced nozzle in rice disease control by plant protection unmanned aerial vehicle. J. China Agric. Univ. 2022, 27, 195–203. [Google Scholar] [CrossRef]
  36. Dafsari, R.A.; Yu, S.; Yu, S.; Choi, Y.; Lee, J. Drift potential and coverage ratio analysis of an air induction nozzle under an agricultural drone with various operating condition: An indoor test. Comput. Electron. Agric. 2024, 224, 109171. [Google Scholar] [CrossRef]
  37. MH/T 1040-2011; Determination of the Spray Rate and Distribution Pattern of Aviation Spray Equipment. Civil Aviation Administration of China: Beijing, China, 2011. Available online: https://www.nssi.org.cn/nssi/front/78052310.html (accessed on 1 January 2020).
  38. ISO 24253-1: 2015; Crop protection Equipment—Spray Deposition Test for Field Crop—Part 1: Measurement in a Horizontal Plane. International Organisation for Standardization: Geneva, Switzerland, 2015. Available online: https://www.antpedia.com/standard/7927854-1.html (accessed on 15 March 2015).
  39. GB/T 43071-2023; Unmanned Aircraft Spray System for Plant Protection. Standardization Administration of China: Beijing, China, 2023. Available online: http://c.gb688.cn/bzgk/gb/showGb?type=online&hcno=DE5EB96756889201A2EBA08F003DB744 (accessed on 1 April 2024).
  40. ISO 16122-2; Agricultural and Forestry Machinery—Inspection of Sprayers in Use—Part 2: Horizontal Boom Sprayers, Volume 18. International Organisation for Standardization: Geneva, Switzerland, 2015.
  41. Hewitt, A. The importance of droplet size in agricultural spraying. At. Spray 1997, 7, 235–244. [Google Scholar] [CrossRef]
  42. Matthews, G.; Bateman, R.; Miller, P. Pesticide Application Methods, 4th ed.; Wiley & Blackwell: Hoboken, NJ, USA, 2014. [Google Scholar]
  43. Shouji, C.; Dafsari, R.A.; Yu, S.-H.; Choi, Y.; Lee, J. Mean and turbulent flow characteristics of downwash air flow generated by a single rotor blade in agricultural drones. Comput. Electron. Agric. 2021, 190, 106471. [Google Scholar] [CrossRef]
  44. Yang, F.; Xue, X.; Cai, C.; Sun, Z.; Zhou, Q. Numerical simulation and analysis on spray drift movement of multirotor plant protection unmanned aerial vehicle. Energies 2018, 11, 2399. [Google Scholar] [CrossRef]
Figure 1. Whole model of the uniform application equipment with nozzles swinging horizontally. 1. Nozzle body. 2. Quick detachable device. 3. Oscillating device. 4. Control system. 5. Tank. 6. Pump. 7. Drone platform.
Agronomy 14 01631 g001
Figure 2. Hardware composition of the control system.
Agronomy 14 01631 g002
Figure 3. Overall design diagram (left) and photo (right) of an oscillating device with nozzles. 1. Nozzle body. 2. Pipe clamp. 3. Oscillating rod. 4. Crank. 5. Connecting rod. 6. Housing. 7. Motor. 8. Cylindrical pin. 9. Vertical bearing seat. 10. Diamond bearing seat. A was the motor center, B was the installation hole, C was another end of the connecting rod BC, D was the center point of the rod EF, and E and F were the two ends of the rod where the oscillating rod was located.
Agronomy 14 01631 g003
Figure 4. Structure sketch of crank-rocker mechanisms with non-quick-return characteristics installed under two adjacent rotors. Note: l1 was the length of AB, mm; l2 was the length of BC, mm; l3 was the length of CD, mm; l4 was the length of AD, mm; l5 was the length of CF, mm; φ was the angle of oscillation between the two limiting positions, °; θ was the nozzle angle, i.e., the angle between the oscillating rod’s initial position and the lateral direction, °; ω was the angular velocity, rad∙s−1.
Agronomy 14 01631 g004
Figure 7. Angular velocity curves of the nozzle barycenter at different motor speeds.
Agronomy 14 01631 g007
Figure 8. 21 injections located on the nozzle motion trajectory.
Agronomy 14 01631 g008
Figure 9. Sample layout of the droplet deposition in CFD simulation.
Agronomy 14 01631 g009
Figure 10. Effects of the oscillating rod length L on the transverse distribution of droplets.
Agronomy 14 01631 g010
Figure 11. Effects of the nozzle angle on the transverse distribution of droplets.
Agronomy 14 01631 g011
Figure 12. Effects of the spray height on the transverse distribution of droplets.
Agronomy 14 01631 g012
Figure 14. Response surface diagrams of factors on the CV value. (a) Interaction of the oscillating rod length and nozzle angle on the CV value; (b) Interaction of the oscillating rod length and spray height on the CV value; (c) Interaction of the spray height and nozzle angle on the CV value.
Agronomy 14 01631 g014
Figure 15. Photos of the UAVs before and after improvement. (a) The improved UAV with the uniform application equipment; (b) The original UAV; (c) A front view of the improved UAV with the uniform application equipment.
Agronomy 14 01631 g015
Figure 16. The sample arrangement and the test site of the field test of the prototype. (a) The arrangement of sampling; (b) A photo of the test site.
Agronomy 14 01631 g016
Figure 17. The transverse distribution of droplets sprayed by UAVs before and after improvement.
Agronomy 14 01631 g017
Table 1. Boundary conditions and surface conditions under the DPM model in the CFD simulation.
Surfaces of the Computational DomainBoundary ConditionsSurface Conditions under DPM Model
UpVelocity inlet (0 m·s−1)Escape
DownWallTrap
OthersPressure outlet (0 MPa)Escape
Table 2. Factors and levels for CFD simulating.
L/(mm)θ/(°)H/(m)
40−301
90−151.25
14001.5
190151.75
240302
Table 4. The scheme and results of the Box–Behnken test.
No. of TestL/(mm)θ/(°)H/(m)CV/(%)
114001.523.14
214001.521.53
314001.522.13
4190−151.522.47
51900226.27
6900133.58
714015226.42
814001.522.05
914015127.46
10900230.75
1190151.523.19
1290−151.528.29
13140−15138.21
14190151.520.59
15140−15230.62
161900133.17
1714001.523.87
Table 5. ANOVA table of CV.
SourceSum of SquaresDfMean SquareF Valuep Value
Model401.07944.5623.620.0002 **
L22.14122.1411.740.0110 *
θ60.12160.1231.860.0008 **
H42.14142.1423.330.0021 **
L∙θ2.5912.591.370.2785
L∙H4.1414.142.200.1820
θ∙H10.73110.735.690.0486 *
L21.9411.941.030.3448
θ20.7210.720.380.5568
H2250.971250.97133.03<0.0001 **
Residual13.2171.89
Lack of Fit9.6533.223.620.1231
Cor Total414.2816
Note: ** indicates that the impact is extremely significant, p < 0.01; * indicates that the impact is significant, p < 0.05.
Disclaimer/Publisher’s Note: The statements, opinions and data contained in all publications are solely those of the individual author(s) and contributor(s) and not of MDPI and/or the editor(s). MDPI and/or the editor(s) disclaim responsibility for any injury to people or property resulting from any ideas, methods, instructions or products referred to in the content.

