Article

Accelerated Iron Evolution in Quaternary Red Soils through Anthropogenic Land Use Activities

1
College of Land and Environment, Shenyang Agricultural University, Shenyang 110866, China
2
Shenyang Institute of Technology, Shenyang 113122, China
*
Author to whom correspondence should be addressed.
Agronomy 2024, 14(8), 1669; https://doi.org/10.3390/agronomy14081669 (registering DOI)
Submission received: 18 June 2024 / Revised: 26 July 2024 / Accepted: 27 July 2024 / Published: 30 July 2024
(This article belongs to the Section Soil and Plant Nutrition)

Abstract

:
Iron in soil exists in various valence states and is prone to changes with alterations in soil environmental conditions. Its migration and transformation are crucial for soil formation and understanding soil evolution. This study focuses on Quaternary red soils found in woodland, sparse forest grassland, grassland, and cultivated land located in the semi-humid region of the middle temperate zone. For comparison, buried Quaternary red soil was also examined. A soil reconstruction model was used to quantitatively calculate the variation of different forms of iron in order to analyze various forms of iron composition, migration, and transformation within the soil profile, as well as the evolutionary traits of Quaternary red soils influenced by diverse land use activities. This study found that after exposure and use, iron from the topsoil of buried Quaternary red soil migrated to the subsoil, altering the iron distribution. Free iron and crystalline oxides decreased in the topsoil but increased in specific subsoil layers, with woodland and grassland showing the most significant changes. Silicate-bound iron pooled in the soil weathered to form free iron under different land uses, and poorly crystalline iron oxides transformed into crystalline oxides, with grassland exhibiting the highest transformation intensity. Conversion processes predominated over iron migration in the Quaternary red soils. The evolution of Quaternary red soils can be divided into three stages, marked by changes in iron composition and crystallization due to anthropogenic land use activities. Initially, during 140−94 ka BP, iron composition was stable. Then, between 94–24 ka BP, plant decomposition formed iron–metal complexes, releasing and crystallizing poorly crystalline iron oxides. Finally, from 24 ka BP to the present, anthropogenic activities intensified, increasing the formation and conversion rates of these oxides. This study quantifies iron migration and transformation in Quaternary red soils, providing insights for sustainable soil management, especially in regions where human activities have accelerated iron evolution. Based on these findings, the following policy recommendations are proposed: implement sustainable land use practices, encourage land management strategies that preserve natural vegetation, promote research on soil management techniques, develop and implement regulatory policies, and support educational programs to maintain the health and stability of Quaternary red soils, particularly in regions prone to accelerated iron evolution due to anthropogenic activities.

1. Introduction

Iron, the Earth’s most abundant variable metallic element, is found in rocks, sediments, and soils as iron-bearing minerals [1,2]. In soil, iron displays redox activity in various valence states [3]. It plays a vital role in soil processes like mineral weathering, formation, and nutrient cycling [4,5]. Iron oxides within soil colloids aid electron transfer, adsorption, and desorption [6]. They enhance the stability of soil organic matter, promote organic carbon accumulation, and regulate soil aggregate stability [1,7]. Iron’s adaptability to soil conditions makes it a useful tracer of soil formation and environmental changes [8].
The Quaternary red soils formed under the hot and humid climate conditions prevalent during the early and middle Pleistocene era of the Quaternary period [9]. These soils were widely distributed south of the 30° north latitude. Having undergone desilication, iron enrichment, aluminization, and agglomeration processes, they are abundant in iron and aluminum oxides, imparting a characteristic red hue and viscous texture [10]. In northern regions, much of this soil remains buried underground. However, due to external forces like erosion and transportation, its surface can become exposed. Common anthropogenic land use activities include agriculture, forestry, mining, industrialization, water resource development, land reclamation, conservation and restoration, which have affected the soil’s material and energy composition, the land cover, and consequently, the soil’s physicochemical properties [11].
Recently, numerous studies have explored how land use patterns impact soil iron composition and distribution [1,12,13]. Wang et al. investigated the distribution characteristics of iron in the surface soils of different land use patterns near Xingkai Lake, revealing that land use influenced the content and distribution of iron oxide. The land use patterns exhibited the following order in terms of Feo content: dryland > wetland > forestland > grassland > lakeshore sandy land [14]. Li et al. examined the effect of land use change on the iron crystallinity of mineral soil and found that cultivated soil had significantly higher iron crystallinity than soils supporting old hardwood [15]. Specifically, changes in land use and the duration of land use altered the content of different forms of iron. For instance, the form and spatial distribution of ferric oxide in soil changed significantly after a paddy field was converted to woodland in a plain area [16]. Wu et al. studied the dynamics of iron in soil and rice during rice planting in 2000 and found that long-term rice field management reduced the iron concentration in the subsurface soil [17]. Furthermore, as farmland ages, soil iron levels initially decline and then rise [18].
Previous studies on soil iron primarily focused on red soil with significant desilication and iron-rich aluminization, or paddy soil influenced by human-induced redox processes. For instance, Huang et al. investigated the temporal evolution of various iron oxide forms in hydroponic anthropogenic soils derived from different parent materials in subtropical regions of China. Their findings revealed that the concentrations of different iron forms in hydroponic anthropogenic soils originating from calcareous parent material increased over time [19]. Additionally, Guo et al. inferred the transformation of iron oxide based on its content in the upper and lower slopes of an area in southeast China [20]. Those studies did not quantify iron migration or transformation. However, due to variations in soil types and their soil-forming environments across different regions, the content and distribution of different iron forms in soil exhibit significant differences. Once the Quaternary red soil, which is widely distributed in low hills and hilly regions, is exposed to the surface through erosion and subjected to anthropogenic land use, questions arise. What are the differences in the composition of various iron forms in soil under the influence of different anthropogenic land use activities? What are the migration and transformation patterns of different iron forms over time? Is the process primarily driven by migration or transformation? These issues remain poorly understood.
This study targeted Chaoyang City, Liaoning Province, where Quaternary red soils are prevalent. The composition of iron elements under different land use patterns such as cultivated land, woodland, grassland, and sparse forest grassland was analyzed, and the migration and transformation of different forms of iron were quantified via a soil reconstruction model. The innovation of this study fills the gap left by previous studies that have failed to quantify the migration and transformation of iron in these soils. Our findings will contribute to a deeper understanding of iron migration and transformation in Quaternary red soils in low-hill, mid-temperate regions. The data can inform the construction of a health evaluation index system for these soils, to evaluate their health status and provide a scientific basis for their management and utilization.

2. Materials and Methods
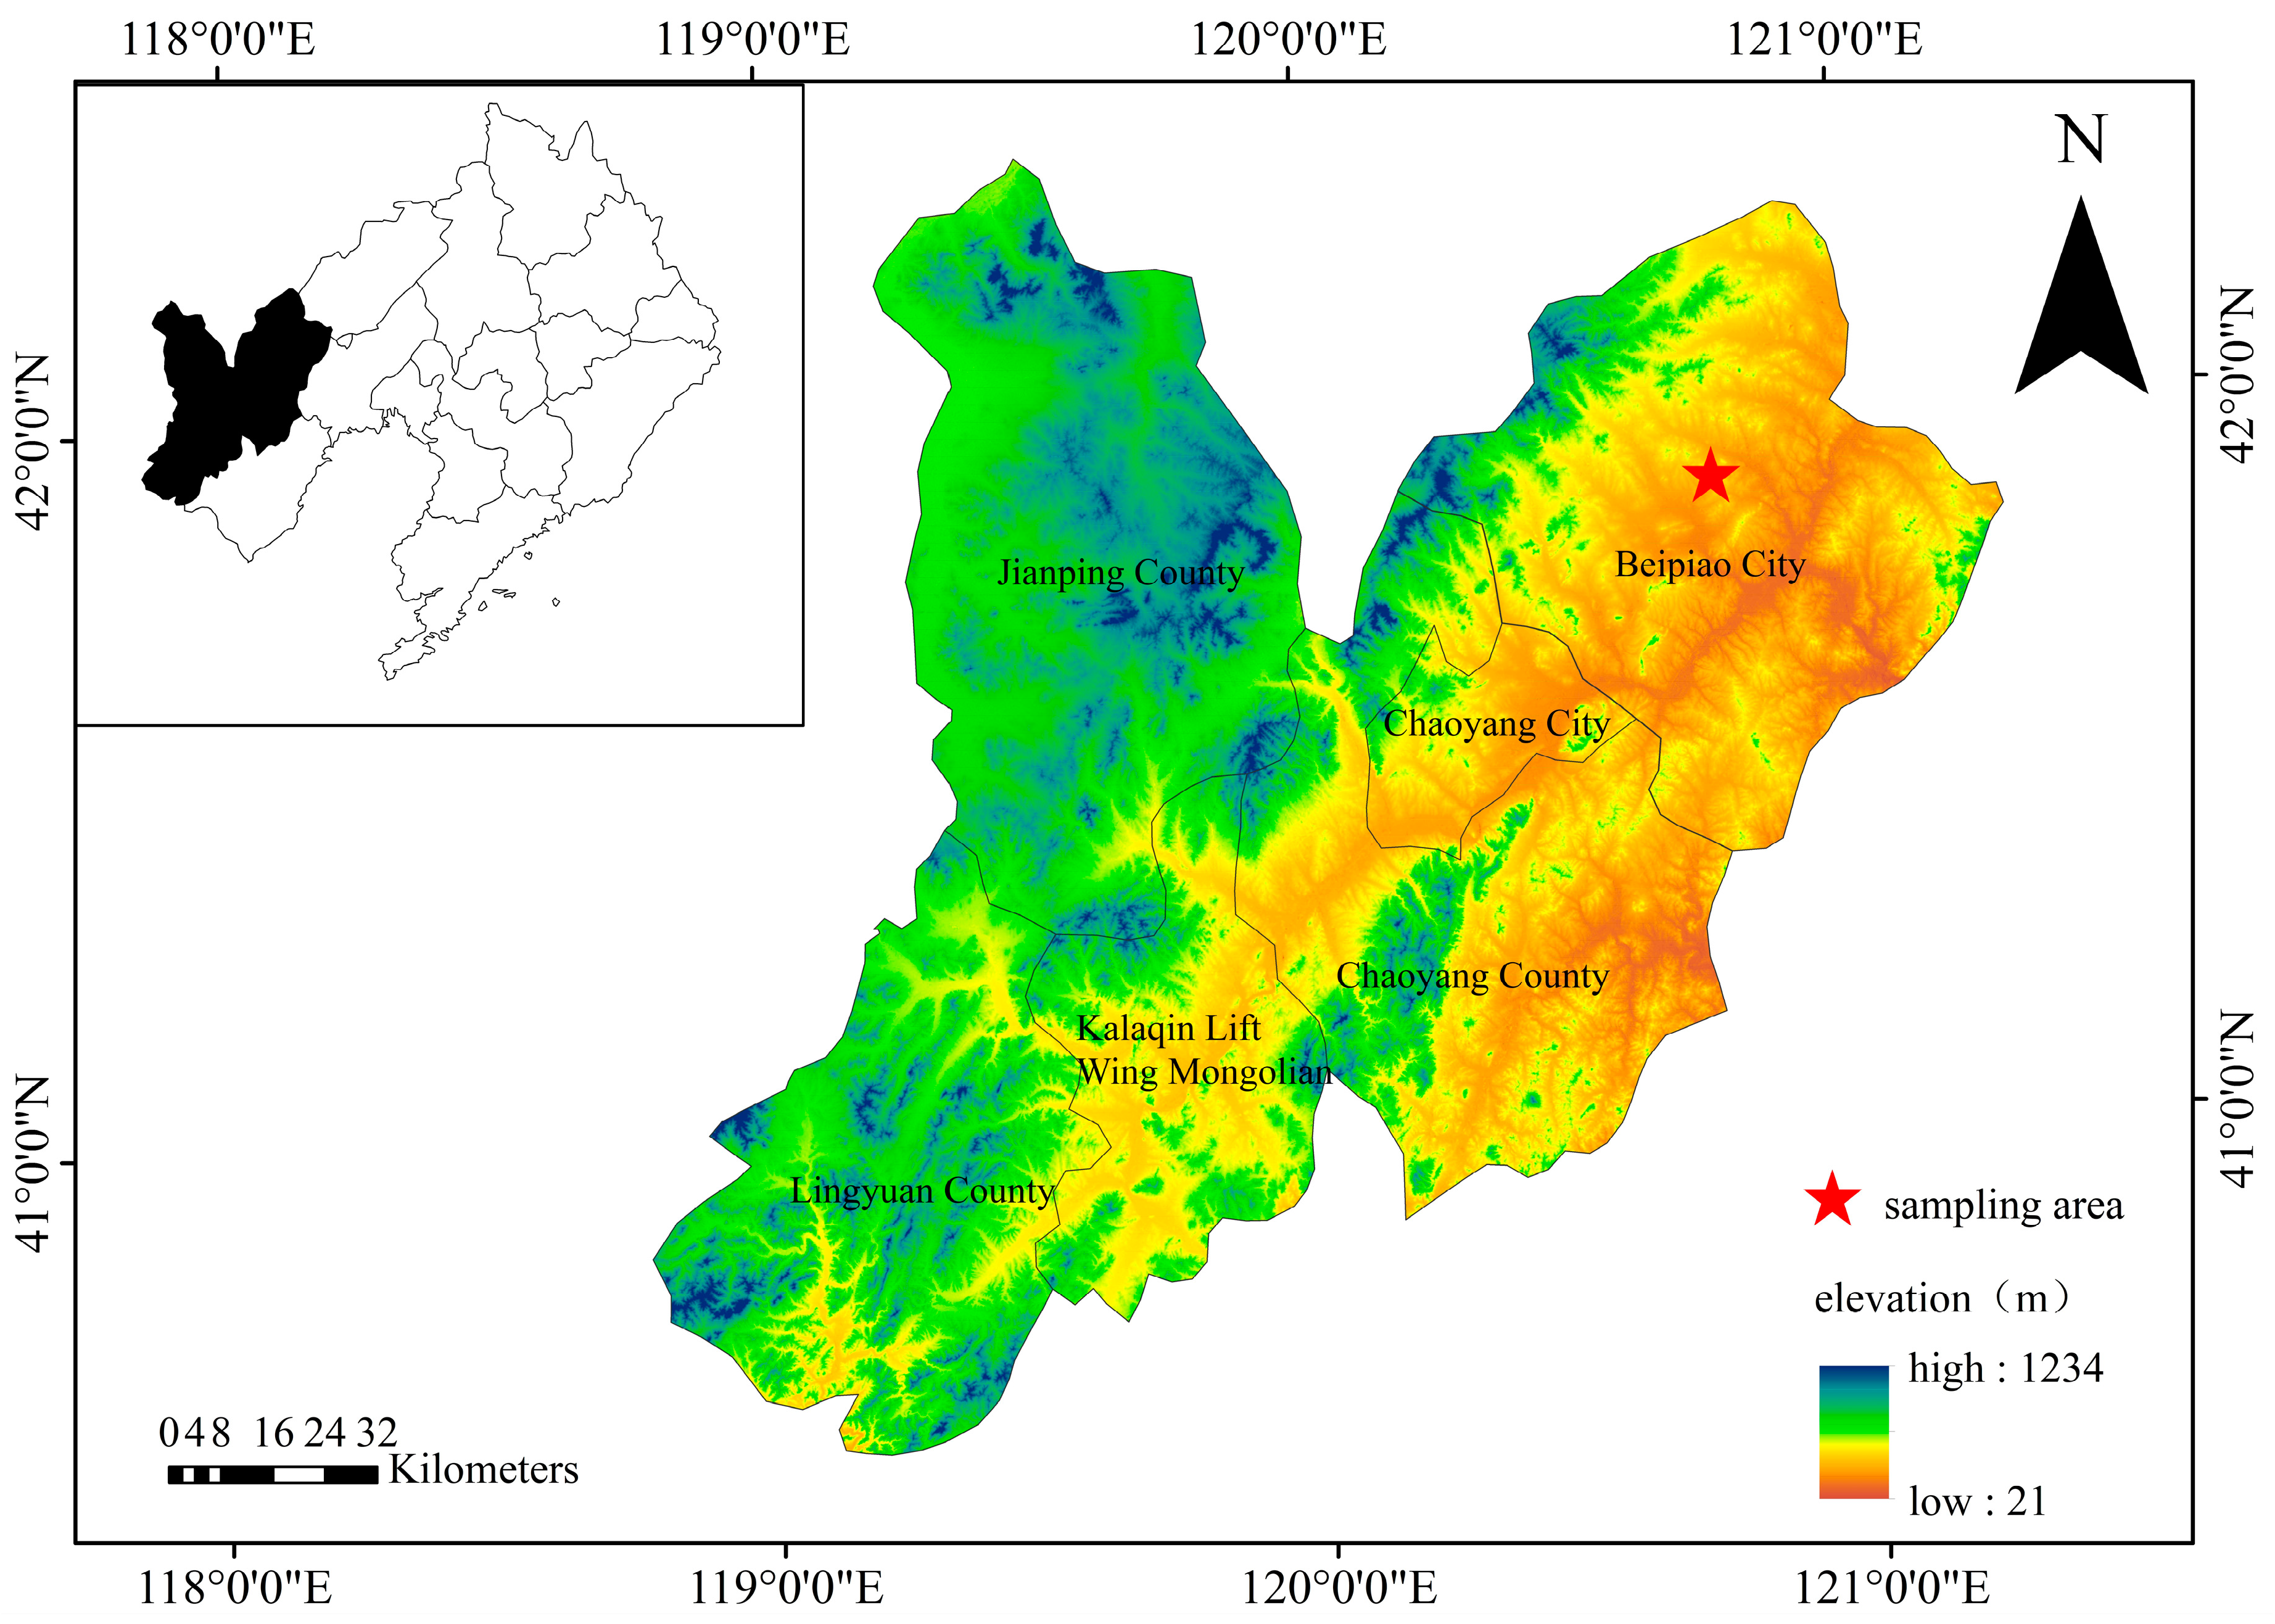
2.1. Study Area

Drawing from data in Soil Series of China—Liaoning Volume [21] and Liaoning Soil [22], combined with on-site investigations, Beipiao City—located in Chaoyang City, Liaoning Province, and abundant in Quaternary red soils—was chosen as our study region (Figure 1). The Quaternary red soil is classified as argosol in the Chinese Soil Taxonomy [23], corresponding to alfisol in the Soil Taxonomy [24] and luvisol in the World Reference Base for Soil Resources [25]. The terrain features low mountains and hills, influenced by a semi-humid continental monsoon climate characteristic of the mid-temperate zone. The area experiences four distinct seasons, concurrent rainfall and warmth, ample sunshine, limited precipitation, and high evaporation.

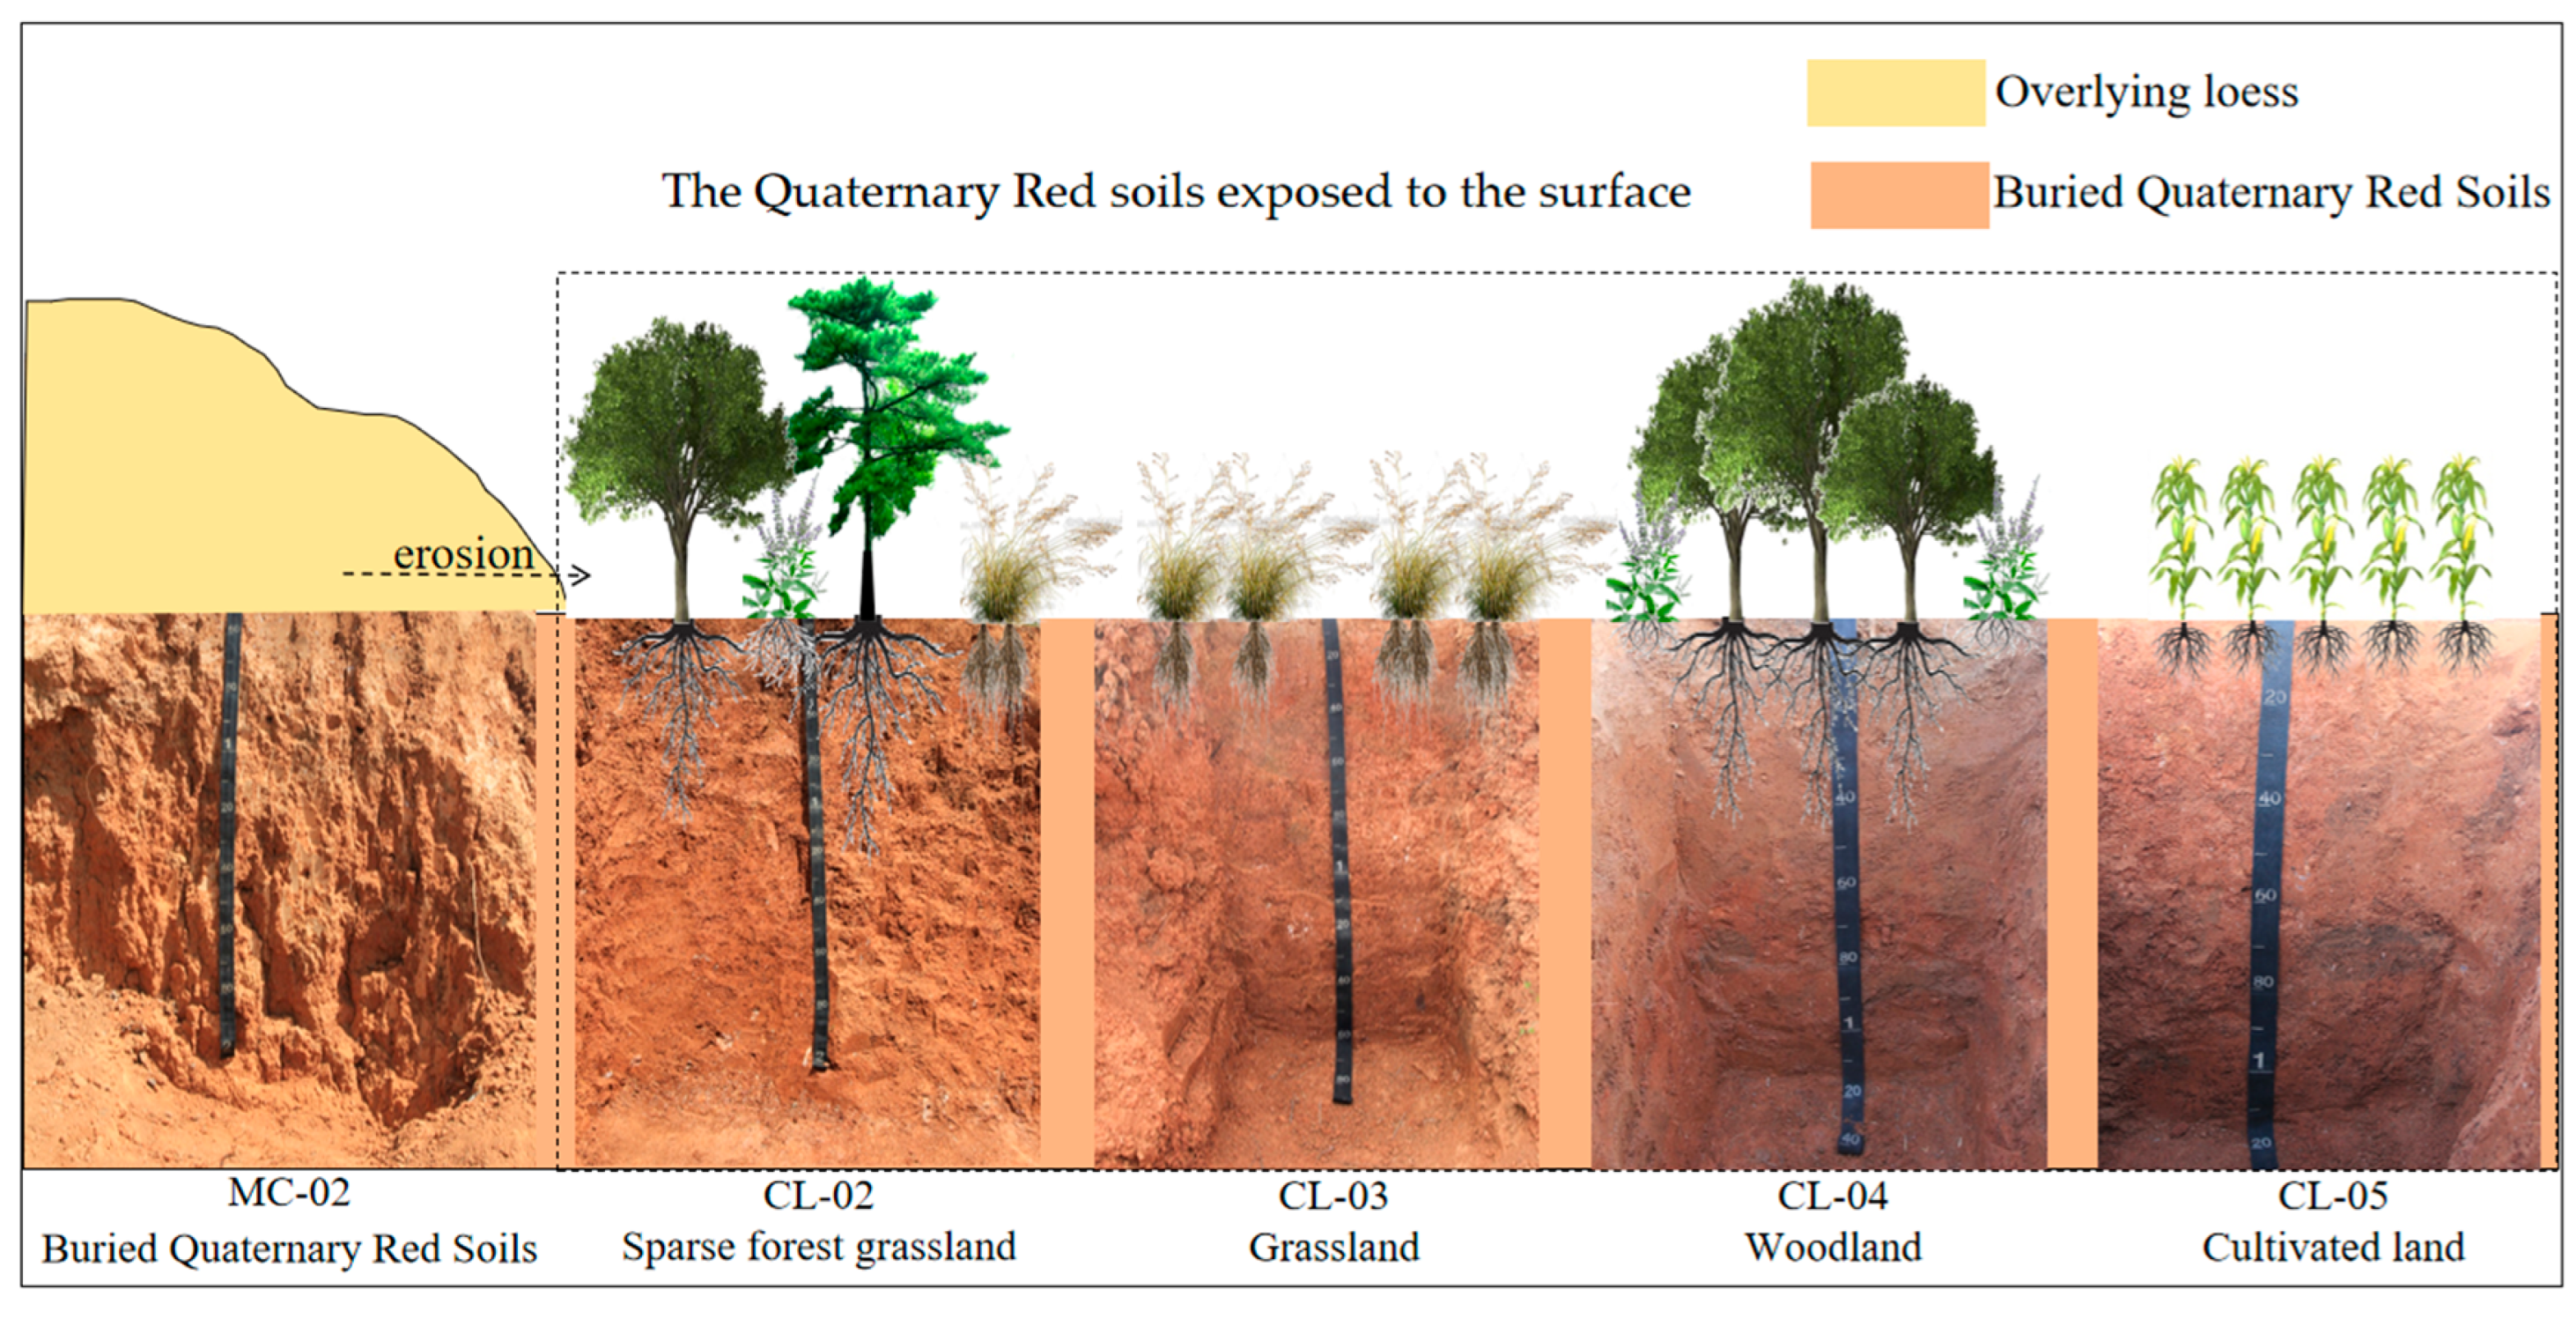
2.2. Soil Samplings and Preprocessing

The sampling site was situated in Beipiao City, Chaoyang City, Liaoning Province. Within this region, the Quaternary red soil stratum remains relatively stable, influenced by consistent terrain, climate, parent material, and time factors. We selected four distinct land use patterns, assuming the exposed Quaternary red soil to be in use, including sparse forest grassland (CL-02), grassland (CL-03), woodland (CL-04), and cultivated land (CL-05). Additionally, a nearby buried Quaternary red soil site (MC-02) served as a control (Figure 2). Detailed morphological characteristics of the Quaternary red soils were documented. Soil samples were collected from the pedogenic horizons, from bottom to top, and stored in ziplock bags. Fresh samples were transported to the laboratory for immediate analysis of soil bulk density and moisture content, while the remaining samples were air-dried, ground, and sieved through 10, 100, and 200 mesh nylon screens for further determinations of total iron, free iron, poorly crystalline iron oxides, pH, soil texture, organic carbon, and total nitrogen content.

2.3. Measurement Methods

2.3.1. Measurement Methods

The soil moisture content was determined using the drying method, pH was measured via the glass electrode method (soil–water ratio of 1:2.5), and bulk density was assessed through the core ring method. Particle size composition was analyzed with a laser particle size analyzer (Malven Mastersizer 3000, Malvern Instruments Ltd., Marvin, UK). For detailed methodologies, refer to Laboratory Analysis Methods of Soil Investigation by Zhang et al. (2012) [26]. Soil samples of 30–40 mg, sifted through a 100-mesh sieve, were precisely weighed and securely wrapped in a tin boat. After verifying the integrity of the tin boat, the samples were organized by serial number. Organic carbon and total nitrogen contents were determined using an element analyzer (Vario ELIII, Elementar Company, Langenselbold, Germany) as described by Wagner et al. (2007) [27].

2.3.2. Determinations of Iron in Different Forms

The total iron content in the soil was ascertained through a crucible melting process involving lithium carbonate, boric acid, and graphite powder [28]. Free iron was extracted using DCB (sodium disulfite, sodium citrate, sodium bicarbonate) and then measured by atomic absorption spectrometry [29]. Poorly crystalline iron oxides were quantified through extraction with ammonium oxalate, followed by atomic absorption spectrometry [29]. The age of the Quaternary red soils was determined by optically stimulated luminescence dating [30].

2.4. Quantitative Calculation of Iron Index and Soil Pedogenic Process

The silicate-bound iron pool was determined by subtracting free iron content from total iron content [31]. The crystalline oxides content was calculated by deducting the content of poorly crystalline iron oxides from the free iron content [32,33]. Due to the varying depths of Quaternary red soil layers across different land use patterns, a weighted average value was employed to facilitate comparisons of iron content among these patterns.
Previous studies by our research group had established the homogeneity of the parent material of the tested Quaternary red soils [11]. The Btr2 layer (92–141 cm), which exhibited the weakest development and closely resembled the original state of the Quaternary red soils, served as the reference baseline, with Ti selected as the reference element [34]. To quantitatively assess component changes within the weathered soil layer (within 100 cm3) during the formation of the Quaternary red soils, a soil reconstruction model was utilized [35]. The formula for this calculation was as follows:
U V F = B D w × C i w B D p m × C p m D j w = B D w × C j w U V F × ( B D p m × C j p m )
where BDw and BDpm refer to the bulk density of the weathered soil layer and its parent material, respectively; Ciw and Cipm denote the content of a stable component ‘i’, which serves as a reference baseline, in the weathered soil layer and its parent material, respectively; Cjw and Cjpm represent the content of component ‘j’ in the weathered soil layer and its parent material, respectively; Djw signifies the amount of component ‘j’ that has increased or decreased in the weathered soil layer during soil formation.
Crystalline oxides in the tested Quaternary red soils were relatively stable, migrating only under reducing conditions [36,37]. In the stable coexistence of iron forms, crystalline oxides existed as goethite and hematite, without migration. Hence, an increase in crystalline oxides signified the transformation amount. Soil weathering reduces the silicate-bound iron pool, leading to an increase in free iron. The migration amount was deduced from these changes. The conversion rate of the Quaternary red soils was determined by dividing the conversion amount by time.

2.5. Data Processing

The location information of the sampling points was obtained from the field. The soils’ physical and chemical properties, as well as the data on different forms of iron content, were determined through indoor analysis (see Section 2.3.1 and Section 2.3.2). The variation in different forms of iron was calculated using the soil reconstruction model mentioned above (see Section 2.4). The data were analyzed using the following software. ArcMap 10.8 was utilized to create the general map of the study area. Data processing was carried out in Excel 2019. Pearson correlation analysis was employed to determine the relationship between iron oxide content in various forms and physical–chemical properties (p < 0.05). Additionally, Origin 2021 was used for chart creation.
We conducted quality control measures on the data obtained from the experiment. Specifically, in the determination of soil elements and physical and chemical properties, we randomly selected three samples, and their relative error was less than 5%. Notably, in the process of particle size determination, the instrument had an available size determination range of 0.01 μm to 2000 μm with a measurement error of ±2.5%. Additionally, the organic carbon and particle size data were automatically measured in triplicate on the machine, and the result was taken directly as the average of the three replicates. Through these quality control measures, we ensured the accuracy of the data.

3. Results

The results of this study indicated that the basic physical and chemical properties and the contents of various forms of iron, including total iron, free iron, silicate-bound iron, poorly crystalline iron, and crystalline iron, as well as their ratios, varied with soil profile depth. Furthermore, we also investigated the variation amounts and transformation rates of different forms of iron to quantify the migration, transformation process, and evolution characteristics of Quaternary red soils under different land use patterns.

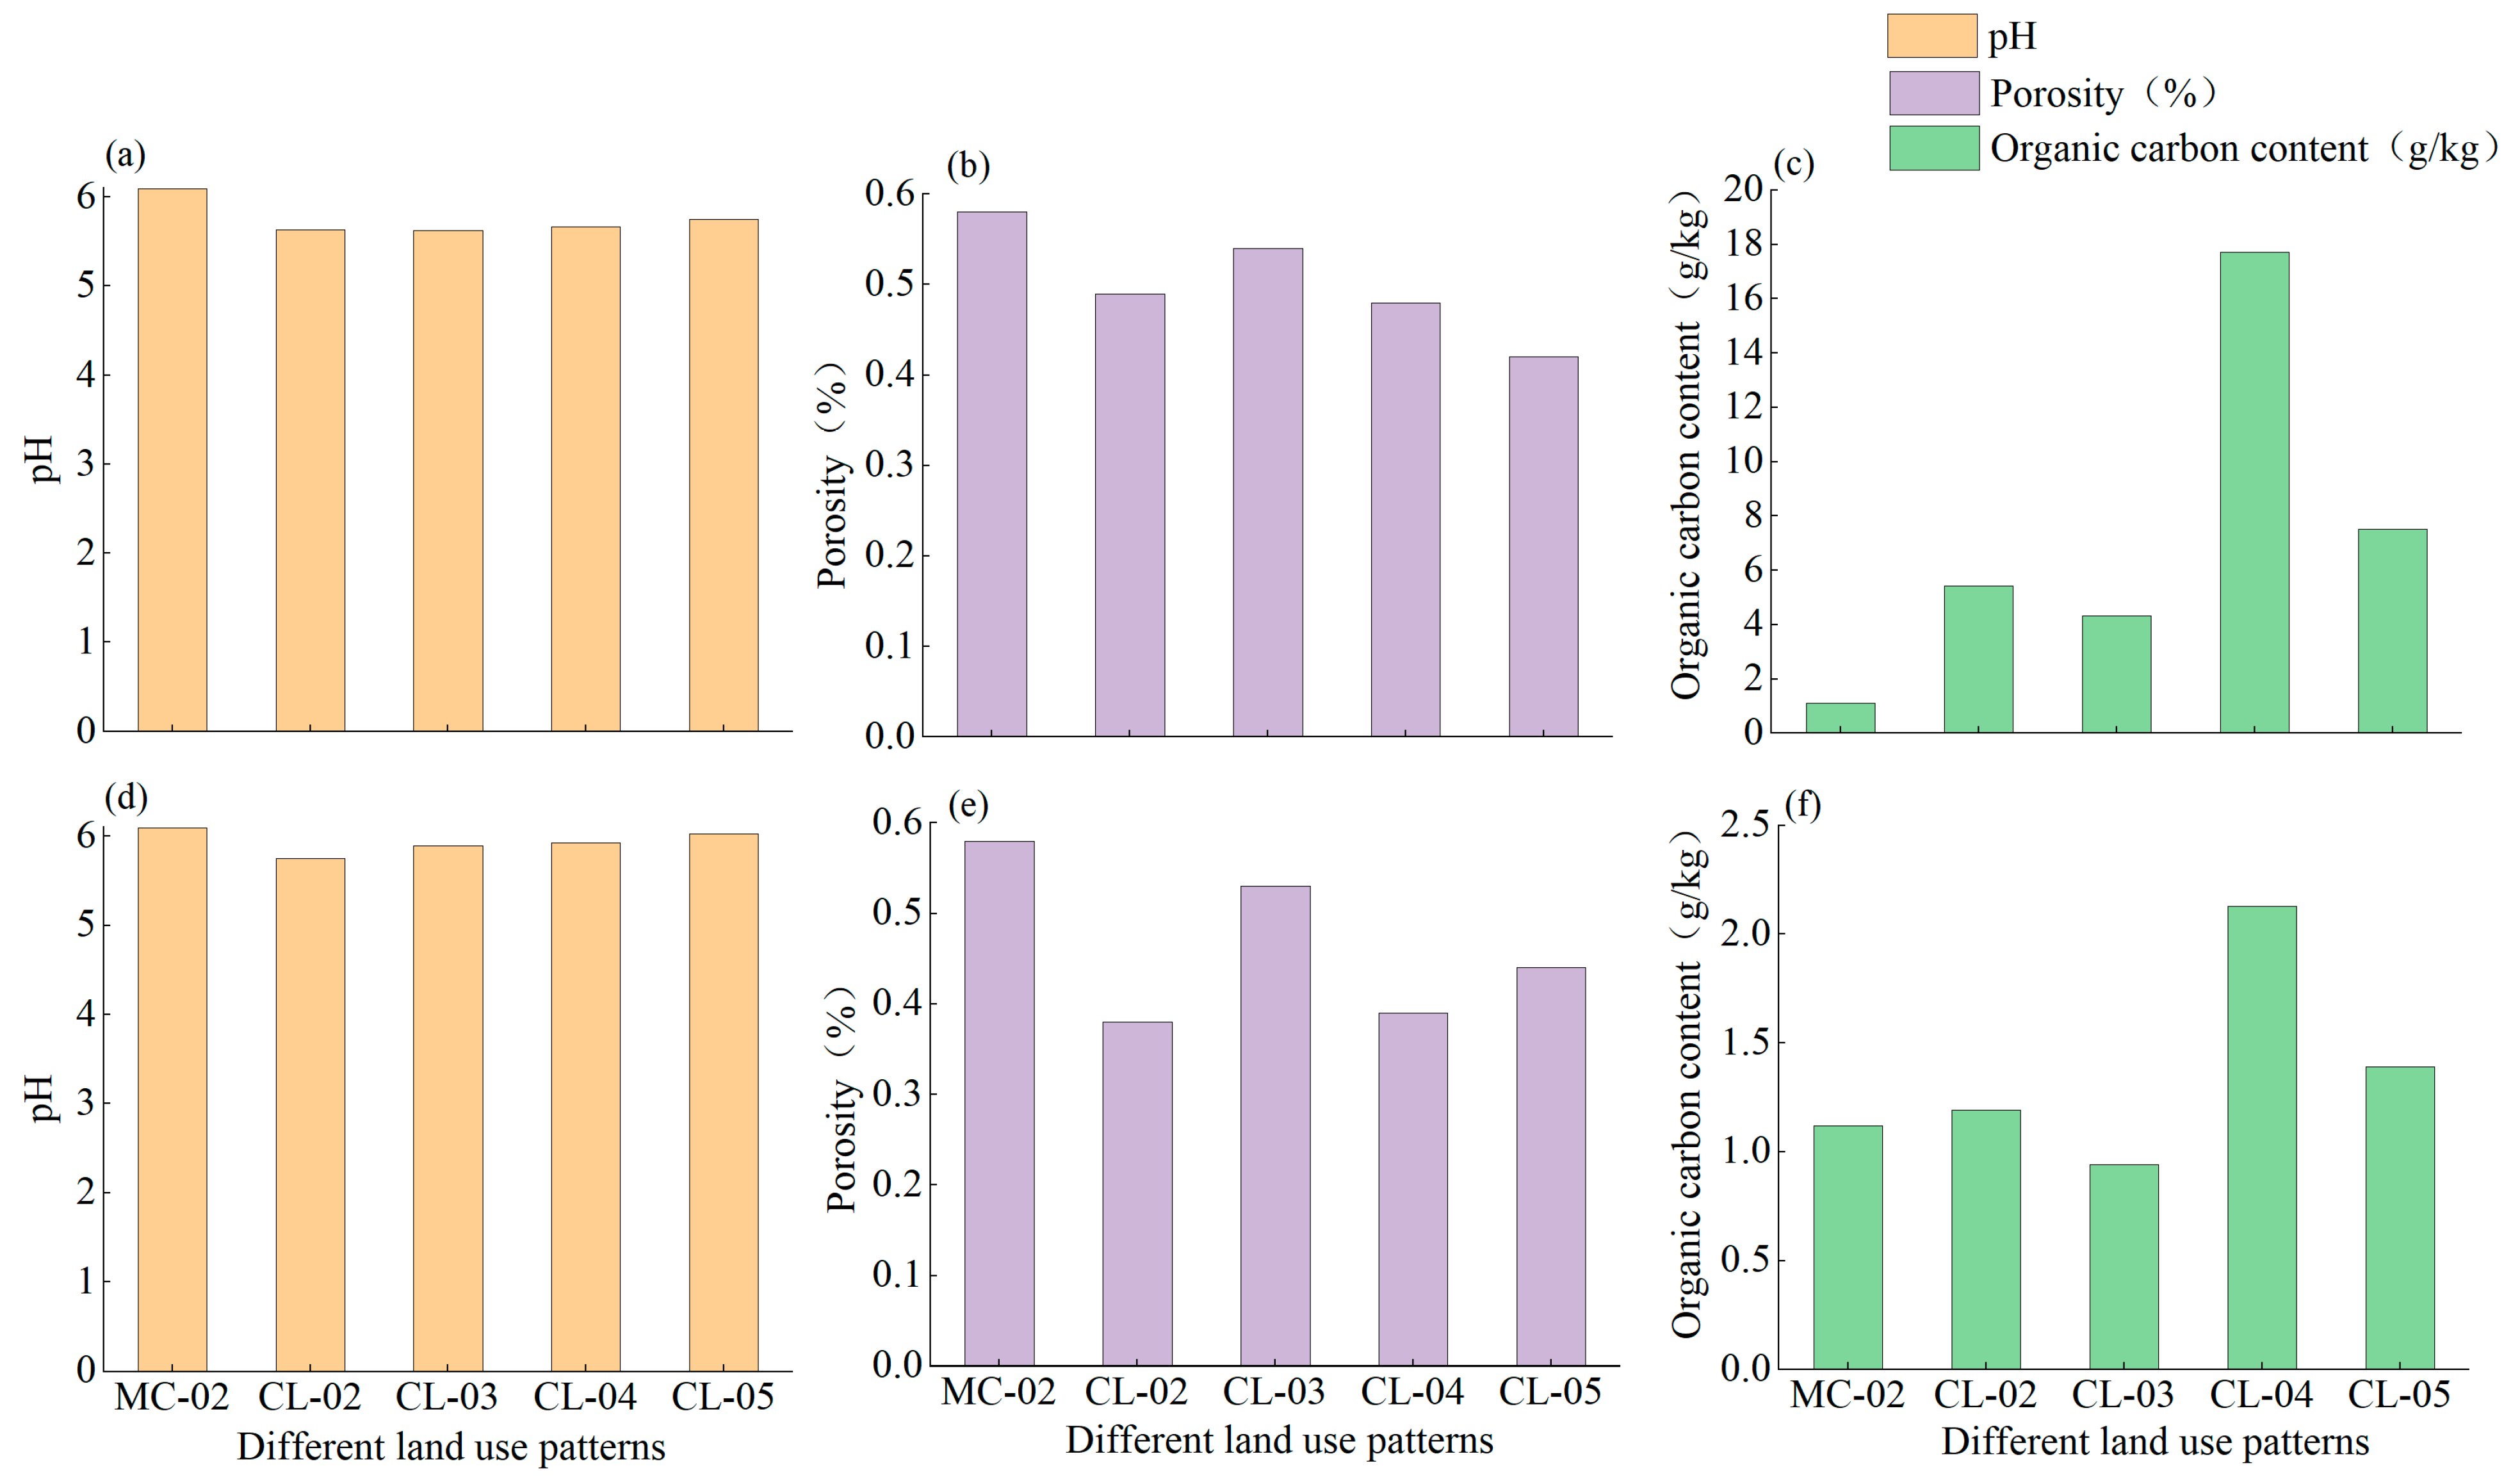
3.1. Basic Physical and Chemical Properties

Compared with the buried Quaternary red soil, the moisture content, bulk density, clay content, organic carbon, and total nitrogen increased after different land use patterns. The moisture content of unutilized MC-02 had the lowest level at 5.85%, presenting the order CL-04 > CL-05 > CL-02 > CL-03 > MC-02. The clay content of unutilized MC-02 had the lowest level at 23.18%, presenting the order CL-03 > CL-04 > CL-02 > CL-05 > MC-02. The pH of unutilized MC-02 had the highest level at 6.09, presenting the order MC-02 > CL-05 > CL-04 > CL-03 > CL-02 (Table 1).

3.2. Iron Composition Characteristics of Quaternary Red Soils under Different Land Use Patterns

3.2.1. Variation Characteristics of Iron Content in Different Forms with Soil Depth

(1)
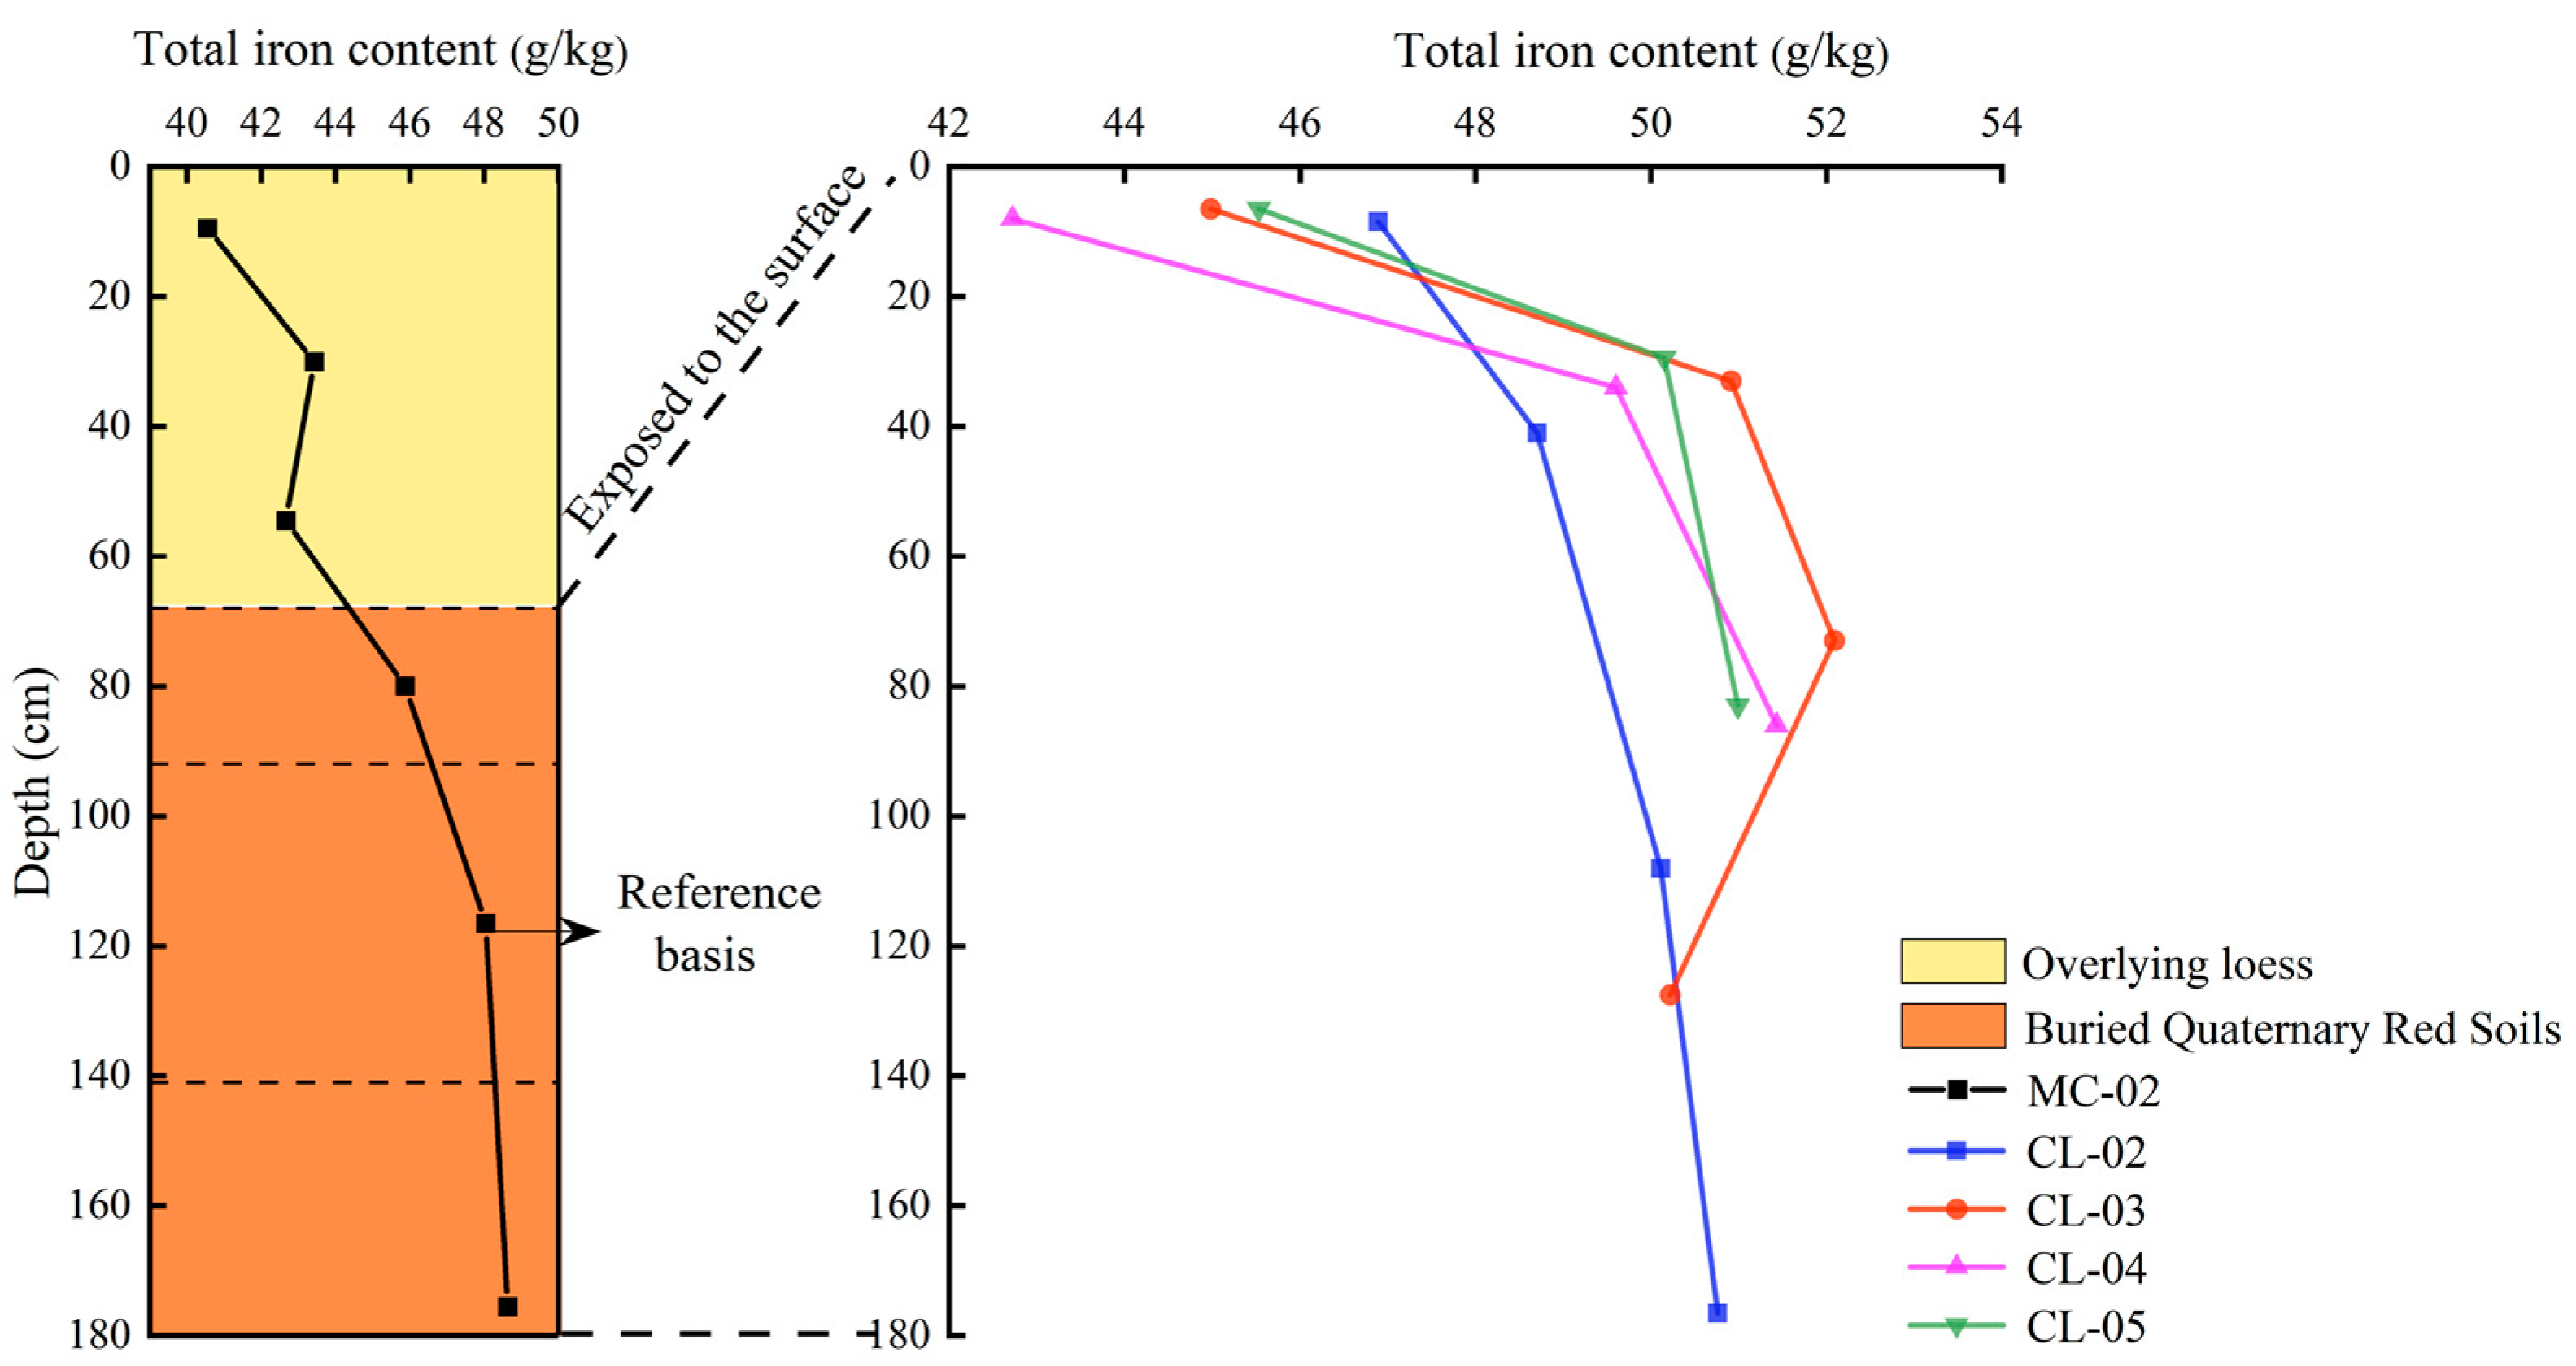
Variation characteristics of total iron content with profile depth
The average total iron content of unutilized MC-02 had the lowest level at 48.04 g/kg, accompanied by a coefficient of variation of 3.06%. This statistic indicates a consistent distribution of total iron throughout the profile (Figure 3). In contrast, the total iron content of Quaternary red soils, influenced by varying land use patterns, was elevated, ranging from 49.67 to 50.47 g/kg. This increase was accompanied by a wider variation range, reflected in coefficients of variation between 3.49% and 9.58%. Notably, the most significant fluctuation in total iron content was documented in the CL-04 profile. Compared with MC-02, the total iron content in the topsoil layer of Quaternary red soils under different land use patterns decreased, while it increased in the subsoil layer. Specifically, the iron content followed the pattern MC-02 > CL-02 > CL-05 > CL-03 > CL-04 in the topsoil and CL-03 > CL-04 > CL-05 > CL-02 > MC-02 in the subsoil.
(2)
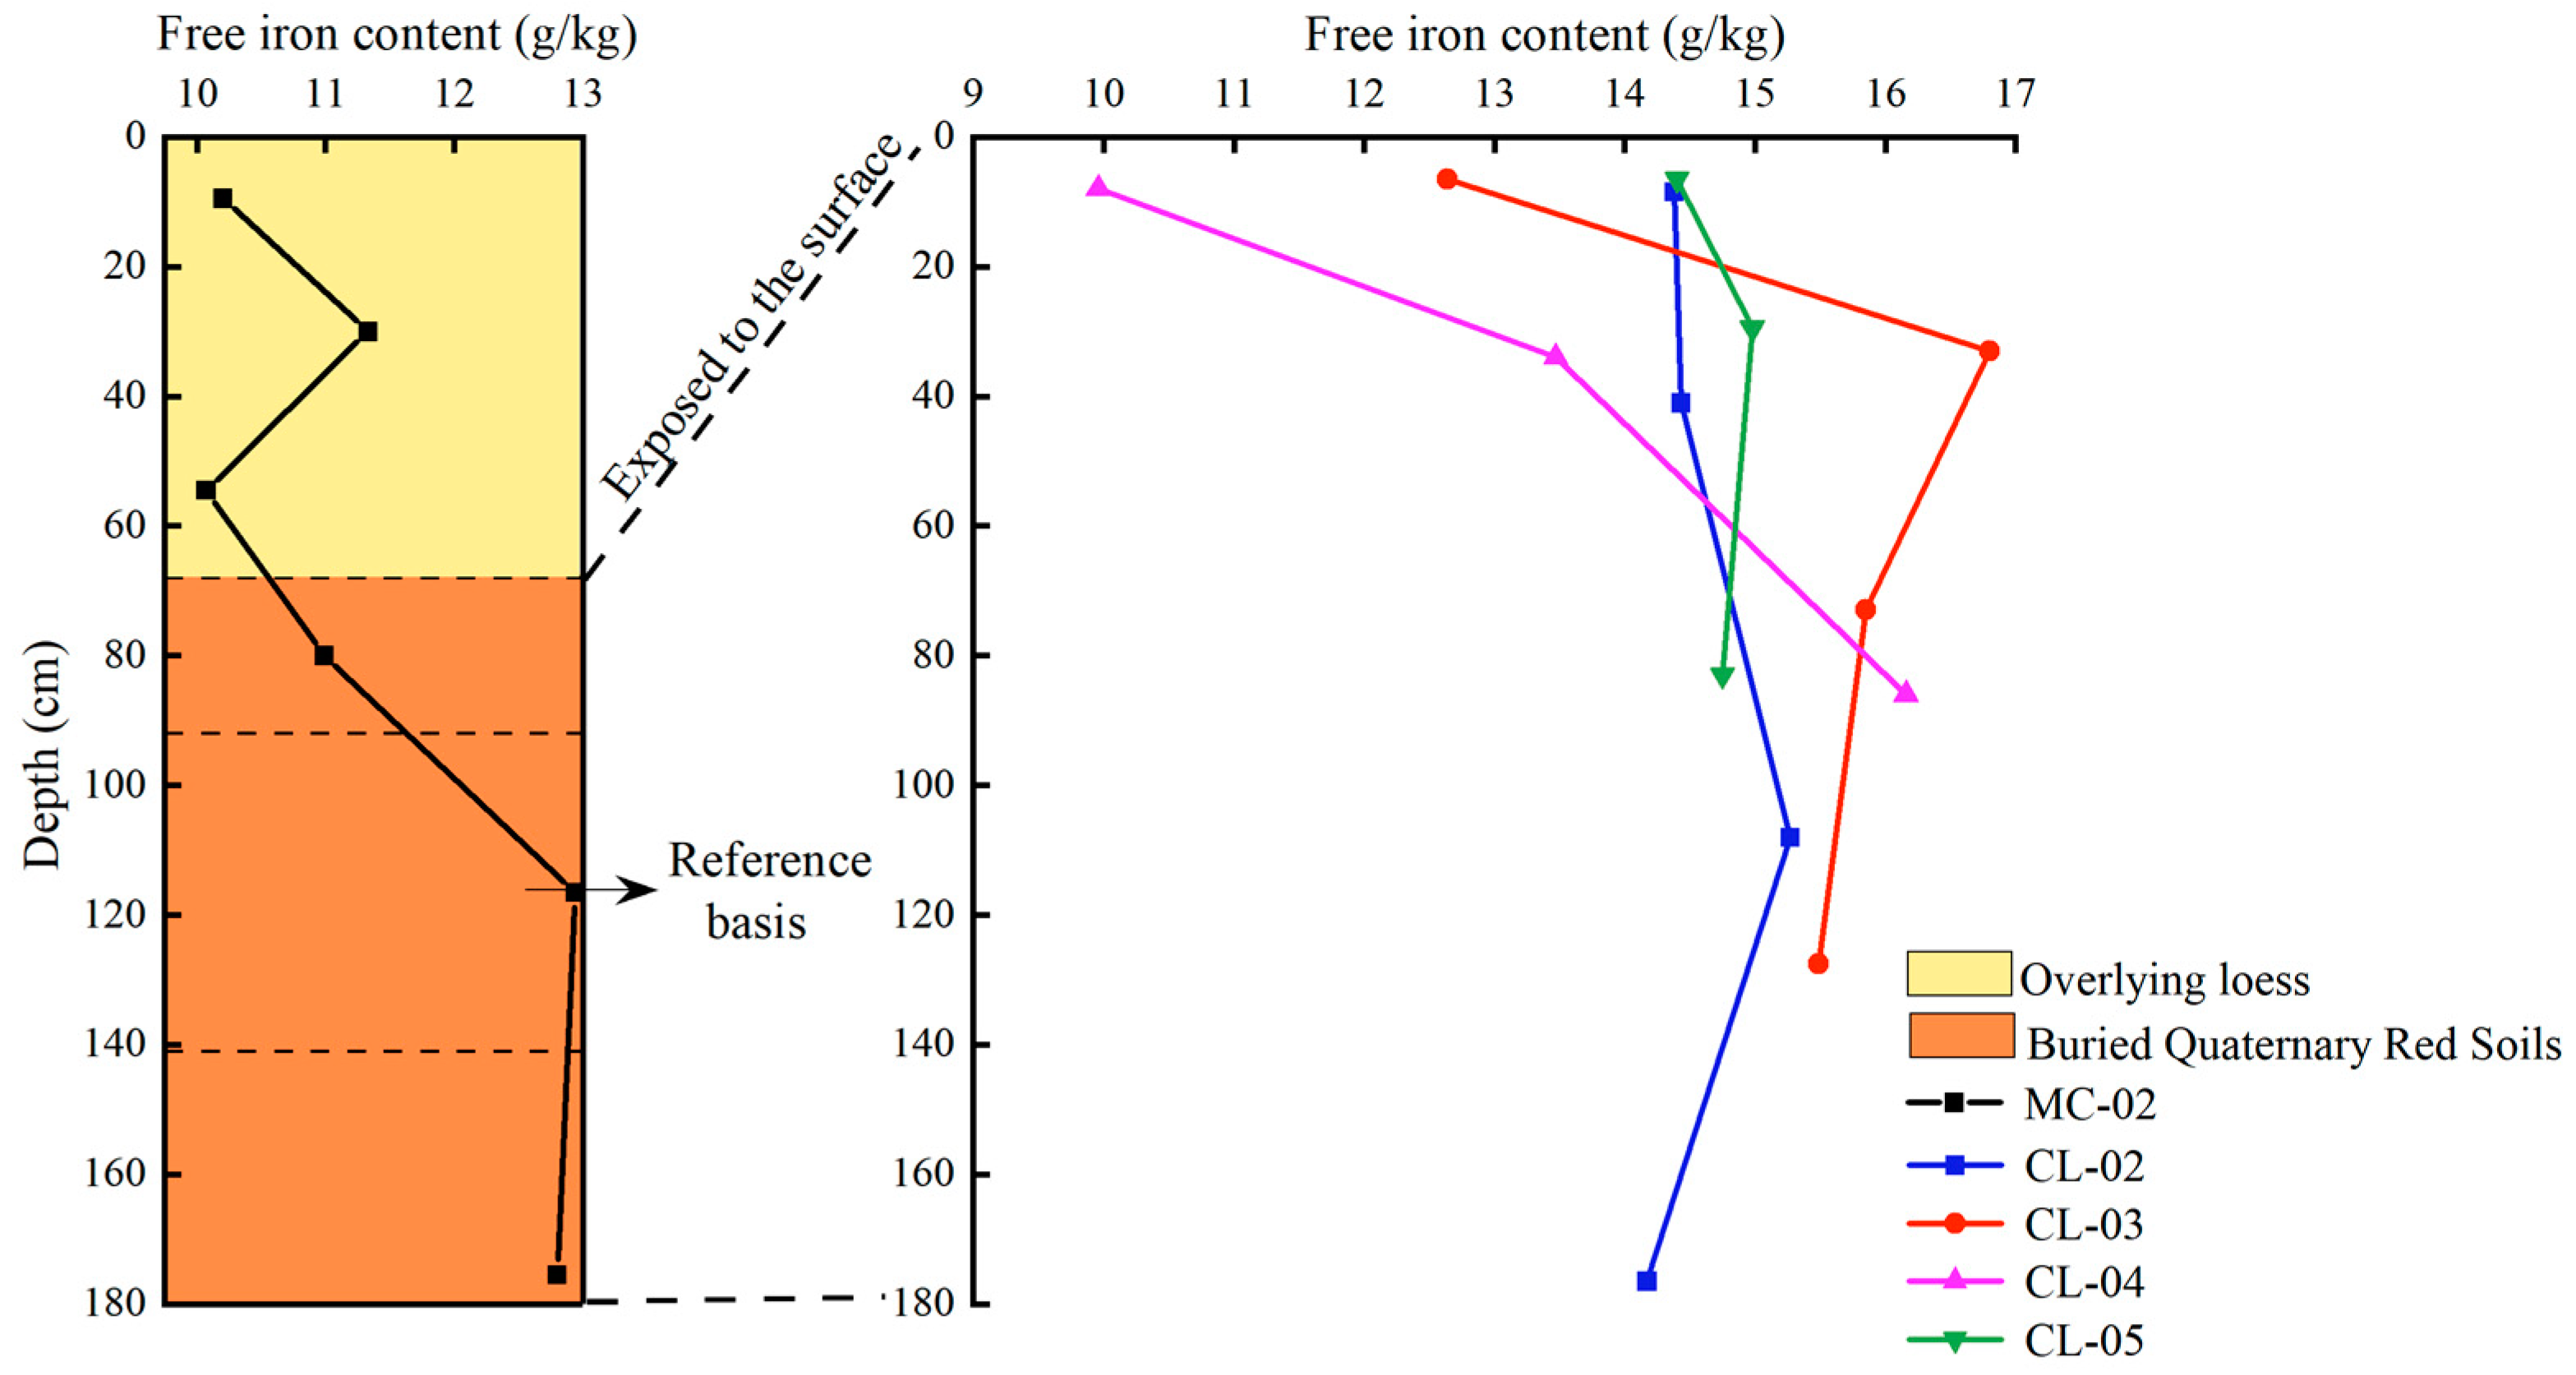
Variation of free iron content with profile depth
The average content of free iron in the unaffected MC-02 profile was the lowest at 12.94 g/kg, exhibiting a coefficient of variation of 8.88%. This suggested a narrow variation range of free iron throughout the profile, as illustrated in Figure 4. Following the influence of various land use activities on the surface, the content of free iron in the Quaternary red soil profile escalated. Among the affected profiles, CL-02 and CL-05 displayed variation coefficients of 3.33% and 1.99%, respectively. CL-03 demonstrated a broader variation range, reflected in a coefficient of variation of 11.79%, while CL-04 had the highest variation coefficient at 23.56%. Notably, CL-04 exhibited the greatest variability. In comparison to MC-02, the free iron content rose in the topsoil layers of CL-02 and CL-05 but decreased in the topsoil of CL-03 and CL-04. Conversely, the free iron content in the subsoil layers of all profiles increased, presenting the order CL-03 > CL-04 > CL-05 > CL-02 > MC-02.
(3)
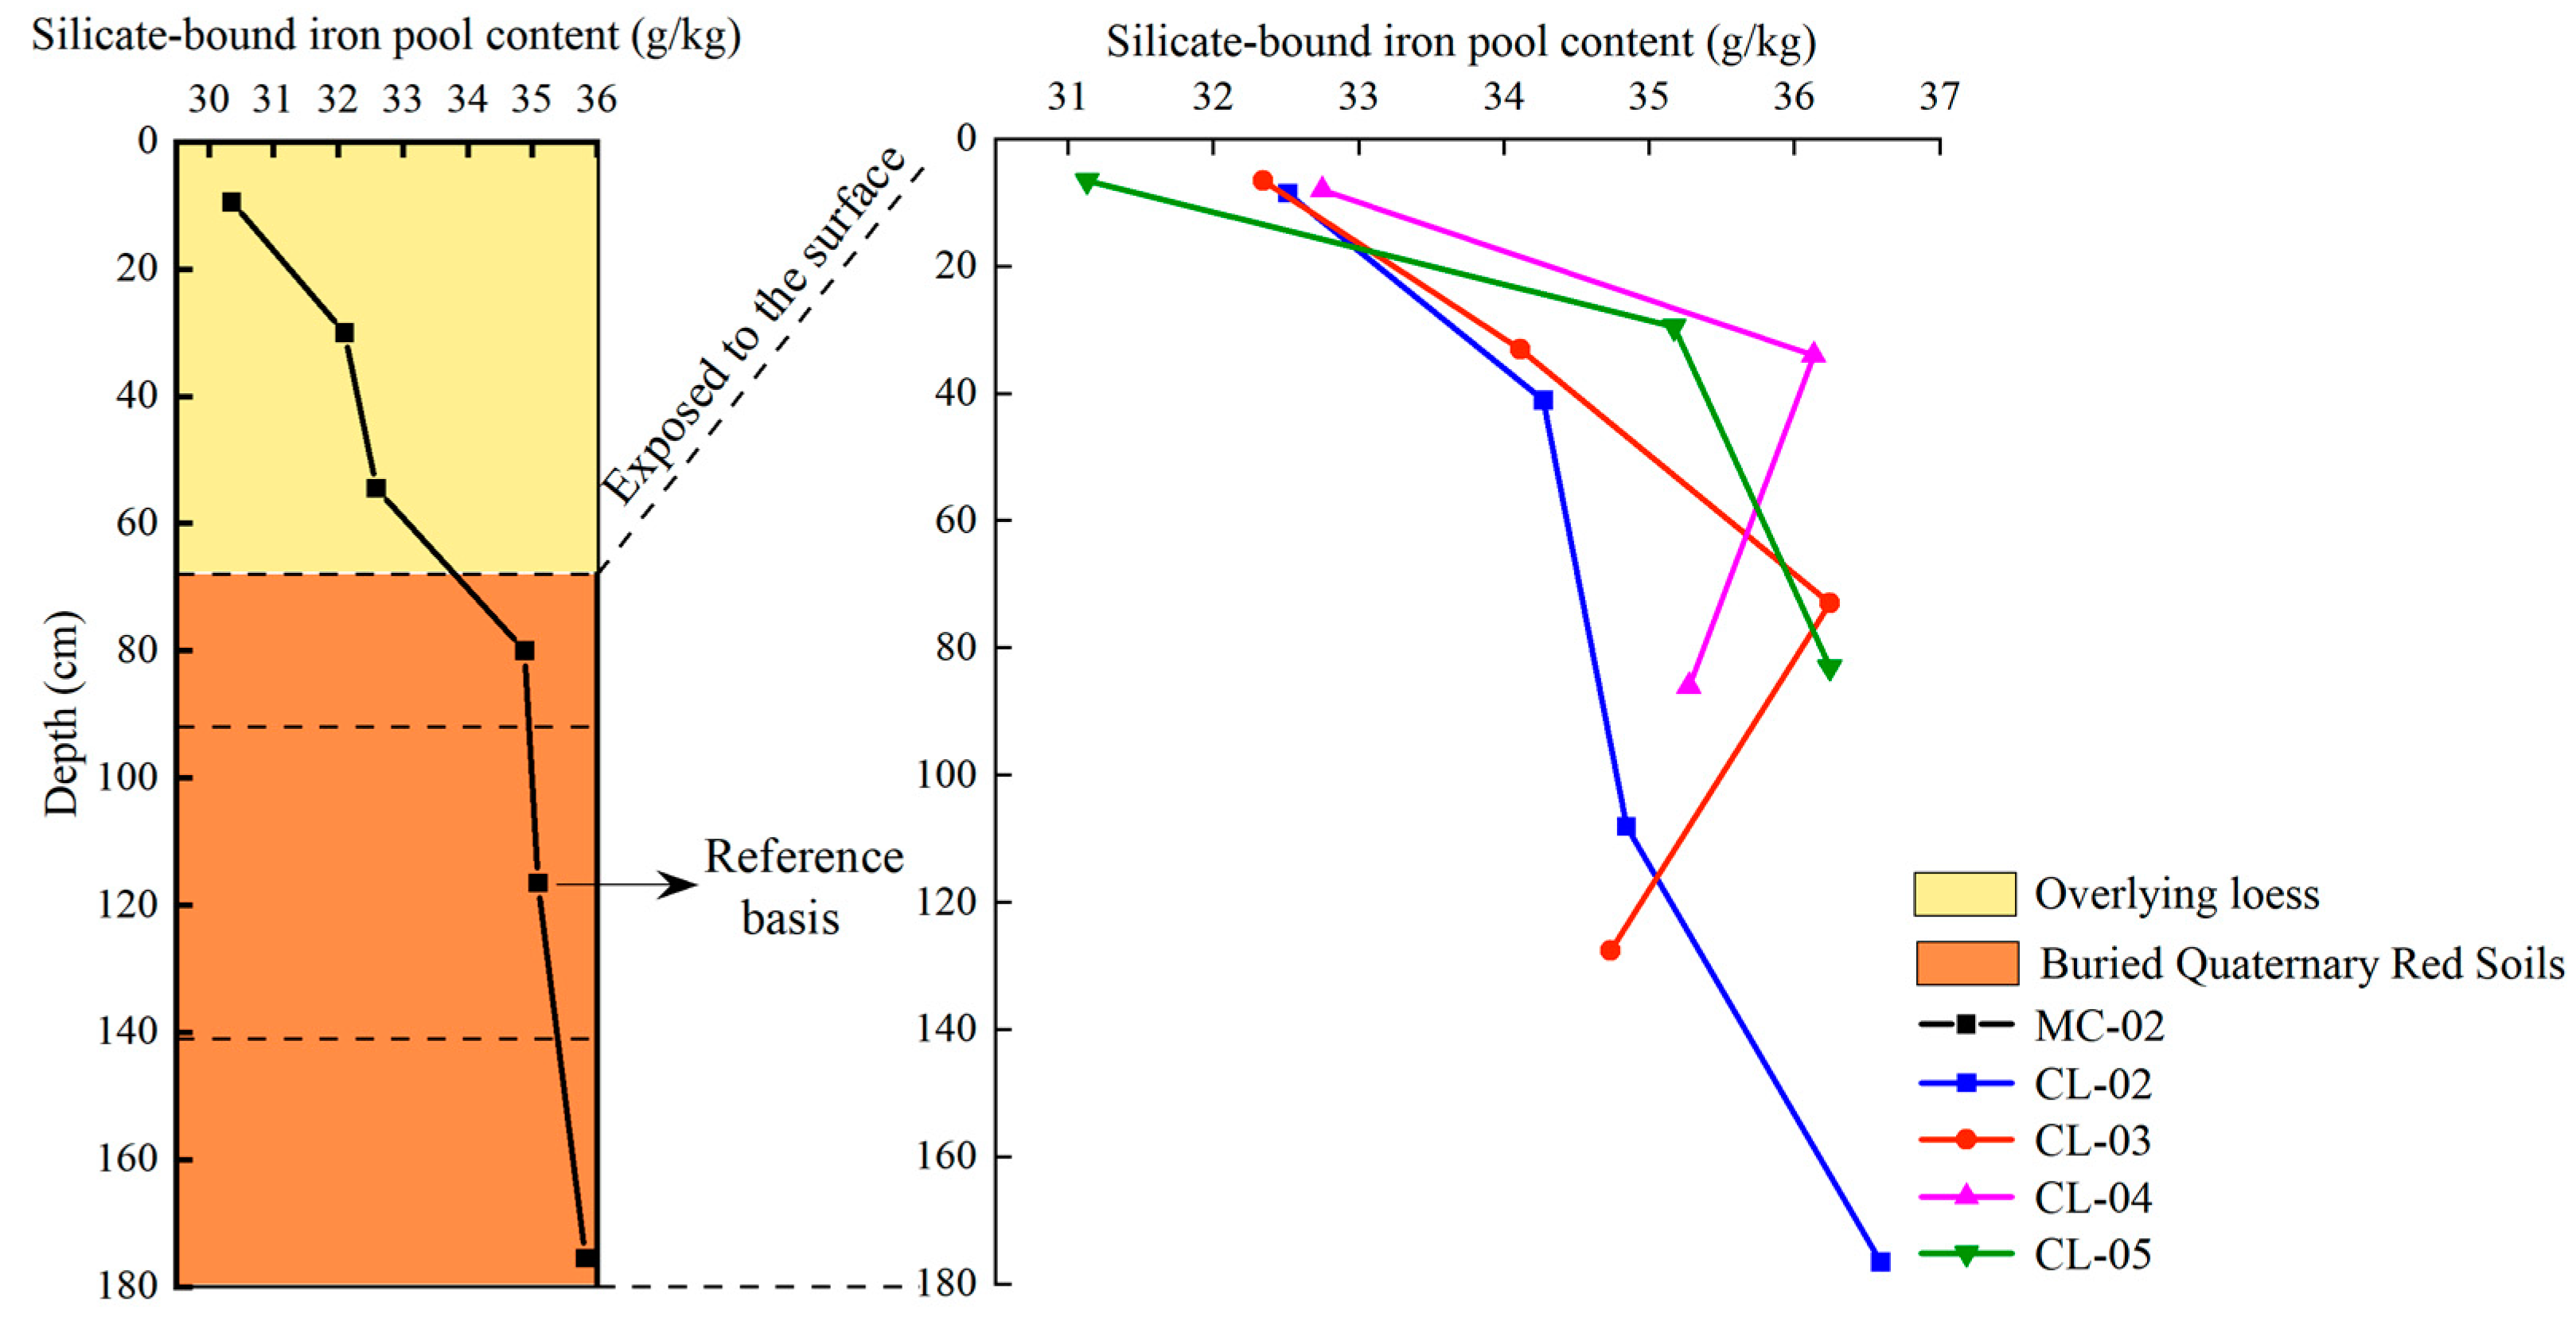
Variation of silicate-bound iron pool content with profile depth
The average content of the silicate-bound iron pool in unused MC-02 was notably higher at 35.09 g/kg, accompanied by a very low coefficient of variation of 1.04%. This indicated minimal variation in the silicate-bound iron pool throughout the profile under consideration (Figure 5). However, under the impact of various land use activities, the content of this iron pool decreased. The coefficients of variation ranged between 4.70% and 7.89%, pointing to an increase in variation range. Among the profiles, CL-05 exhibited the highest coefficient of variation at 7.89%, signifying the greatest variation. In comparison to MC-02, the silicate-bound iron pool content in the topsoil layers of Quaternary red soils under various land use patterns decreased, following the trend MC-02 > CL-04 > CL-02 > CL-03 > CL-05. As for the subsoil layers, the silicate-bound iron pool content rose in CL-05, CL-04, and CL-02 but decreased in CL-03.
(4)
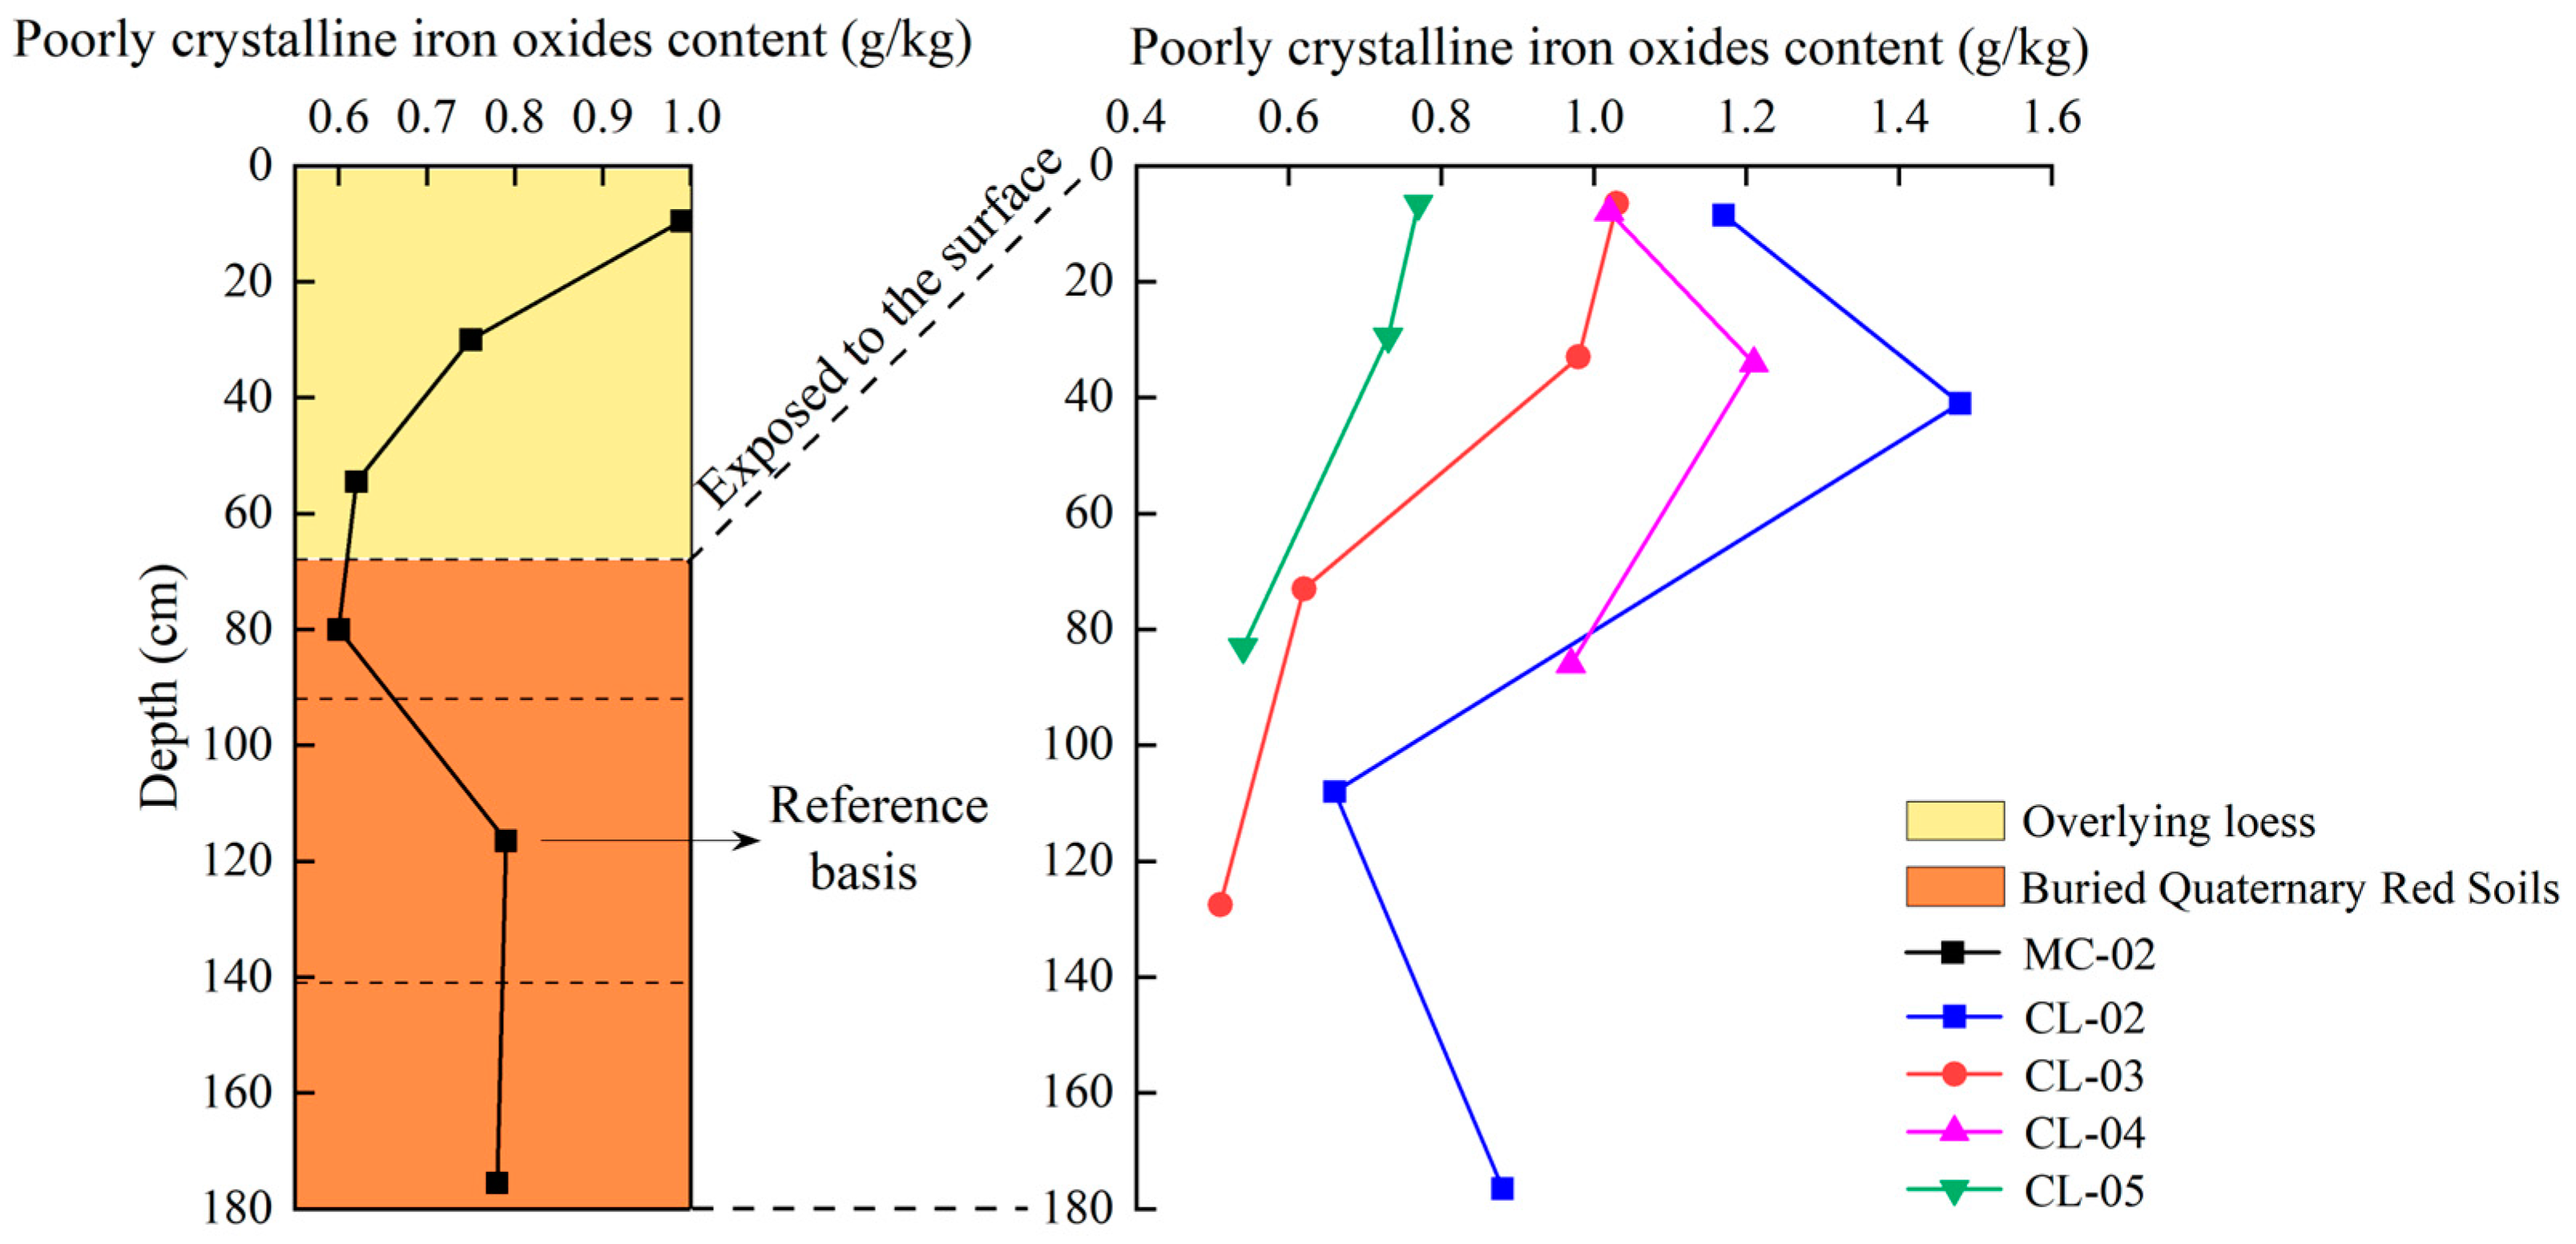
Variation characteristics of poorly crystalline iron oxides content with profile depth
The average content of poorly crystalline iron oxides in unused MC-02 was higher at 0.79 g/kg, accompanied by a coefficient of variation of 14.78%. This suggested a relatively small variation in the content of poorly crystalline iron oxides throughout the profile (Figure 6). In contrast, the average content of these oxides increased in CL-02 and CL-04, with coefficients of variation of 33.99% and 11.87%, respectively. However, in CL-03 and CL-05, the average content decreased, with coefficients of variation of 32.97% and 18.07%, respectively. Compared with MC-02, the content of poorly crystalline iron oxides rose in the topsoil layers of CL-02, CL-03, and CL-04, with CL-02 exhibiting the highest content. Conversely, the content decreased in the topsoil layer of CL-05. As for the subsoil layers, the content of poorly crystalline iron oxides increased in CL-02 and CL-04 but decreased in CL-03 and CL-05, resulting in the following order: CL-04 > CL-02 > MC-02 > CL-03 > CL-05.
(5)
Variation characteristics of crystalline oxides content with profile depth
The unutilized MC-02 soil sample exhibited the lowest crystalline oxides content, measuring 12.15 g/kg, with a coefficient of variation of 8.51% (Figure 7). The contents of crystalline oxides in Quaternary red soils increased under various land use patterns. Specifically, the variation coefficients for CL-02, CL-03, and CL-05 ranged between 2.45% and 13.19%, indicating a relatively small variation range. In contrast, the crystalline oxides content of CL-04 increased with the profile depth, accompanied by a coefficient of variation of 25.73%.
In comparison to MC-02, the crystalline oxides content increased in the topsoil layers of CL-02 and CL-05 but decreased in CL-03 and CL-04. This resulted in the pattern CL-05 > CL-02 > MC-02 > CL-03 > CL-04. In the subsoil layers of Quaternary red soils under different land use patterns, the content of crystalline oxides increased, presenting the pattern CL-03 > CL-05 > CL-04 > CL-02 > MC-02.

3.2.2. Variation Characteristics of Iron Content Ratio between Different Forms in Quaternary Red Soils with Profile Depth

(1)
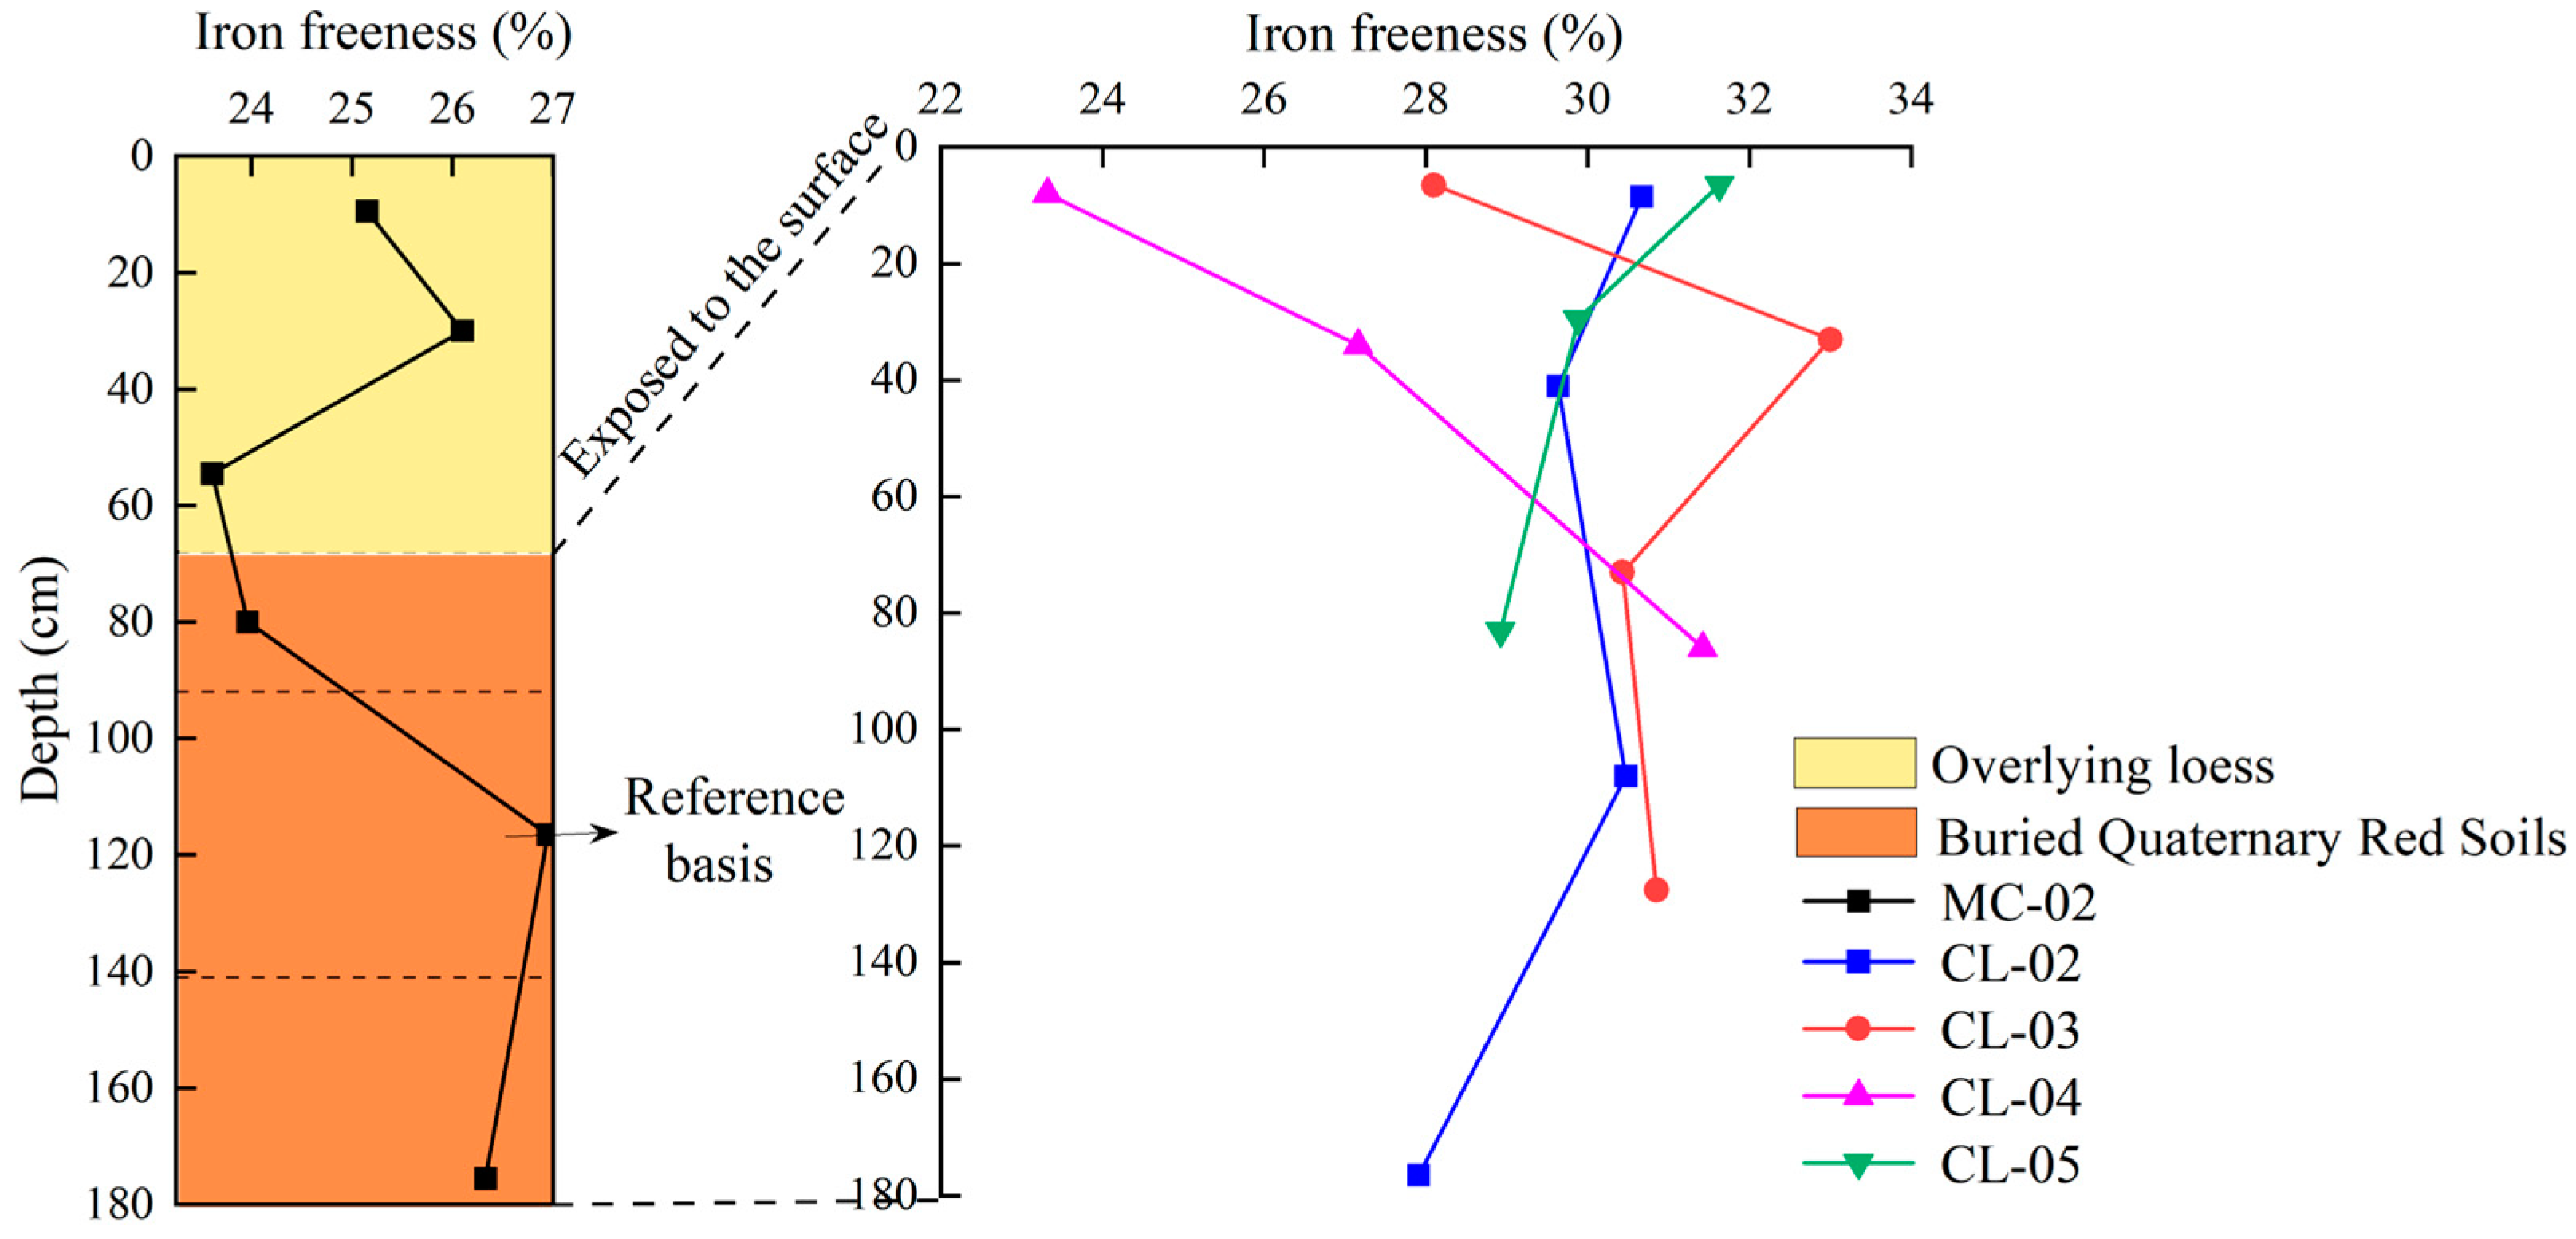
Variation characteristics of iron freeness with profile depth
The iron freeness in the unused MC-02 was the lowest, averaging 26.95% with a coefficient of variation of 6.13%, indicating a relatively narrow fluctuation range (Figure 8). Different land use activities influenced the iron freeness in the Quaternary red soils, causing it to increase to values ranging from 29.06% to 31%. The coefficient of variation spanned from 4.24% to 14.84%. Notably, CL-03 exhibited the highest iron freeness, while CL-04 demonstrated the greatest variation. In comparison to MC-02, the iron freeness decreased in the topsoil layer of CL-04 but increased in CL-02, CL-03, and CL-05. This resulted in the following pattern: CL-05 > CL-02 > CL-03 > MC-02 > CL-04. The iron freeness in the Quaternary red soils increased under various land use patterns, presenting the pattern CL-03 > CL-04 > CL-02 > CL-05 > MC-02.
(2)
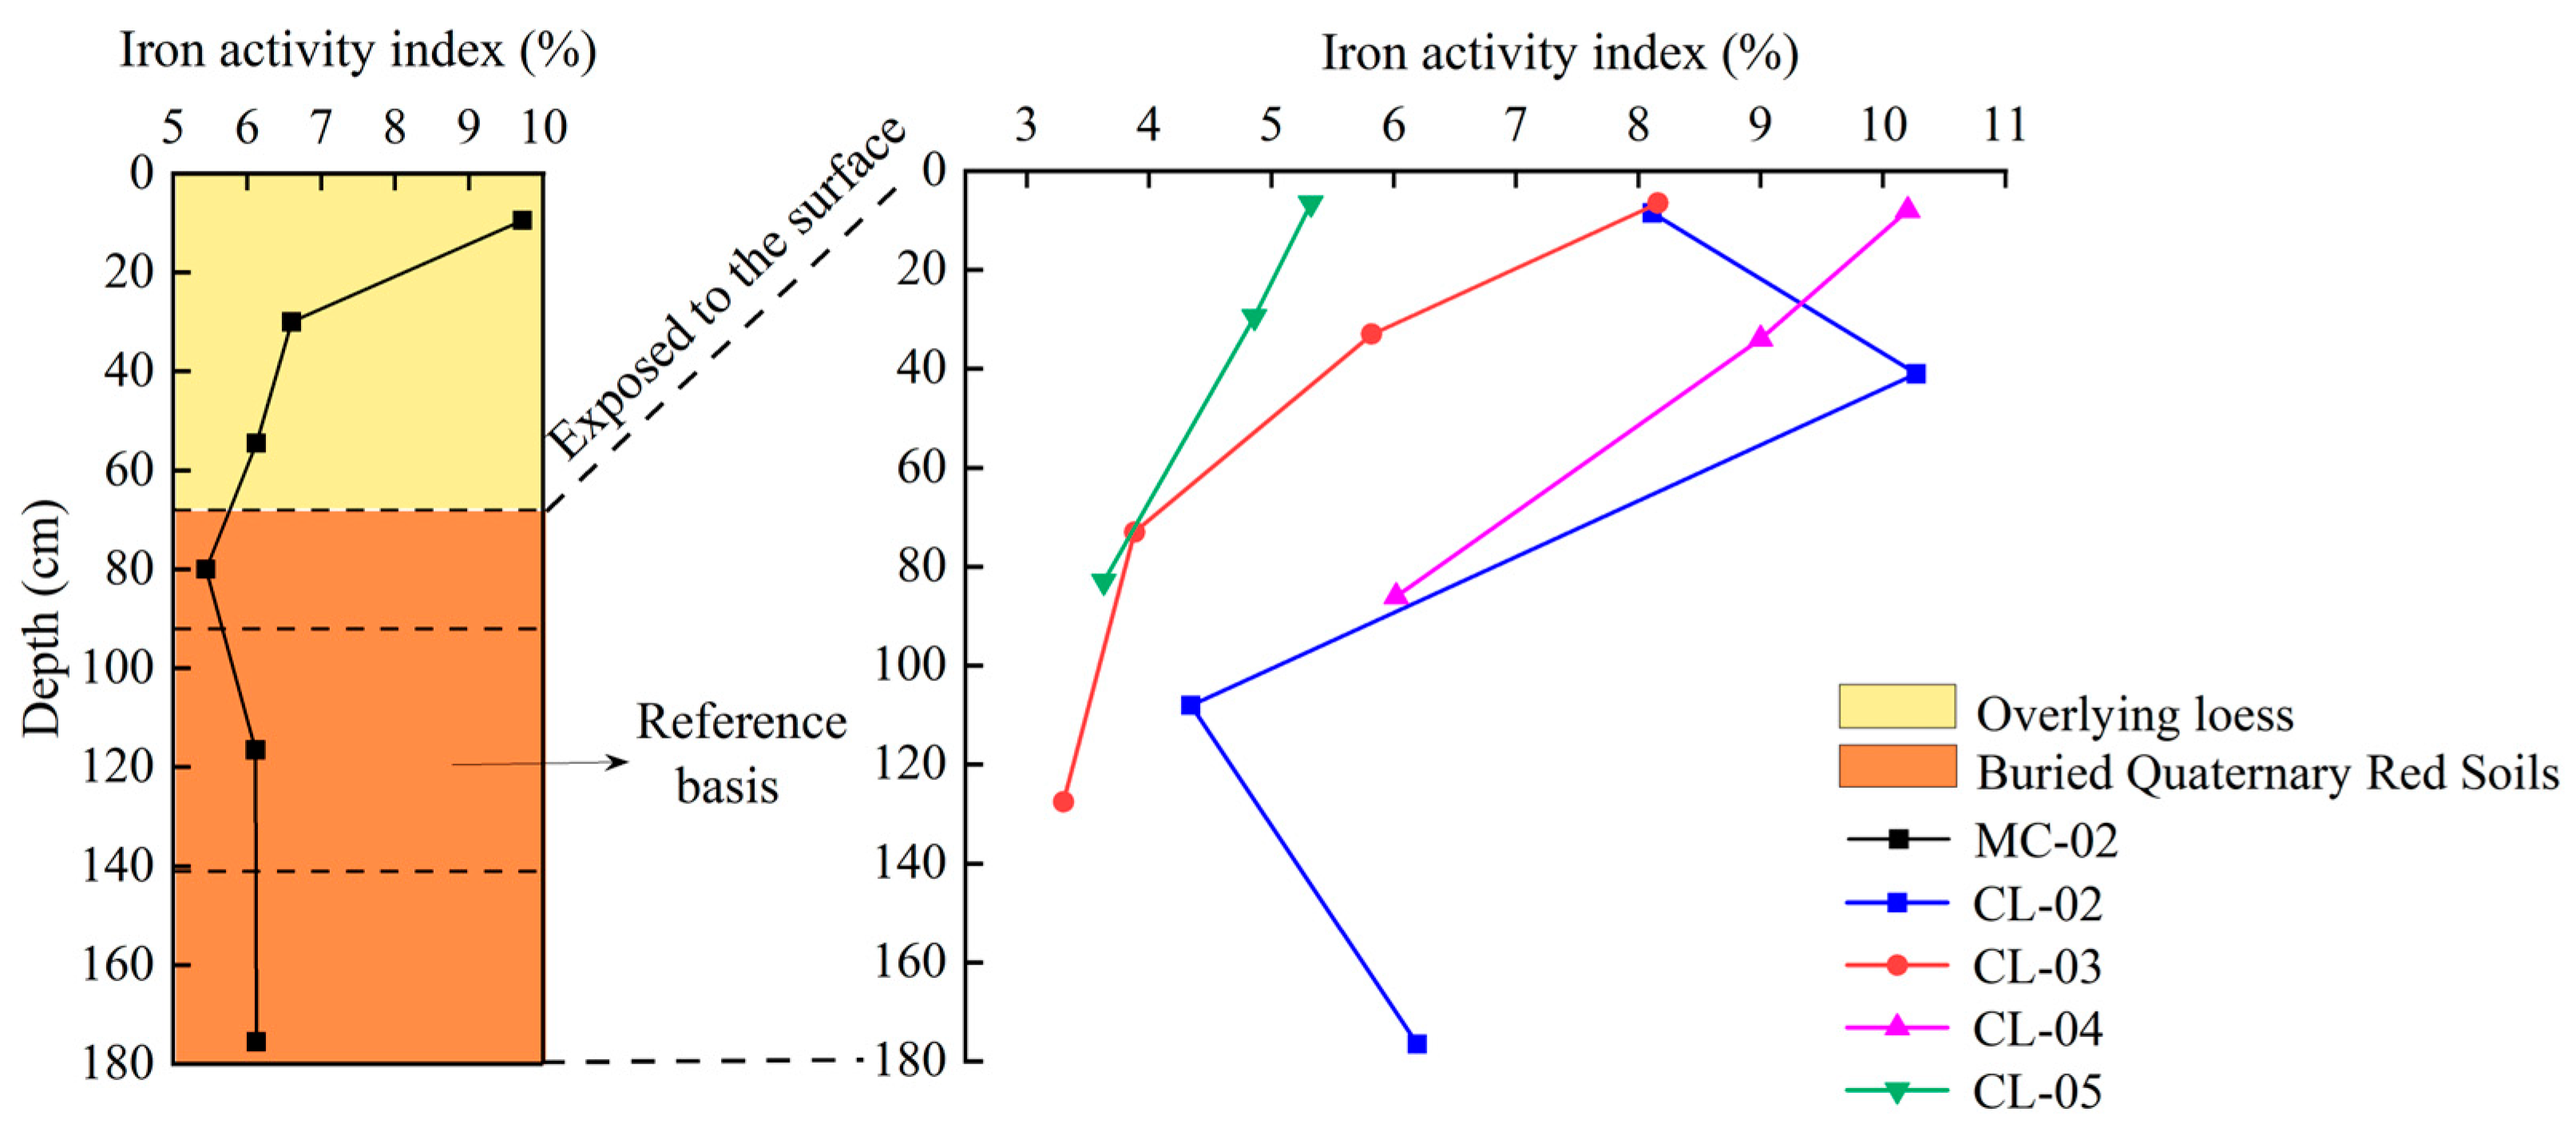
Variation characteristics of iron active index with profile depth
The iron active index of the unused MC-02 soil sample was higher, averaging 6.11% with a coefficient of variation of 6.62%, indicating minimal variation (Figure 9). The iron active index increased for CL-02 and CL-04 but decreased for CL-03 and CL-05. The coefficient of variation spanned from 18.98% to 41.51%, with CL-03 exhibiting the most significant change. Compared with MC-02, the iron active index increased in the topsoil layers of CL-02, CL-03, and CL-04, while it decreased for CL-05. This resulted in the following pattern: CL-04 > CL-03 > CL-02 > MC-02 > CL-05. In the subsoil layers, the iron active index increased for CL-02 and CL-04 but decreased for CL-03 and CL-05, presenting the pattern CL-04 > CL-02 > MC-02 > CL-03 > CL-05.
(3)
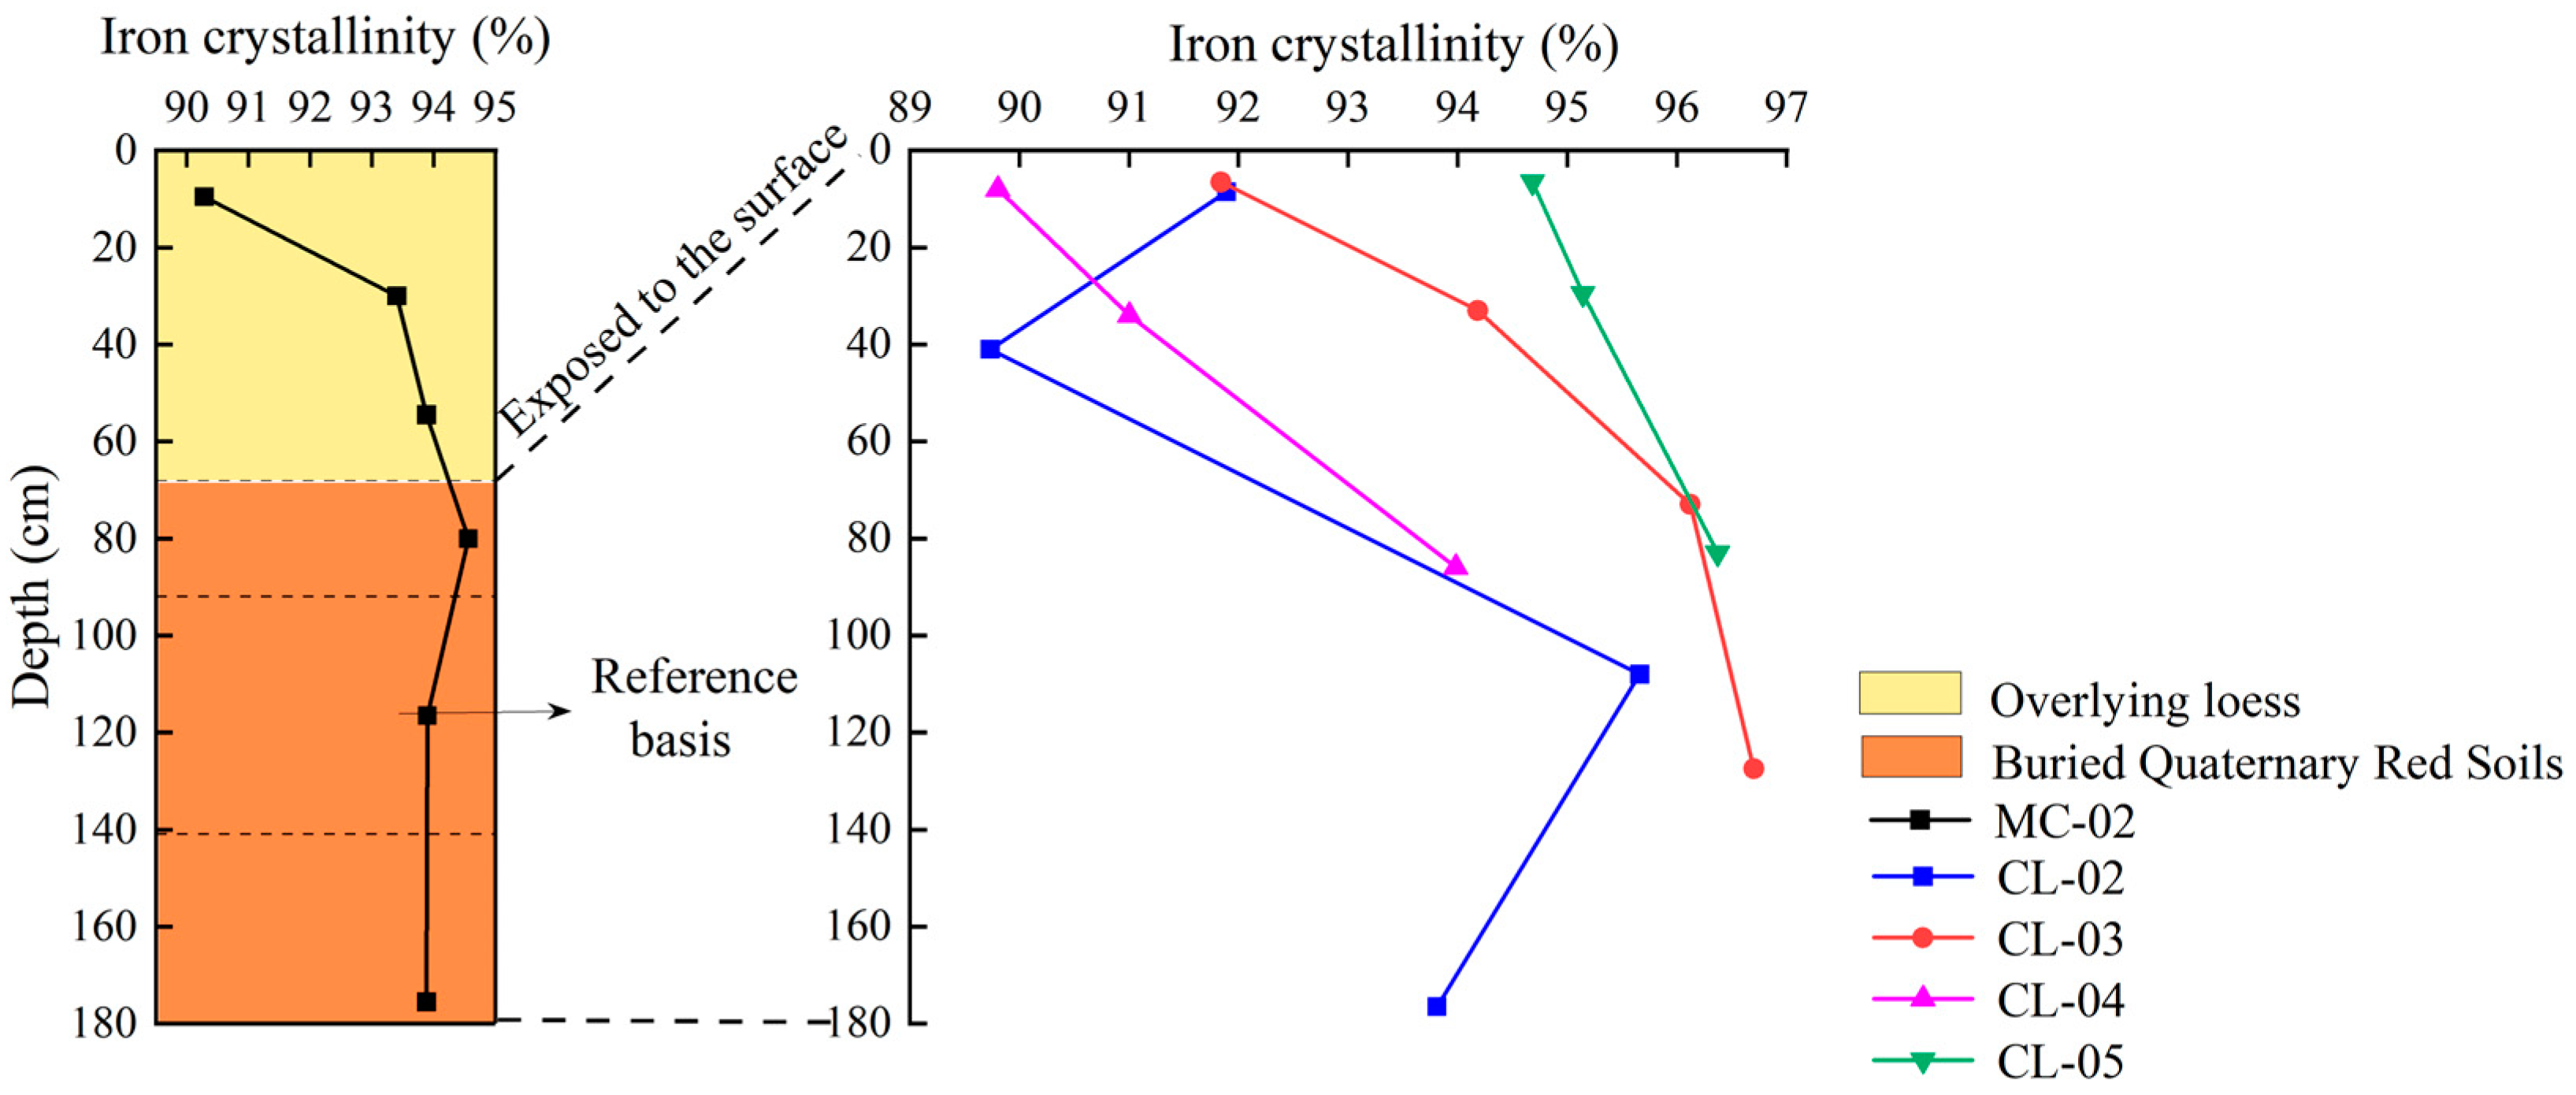
Variation characteristics of iron crystallinity with profile depth
The iron crystallinity of MC-02 was notably higher, averaging 93.89% with a minimal coefficient of variation of 0.41%, indicating the smallest fluctuation range (Figure 10). The crystallinity increased for CL-03 and CL-05, while it decreased for CL-02 and CL-04. The crystallinity spanned from 92.53% to 95.85%, and the coefficient of variation ranged from 0.92% to 2.75%. Among these samples, CL-05 exhibited the highest crystallinity, while CL-02 demonstrated the greatest variation.
Compared with MC-02, the iron crystallinity of the topsoil layer increased for only CL-05, while it decreased for CL-02, CL-03, and CL-04. This resulted in the following pattern: CL-05 > MC-02 > CL-02 > CL-03 > CL-04. In the subsoil layers, the iron crystallinity increased for CL-05 and CL-03 but fell for CL-02 and CL-04, presenting the pattern CL-05 > CL-03 > MC-02 > CL-02 > CL-04.

3.3. Changes of Iron in Different Forms of Quaternary Red Soils

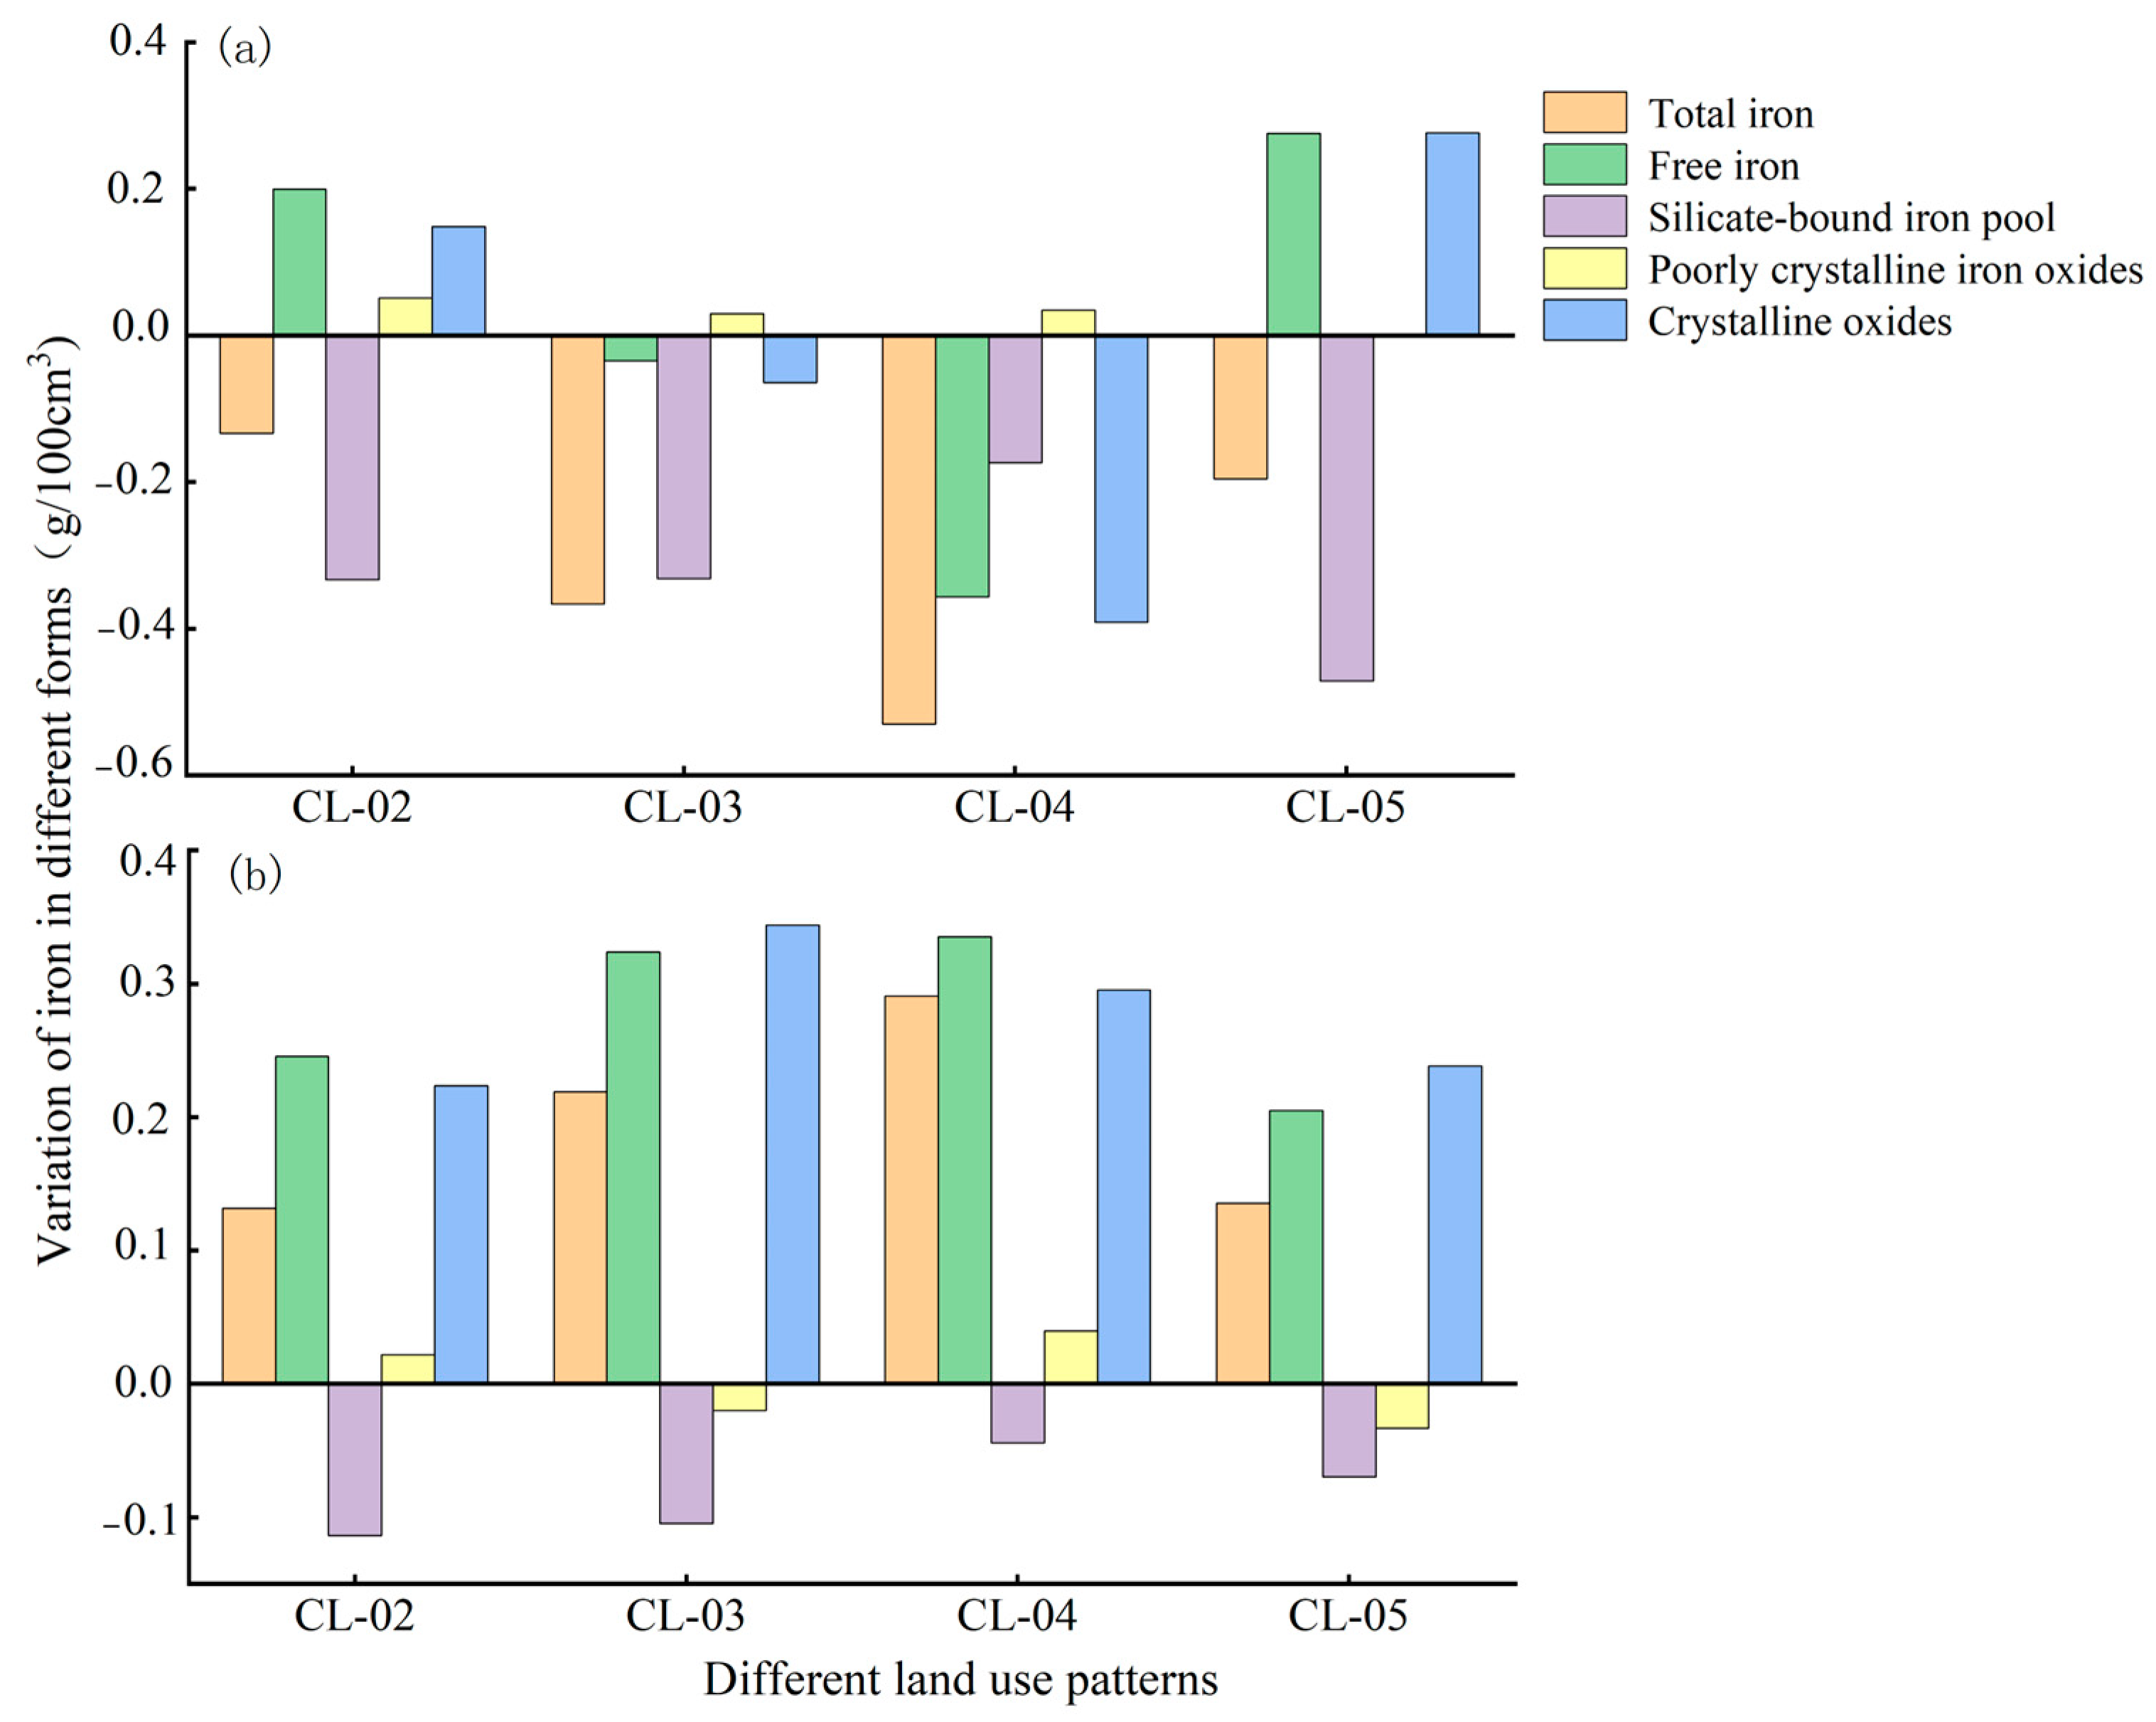
3.3.1. Loss/Gain Characteristics of Iron in Different Forms

Using a soil reconstruction model, we assessed the changes in various forms of iron in Quaternary red soils under different land use patterns in comparison with MC-02. The results (Figure 11) indicated that the total iron and silicate-bound iron content in the topsoil of the Quaternary red soils decreased across all land use patterns. The largest loss in total iron content was observed in CL-04, amounting to 0.53 g/100 cm3, while the silicate-bound iron pool showed the biggest loss in CL-05, at 0.47 g/100 cm3. The topsoil’s free iron and crystalline oxides decreased in CL-03 and CL-04 but increased in CL-02 and CL-05. Poorly crystalline oxides increased in CL-02, CL-03, and CL-04 but decreased in CL-05.
Compared with MC-02, total iron, free iron, and crystalline oxides increased in the Quaternary red soils across all land use patterns, while the silicate-bound iron pool decreased. The largest gains in total iron and free iron in the subsoil layer were noted in CL-04, at 0.29 g/100 cm3 and 0.34 g/100 cm3, respectively. Crystalline oxides showed the biggest gains in CL-03, reaching 0.34 g/100 cm3. Silicate-bound iron decreased most significantly in CL-02, by 0.11 g/100 cm3. Poorly crystalline iron oxides increased in the subsoil of CL-02 and CL-04 but decreased in CL-03 and CL-05.

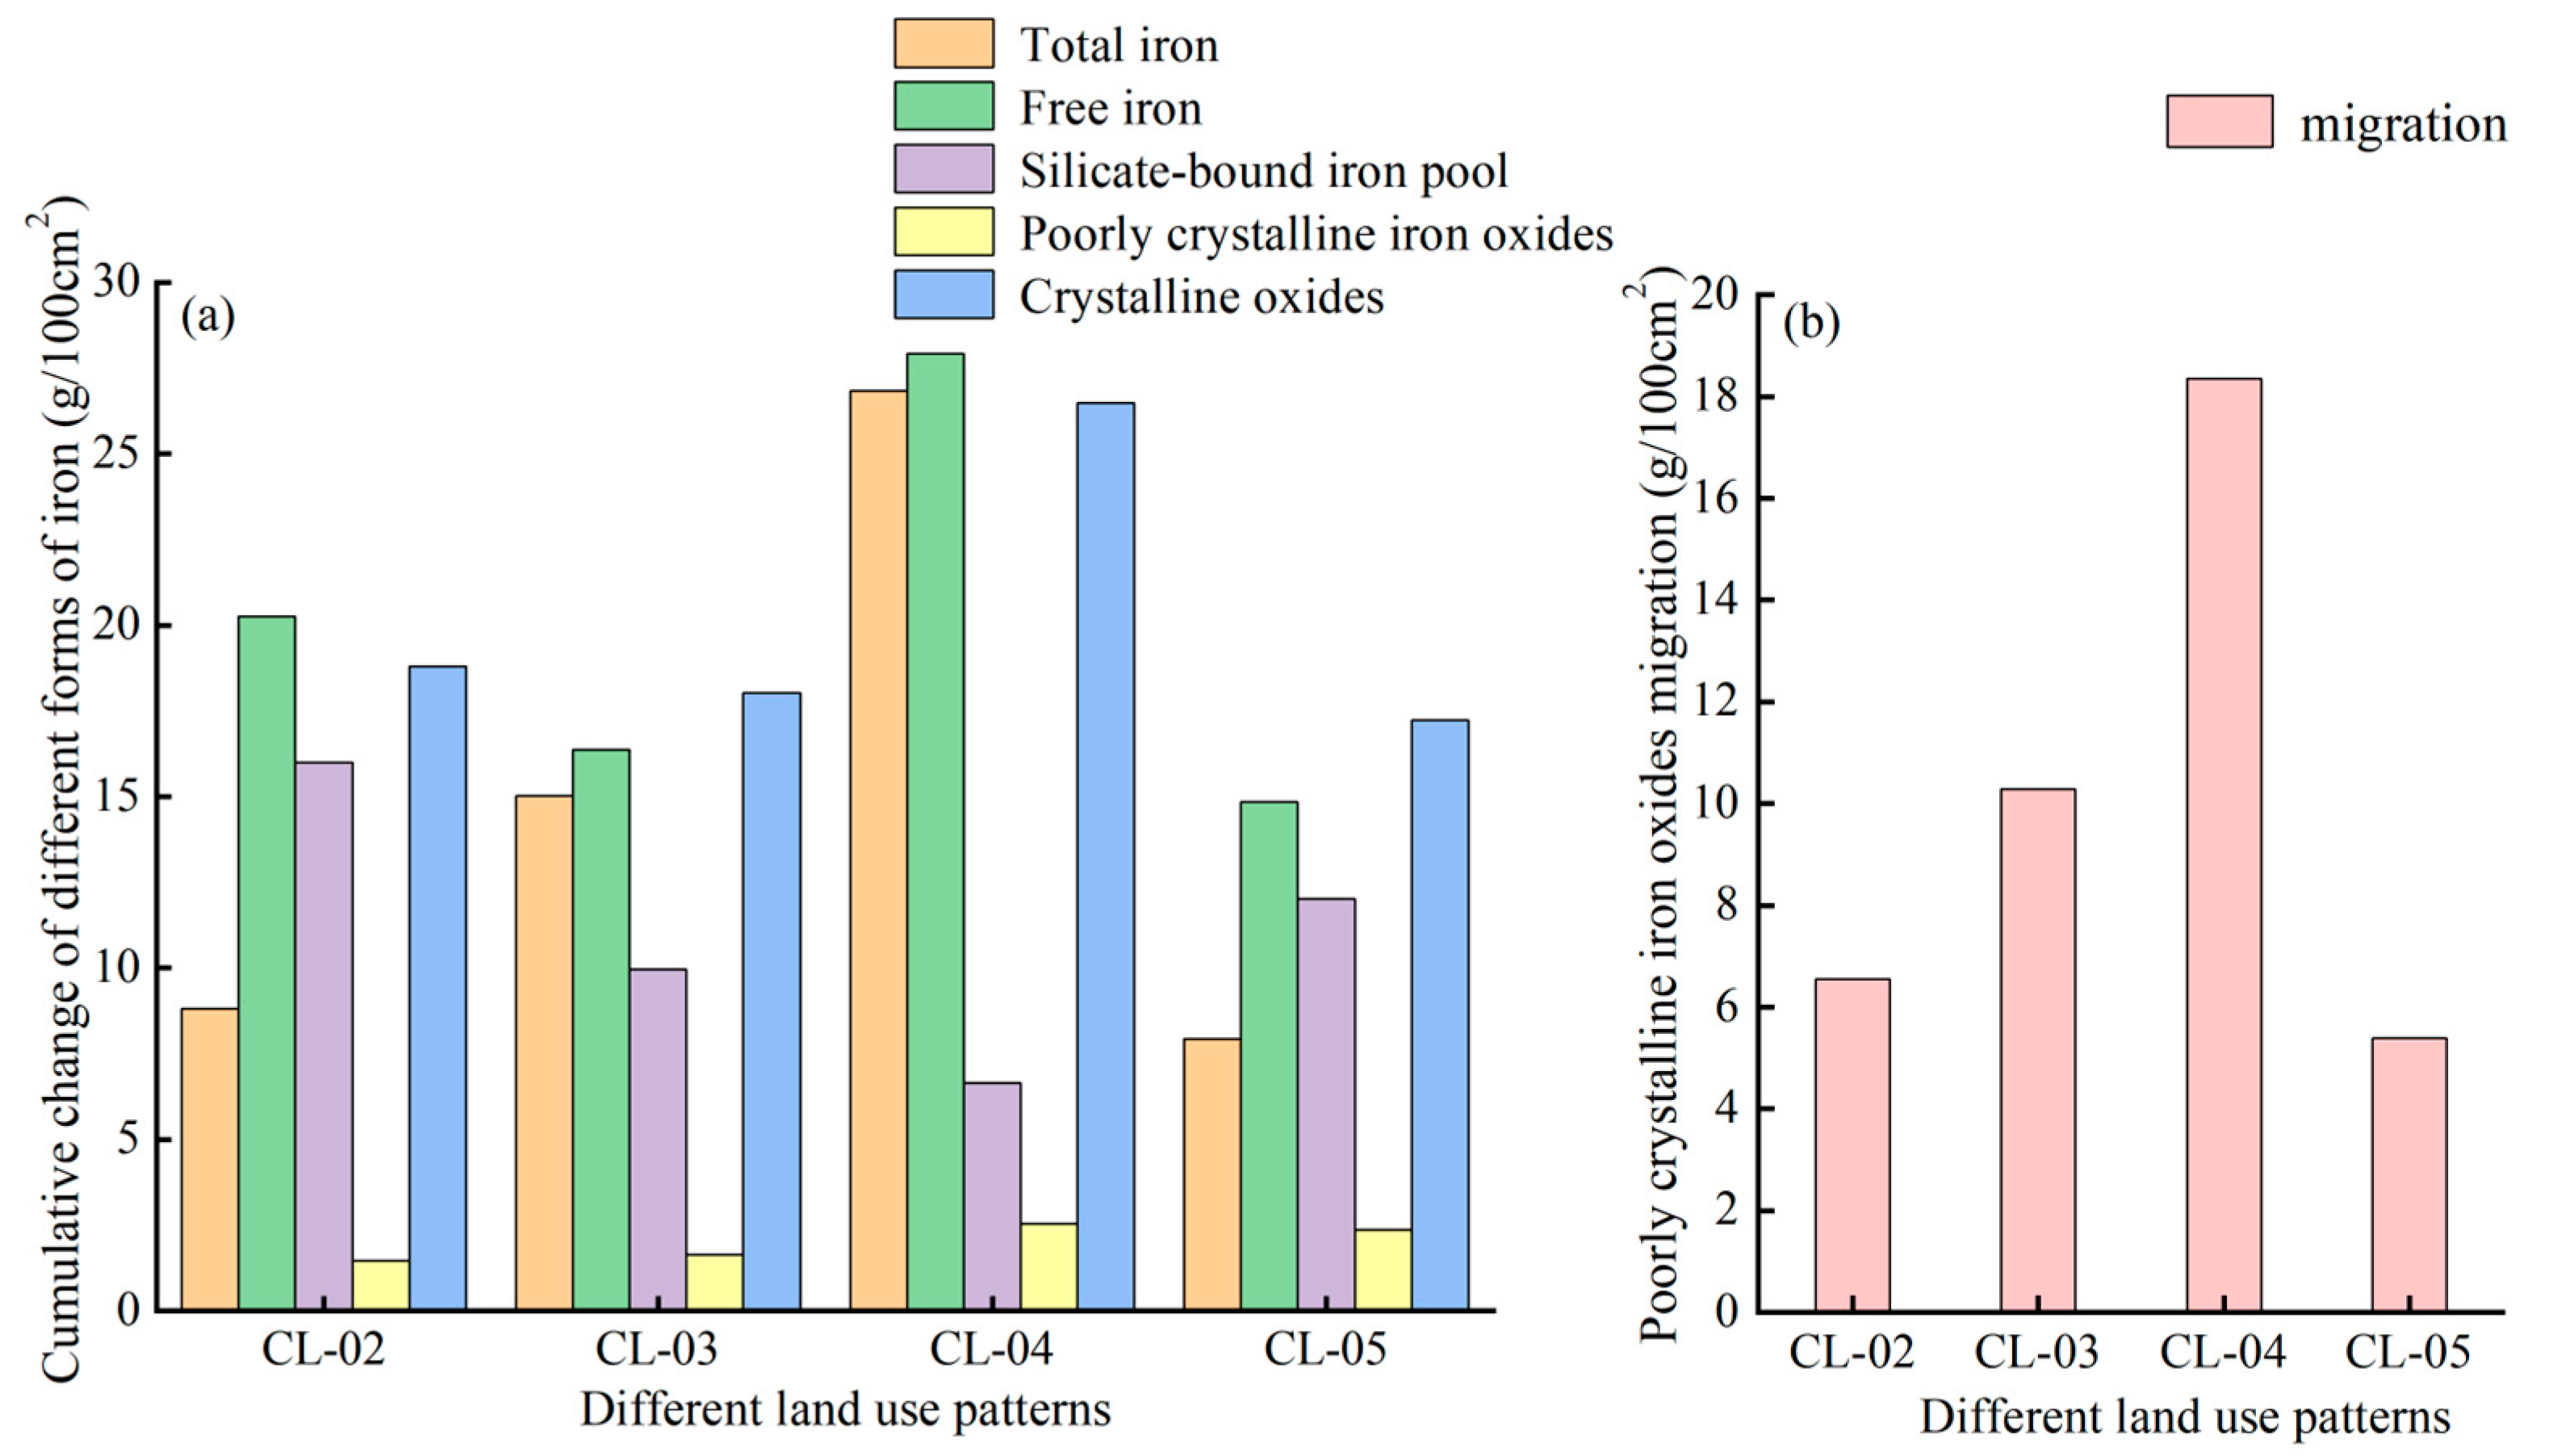
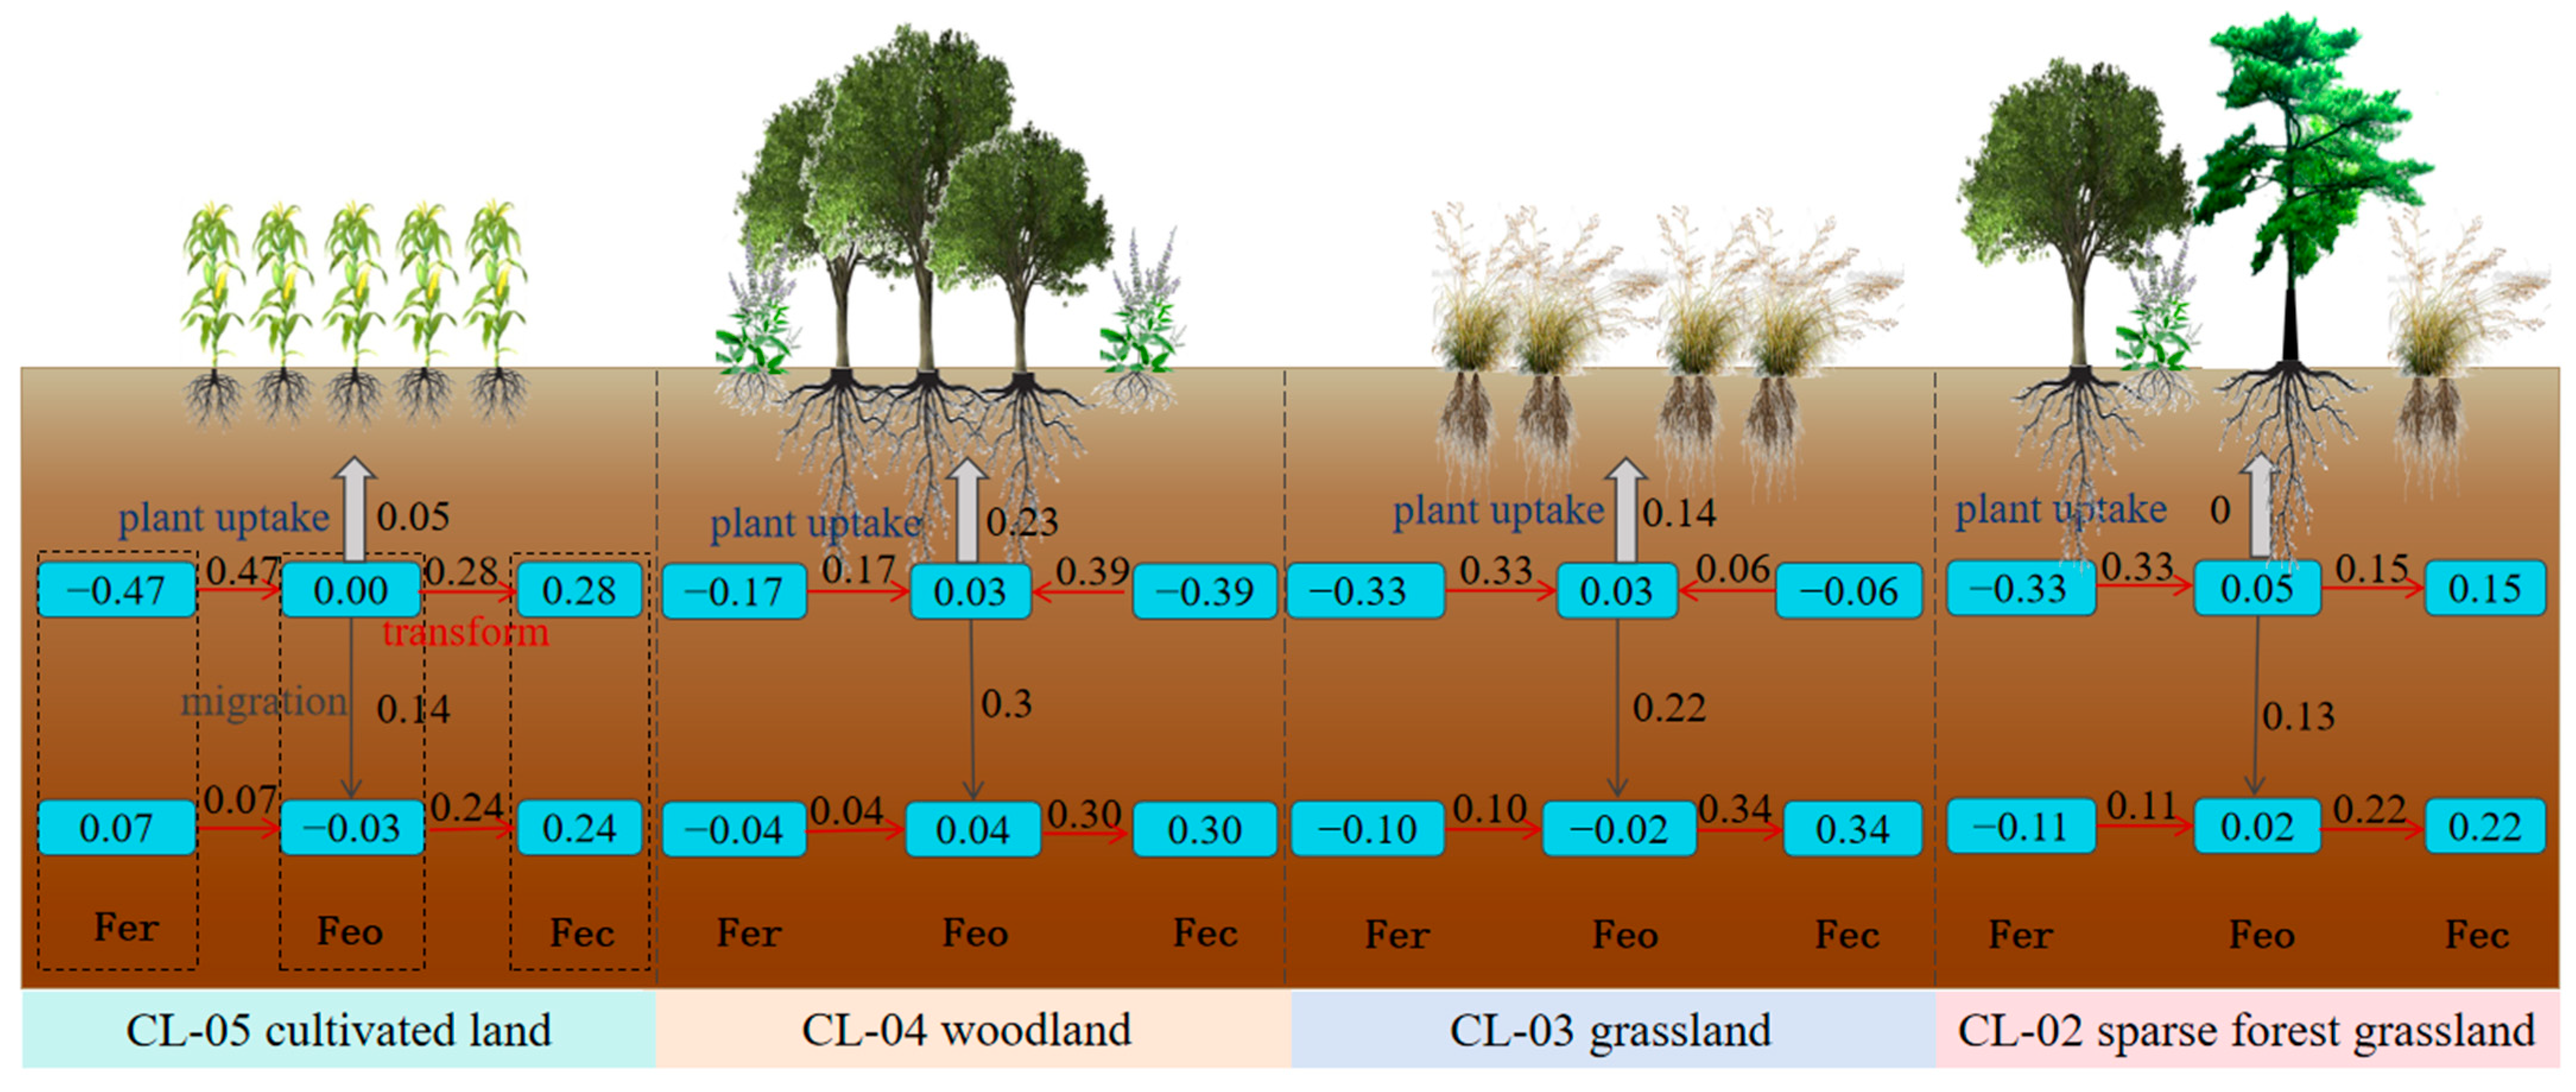
3.3.2. Cumulative Changes and Migrations of Iron in Different Forms

Through the soil reconstruction model, the cumulative changes and migrations of different forms of iron in exposed Quaternary red soils were further calculated and compared with buried Quaternary red soil. The results showed that the cumulative changes in total iron (Figure 12), free iron, poorly crystalline iron oxides, and crystalline oxides in the CL-04 profile were the highest, which were 26.84 g/100 cm2, 27.93 g/100 cm2, 2.55 g/100 cm2, and 26.48 g/100 cm2, respectively. The cumulative change in the silicate-bonded iron pool in CL-02 was the largest, at 15.99 g/100 cm2.
The cumulative conversion amounts of iron in CL-02, CL-03, CL-04, and CL-05 profiles (cumulative change of silicate-bound iron pool plus crystalline oxides) were 34.77 g/100 cm2, 27.98 g/100 cm2, 33.12 g/100 cm2, and 29.24 g/100 cm2, respectively. Compared with the amount of iron converted, the migrations of poorly crystalline iron oxides in CL-02, CL-03, CL-04, and CL-05 profiles were 6.55 g/100 cm2, 10.28 g/100 cm2, 18.35 g/100 cm2, and 5.39 g/100 cm2, respectively. It was observed that the conversion amounts of different forms of iron in the Quaternary red soil sections were greater than the migration amounts, and the conversion was significant.
Using the soil reconstruction model, we compared the changes and migrations of various forms of iron in exposed and buried Quaternary red soils. Our findings revealed that in the CL-04 profile, the cumulative changes of total iron, free iron, poorly crystalline iron oxides, and crystalline oxides were highest at 26.84 g/100 cm2, 27.93 g/100 cm2, 2.55 g/100 cm2, and 26.48 g/100 cm2, respectively. The silicate-bonded iron pool showed the largest cumulative change in CL-02 at 15.99 g/100 cm2.
The total iron transformations in profiles CL-02, CL-03, CL-04, and CL-05 amounted to 34.77 g/100 cm2, 27.98 g/100 cm2, 33.12 g/100 cm2, and 29.24 g/100 cm2, respectively. Compared with this, migrations of poorly crystalline iron oxides were lower at 6.55 g/100 cm2, 10.28 g/100 cm2, 18.35 g/100 cm2, and 5.39 g/100 cm2 for the same profiles. Clearly, the conversion of iron forms outweighed their migration in Quaternary red soils, indicating conversion as the dominant process.

3.4. The Transformation Rate of Iron between Different Forms

The calculation results for the conversion rates of various iron forms in Quaternary red soils (Figure 13) revealed several notable trends. First, the maximum conversion rate of the silicate-bound iron pool in the topsoil of CL-03 reached 0.17 g/100 cm3 ka BP, whereas CL-04 exhibited the minimum rate at 0.03 g/100 cm3 ka BP, following the pattern CL-03 > CL-05 > CL-02 > CL-04. Second, considering the conversion rate between crystalline oxides and poorly crystalline iron oxides in the topsoil, CL-04 led with a rate of 0.07 g/100 cm3 ka BP, while CL-03 had the lowest rate at 0.02 g/100 cm3 ka BP, adhering to the order CL-04 > CL-05 > CL-02 > CL-03.
For the subsoil layer, the silicate-bound iron pool’s maximum conversion rate in CL-03 was 0.002 g/100 cm3 ka BP, with CL-04 again showing the minimum rate of 0.001 g/100 cm3 ka BP. This followed the sequence of CL-03 > CL-02 > CL-05 > CL-04. With regard to the subsoil conversion rate between crystalline oxides and poorly crystalline iron oxides, CL-04 topped the list at 0.007 g/100 cm3 ka BP, and CL-02 came in last at 0.003 g/100 cm3 ka BP, following the order CL-04 > CL-03 > CL-05 > CL-02.

4. Discussion

4.1. Iron Composition Characteristics in Different Forms of Quaternary Red Soils

Compared with buried Quaternary red soil (with a pH of 6.09), the exposed Quaternary red soils across various land use patterns exhibited increased total iron content, free iron content, and crystalline oxides content. This elevation was due to the influence of vegetation cover on the surface of the exposed soils, where plant litter and root humification lowered soil pH through the production of humic acid (Figure 14a). This acidic environment facilitated the weathering of iron-containing silicate minerals, releasing free iron (ranging from 0.06 g/100 cm3 to 0.13 g/100 cm3). Our study revealed a significant positive correlation between the silicate-bound iron pool content and the pH of Quaternary red soils (Figure 15), further corroborating this notion.
The grassland soils possessed high porosity (0.53%) (Figure 14b,e), providing an ideal aerated environment for microorganisms [9,38]. Enhanced microbial decomposition accelerated the weathering of iron-containing silicate minerals, releasing free iron (0.12 g/100 cm3). However, this porous, well-ventilated setting promoted the dehydration and aging of poorly crystalline iron oxides into crystalline oxides [39]. Consequently, grassland soils had the lowest silicate-bound iron pool content but the highest content of free iron and crystalline oxides.
Woodland areas, characterized by extensive vegetation cover, generated more organic carbon (17.71 g/kg) due to decomposing leaf litter (Figure 14c). This environment favored microbial growth, resulting in a high abundance and diversity of bacteria and fungi [9]. Organic acids secreted by microorganisms and plant roots facilitated iron activation, leading to the highest content of poorly crystalline iron oxides. These finding are consistent with Xia et al.’s study, which reported that humic acid can activate iron oxide minerals in aquifers [40]. These oxides strongly adsorb organic matter, impeding the formation of iron oxide crystal nuclei [41] and preventing amorphous iron from aging into crystalline oxides [42,43,44]. Hence, woodland soils exhibited a lower content of crystalline oxides compared with other land use patterns.
In summary, compared with buried Quaternary red soil, the exposed Quaternary red soils demonstrated increased iron freeness and crystallinity. However, iron activity decreased in grassland and cultivated land due to the significant conversion of poorly crystalline iron oxides into crystalline oxides (0.31 g/100 cm3 in woodland vs. 0.24 g/100 cm3 in cultivated land).

4.2. Migration and Transformation of Iron in Different Forms in Quaternary Red Soils

Humic acid, produced by decaying litter and roots, aids in the release of iron from silicate minerals as they weather in Quaternary red soils. This iron then migrates through the soil via leaching. Plants absorb iron during growth, leading to lower total and silicate-bound iron content on the soil’s surface compared with buried soil. Corn absorbs more poorly crystalline iron oxides from the surface soil than are activated by roots or microbes [45]. Crops absorb and deplete a small amount of soil iron [46]. Vegetation increases bacterial richness and diversity on the soil surface. The acidic nature of these soils, coupled with microbial decomposition of plant matter, produces humus and organic acids [47,48,49,50]. This process forms highly mobile iron–aluminum complexes, which migrate from the topsoil to the subsoil, resulting in higher iron content in the subsoil. Vegetation cover, such as in sparse forest grassland, grassland, and woodland, enhances organic matter content. Organic fertilizer application also boosts the organic matter on cultivated land, promoting iron oxide activation. In this study, woodland had the highest organic matter but lower poorly crystalline iron oxides on the topsoil, due to deep root binding and strong leaching [51,52]. In contrast, cultivated land, grassland, and sparse forest grassland had lower content of poorly crystalline iron oxides, due to shallow root binding. Cultivated topsoil had the lowest silicate-bound iron and poorly crystalline iron oxides but the highest free iron and crystalline oxides, due to long-term cultivation and fertilizer use. In the process of tillage, soil pores can be changed, thereby changing the soil’s hydrothermal state, accelerating the evaporation of surface soil water, and promoting the conversion of active iron to crystalline iron. This is consistent with Yang et al.’s study, which reported that after paddy field conversion to forest land, soil moisture content was significantly reduced and a large amount of poorly crystalline iron gradually aged and transformed into crystalline iron [16]. The transformation amount was 0.28 g/100 cm3 (Figure 16). Total iron, free iron, and crystalline oxides correlated positively with clay content (Figure 15), and the grassland’s subsoil had the highest clay content, leading to higher iron content [18,53]. These findings are consistent with the study by Li et al., which reported that the content of iron oxide in ferric manganese increased with the increase of clay content [54].

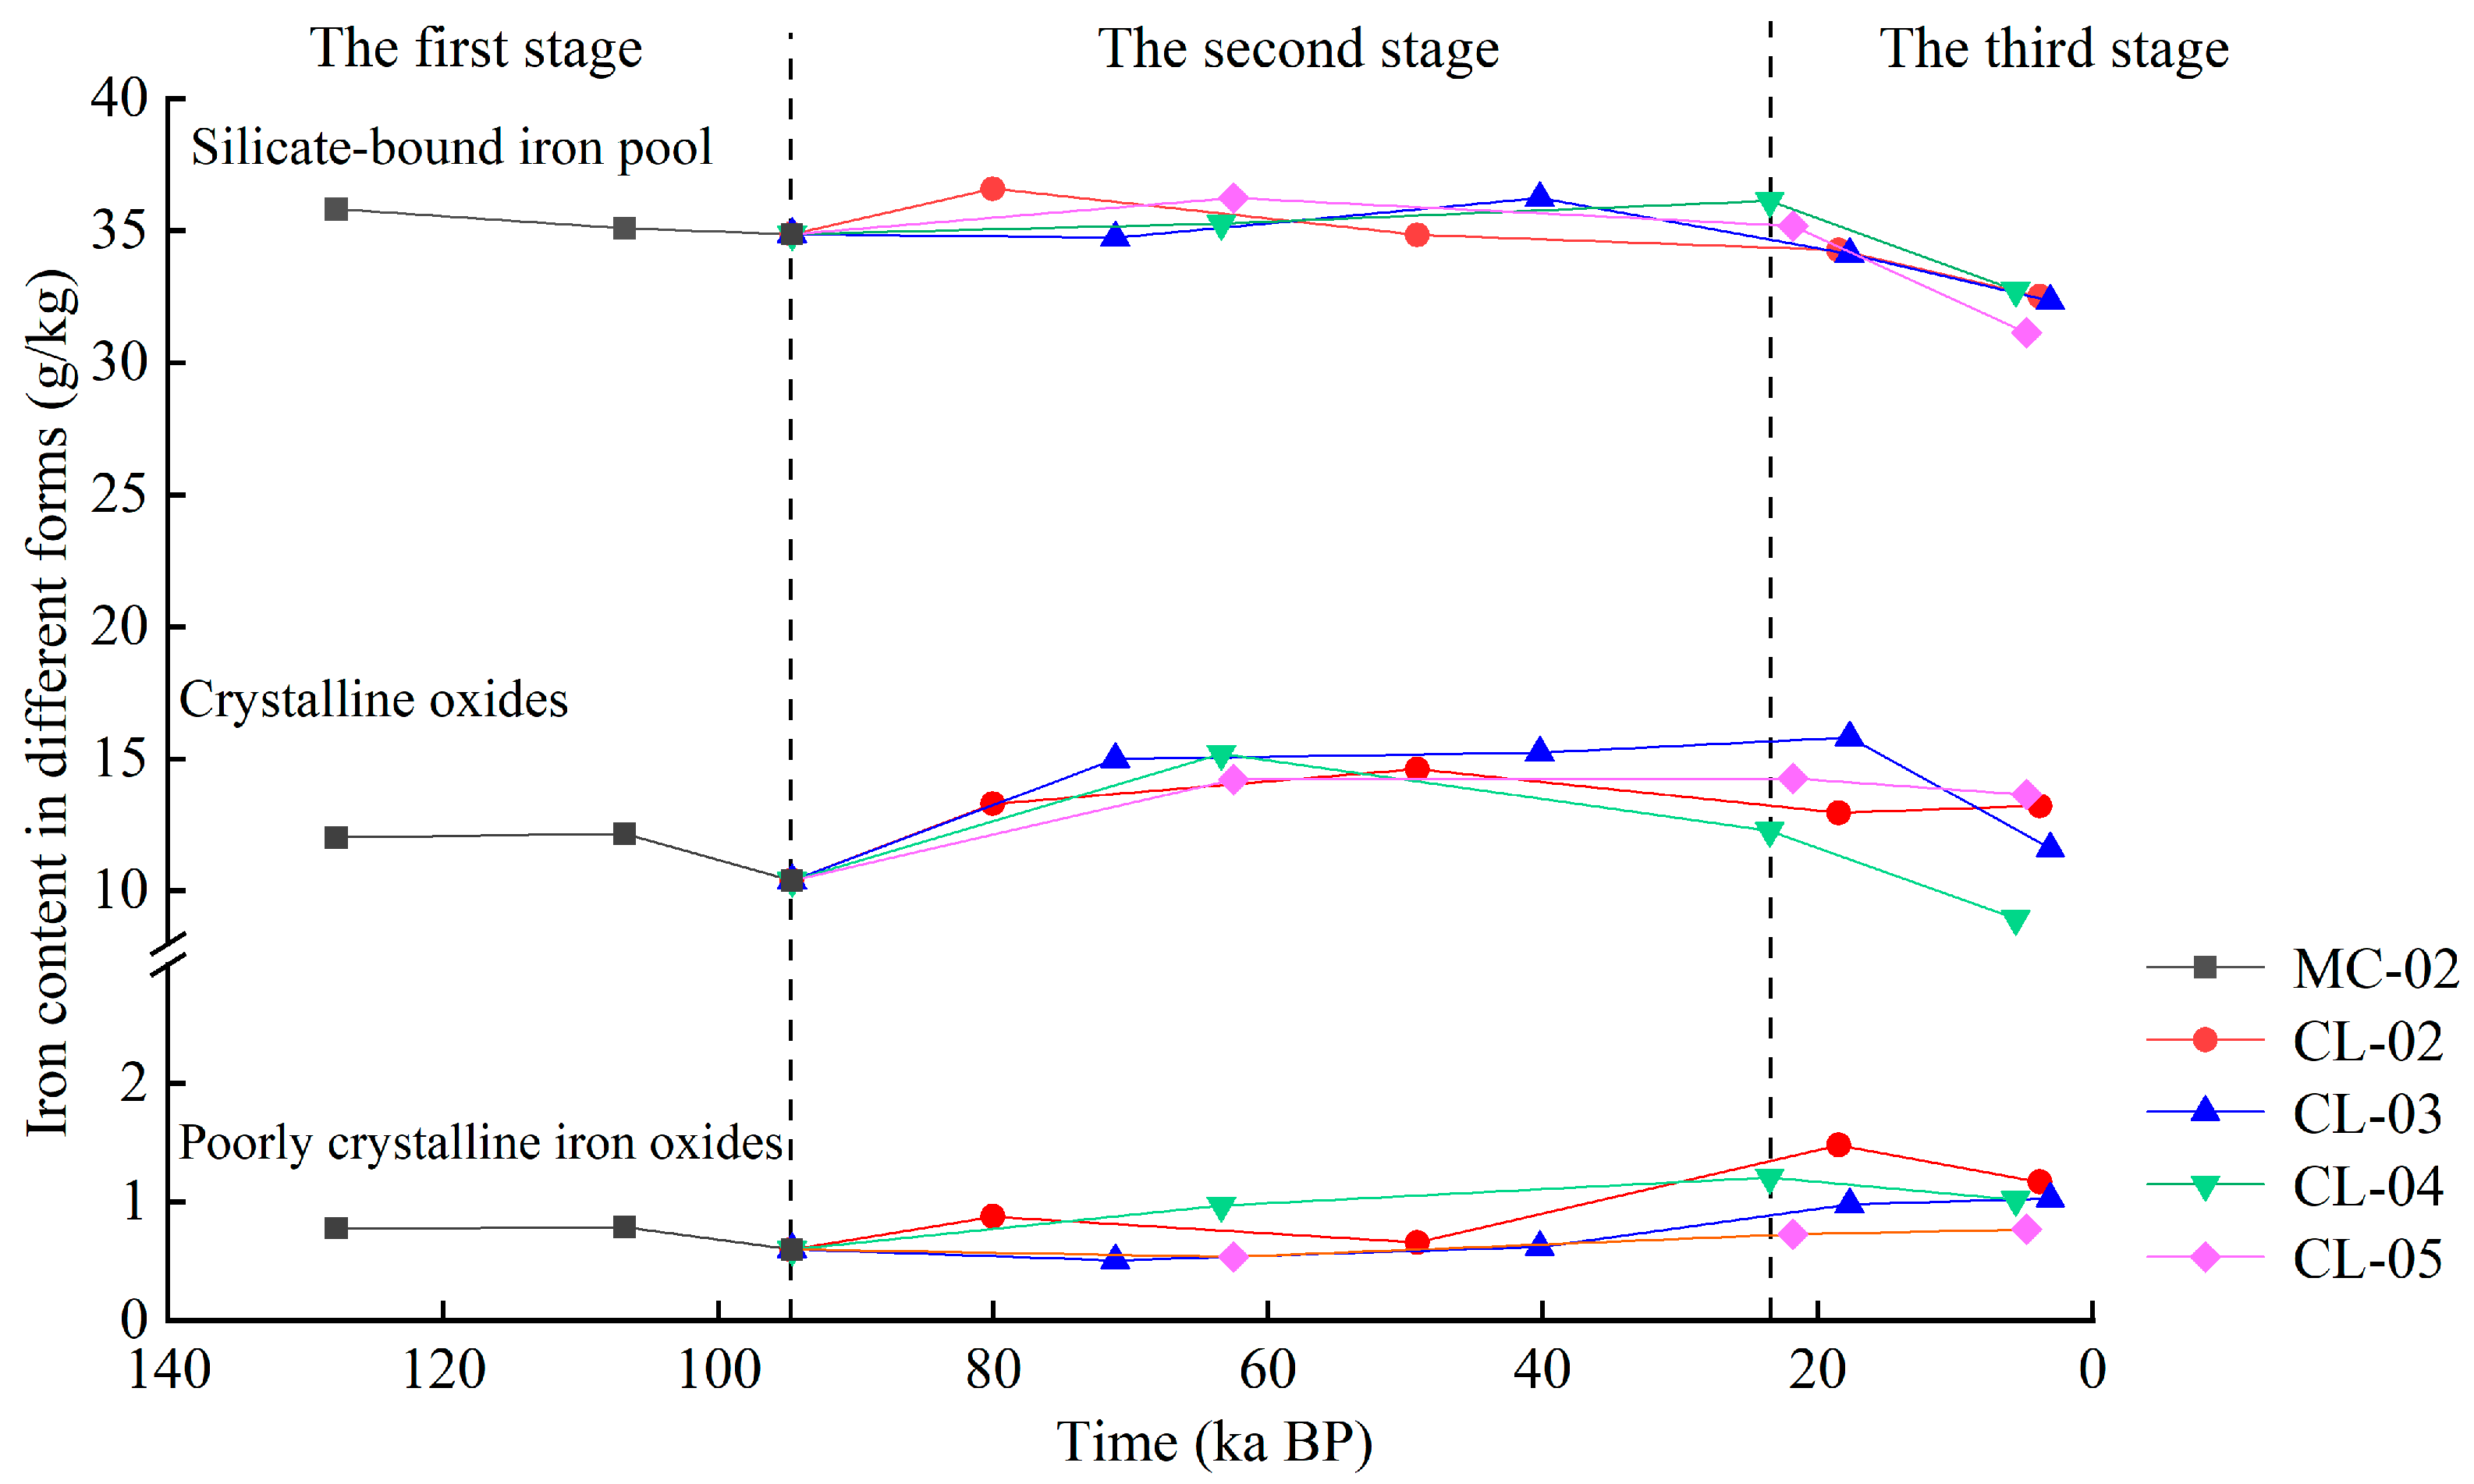
4.3. Evolution Characteristics of Iron in Different Forms in Quaternary Red Soils over Time

The temporal evolution of iron content in various forms within Quaternary red soils can be categorized into three distinct stages. During the first stage, spanning from 140 to 96 ka BP, the buried Quaternary red soil remained undisturbed by anthropogenic activities. This soil was constrained by the compaction of overlying loess and a lack of external material and energy influx. Consequently, the iron content across different forms remained relatively stable, with minimal migration or transformation observed (Figure 17).
The second stage, from 94–24 ka BP, witnessed significant changes. As the soil was exposed on the surface due to erosion, it became influenced by human land use practices, leading to increased vegetation and root growth. This period incurred an influx of plant litter and fertilizer, resulting in elevated content of organic matter. Microorganisms decomposed this organic matter, releasing organic acids. These acids facilitated the weathering and reduction of iron-containing silicate minerals [55], ultimately releasing poorly crystalline iron oxides at a conversion rate ranging from 0.001 to 0.003 g/100 cm3 per ka BP. Consequently, the silicate-bound iron content decreased over time, while the poorly crystalline iron oxides increased. A portion of these newly formed oxides dissolved and moved downward, while the remainder crystallized into crystalline oxides, exhibiting an increasing trend with time at a conversion rate of 0.004 to 0.01 g/100 cm3 per ka BP.
The final stage, commencing from 24 ka BP and extending to the present, has been characterized by intensified anthropogenic land use activities. This has led to a continuous increase in organic matter content and, subsequently, enhanced release of organic acids [56]. These acids have accelerated the weathering of iron-containing silicate minerals, resulting in a higher reduction rate of silicate-bound iron and an increased conversion rate between poorly crystalline and crystalline iron oxides compared with the previous stage. Specifically, the conversion rate from silicate-bound iron to poorly crystalline iron oxides ranged from 0 to 0.02 g/100 cm3 per ka BP, while the conversion rate between poorly crystalline and crystalline iron oxides varied from 0.007 to 0.02 g/100 cm3 per ka BP.
At the current rate of change, the land use patterns in sparse forest grassland result in high soil bulk density, which is not conducive to the survival of soil microorganisms. The content of poorly crystalline iron in the soil gradually decreases, increasing the risk of soil compaction. If the sparse forest grassland continues to be used, the soil will be directed towards a negative development trend, thereby affecting soil health. Furthermore, cultivated soils should adopt protective farming practices such as no-till, reduced tillage, and straw return during utilization, and organic fertilizers should be applied scientifically. Otherwise, iron nutrients in the soil will be lost and absorbed by crops like corn that are grown once a year.

5. Conclusions

(1)
Anthropogenic land use activities in the middle temperate subhumid region have altered the iron composition of Quaternary red soils. The total iron content has increased due to anthropogenic influences. Some of the silicate-bound iron in the topsoil and subsoil has undergone weathering to form free iron, with cultivated land showing the highest transformation intensity.
(2)
In this region, the conversion of iron forms within the soil profile surpasses migration and is dominated by migration. Land use patterns affect the conversion of poorly crystalline to crystalline iron oxides in both topsoil and subsoil, with grassland exhibiting the highest transformation intensity in the subsoil.
(3)
Over time, anthropogenic activities have accelerated the evolution of iron morphology in these soils. Three distinct stages (140–94 ka BP; 94–24 ka BP; 24 ka BP to the present) of iron content change were observed, correlating with periods of human land use. Since 24 ka BP, the conversion rate between iron oxide forms has increased significantly due to intensified human activities.
(4)
After considering various factors such as suitability, stability, and sustainability, it is recommended that rational planning and utilization of Quaternary red soil resources should be conducted. Scientific planning or adjustments to land use should be carried out in the distribution areas, with reference to different patterns of land coverage. For essential cultivated land, protective farming practices such as no-till, reduced tillage, and straw return, along with the scientific application of organic fertilizers, should be adopted to promote the conversion of crystalline iron into poorly crystalline iron and improve the availability of soil iron. In low mountainous and hilly areas with severe soil erosion, some of the cultivated land or grassland located on higher ground with steep slopes can be moderately converted into woodland through returning farmland to forest or afforestation, with the aim of achieving functions such as windbreaks, sand fixation, and water conservation. This approach will enhance soil fertility, ensure food security, and mitigate issues such as soil erosion and water evaporation.
In this study, the changes in different forms of iron in topsoil and subsoil were investigated through quantitative calculations. However, the transformation of iron between each layer is unclear. In the future, it will be necessary to utilize advanced technologies, such as iron isotope technology and synchrotron radiation technology, to further investigate the changes in iron between different layers of the soil profile.

Author Contributions

Conceptualization, C.-C.Z. and Z.-X.S.; methodology, Y.-Y.J., C.-C.Z., Z.-X.S. and S.-Y.D.; software, C.-C.Z., Y.-Y.J. and S.-Y.D.; validation, C.-C.Z. and Z.-X.S.; formal analysis, C.-C.Z., Y.-Y.J. and S.-Y.D.; investigation, Z.-X.S., S.-Y.D. and C.-C.Z.; resources, C.-C.Z. and Z.-X.S.; data curation, C.-C.Z.; writing—original draft preparation, C.-C.Z., Z.-X.S. and Y.-Y.J.; writing—review and editing, C.-C.Z. and Z.-X.S.; visualization, C.-C.Z. and Z.-X.S.; supervision, Z.-X.S.; project administration, C.-C.Z. and Z.-X.S.; funding acquisition, Z.-X.S. and Y.-Y.J. All authors have read and agreed to the published version of the manuscript.

Funding

This research was funded by grants from the National Natural Science Foundation of China (No. 42277285), “Xing Liao Talent Plan” Youth Top Talent Support Program (XLYC2203085), and the Applied Basic Research Program of Liaoning Province (No. 2022JH2/101300167).

Data Availability Statement

Data are contained within the article.

Conflicts of Interest

The authors declare no conflicts of interest. The funders had no role in the design of the study, in the collection, analyses, or interpretation of data, in the writing of the manuscript, or in the decision to publish the results.

References

  1. Giannetta, B.; Plaza, C.; Thompson, A.; Plante, A.F.; Zaccone, C. Iron speciation in soil size fractions under different land uses. Geoderma 2022, 418, 115842. [Google Scholar] [CrossRef]
  2. Gao, M.; Li, H.; Xie, Z.; Li, Z.; Luo, Z.; Yu, R.; Lü, C.; He, J. The fate of Arsenic associated with the transformation of iron oxides in soils: The mineralogical evidence. Sci. Total Environ. 2024, 914, 169795. [Google Scholar] [CrossRef] [PubMed]
  3. He, N.Z. Iron nutrition of plants. Prog. Soil Sci. 1986, 1, 19–23. [Google Scholar]
  4. Herndon, E.; AlBashaireh, A.; Singer, D.; Chowdhury, T.R.; Gu, B.; Graham, D. Influence of iron redox cycling on organo-mineral associations in Arctic tundra soil. Geochim. Cosmochim. Acta 2017, 207, 210–231. [Google Scholar] [CrossRef]
  5. Li, M.Y.; Zhang, X.T.; Liu, H.Y. Effects of Water Management on the Transformation of Iron Oxide Forms in Paddy Soils and Its Coupling with Changes in Cadmium Activity. Environ. Sci. 2022, 43, 4301–4312. [Google Scholar]
  6. Borch, T.; Kretzschmar, R.; Kappler, A.; Cappellen, P.V.; Ginder-Vogel, M.; Voegelin, A.; Campbell, K. Biogeochemical redox processes and their impact on contaminant dynamics. Environ. Sci. Technol. 2010, 44, 15–23. [Google Scholar] [CrossRef] [PubMed]
  7. Kirsten, M.; Mikutta, R.; Vogel, C.; Thompson, A.; Mueller, C.W.; Kimaro, D.N.; Bergsma, H.L.; Feger, K.-H.; Kalbitz, K. Iron oxides and aluminous clays selectively control soil carbon storage and stability in the humid tropics. Sci. Rep. 2021, 11, 5076. [Google Scholar] [CrossRef] [PubMed]
  8. Liu, Y.J.; Lu, X.H.; Luo, D. Characteristics of Iron Oxides and their Relationship with Soil Types in the Karst Mountainous Areas of Guizhou. Chin. J. Soil Sci. 2021, 52, 505–514. [Google Scholar]
  9. Zhang, C.C.; Sun, Z.X.; Wang, Q.B.; Jiang, Y.Y.; Duan, S.Y.; Sun, F.J. Characteristics of Bacterial and Fungal Communities in Quaternary Red Soils under Different Land-use Patterns. Chin. J. Soil Sci. 2023, 54, 897–912. [Google Scholar]
  10. Liu, L.W.; Gong, Z.T. Development and evolution of red paleosols. Mar. Geol. Quat. Geol. 2000, 20, 37–42. [Google Scholar]
  11. Duan, S.Y.; Sun, Z.X.; Wang, Q.B.; Jiang, Y.Y.; Sun, F.J. Comparison of Aggregate Composition in Quaternary Red Soils under Different Land Use Patterns. Chin. J. Soil Sci. 2020, 51, 587–596. [Google Scholar]
  12. Owliaie, H.; Adhami, E.; Ghiri, M.N. Changes in soil magnetic properties and iron oxides following land use change (case study: Mokhtar Plain, Kohgilouye Province). J. Water Soil 2022, 36, 267–282. [Google Scholar]
  13. Korkanç, S.Y.; Korkanç, M.; Amiri, A.F. Effects of land use/cover change on heavy metal distribution of soils in wetlands and ecological risk assessment. Sci. Total Environ. 2024, 923, 171603. [Google Scholar] [CrossRef] [PubMed]
  14. Wang, L.; Yu, X.; Xue, Z.; Huo, L.; Jiang, M.; Lu, X.; Zou, Y. Distribution characteristics of iron, carbon, nitrogen and phosphorus in the surface soils of different land use types near Xingkai Lake. J. Soil Sediment. 2019, 19, 275–285. [Google Scholar] [CrossRef]
  15. Li, J.; Richter, D.D. Effects of two-century land use changes on soil iron crystallinity and accumulation in Southeastern Piedmont region, USA. Geoderma 2012, 173, 184–191. [Google Scholar] [CrossRef]
  16. Yang, D.W.; Zhang, M.K.; Zhang, P.Q.; Liu, Q.Q.; Dong, J.; Li, X.; Huang, X. Changes of Soil Clay Minerals and Iron Oxides after Paddy Field Converted into Forest Land in Plain Areas. Soils 2020, 52, 567–574. [Google Scholar]
  17. Wu, B.; Meng, X.; Yao, H.; Amelung, W. Iron dynamics and isotope fractionation in soil and rice during 2000 years of rice cultivation. Plant Soil 2024, 495, 615–629. [Google Scholar] [CrossRef]
  18. Sun, D.D.; Liu, X.; Yang, J.S.; Yu, J.B.; Wang, Z.K.; Zhou, D.; Li, Y.Z.; Yu, Y.; Ning, K. Effects of returning years from farmland to wetland on the content and distribution of soil iron oxides in the Yellow River Delta. Chin. J. Ecol. 2023, 42, 2359–2367. [Google Scholar]
  19. Huang, L.M.; Shao, M.A.; Chen, L.M.; Han, G.Z.; Zhang, G.L. Evolution Characteristics of Iron Oxides and Magnetic Susceptibility in Stagnic Anthrosols along Chronosequences. Acta Pedol. Sin. 2017, 54, 1–13. [Google Scholar]
  20. Guo, S.; Cai, Y.; Ren, J.; Guan, Y.; Xin, D.; Long, X. Formation and migration of magnetic particles associated with iron oxide transformation at a hillslope scale. Catena 2021, 197, 104944. [Google Scholar] [CrossRef]
  21. Wang, Q.B.; Han, C.L.; Sun, F.J.; Sun, Z.X. Chinese Soil History Liaoning Volume; Science Press: Beijing, China, 2010. [Google Scholar]
  22. Jia, W.J. Liaoning Soil; Liaoning Science and Technology Press: Shenyang, China, 1992. [Google Scholar]
  23. Chinese Soil Taxonomy Research Group; Institute of Soil Science Chinese Academy of Sciences; Cooperative Research Group on Chinese Soil Taxonomy. Keys to Chinese Soil Taxonomy, 3rd ed.; University of Science and Technology of China Press: Hefei, China, 2001. (In Chinese) [Google Scholar]
  24. Soil Survey Staff. Keys to Soil Taxonomy, 12th ed.; USDA; NRCS Publications: Washington, DC, USA, 2014. [Google Scholar]
  25. IUSS Working Group WRB. World Reference Base for Soil Resources. In International Soil Classification System for Naming Soils and Creating Legends for Soil Maps, 4th ed.; International Union of Soil Sciences (IUSS): Vienna, Austria, 2022. [Google Scholar]
  26. Zhang, G.L.; Gong, Z.T. Methods for Laboratory Analysis of Soil Investigation; Science Press: Beijing, China, 2012. [Google Scholar]
  27. Wagner, D.; Gattinger, A.; Embacher, A.; Pfeiffer, E.M.; Schloter, M.; Lipski, A. Methanogenic activity and biomass in Holocene permafrost deposits of the Lena Delta, Siberian Arctic and its implication for the global methane budget. Glob. Change Biol. 2007, 13, 1089–1099. [Google Scholar] [CrossRef]
  28. Zheng, R.C.; Shen, R.S.; Qian, Q.W. Rapid analysis of soil-lithium carbonate, boric acid, graphite powder crucible melting method. Soils 1985, 17, 34–35. [Google Scholar]
  29. Yu, Z.Y. About the arrangement and application of soil analysis data in soil general survey. Chin. J. Soil Sci. 1984, 5, 224–227. [Google Scholar]
  30. Lu, Y.C.; Yin, G.M.; Chen, J.; Liu, A.G. Photoluminescence dating of Quaternary sediments. Earth Sci. 1995, 6, 668. [Google Scholar]
  31. Blume, H.; Schwertmann, U. Genetic evaluation of profile distribution of aluminum, iron, and manganese oxides. Soil Sci. Soc. Am. J. 1969, 33, 438–444. [Google Scholar] [CrossRef]
  32. Schwertmann, U. The effect of pedogenic environments on iron oxide minerals. Adv. Soil Sci. 1985, 1, 171–200. [Google Scholar]
  33. Schwertmann, U. Occurrence and formation of iron oxides in various pedo-environments. In Iron in Soils and Clay Minerals; Springer: Dordrecht, The Netherlands, 1988; pp. 267–308. [Google Scholar]
  34. Brewer, R. Fabric and mineral analysis of soils. Soil Sci 1965, 100, 73. [Google Scholar] [CrossRef]
  35. Stolt, M.; Baker, J. Quantitative comparison of soil and saprolite genesis: Examples from the Virginia Blue Ridge and Piedmont. Southeast. Geol. 2000, 39, 3–4. [Google Scholar]
  36. Schwertmann, U.; Taylor, R.M. Iron oxides. Miner. Soil Environ. 1989, 1, 379–438. [Google Scholar]
  37. Postma, D.; Boesen, C.; Kristiansen, H.; Larsen, F. Nitrate reduction in an unconfined sandy aquifer: Water chemistry, reduction processes, and geochemical modeling. Water Resour. Res. 1991, 27, 2027–2045. [Google Scholar] [CrossRef]
  38. Schjønning, P.; Thomsen, I.K.; Petersen, S.O.; Kristensen, K.; Christensen, B.T. Relating soil microbial activity to water content and tillage-induced differences in soil structure. Geoderma 2011, 163, 256–264. [Google Scholar] [CrossRef]
  39. Regelink, I.C.; Stoof, C.R.; Rousseva, S.; Weng, L.; Lair, G.J.; Kram, P.; Nikolaidis, N.P.; Kercheva, M.; Banwart, S.; Comans, R.N. Linkages between aggregate formation, porosity and soil chemical properties. Geoderma 2015, 247, 24–37. [Google Scholar] [CrossRef]
  40. Xia, X.; Han, X.; Zhai, Y. Activation of iron oxide minerals in an aquifer by humic acid to promote adsorption of organic molecules. J. Environ. Manag. 2024, 356, 120543. [Google Scholar] [CrossRef]
  41. Lalonde, K.; Mucci, A.; Ouellet, A.; Gélinas, Y. Preservation of organic matter in sediments promoted by iron. Nature 2012, 483, 198–200. [Google Scholar] [CrossRef] [PubMed]
  42. ThomasArrigo, L.K.; Byrne, J.M.; Kappler, A.; Kretzschmar, R. Impact of organic matter on iron (II)-catalyzed mineral transformations in ferrihydrite–organic matter coprecipitates. Environ. Sci. Technol. 2018, 52, 12316–12326. [Google Scholar] [CrossRef] [PubMed]
  43. Laurent, S.; Forge, D.; Port, M.; Roch, A.; Robic, C.; Vander Elst, L.; Muller, R.N. Magnetic iron oxide nanoparticles: Synthesis, stabilization, vectorization, physicochemical characterizations, and biological applications. Chem. Rev. 2008, 108, 2064–2110. [Google Scholar] [CrossRef] [PubMed]
  44. Hu, X.F. Influence of iron oxides and organic matter on magnetic susceptibility in the loess-paleosol sequence. Acta Pedol. Sin. 2004, 41, 7–12. [Google Scholar]
  45. Wang, J.L.; Liu, Z.Y. Iron transformation in rice rhizosphere. Acta Pedol. Sin. 1992, 29, 364–385. [Google Scholar]
  46. Anderson, W.; Parkpian, P. Plant availability of an iron waste product utilized as an agricultural fertilizer on calcareous soil. J. Plant Nutr. 1984, 7, 223–233. [Google Scholar] [CrossRef]
  47. Kögel-Knabner, I. The macromolecular organic composition of plant and microbial residues as inputs to soil organic matter. Soil Biol. Biochem. 2002, 34, 139–162. [Google Scholar] [CrossRef]
  48. Yan, S.; Zhang, N.; Li, J.; Wang, Y.; Liu, Y.; Cao, M.; Yan, Q. Characterization of humic acids from original coal and its oxidization production. Sci. Rep. 2021, 11, 15381. [Google Scholar] [CrossRef] [PubMed]
  49. Zhang, S.Q.; Yuan, L.; Lin, Z.A.; Li, Y.T.; Hu, S.W.; Zhao, B.Q. Advances in humic acid for promoting plant growth and its mechanism. J. Plant Nutr. Fert. 2017, 23, 1065–1076. [Google Scholar]
  50. DiDonato, N.; Chen, H.; Waggoner, D.; Hatcher, P. Potential origin and formation for molecular components of humic acids in soils. Geochim. Cosmochim. Ac. 2016, 178, 210–222. [Google Scholar] [CrossRef]
  51. Duan, S.Y.; Sun, Z.X.; Wang, Q.B.; Jiang, Y.Y.; Han, C.L.; Zhang, Y.W.; Lv, M.F.; Sun, F.J.; Chen, L.M. Characteristics of Soil Organic Carbon Distribution of Quaternary Red Soils under Different Land Use Patterns. Chin. J. Soil Sci. 2021, 52, 1078–1084. [Google Scholar]
  52. Li, T.J.; Zhao, Y.; Zhang, K.L.; Zhang, Y.S.; Wang, Y. Soil Geography, 3rd ed.; Higher Education Press: Beijing, China, 2004. [Google Scholar]
  53. Sun, W.G.; Gan, Z.T.; Sun, Z.G.; Li, L.L.; Sun, J.K.; Sun, W.L.; Mou, X.J.; Wang, L.L. Spatial Distribution Characteristics of Fe and Mn Contents in the New-born Coastal Marshes in the Yellow River Estuary. Environ. Sci 2013, 34, 4411–4419. [Google Scholar]
  54. Li, Y.F.; Yang, Y.F.; Wang, Y.Y.; Liu, W.J.; Zhang, P.J. Characteristics of soil iron forms in wetlands with various restoration ages around the Caizi Lake, Anhui Province. Acta Sci. Circumstantiae 2015, 35, 3234–3241. [Google Scholar]
  55. Drever, J.I.; Vance, G.F. Role of soil organic acids in mineral weathering processes. Org. Acids Geol. Process. 1994, 138–161. [Google Scholar]
  56. Tan, K.H. Degradation of soil minerals by organic acids. Interact. Soil Miner. Nat. Org. Microbes 1986, 17, 1–27. [Google Scholar]
Figure 1. The location map of the study area. Notes: The upper left corner is the administrative boundary of Liaoning Province, and the middle is an elevation map of Chaoyang City. The elevation data come from the geospatial data cloud (https://www.gscloud.cn/search; accessed on 5 December 2023). The administrative boundary data of Liaoning province are derived from the Resources and Environmental Science Data Platform (https://www.resdc.cn/Login.aspx; accessed on 15 March 2024).
Agronomy 14 01669 g001
Figure 2. Schematic distribution map of the sampling sites.
Agronomy 14 01669 g002
Figure 3. Variation characteristics of total iron content in Quaternary red soils with soil depth.
Agronomy 14 01669 g003
Figure 4. Variation characteristics of free iron content in Quaternary red soils with profile depth.
Agronomy 14 01669 g004
Figure 5. Variation characteristics of silicate-bound iron pool content in Quaternary red soils with profile depth.
Agronomy 14 01669 g005
Figure 6. Variation characteristics of poorly crystalline iron oxides content in Quaternary red soils with profile depth.
Agronomy 14 01669 g006
Figure 7. Variation characteristics of crystalline iron content in Quaternary red soils with profile depth.
Agronomy 14 01669 g007
Figure 8. Variation characteristics of iron freeness in Quaternary red soils with profile depth.
Agronomy 14 01669 g008
Figure 9. Variation characteristics of iron activity index in Quaternary red soils with profile depth.
Agronomy 14 01669 g009
Figure 10. Variation characteristics of iron crystallinity in Quaternary red soils with profile depth.
Agronomy 14 01669 g010
Figure 11. Loss/gain characteristics of iron in different forms of Quaternary red soils: (a) variations of iron in different forms in topsoil layers of Quaternary red soils; (b) variations of iron in different forms in subsoil layers of Quaternary red soils.
Agronomy 14 01669 g011
Figure 12. Cumulative changes and migrations of iron in different forms in Quaternary red soils: (a) cumulative variation of iron in different forms in Quaternary red soils; (b) migration of poorly crystalline iron oxides in Quaternary red soils.
Agronomy 14 01669 g012
Figure 13. Transformation rates of iron in different forms in Quaternary red soils.
Agronomy 14 01669 g013
Figure 14. The pH, porosity, and organic carbon content of Quaternary red soils under different land use patterns. Note: (ac) in the figure show the pH, porosity, and organic carbon content of the topsoil in Quaternary red soils under different land use patterns; (df) show the pH, porosity, and organic carbon content of the subsoil layer.
Agronomy 14 01669 g014
Figure 15. The heat map of correlations between iron content, ratios of iron in different forms, and the physical and chemical properties of Quaternary red soils. Notes: “*” indicates significance at a p-value of 0.05. “**” indicates significance at a p-value of 0.01.
Agronomy 14 01669 g015
Figure 16. Migrations and transformations of iron in different forms in Quaternary red soils.
Agronomy 14 01669 g016
Figure 17. Variation characteristics of iron content of different forms in Quaternary red soils over time.
Agronomy 14 01669 g017
Table 1. Basic physical and chemical properties of the tested Quaternary red soils.
Moisture Content (%)pHBulk Density
(g cm−3)
Sand Content
(%)
Silt Content
(%)
Clay Content
(%)
Organic Carbon
(g kg−1)
Total Nitrogen
(g kg−1)
Total Manganese (%)
MC-025.856.091.1220.5856.2423.181.120.190.09
CL-0217.795.741.6118.7255.5425.741.550.240.08
CL-0317.465.871.2319.8752.7127.421.220.240.07
CL-0420.575.901.5920.3853.3026.324.210.440.09
CL-0519.586.001.4918.6256.4424.913.540.470.08
Notes: The data in the table are the weighted averages of the profiles.
Disclaimer/Publisher’s Note: The statements, opinions and data contained in all publications are solely those of the individual author(s) and contributor(s) and not of MDPI and/or the editor(s). MDPI and/or the editor(s) disclaim responsibility for any injury to people or property resulting from any ideas, methods, instructions or products referred to in the content.

