Abstract
Water and nitrogen (N) are major constraints for cotton growth and yield formation in arid regions. Irrigation and N application have been widely investigated to improve crop yield and water and N use efficiency (NUE). However, further optimization of water and N management is needed because the effects of N application on soil N balance and N loss under different irrigation levels remain unclear. In this study, a field experiment was conducted in 2020 and 2021 to investigate the effects of different irrigation amounts (full irrigation (100% ETc), moderate irrigation (80% ETc), low irrigation (60% ETc)) and N application rates (control (without N application, N0), low N (150 kg ha−1, N150), medium N (225 kg ha−1 and 300 kg ha−1, N225 and N300), and high N (375 kg ha−1, N375)) on cotton yield, NUE, and soil N balance. The 2-year results showed that under the 60% ETc treatment, cotton dry matter accumulation, N uptake, and yield were significantly enhanced by increasing N application. Under the 80% and 100% ETc treatments, these parameters peaked with the N300 treatment; the N375 treatment showed no significant difference or decrease compared to the N300 treatment. The 80% ETc N300 treatment had the highest cotton yield and NUE, which increased by 17.49–106.57% and 12.28–88.78% compared with other treatments, respectively. Residual soil N accumulation (RSNmin), apparent N loss (ANL), and apparent N surplus (ANS) increased as the N application rate increased under the 60% and 100% ETc treatments. While under the 80% ETc treatment, the ANS did not significantly differ between the N225 and N300 treatments, ANL significantly decreased by 43.51–88.56% when the N application rate increased from 150 to 225 and 300 kg ha−1. The ANL of the 80% ETc N300 treatment was the lowest, but ANS did not significantly increase. The regression analysis and spatial analysis results showed that under irrigation of 336–348 mm and N application of 254–327 kg ha−1, cotton yield, NUE, and WPI reached more than 80% of the maximum value, with less apparent N loss, thus maintaining the soil N balance in drip-irrigated cotton fields. This study helps to improve the utilization of water and N resources in cotton production. Future research on optimizing water and N management needs to more fully consider environmental pollution to achieve sustainable development of agricultural ecosystems.
1. Introduction
Nitrogen (N) is an indispensable element for plant growth and strongly influences crop yield [1]. At present, most farmers rely on the massive input of N fertilizer to increase crop yield, which has led to the excessive use of N fertilizers [2]. However, overuse of fertilizers harms the environment and public health in addition to lowering crop yields [3,4]. Lowering the N application rate to reduce NO3−-N leaching into groundwater has been suggested in recent years. However, an overemphasis on reducing fertilizer could compromise the sustainable production of crops [5]. Numerous short-term field tests’ findings demonstrated that decreasing N would not lower productivity; yet, these investigations were conducted on farms that applied excessive amounts of N. Because of the high residual fertilizer N, less or no fertilization in the current season did not lower the yield, but soil N was consumed [6]. Therefore, there is some concern that N reduction may be unsustainable over the long term [7]. According to Adams et al. [8] and Li et al. [9], the system as a whole was experiencing lower yields and was unable to collect SOM under lowered fertilizer rates, even while soil acidification was less severe for reduced fertilizer rates compared to the recommended fertilizer rates. Previous research stressed that NUE needs to be interpreted in conjunction with N surplus and the amount of N eliminated in harvested products (as a proxy for crop yield) to optimize N management in crop production [10]. Therefore, for effective crop production and agricultural pollution control, it is crucial to assess a field’s N input–output balance.
The apparent N budget calculated based on soil nutrients and fertilizer inputs can reflect the N input, output, circulation, loss, and N pool changes at a certain soil depth [11,12,13]. A positive value of N balance indicates the accumulation of soil N and is linked to a potential source of pollution, whereas a negative value denotes the extraction of soil N reserves, which would diminish soil fertility and be unsustainable [14]. In addition, it is difficult to measure N loss, as a previous study was unable to distinguish between the individual pathways of N loss from various sources (including leaching, denitrification, volatilization, surface runoff, erosion, gas emissions, and plant aging losses) [15]. The N budget is used to predict the impact of changed management practices on N losses from the agroecosystem [16]. Minimizing losses from N fertilizer can improve crop productivity and N use efficiency. Thus, the N budget is a decision-making tool for assessing the rationale of N management practices.
Drip irrigation is one of the most effective water-saving irrigation methods in arid areas, and it can deliver fertilizer to the cotton root zone along with irrigation water [17,18]. Previous studies have explored the influences of water and N inputs on seed cotton yield, WUE, and NUE under drip irrigation. However, consistent results were difficult to obtain due to the impact of outside factors [19,20]. Research has shown that moderate N application helps to increase cotton yield, but when N application exceeds a certain threshold, it does not increase the cotton yield [21,22], and it even produces a negative effect when the soil water content is grossly inadequate [23,24]. However, Qin et al. [25] and Wu et al. [26] reported that increasing N application rate has the potential to improve crop production under low irrigation, as increased N application can improve the soil water storage capacity and decrease the demand for irrigation [27]. Therefore, it is necessary to further explore reasonable N management strategies for improving seed cotton yield, WUE, and NUE under varying water volumes of drip irrigation.
Regression and spatial analysis models can be used to characterize the relationship between crop yield and soil moisture and fertility [28,29]. However, the N budget has not always been utilized in research to create water and N coupling models to generate a reasonable conclusion on the amount of water and N for cotton field production under drip irrigation [30,31]. Therefore, it is necessary to select the residual, loss, and surplus of soil N as targets for optimization to establish a water and N coupling model, and to seek more accurate ranges of irrigation and N application rates. This study hypothesized optimizing water and N management can improve cotton yield and water and N use efficiency while maintaining soil N balance and reducing N loss. This study aimed to (1) investigate the effects of different irrigation amounts and N application rates on cotton yield, water and N use efficiency, and soil N balance and (2) determine the optimal range of water and N application rates to improve cotton yield and resource use efficiency while maintaining soil N balance according to a comprehensive evaluation model. This study will provide a technical reference for the creation of appropriate strategies for managing water and N and help achieve sustainable agricultural development.
2. Materials and Methods
2.1. Experimental Site
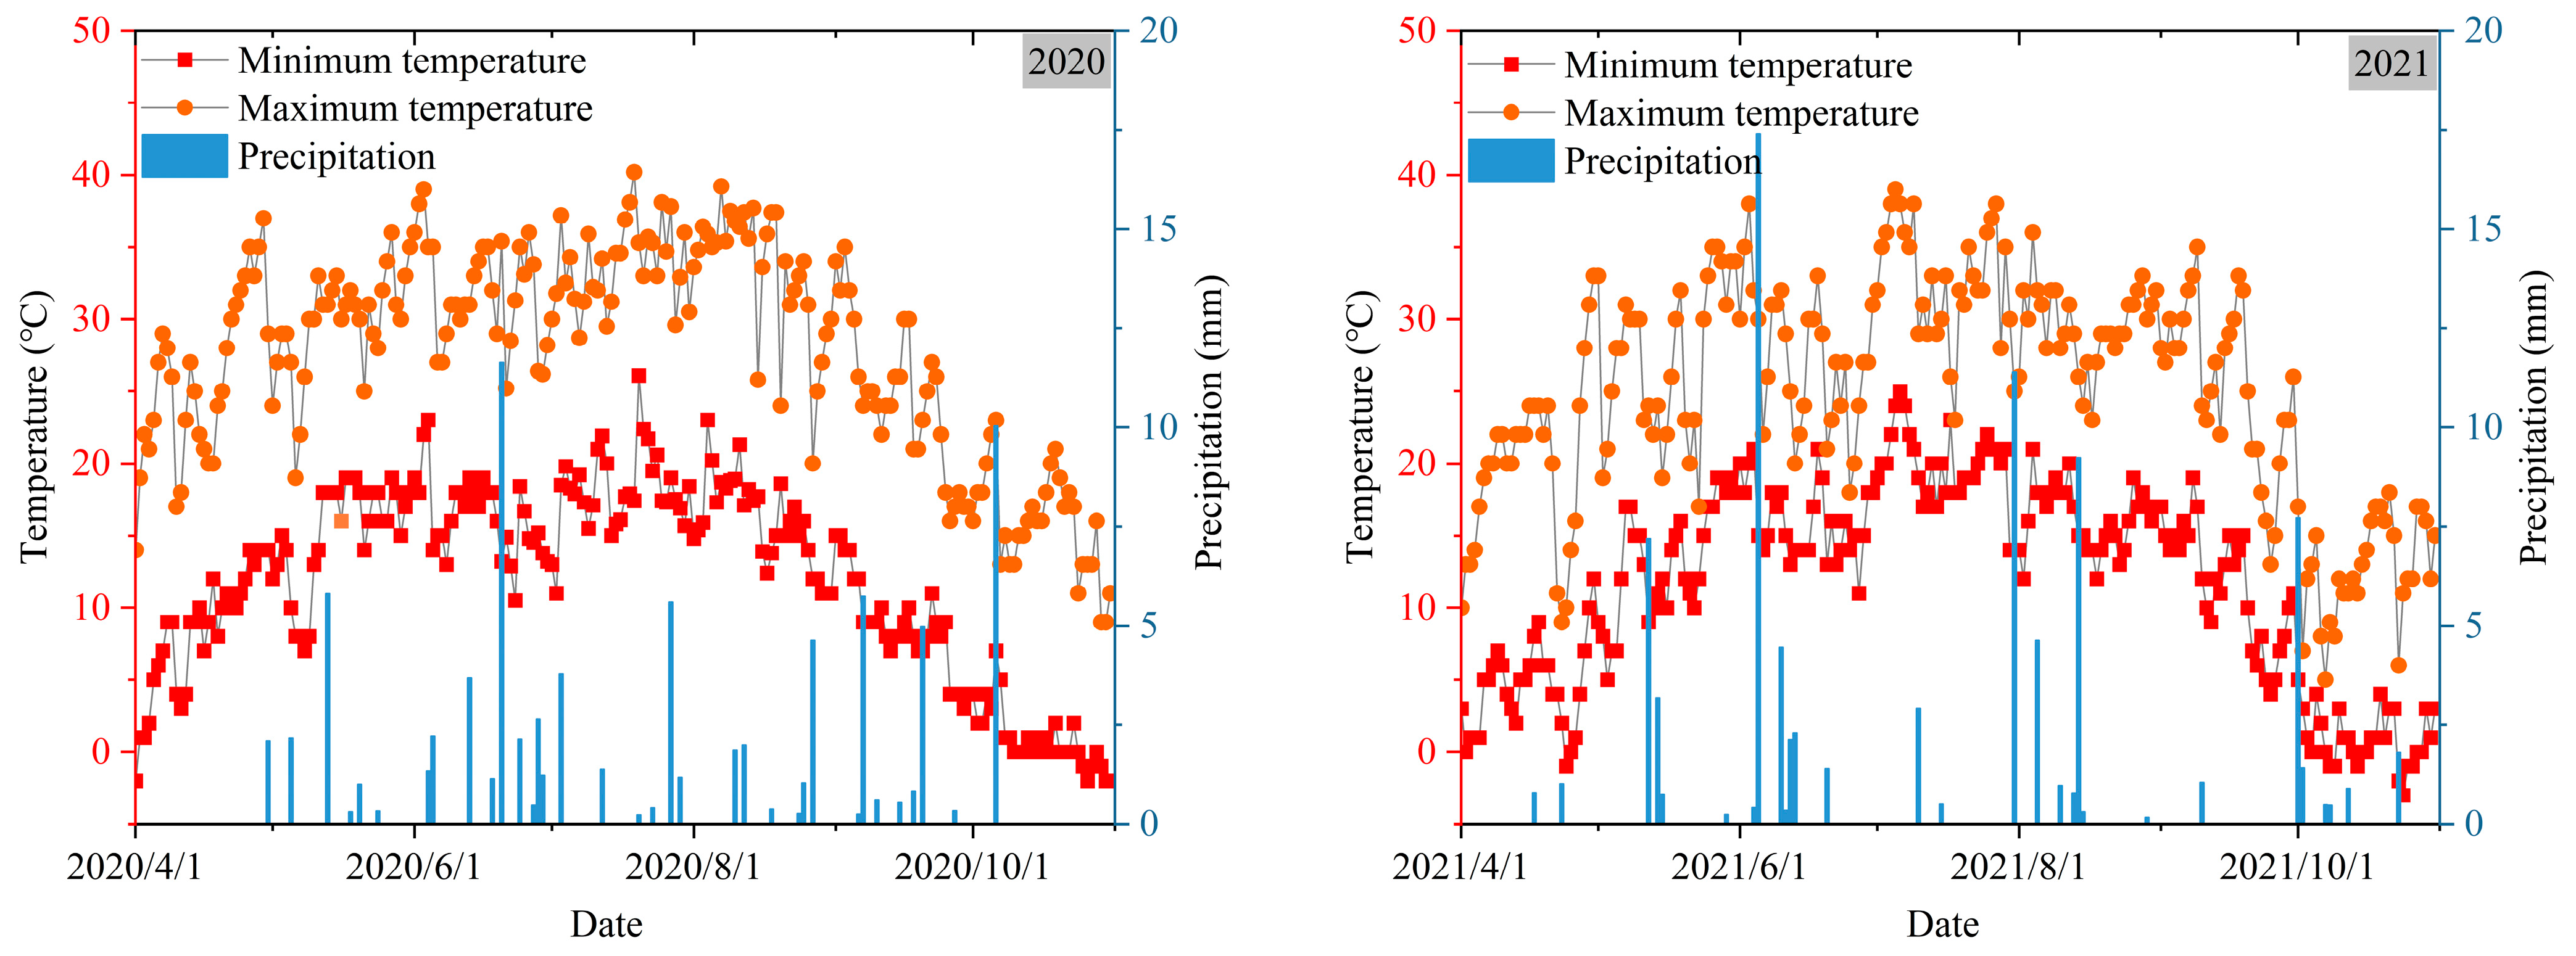
A field experiment was conducted in 2020 and 2021 at an experimental station located at Shihezi University (44°33′ N, 85°98′ E, 450.8 m a.s.l.), Xinjiang, China. The experiment site has a temperate continental climate, with an average annual rainfall of about 200 mm and an annual evaporation of 1700–2200 mm. Meteorological data were obtained from microclimate observation instruments in the experimental station, which automatically measured variables such as wind speed every hour, precipitation, solar radiation, air temperature, and air relative humidity. Figure 1 displays the temperature and precipitation from April through September. The soil texture was loam. The soil physical and chemical properties (0–100 cm soil layer) are shown in Table 1. The cotton growing season was from late April to early October, and no crops were planted in winter.
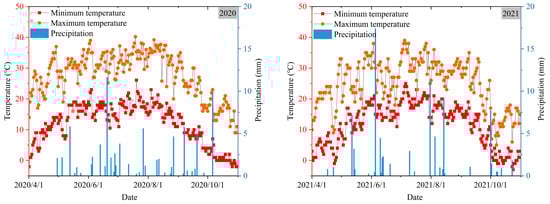
Figure 1.
Daily maximum temperature, minimum temperature, and precipitation during the cotton growing season in 2020 and 2021 at the experimental site.

Table 1.
Soil physical and chemical properties (0–100 cm layer) before sowing.
2.2. Experimental Design
The experiment had a split-plot factorial design (three irrigation amounts and five N application rates), with irrigation amounts as main plots (25 m × 16 m, 400 m2) and N rates as subplots (5 m × 16 m, 80 m2). The three irrigation amounts included full irrigation (100% ETc, ETc is the crop evapotranspiration), moderate irrigation (80% ETc), and low irrigation (60% ETc). The five N application rates included 0, 150, 225, 300, and 375 kg ha−1 (designated as N0, N150, N225, N300 and N375, respectively). Generally, N375 was set to correspond with the local farmer’s N management, N300 was assumed to be the optimized N rate with high yield levels achieved using 80% of farmers’ N application, N225 was assumed to be the sustainable yield level treatments at 60% of farmers’ N rate, N150 was the low N treatment, and N0 was the treatment without any fertilizer N application. Each treatment had three replications, for a total of 45 plots.
The daily crop evapotranspiration (ETc) (mm d−1) was calculated using the following formula:
where ET0 is the reference crop evapotranspiration (mm). KC is the crop coefficient. According to Anapalli et al. [32], Kc was 0.35, 0.76, 1.18, and 0.60 in the seedling, budding, flowering–boll-forming, and mature stages of cotton, respectively.
The reference crop evapotranspiration (ET0, mm) was calculated by the Penman–Monteith formula recommended by the Food and Agriculture Organization (FAO) of the United Nations [33]:
where Rn is the net radiation (MJ m−2 d−1). G is the soil heat flux density (MJ m−2 d−1). Δ is the slope of the saturation vapor pressure function (kPa °C−1). γ is the psychometric constant (kPa °C−1). T is the mean air temperature (°C). es is the saturation vapor pressure (kPa). ea is the actual vapor pressure (kPa). u2 is the wind speed at 2 m above the ground (m s−1).
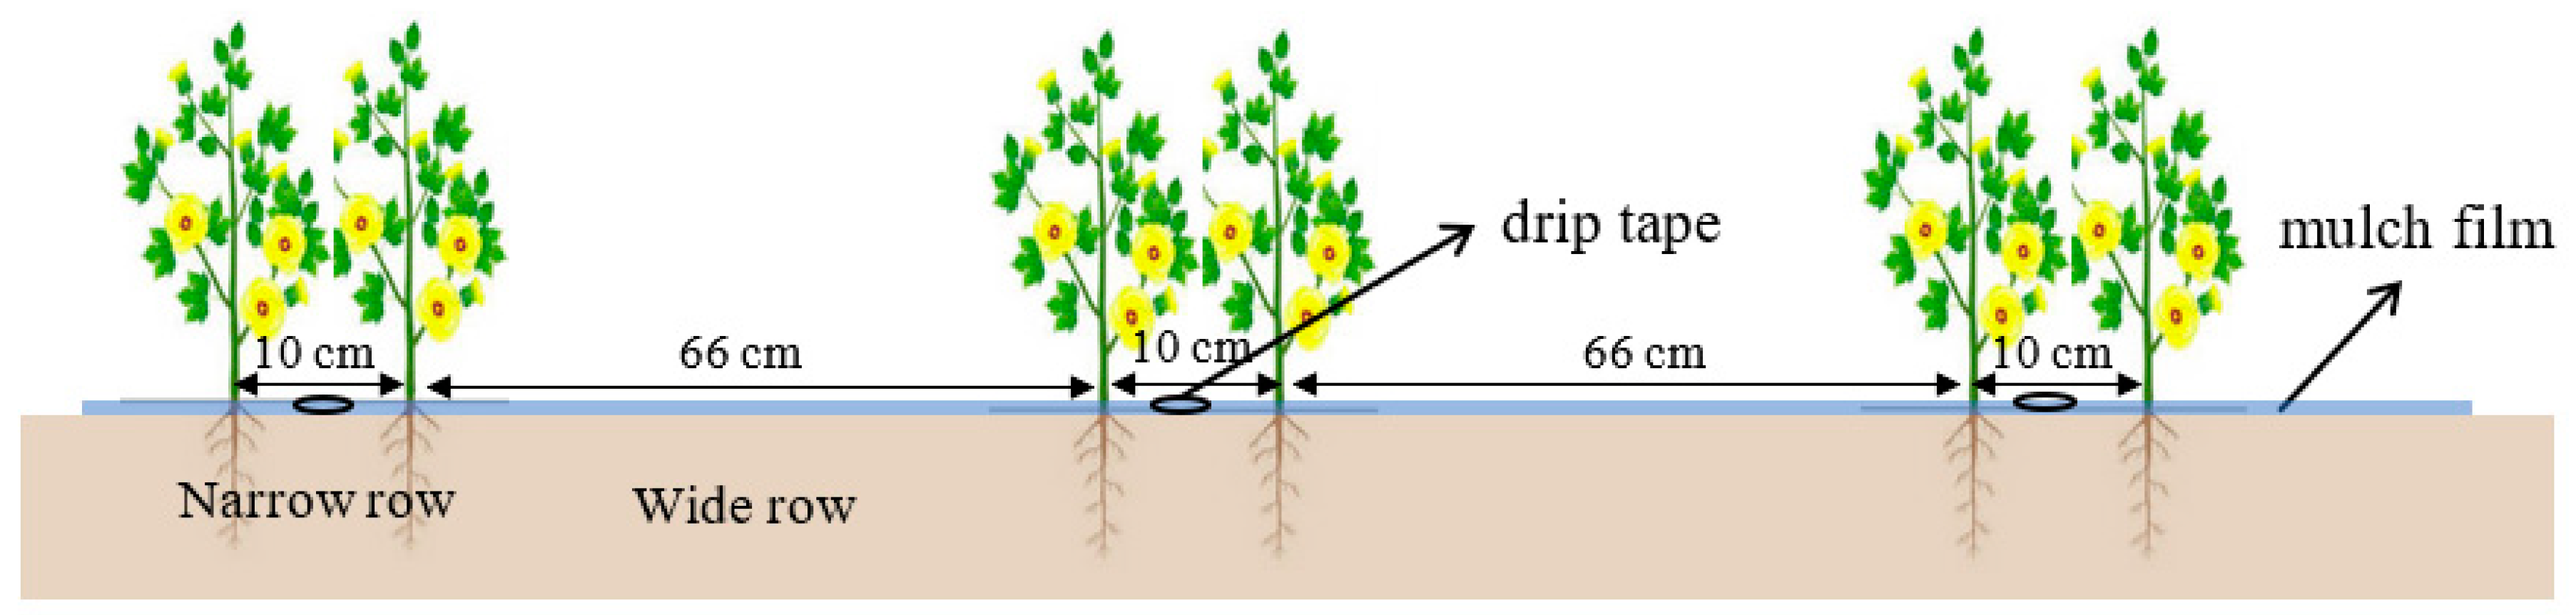
The land was prepared before planting, and cotton seeds (Gossypium hirsutum Cv. Xinluzao 84) were sown after drip tapes and white plastic film (0.006 mm in thickness and 2 m in width) were laid in the field with a machine on 28 April in 2020 (26 April in 2021). Six cotton rows were sown under each film, with the row spacing of 10-66-10-66-10 cm. The plant spacing was 10 cm. All plots were irrigated by the sub-film drip irrigation system. There were three drip tapes (16 mm in diameter) under each plastic film, and each drip tape was placed in the middle of a narrow row (Figure 2). Careful planning and administration resulted in the stabilization of water discharge and pressure. The drip irrigation belt was kept functioning at a flow rate of 1.8 L h−1 at 0.1 MPa operating pressure and an emitter spacing of 30 cm. Water meters were used to monitor the irrigation amount. To promote cotton seed germination, irrigation (45 mm) was carried out on the second day after sowing. During the cotton growth period, irrigation started in early June (budding stage) and ended in mid-August (bolling stage). Due to practical considerations for field entry, labor availability, and water delivery to the field site, the irrigation scheduling methodology followed a cycle of 7–10 days (Table 2). The daily crop evapotranspiration (mm) measurements were used to schedule irrigation, including the time and quantity of each application.

Figure 2.
The scheme of cotton planting and drip tape placement.
Table 2.
Irrigation schedules during the cotton growing seasons in 2020 and 2021.
The amounts of phosphorus (P2O5) and potassium (K2O) fertilizers were 105 kg ha−1 and 75 kg ha−1, respectively. Urea (46% N), potassium dihydrogen phosphate (52% P2O5 and 34% K2O), and crystalline potassium chloride (57% K2O) were applied equally nine times to the cotton field through the drip irrigation system using a pressure differential tank. Pest and weed control followed the conventional practices in the local area. A defoliant was sprayed on 14 September 2020 (18 September 2021). Cotton was harvested on 12 October in 2020 (13 October in 2021).
2.3. Sampling and Measurements
2.3.1. Soil Water and Nutrients
Soil samples were sequentially collected at 0–20, 20–40, 40–60, 60–80, and 80–100 cm depth from three sampling points in each plot using a soil corer three days before sowing and after harvesting. Soil samples were collected in sterile plastic bags, placed on ice, and immediately transported to the laboratory for analysis. Fresh soil samples were extracted with 2 mol L−1 KCl solution (soil–liquid ratio: 1:5), and soil NO3−-N and NH4+-N content was determined by an automated continuous flow analyzer (Alliance/FUTURA+/E, Frepillon, France). Soil water content was measured using the drying–weighing method [34]. Soil organic matter content was analyzed via exothermic heating and oxidation using the H2SO4-K2Cr2O7 method. Soil available phosphorus content was determined by NaHCO3 extraction. Soil available potassium content was determined by NH4OAc extraction–flame photometry [35].
2.3.2. Plant N Uptake and N Use Efficiency
On 13 September 2020 (12 September 2021), three plant samples with similar growth status were collected from each sampling point (three sampling points in each plot) during the cotton boll opening stage. The plant samples were divided into stems, leaves, and bolls. Each plant component was dried at 75 °C to constant weight before weighing. The dry samples were ground, sieved through a 0.5 mm sieve, and reacted with H2SO4-H2O2. After that, the plant N concentration was determined using the Kjeldahl method [36].
In this study, the N use efficiency (NUE) refers to the recovery efficiency of N (REN), the ratio of plant N to N supply (unit: %) [37]:
where UT is cotton N uptake measured in above-ground biomass (kg ha−1) in a plot that received fertilizer N at a rate of FN (kg ha−1), and U0 is cotton N uptake without fertilizer N addition where there is only a supply of soil N.
NUE (%) = (UT − U0)/FN × 100
2.3.3. Seed Cotton Yield and Irrigation Water Productivity (WPI)
Three subplots (2.92 m × 2.28 m) were selected from each plot for harvest. The number of cotton plants and bolls in each subplot was counted to calculate the number of bolls per plant. Seed cotton was harvested by hand, and the seed cotton samples of each subplot were bagged and weighed separately to calculate the single boll weight. The results were then converted into yield per unit area (kg ha−1).
The WPI was calculated according to the method of Fernández [38]:
where Y is the seed cotton yield (kg ha−1) and W is the total irrigation amount in the entire growth period (m3 ha−1).
WPI (kg m−3) = Y/W
2.3.4. Soil N Balance
The N inputs in the experiment field included the fertilizer N applied, the N brought in by irrigation water (can be ignored), the initial soil inorganic N accumulation (ISNmin), and the mineralized N in the soil during crop growth. The N outputs included crop N uptake, residual soil inorganic N accumulation (RSNmin), and apparent N loss (ANL). Then, the soil inorganic N accumulation (Nmin), apparent N mineralization (ANM), ANL, and apparent N surplus (ANS) were calculated according to previous studies [39,40,41]:
where D is the soil thickness (cm), SBD is the soil bulk density (g cm−3), and SIN is the soil inorganic N content (mg kg−1).
where Nup is the cotton N uptake (kg ha−1), RSNmin is the residual soil Nmin in the 0–100 cm soil after cotton harvesting (kg ha−1), ISNmin is the initial soil Nmin in the 0–100 cm soil before cotton sowing (kg ha−1), and FN is the fertilizer N application rate (kg ha−1).
Nmin (kg ha−1) = ∑ (D × SBD × SIN)/10
ANM (kg ha−1) = (Nup + RSNmin) − ISNmin
ANL (kg ha−1) = (ISNmin + FN + ANM) − (RSNmin + UN)
ANS (kg ha−1) = RSNmin + ANL
2.3.5. Optimization of Irrigation Amount and N Application Rate
In this study, seed cotton yield, NUE, WPI, RSNmin, ANL, and ANS were considered to optimize irrigation and N application. With irrigation amount and N application rate as the independent variables, a binary quadratic regression equation was created, with yield (η1), NUE (η2), WPI (η3), RSNmin (η4), ANL (η5), and ANS (η7) as the dependent variables. Due to differences in dimensions, they could not be directly compared with each other, so the objectives to be optimized were further normalized, and a contour plot with consistent units was plotted. Two optimization thresholds (0.8 η and 0.9 η) were set up. When the relative values of the objectives reached 0.8 or 0.9, the corresponding ranges of irrigation amount and N application rate were recorded [42].
2.4. Data Analysis
The data were compiled and analyzed using Microsoft Excel 2021 (Microsoft Corporation, New Mexico, NW, USA). All statistical analyses were performed using SPSS 22.0 (SPSS Inc., Chicago, IL, USA). Analysis of variance (ANOVA) was used to test the difference in each parameter among different treatments (Table S1). Duncan’s multiple range test was used to determine the significance of differences between treatments at p < 0.05. The dry matter accumulation, N uptake, and yield were analyzed by combining the two years’ data (2020 and 2021) and running ANOVA and means separations. Origin 2023b (OriginLab Corp., Northampton, MA, USA) was used to draw graphs.
3. Results
3.1. Dry Matter Accumulation and N Uptake
The effects of irrigation amounts and N application rates on dry matter accumulation of cotton plant parts (leaves, stems, and bolls) are summarized in Table 3. The dry matter accumulation of cotton was significantly affected by the irrigation amounts and N application rates (p < 0.05). The total dry matter accumulation for the 80% ETc and 100% ETc treatments was significantly higher than that for the 60% ETc treatment by 12.63% and 12.43%. There was no significant difference in the total dry matter accumulation between the 80% ETc and 100% ETc treatments, but the 80% ETc treatment generated a larger dry matter accumulation of cotton bolls (5.00%) than the 100% ETc treatment. Under the 60% ETc treatment, the total dry matter accumulation of cotton increased with the N application rate. There was no significant difference in total dry matter accumulation between N300 and N375 treatments under the 80% ETc and 100% ETc treatments. However, under the 80% ETc treatment, the accumulation of dry matter in bolls did not differ significantly between the N300 and N375 treatments. Under the 100% ETc treatment, there was no difference in the boll dry matter accumulation between the N375 and N300 treatments.
Table 3.
Dry matter accumulation of cotton under different irrigation and N treatments at the boll opening stage in 2020 and 2021.
Cotton N uptake was significantly affected by irrigation amount and N application rate (Table 4). The lowest total N uptake was obtained under the 60% ETc treatment, 15.52% lower than that under the 80% ETc treatment and 14.94% lower than that under the 100% ETc treatment. There was no significant difference in the total N uptake between the 80% ETc and 100% ETc treatments, but the cotton boll N uptake of the 80% ETc treatment was higher than that of the 100% ETc treatment; the 100% ETc treatment was more beneficial and increased the N uptake of cotton stems compared to the 80% ETc treatment. Under the 60% ETc treatment, the total N uptake increased with the N application rate. But under the 80% ETc and 100% ETc treatments, the total N uptake of the N300 treatment was the highest due to compared with the N300 treatment, and the N375 treatment reduced the N uptake in bolls by 6.11% and 7.95%.
Table 4.
N uptake of cotton at the boll opening stage under different irrigation and N treatments in 2020 and 2021.
3.2. Seed Cotton Yield
The effects of irrigation amount and N application rate on seed cotton yield and yield components are summarized in Table 5. The seed cotton yield of the 80% ETc treatment was the highest, increasing by 6.43% and 26.80% compared with the 100% ETc and 60% ETc treatments, respectively. The N application rate had an impact on the yield of seed cotton as well. Overall, the N300 treatment showed the highest yield of seed cotton. However, under the 60% ETc treatment, there was no difference in seed cotton yield between the N300 and N375 treatments. Under the 80% ETc treatment, the seed cotton yield of the N300 treatment was 17.48% higher than that of the N375 treatment. Under the 100% ETc treatment, there was no difference in seed cotton yield between the N225, N300, and N375 treatments.
Table 5.
Seed cotton yield and yield components under different irrigation and N treatments in 2020 and 2021.
3.3. NUE and WPI
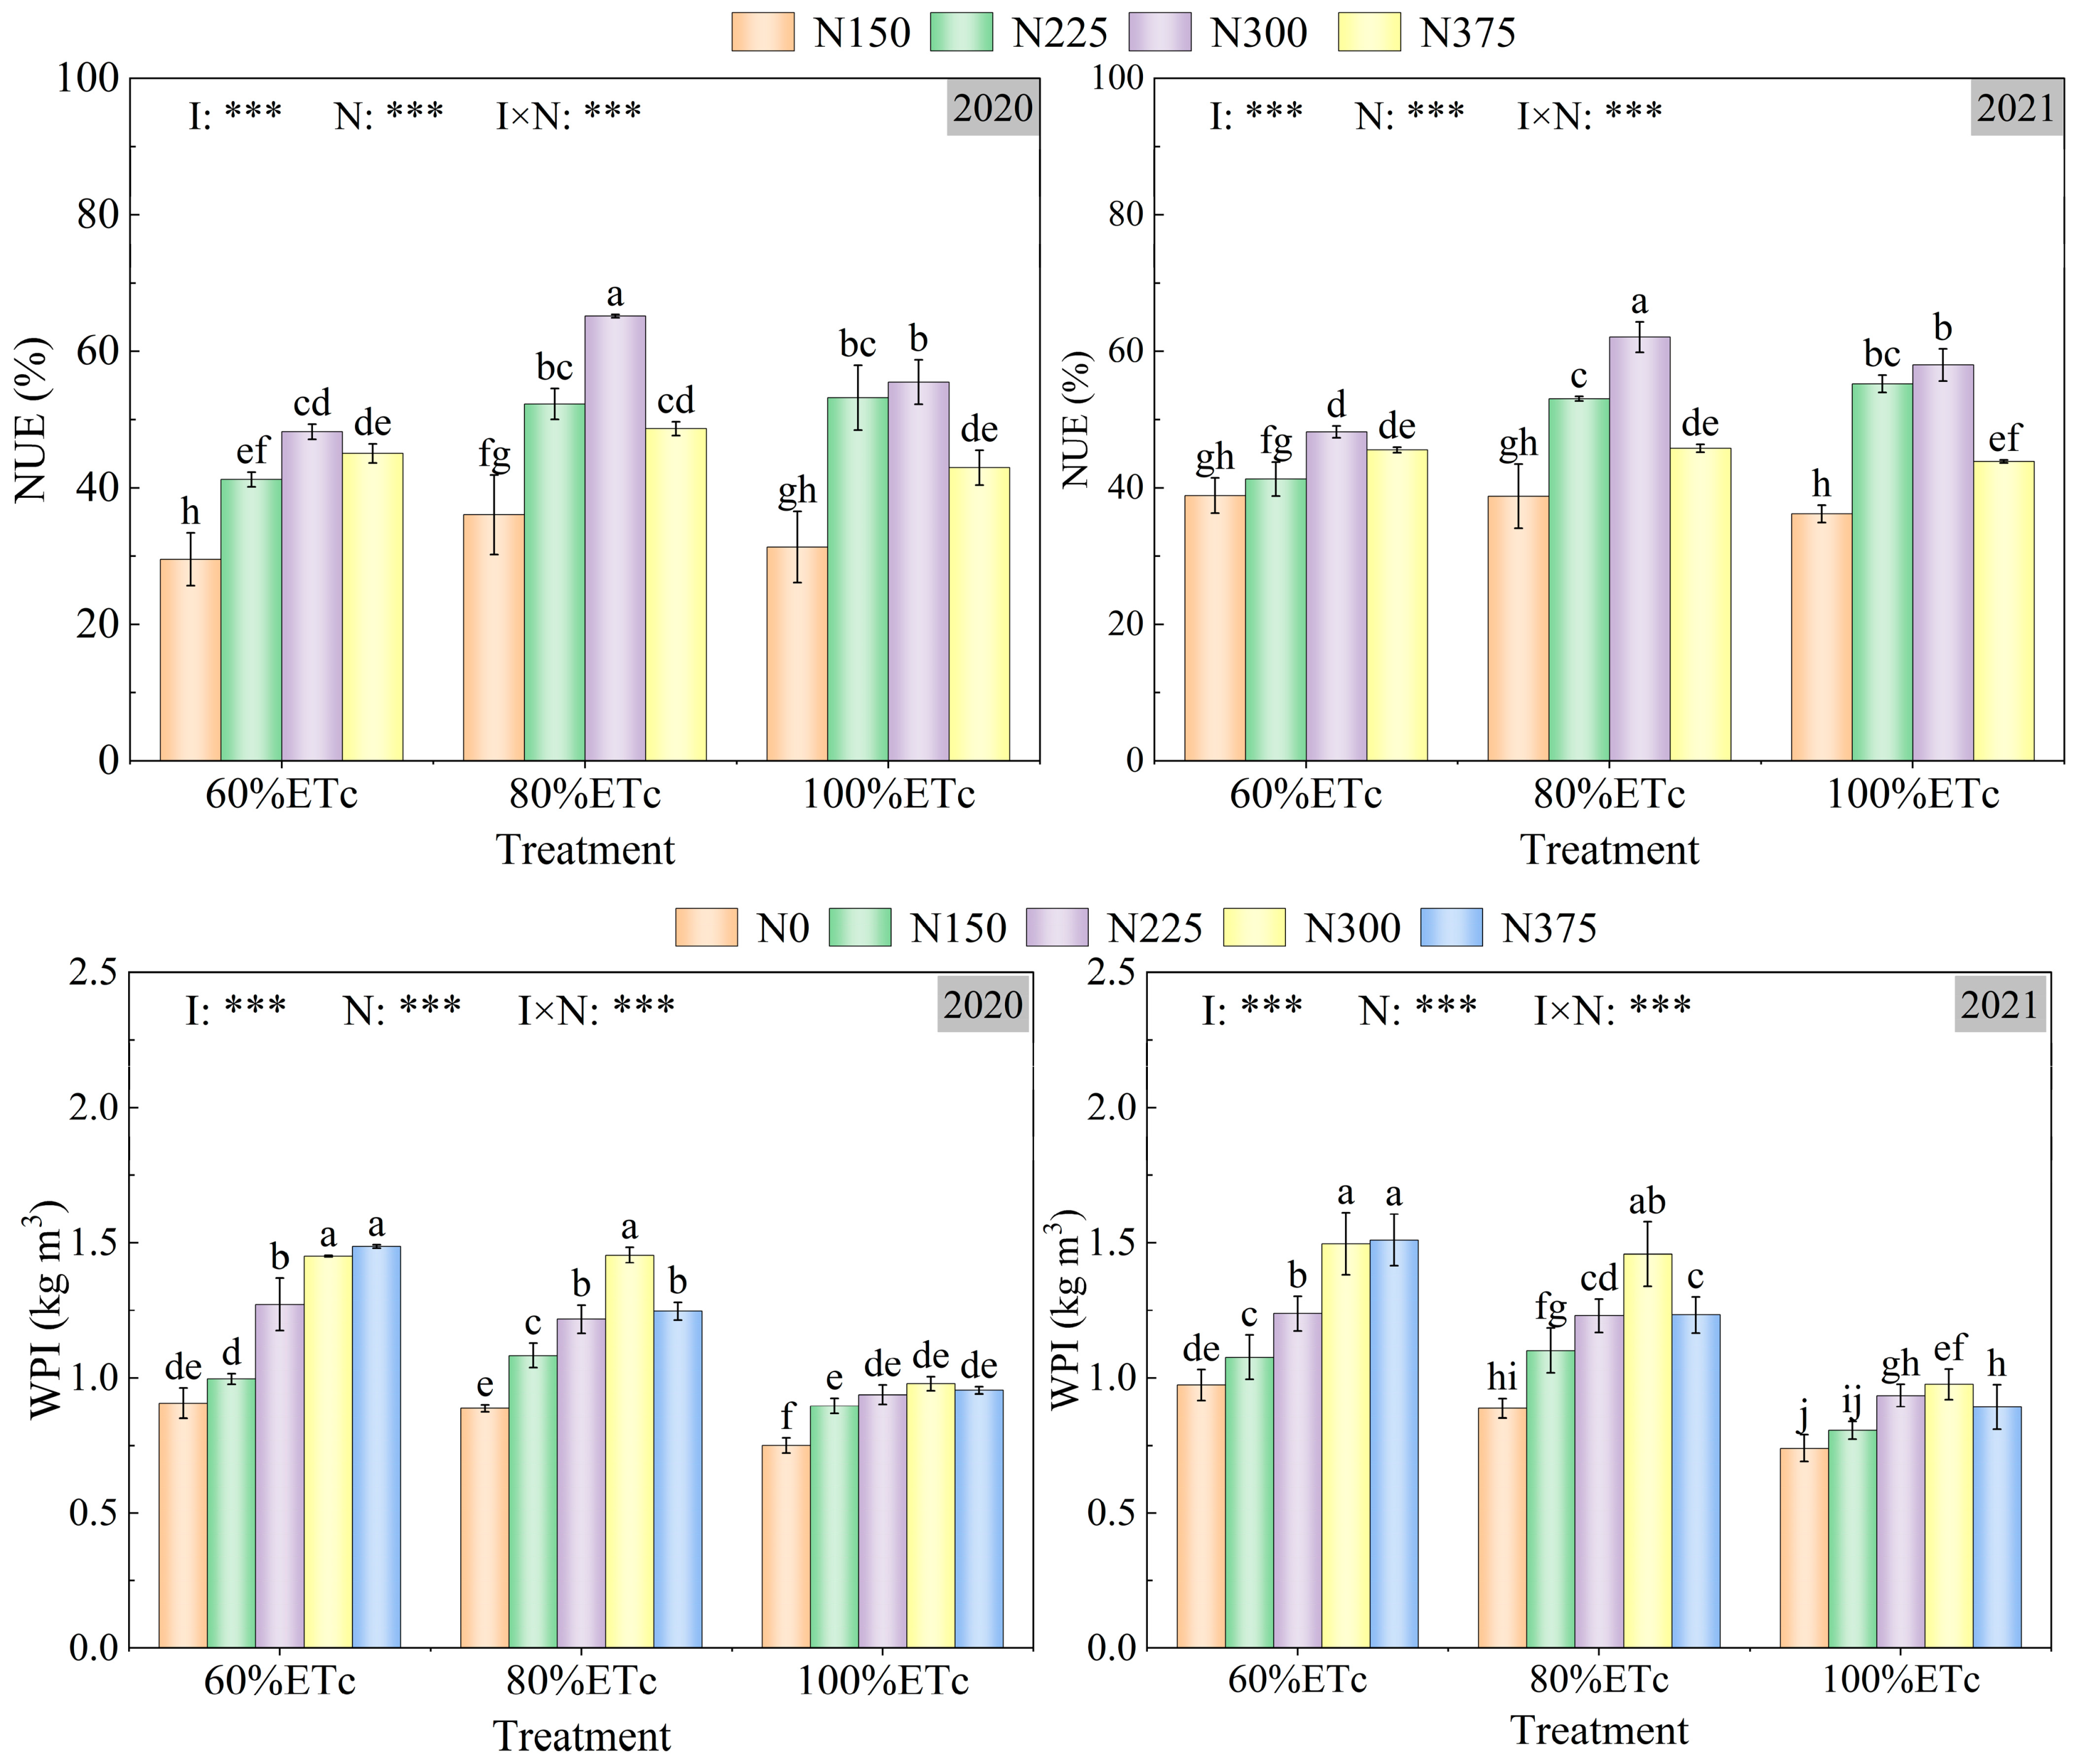
The NUE and WPI of cotton were significantly affected by irrigation amount (p < 0.001), N application rate (p < 0.001), and their interactions (p < 0.001) (Figure 3). The NUE of the 80% ETc treatment was significantly increased compared with that of the 60% ETc treatment. But compared with 100% ETc treatment, the NUE of the 80% ETc treatment increased by 10.48% in 2020, and there was no difference in 2021. Under three irrigation treatments, the highest NUE was found for the N300 treatment. Moreover, the NUE in the 80% ETc N300 treatment was higher by 35.14% and 17.42% compared with that of the 60% ETc N300 and 100% ETc N300 treatments, respectively, in 2020, and increased by 28.78% and 7.01%, respectively, in 2021.
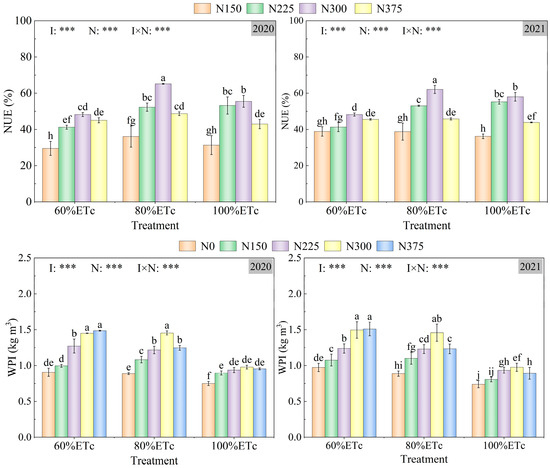
Figure 3.
N use efficiency (NUE) and irrigation water productivity (WPI) under different irrigation and N treatments in 2020 and 2021. Different lowercase letters above the error bars indicate a significant difference between different treatments at p < 0.05. ***, p < 0.001. N0, 0 kg N ha−1; N150, 150 kg N ha−1; N225, 225 kg N ha−1; N300, 300 kg N ha−1; N375, 375 kg N ha−1. The same below.
WPI significantly decreased with irrigation amount (Figure 3). The N300 treatments had the highest WPI under three irrigation amounts. Under the 60% ETc treatment, there was no difference in WPI between the N300 and N375 treatments. Under the 80% ETc treatment, the WPI of cotton in the N375 treatment was lower than that in the N300 treatment by 15.46% and 14.31%, respectively, in 2020 and 2021. Under the 100% ETc treatment, there was no difference in WPI among N225, N300, and N375 treatments.
3.4. N Balance in Soil–Plant System
3.4.1. Soil Inorganic N Residues
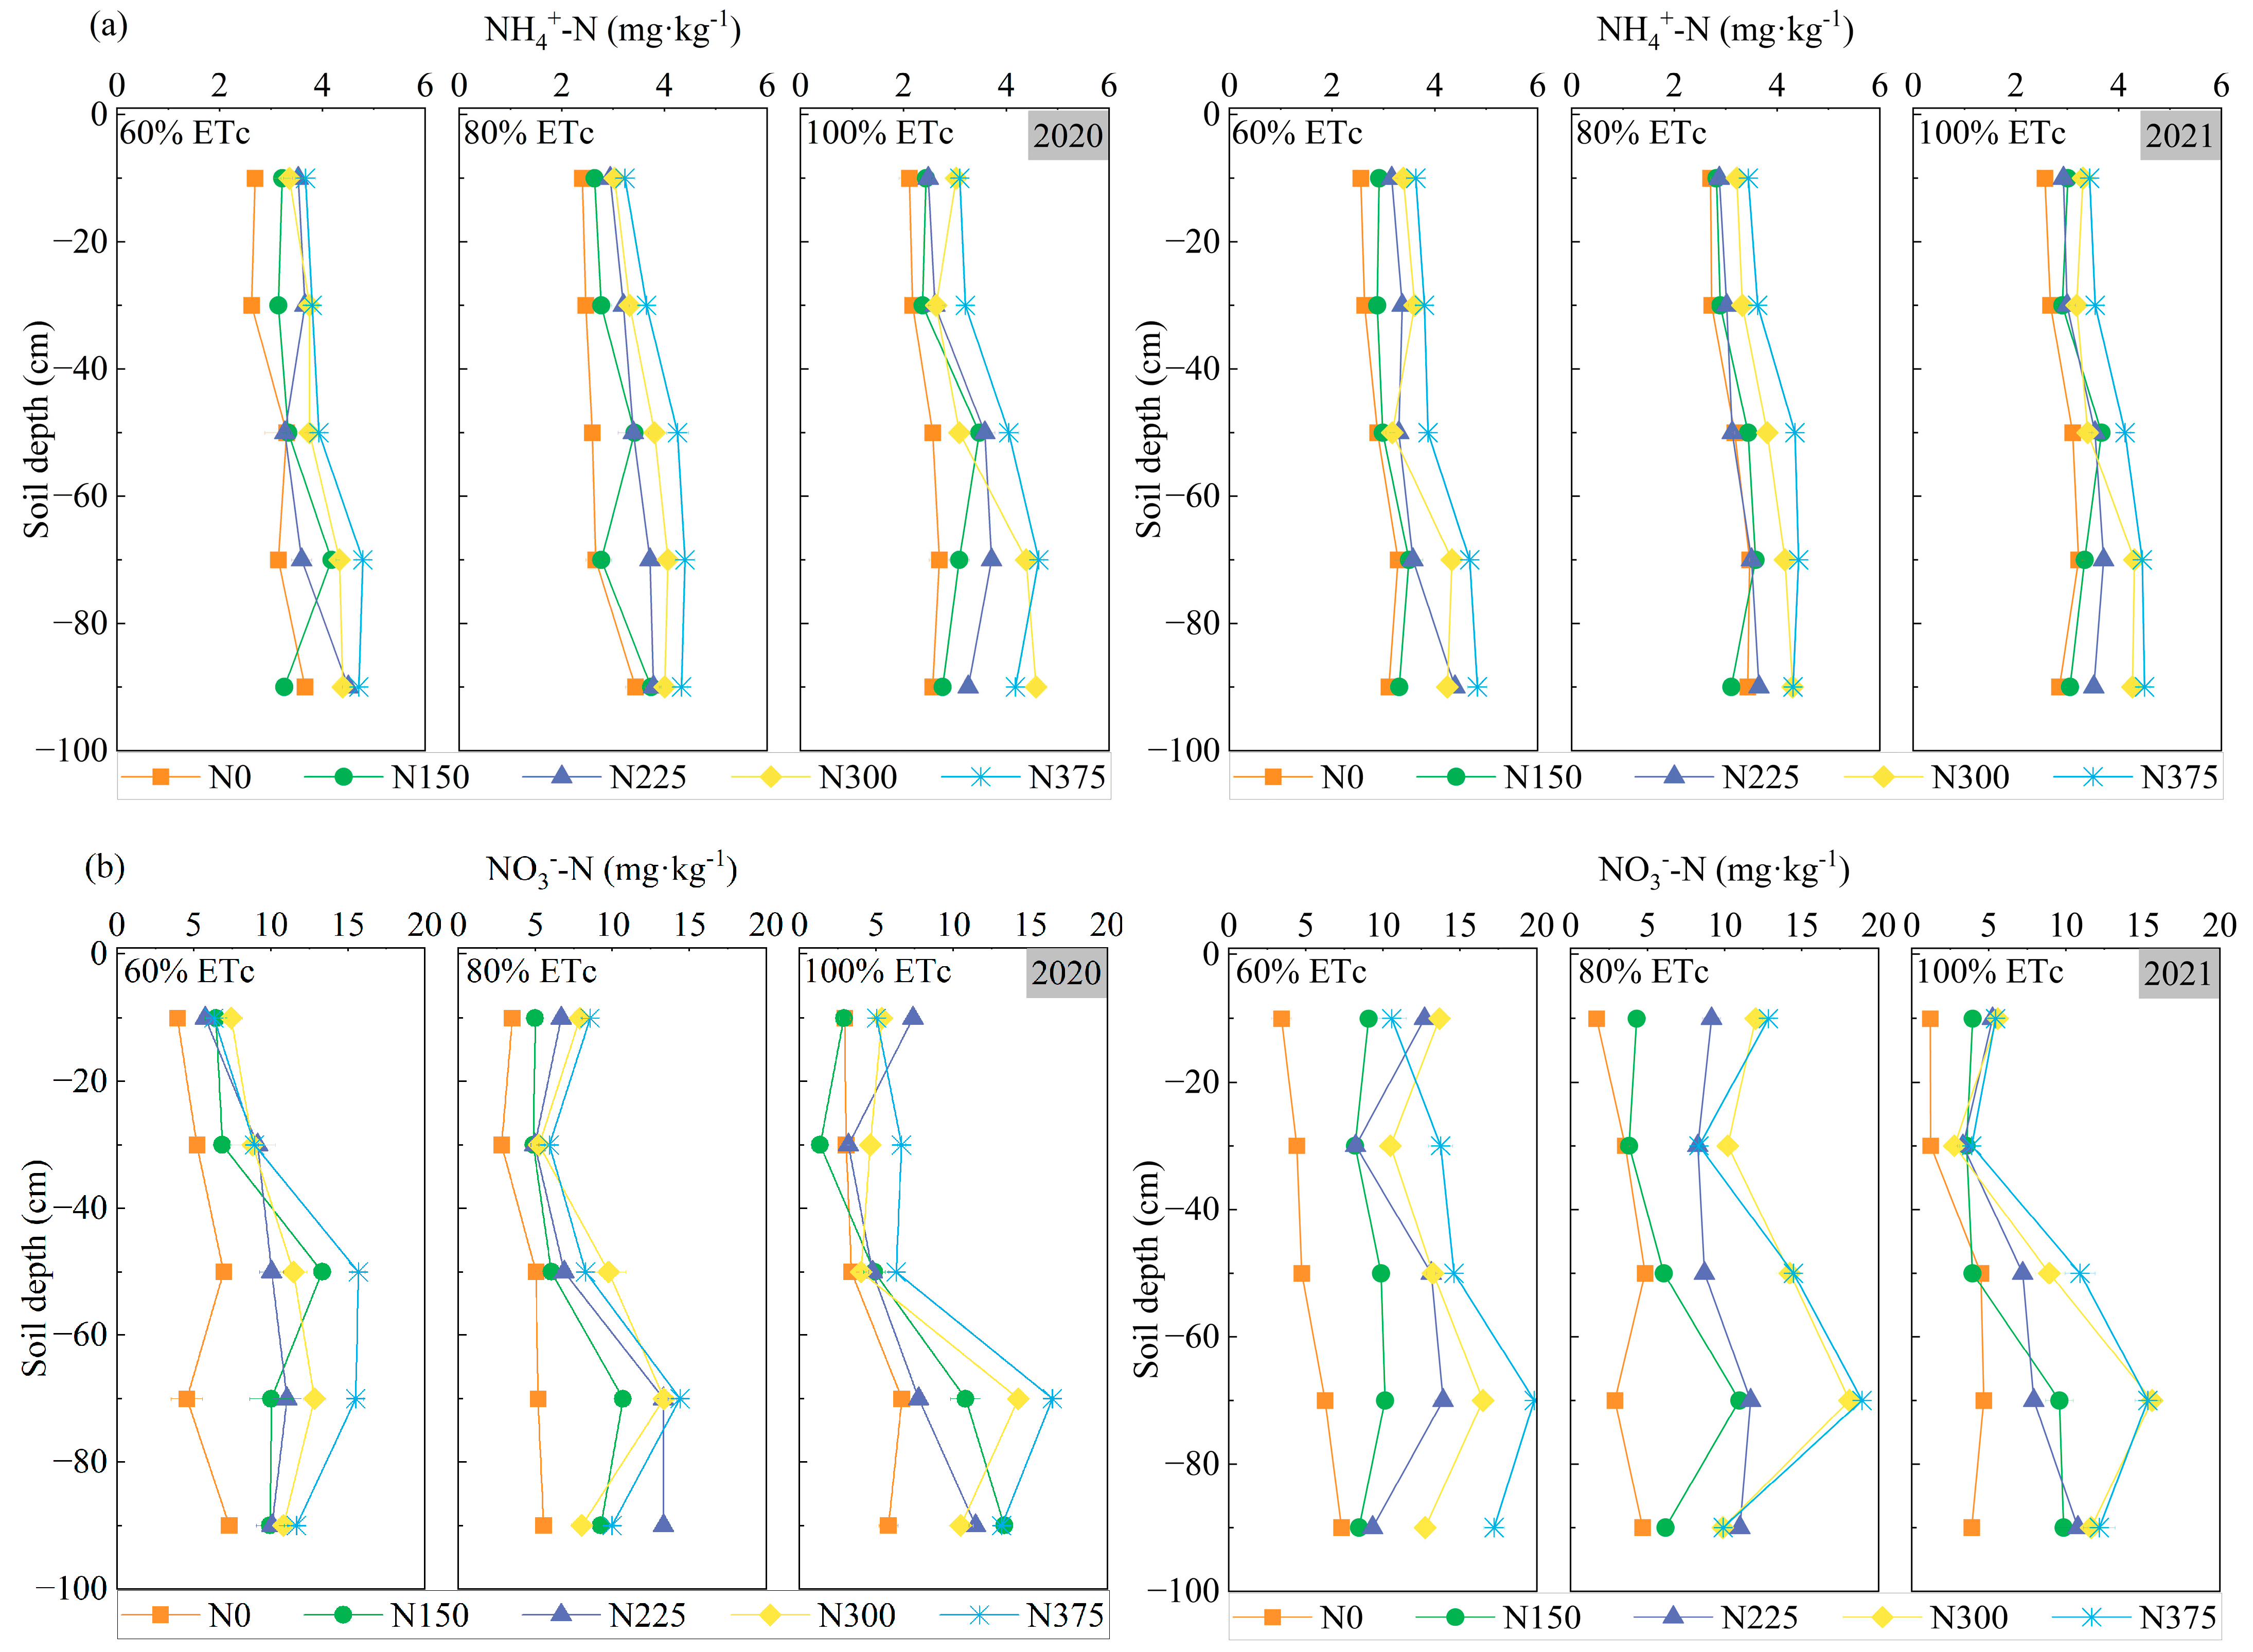
The soil NH4+-N content was low in different treatments (2.42–4.17 mg kg−1 in 2020; 2.88–4.16 mg kg−1 in 2021) and evenly distributed in the soil profile (Figure 4a). The NO3−-N content of each soil layer varied greatly, and it was mainly concentrated in the 60–100 cm soil layer in each treatment. With the increase in irrigation amount, the content of NO3−-N in the 0–100 cm soil layer significantly decreased, especially in the 0–40 cm soil layer (Figure 4b).
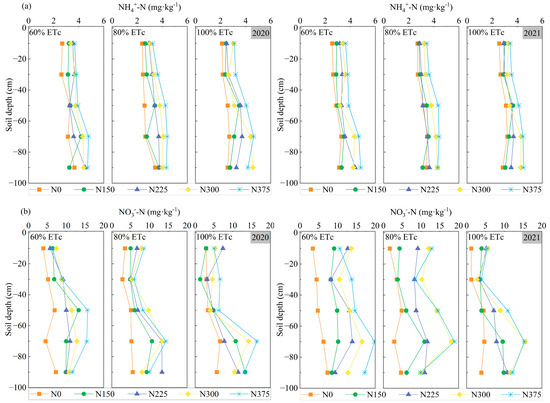
Figure 4.
The NH4+-N (a) and NO3−-N (b) content of different soil layers under different irrigation and N treatments in 2020 and 2021.
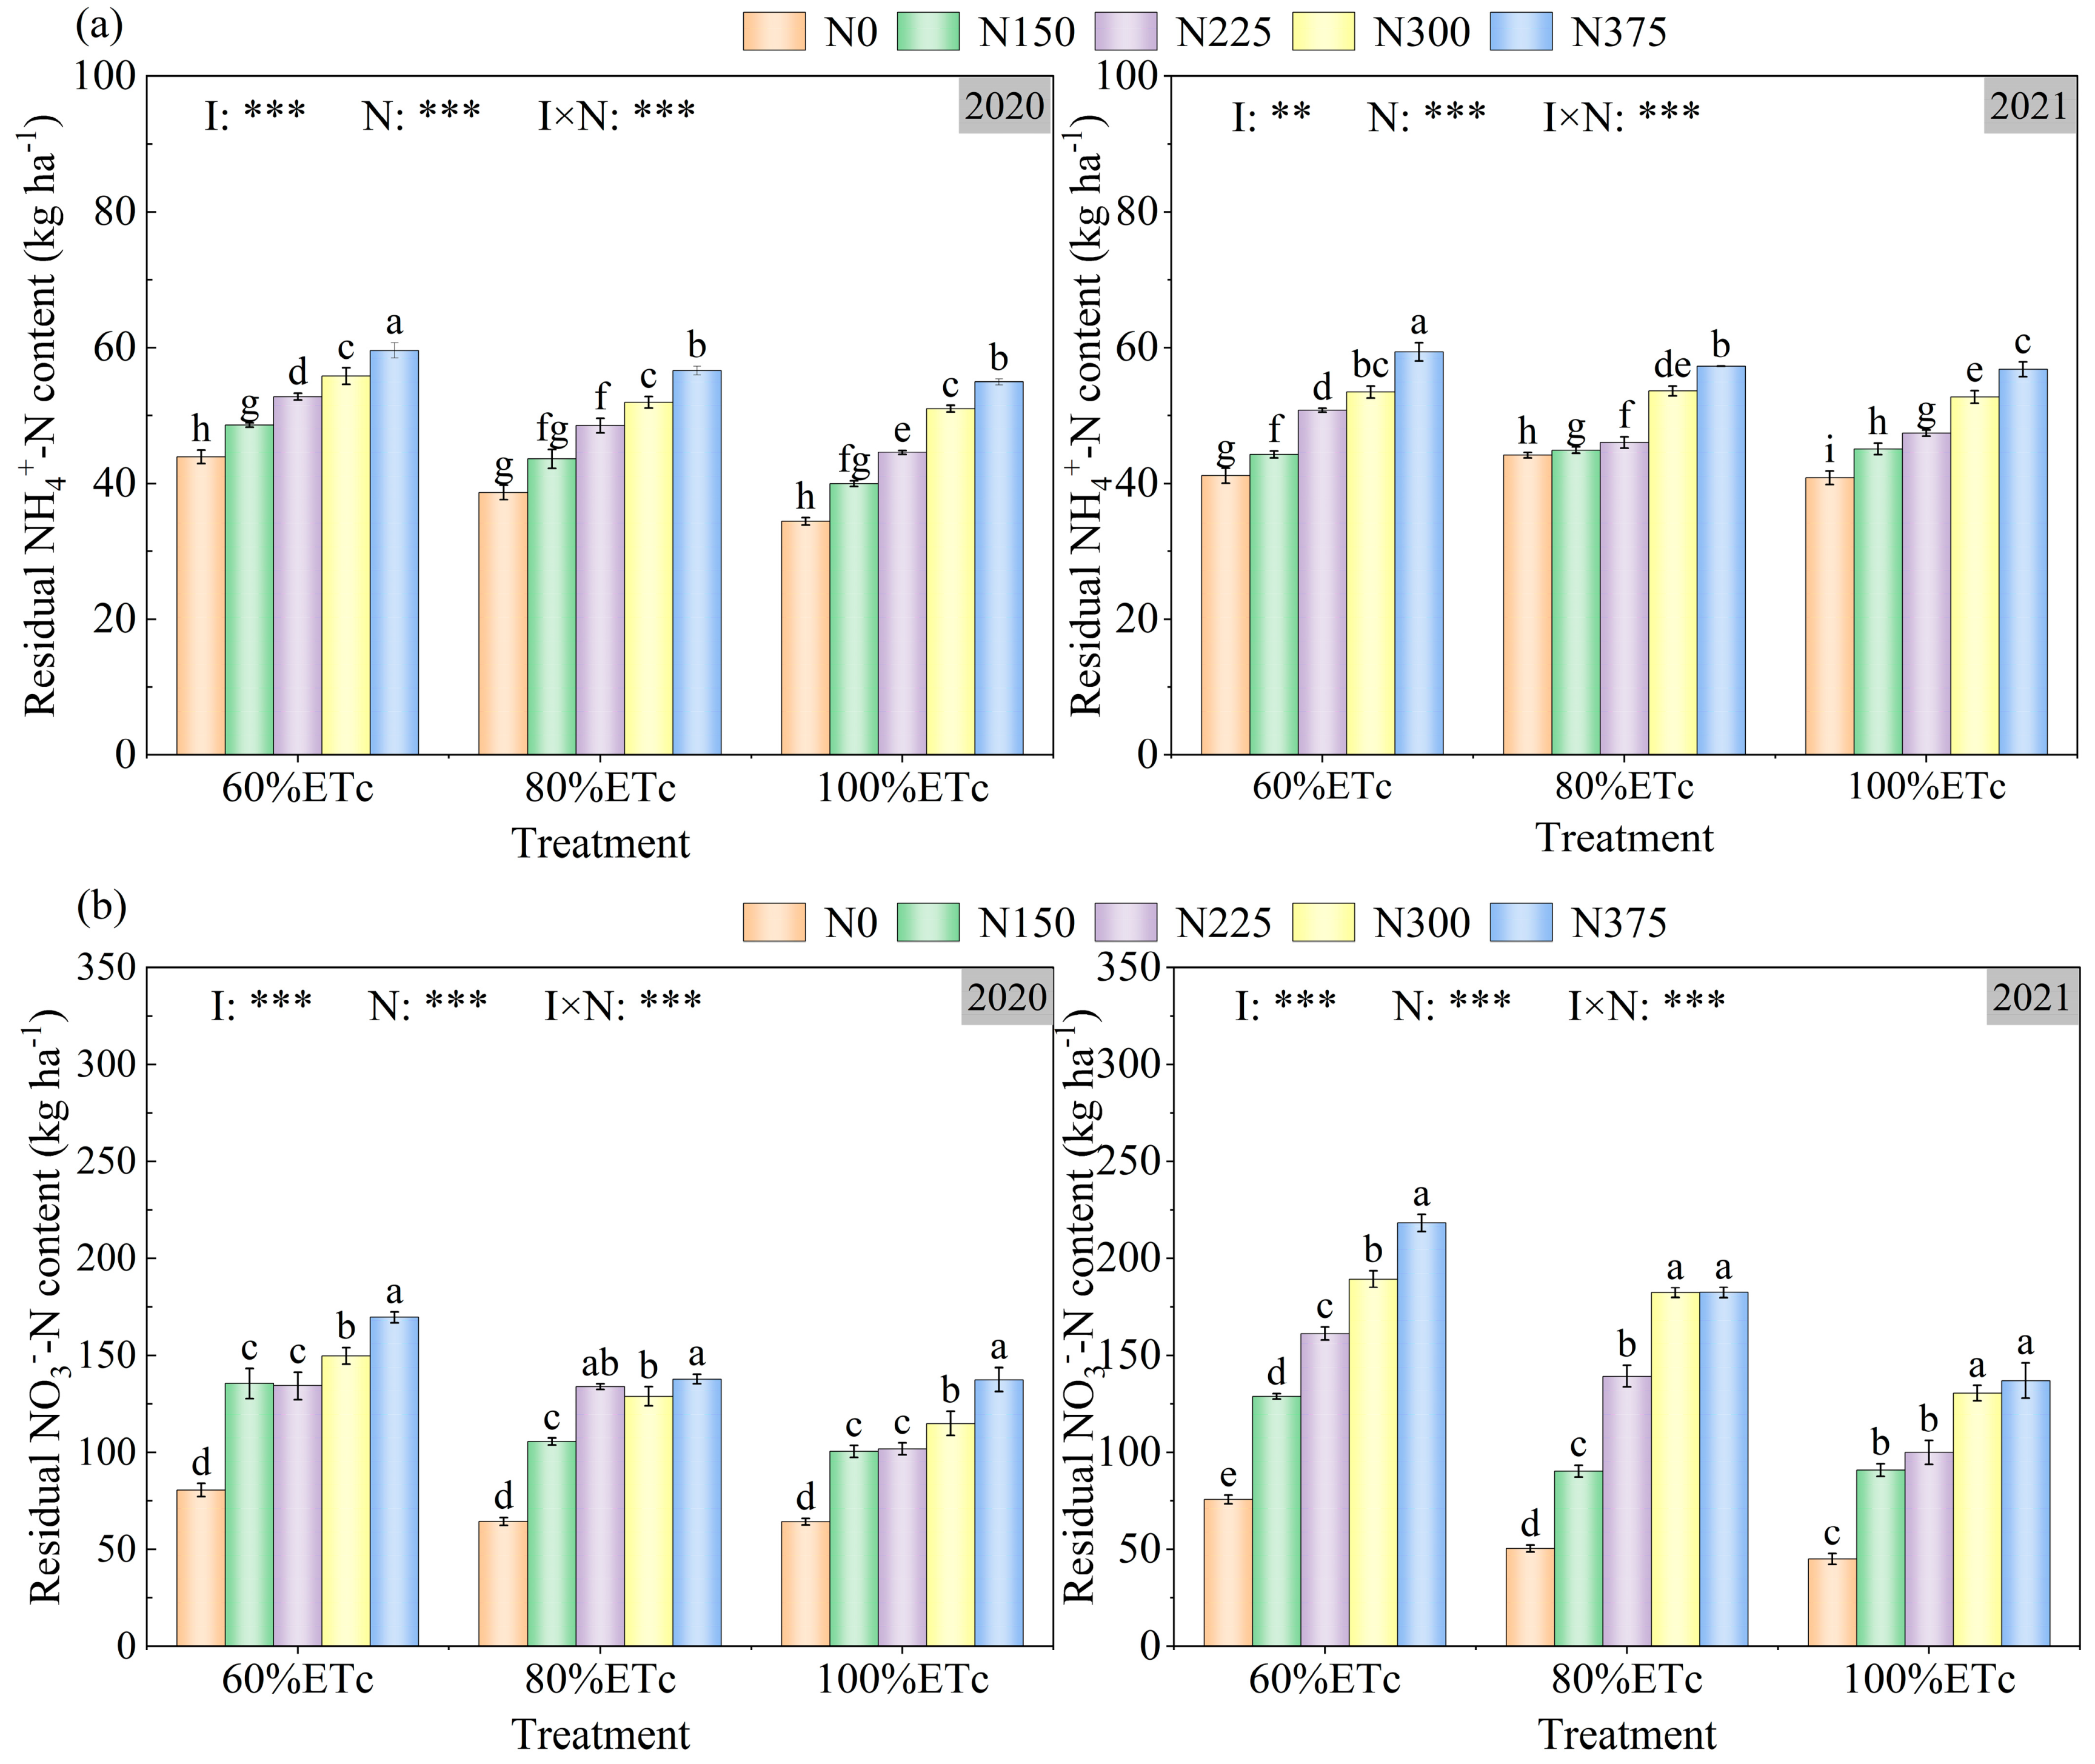
The residual NH4+-N in the 0–100 cm soil layer significantly decreased with irrigation amount (Figure 5a). The residual NH4+-N of the 100% ETc treatments decreased by 6.04% and 13.73% compared with that of the 80% ETc and 60% ETc treatments, respectively, in 2020, and decreased by 1.26% and 2.46%, respectively, in 2021. In addition, the residual NH4+-N in the 0–100 cm soil layer significantly increased with the N application rate under the same irrigation amount.
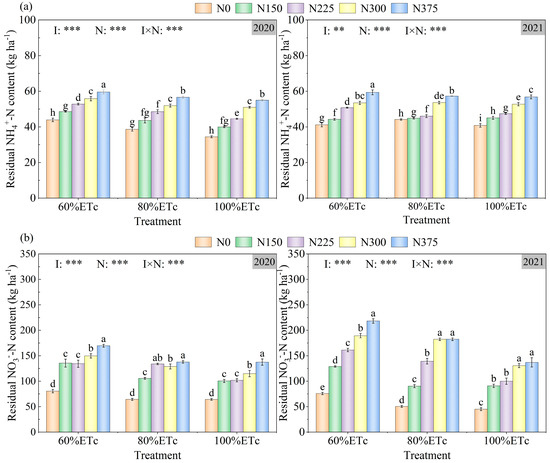
Figure 5.
Residual NH4+-N (a) and NO3−-N (b) content of different soil layers under different irrigation and N treatments in 2020 and 2021. Different lowercase letters above the error bars indicate a significant difference between different treatments at p < 0.05. **, p < 0.01; ***, p < 0.001.
The residual NO3−-N in the 0–100 cm soil layer of the 100% ETc treatment decreased by 9.01% and 22.49% compared with that of the 80% ETc and 60% ETc treatments, respectively, in 2020, and decreased by 21.83% and 34.81%, respectively, in 2021 (Figure 5b). The residual NO3−-N significantly increased with the N application rate under the same irrigation amount. The residual NO3−-N with the N150, N225, N300, and N375 treatments increased by 63.16%, 76.69%, 87.99%, and 112.57%, respectively, in 2020, and increased by 81.32%, 134.00%, 192.95%, and 214.21%, respectively, in 2021, compared with that of the N0 treatment.
3.4.2. Soil N Balance
The effects of irrigation amounts and N application rates on soil N balance are summarized in Table 6. The irrigation amounts and N application rates had a substantial impact on the RSNmin, ANL, and ANS (p < 0.05). The 2-year results showed that the RSNmin and ANS decreased with the increase in the irrigation amount and increased with the increase in the N application rate. The ANL of the 80% ETc treatment was 31.67% and 29.31% lower in 2020 than that of the 100% ETc treatment and 60% ETc treatment, and 16.13% and 14.29% lower in 2021, respectively.
Table 6.
N balance in the soil–cotton system in 2020 and 2021.
In 2020 and 2021, as the N application rate increased from 150 to 225 and 300 kg ha−1, ANL increased or showed no significant difference under the 60% and 100% ETc treatments, while ANL significantly decreased under the 80% ETc treatment. However, when the N application rate increased to 375 kg ha−1, ANL was considerably higher than other N application rate treatments under the same irrigation amount. Compared with the N300 treatment, the ANL of the N375 treatment increased by 36.48–46.16% (60% ETc), 204.08–274.07% (80% ETc), and 103.39–110.75% (100% ETc), respectively. The ANL of the 80% ETc N300 treatment was the lowest in both 2021 and 2022.
In 2020, ANS significantly increased with the increase in the N application rate under the 60% ETc conditions, but there was no significant difference between the N150 and N225 (or N300) treatments under 80% ETc and 100% ETc conditions. In 2021, under 60% ETc and 100% ETc conditions, ANS significantly increased with increasing N application, while under 80% ETc conditions, there was no significant difference between the N225 and N300 treatments. It should be noted that ANS sharply increased under high N application (375 kg ha−1). Under different irrigation conditions, the ANS of the N225 and N300 treatments increased by 4.00–19.87% and 22.01–31.80%, respectively, compared to the N150 treatments, while the ANS of the N375 treatment increased by 58.61–73.33%.
3.5. Multi-Objective Optimization
The multiple regression analysis results showed that the coefficients of determination of the established nonlinear regression equations were all above 0.8 (Table 7), suggesting that the regression model could be used to determine the effects of irrigation amounts and N application rates on the objectives to be optimized. The highest cotton yield was achieved with 395.14 mm of irrigation and a N rate of 375 kg ha−1. The NUE was at its highest when the irrigation amount was 375.42 mm and the N applied was 284 kg ha−1. The WPI achieved its maximum with an irrigation level of 259.20 mm and N rate of 375,375 kg ha−1. When the irrigation amount was 439.03, 320.30, and 402.11 mm and no N was applied, the soil N residue, ANL, and ANS reached the minimum level, respectively. The corresponding irrigation amount and N rate ranges under the two optimization thresholds (0.8 and 0.9) are shown in Figure 6.
Table 7.
Nonlinear regression equations of irrigation amount and N application rate coupled with cotton yield, N use efficiency (NUE), irrigation water productivity (WPI), soil inorganic N residues (RSNmin), and apparent N loss (ANL) and surplus (ANS).
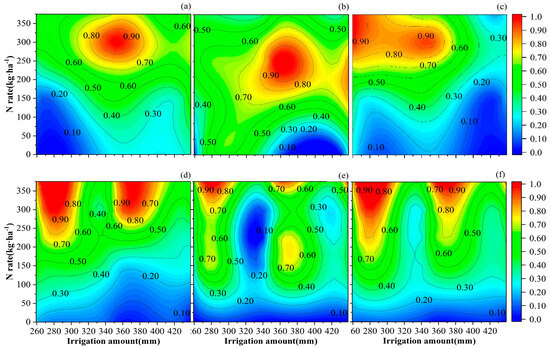
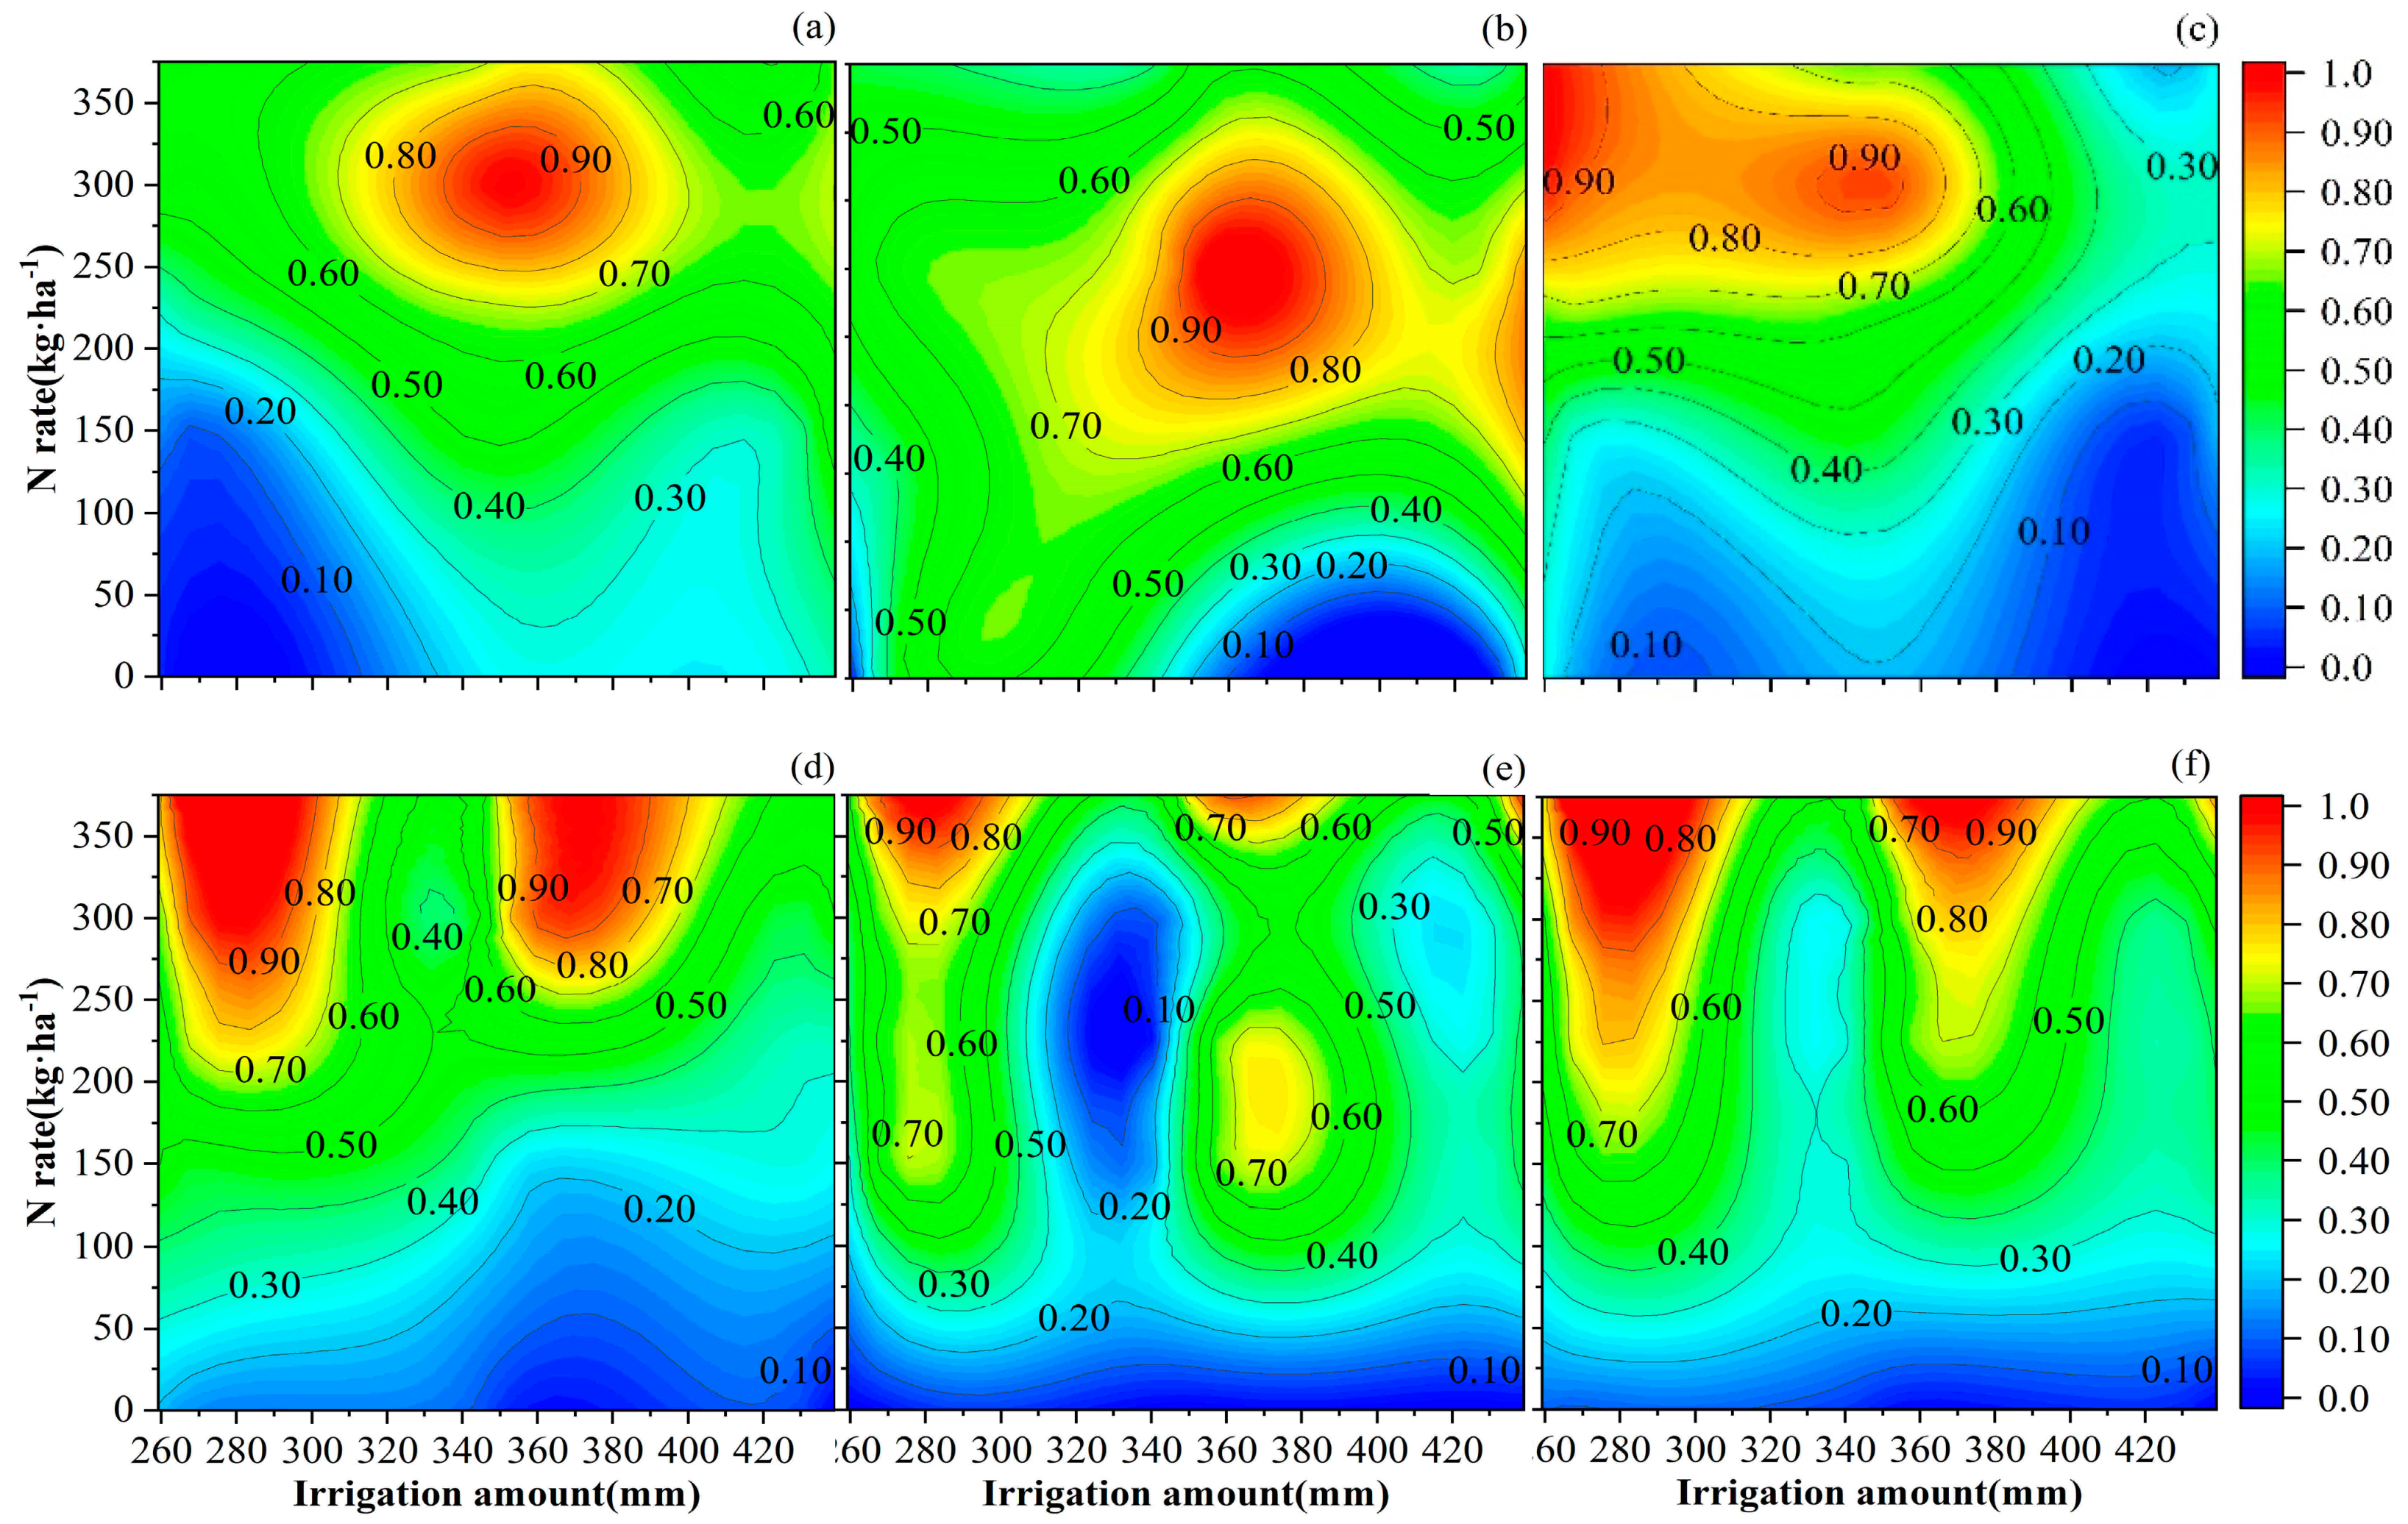
Figure 6.
Relationship between water–N interaction and optimized parameters. (a) Relative seed cotton yield; (b) relative N use efficiency; (c) relative irrigation water productivity; (d) relative soil inorganic N residues; (e) relative apparent N loss; (f) relative apparent N surplus.
When the irrigation amount was 346.44–355.22 mm and the N rate was 284.66–318.48 kg ha−1, the yield, NUE, and WPI reached over 90% of the maximum value at the same time. When the irrigation amount was 335.89–366.37 mm and the N rate was 254.37–340.13 kg ha−1, the yield, NUE, and WPI reached more than 80% of the maximum value at the same time. There was no overlap between irrigation amount and N rate ranges which obtained the minimum residual and surplus of soil N and those which were beneficial for increasing cotton yield, NUE, and WPI. However, when the irrigation amount was 335.89–348.30 mm and the N rate was 254.37–327.48 kg ha−1, not only higher yield, NUE, and WPI (80%ηmax) but also lower ANL (80%ηmin) could be obtained. Therefore, the irrigation amount of 335.89–348.30 mm and the N rate of 254.37–327.48 kg ha−1 were the best ranges (Table 8).
Table 8.
Optimization scheme of irrigation and N application rates.
4. Discussion
4.1. Appropriate Irrigation and N Application Promoted Cotton Growth and N Uptake
The dry matter accumulation during plant growth reflects crop growth. Water and nutrient interaction and dependence influence the dry matter accumulation of plants [43,44]. Previous studies showed that the dry matter accumulation of cotton increased with the increase in irrigation amount, with the maximum dry matter accumulation occurring at the full irrigation level (100% ETc) [45]. Even the average dry matter accumulation under 120% ETc treatment at the boll opening stage was significantly higher than that under 60% ETc, 80% ETc, and 100% ETc treatments [46]. However, Wang et al. [22] found that increasing irrigation amount could increase cotton dry matter accumulation under drip irrigation conditions, but compared to medium irrigation treatment (412 mm), the dry matter accumulation of cotton was significantly reduced under high irrigation treatment (562 mm). In this study, the cotton dry matter accumulation of the 80% ETc and 100% ETc treatments was significantly higher than that of the 60% ETc treatment, but there was no significant difference between the 80% ETc and 100% ETc treatments. This result was consistent with the findings of Wen et al. [47], which showed that a moderate reduction in irrigation (85% of the full irrigation) could promote plant growth because plants can adjust their physiological and biochemical functions to adapt to water scarcity conditions. However, if the irrigation amount is too low (320 mm), cotton growth is severely inhibited [48].
Moreover, our results showed the effect of the N application rate on crop dry matter accumulation varied significantly under different irrigation amounts. Under 60% ETc irrigation conditions, the dry matter accumulation of cotton significantly increased with the N application rate, while under 80% ETc and 100% ETc irrigation conditions, there was no significant difference in dry matter accumulation between the medium (300 kg ha−1) and high (375 kg ha−1) N application rate treatments. Hou et al. [49] also reported that under 60% ETc irrigation conditions, increasing the N application rate could increase cotton dry matter accumulation, but under 80% ETc, 100% ETc, and 120% ETc irrigation conditions, high N (400 kg ha−1) treatment does not increase cotton dry matter accumulation compared to medium N (350 kg ha−1) treatment. Li et al.’s [50] findings also support the result that under high irrigation conditions (100% ETc), there was no significant difference in cotton dry matter accumulation between high N (400 kg ha−1) and medium N (350 kg ha−1) treatments.
N uptake is the basis for the formation and accumulation of dry matter, and the accumulation of dry matter and N is the prerequisite for the formation of yield [51,52]. In contrast to the treatment of low water and low N fertilizer, increasing the amount of irrigation or fertilization facilitated the cotton N uptake, but beyond a certain threshold, the total N accumulation decreased [53]. In this study, increasing irrigation amount significantly increased the total N uptake of cotton, but there was no significant difference in the total N uptake between 80% ETc and 100% ETc treatments. In addition, crop N uptake was significantly influenced by the interaction between water and N. Bai et al. [45] found that regardless of irrigation amount, the N uptake of cotton was highest in the medium N treatment (300 kg ha−1) and significantly reduced in the high N treatment (400 kg ha−1). Our results showed that under 60% ETc irrigation conditions, increasing the N application rate was conducive to the N uptake of cotton, but under 80% ETc and 100% ETc irrigation conditions, there was no significant difference in cotton N uptake between medium (300 kg ha−1) and high (375 kg ha−1) N application rate treatments. Wang et al. [54] also reported that the N uptake of cotton could be enhanced by using more N fertilizer under water deficit (60% ETc), but when water was sufficient (100% ETc), cotton N uptake was highest at a N application rate of 300 kg ha−1 and significantly decreased by increasing the N application rate to 350 kg ha−1. This indicated that under water deficit conditions, increasing N application promoted cotton growth and N uptake. However, under sufficient water conditions, high N application could not promote cotton growth and N uptake.
In addition, our results indicated that the boll N uptake by cotton was positively correlated with the N application rate under the 60% ETc treatment. However, under the 80% and 100% ETc treatments, the high N application (375 kg ha−1) significantly reduced the boll N uptake compared to the medium N application (300 kg ha−1). Numerous studies showed that high irrigation and N application led to excessive vegetative growth in cotton and inhibited cotton boll growth and N uptake [55,56]. In our study, the 80%ETc N300 treatment had the highest total N uptake, mainly attributed to the combination of irrigation and N application promoting N uptake in cotton bolls. This finding was in agreement with the results of Wang et al. [4], who suggested that a suitable combination of irrigation (675 mm) and N application (400 kg ha−1) promoted N uptake in cotton bolls, thereby increasing the total N uptake.
4.2. Appropriate Irrigation and N Application Increased Cotton Yield and NUE
Optimizing the irrigation and N application strategy is an important way to exploit cotton yield increase potential and improve NUE [57,58]. Increasing irrigation amount had a positive effect on cotton yield and NUE, and the highest cotton production obtained under 100% ETc treatment was noticed by Hou et al. [49]. Wei et al. [59] found that increasing the irrigation amount from 60% to 90% full irrigation level significantly increased the cotton yield, but the cotton yield significantly decreased under the full irrigation level. In this study, increasing the irrigation amount from 60% ETc to 80% ETc significantly increased cotton yield and NUE, but the cotton yield, NUE, and WPI of the 100% ETc treatment were much lower than those of the 80% ETc treatment. Previous studies also reported that an irrigation amount of 80% ETc combined with an appropriate N application rate could enhance wheat and potato yields [21,60].
Adjusting the N application rate based on soil moisture availability can improve crop yield, N fertilizer use efficiency, and water use efficiency [61]. In the present study, under the 60% ETc condition, increasing the N application rate was beneficial for improving cotton yield. In contrast, under 80% ETc and 100% ETc conditions, moderate N application (300 kg ha−1) resulted in the highest cotton yield, while high N application (375 kg ha−1) did not increase or even decrease cotton yield. This opinion was supported by a previous study which reported that in water-scarce areas, seed cotton yield can be increased by appropriate increases in N input [22]. Wu et al. [62] also found that under low irrigation conditions (267 mm), high N treatment (320 kg ha−1) significantly increased cotton yield, while under high irrigation conditions (400 mm), high N treatment significantly reduced cotton yield compared to medium N (272 kg ha−1) treatment. In addition, our data showed that the N300 and N375 treatments had high NUE under 60% ETc conditions, the N300 treatment had the highest NUE under 80% ETc conditions, and the N225 and N300 treatments had high NUE under 100% ETc conditions. Therefore, under sufficient water conditions, a medium N application rate should be applied to achieve higher yields and NUE in cotton production. Under water deficit conditions, higher N fertilizers need to be applied to achieve higher yields.
4.3. Appropriate Irrigation and N Application Improved Soil N Balance
One of the most important steps toward sustainable management is quantifying the N balance. Water and N management could affect soil N distribution, residue, and loss, thereby affecting soil N balance [2,63]. Different irrigation amounts would lead to a different distribution of soil available N in the soil profile, which was related to soil moisture movement [64]. In this study, the soil NH4+-N content was low in different treatments and evenly distributed in the soil profile. The soil NO3−-N content was mainly distributed in soil layers below 40 cm, and this trend was more pronounced with the increase in irrigation amount. This indicated that the increase in irrigation amount would result in soil N migrating to a deeper soil layer [65,66]. Meanwhile, the residual soil N (RSNmin) and apparent N surplus (ANS) decreased as irrigation levels increased and were highest at an irrigation level of 60% ETc and lowest at an irrigation level of 100% ETc. Gao et al. [30] also found that the lowest irrigation level (50% ETc) had the highest N residue in the soil, and the highest irrigation level (125% ETc) had the lowest. In addition, we found that there was no significant difference in apparent N loss (ANL) between 60% ETc and 100% ETc treatments, and both were significantly higher than 80% ETc treatment. This result was consistent with the work of Wang et al. [67]; relatively low N loss was achieved through irrigation levels of 80% ETc compared to irrigation levels of 60% ETc and 100% ETc. This indicated that 80% ETc was a comparatively suitable irrigation amount to reduce apparent N loss.
N fertilizer supply was the main source of soil N accumulation [1]. In this study, N application significantly increased RSNmin, ANL, and ANS under different irrigation treatments. Previous studies also reported that increasing N input improved the accumulation of soil inorganic N in the soil profiles, and N2O and CO2 emission fluxes, nitrate residues, and leaching losses showed a significantly positive relationship with NO3−-N contents [68,69]. However, there is still a lack of research on the impact of water and N interaction on soil N balance under drip irrigation conditions. Our results revealed that when the N application rate increased from 150 to 225 and 300 kg ha−1, ANL significantly decreased under 80% ETc conditions. In this study, the ANL of 80%ETc N300 treatment was the lowest. In addition, under 60% ETc and 100% ETc conditions, ANS significantly increased with increasing N application, while there was no significant difference between N225 and N300 treatments under 80% ETc conditions. This indicated that a combination of irrigation and N application with 80%ETc N300 reduced N loss without significantly increasing N surplus.
4.4. Determination of Optimal Ranges of Irrigation Amount and N Application Rate
Crop yield is increased by increasing irrigation and fertilization regimes, while water and fertilizer use efficiency is decreased. Conversely, reducing the supplies of water and fertilizer reduces costs but lowers crop yields [70,71,72]. Previous research has shown that regression analysis can be used to clarify the relationships between crop yield, NUE, WPI, and water and fertilizer inputs [27,73], which is confirmed by this study. Cotton yield, NUE, and WPI showed a quadratic correlation with the application of irrigation and N. In addition, this study quantifies the response of ANL, RSNmin, and ANS to different levels of irrigation and N fertilization, which made it possible to balance the effects on the environment, crop yield, and resource efficiency. The results showed that under irrigation of 336–348 mm and N application of 254–327 kg ha−1, cotton yield, NUE, and WPI reached more than 80% of the maximum value, with less apparent N loss through regression analysis and spatial analysis. Hou et al. [73] reported that the irrigation amount of 334–450 mm and the N rate of 320–400 kg ha−1 were optimal for increasing cotton yields and maintaining fiber quality. Wang et al. [74] reported that the irrigation amount of 362.3–462.5 mm combined with the N rate of 212.5–367.5 kg ha−1 achieved higher water use efficiency, cotton yields, and economic benefits. This indicates that this study’s results are within a reasonable range. Our conclusion can be used as a reference for a feasible cotton water and N management strategy in this region.
5. Conclusions
Optimizing irrigation and N management in drip-irrigated cotton fields improved cotton yield and water and N use efficiency while maintaining soil N balance and reducing N loss. The effects of nitrogen application on cotton growth, yield, water and N use efficiency, and soil N balance vary under different irrigation levels. Under 60% ETc irrigation conditions, while increasing N application promoted cotton growth, N uptake, and yield, it also increased soil N residue, apparent N loss, and surplus. Under 80% and 100% ETc irrigation conditions, high N application (375 kg ha−1) did not significantly increase cotton yield but reduced NUE and increased apparent N loss and surplus. The combination of irrigation and N application with 80% ETc N300 resulted in the highest cotton yield, NUE, and WPI, while reducing apparent N loss but not significantly increasing apparent N surplus. The ideal irrigation amount (336–348 mm) and N application rate (254–327 kg ha−1) ranges were found by multi-objective optimization, and they could be utilized to improve crop productivity and maintain N balance in drip-irrigated cotton fields. This study helps to improve the utilization of water and N resources and provides opportunities for achieving sustainable development of cotton production. More research is needed to fully understand the effects of irrigation and N application rates on cotton yield and N balance by considering many factors such as genetic traits, weather, and management.
Supplementary Materials
The following supporting information can be downloaded at: https://www.mdpi.com/article/10.3390/agronomy14081671/s1, Table S1. Significant effects of different treatments on cotton dry matter yield, nitrogen uptake, yield, nitrogen use efficiency, irrigation water use efficiency, soil nitrogen residue, loss and surplus.
Author Contributions
Conceptualization, H.L. and Z.H.; methodology, H.L. and K.L.; software, H.L. and H.H.; validation, H.L., Y.Y. and W.Z.; formal analysis, H.L.; investigation, H.L., K.L. and H.H.; resources, H.L. and Z.H.; data curation, H.L.; writing—original draft preparation, H.L.; writing—review and editing, H.L. and Z.H.; visualization, H.L.; supervision, H.L. and Z.H.; project administration, Z.H. All authors have read and agreed to the published version of the manuscript.
Funding
This research was funded by the National Natural Science Foundation of China, grant number 32260806.
Data Availability Statement
The data that support the findings of this study are available from the corresponding author upon request.
Acknowledgments
We would like to thank Shihezi University for providing us with the test site. We would also like to thank the Key Laboratory of Oasis Eco-agriculture of Xinjiang Production and Construction Corps for providing experimental support.
Conflicts of Interest
The authors declare no conflicts of interest.
References
- Dai, J.; Wang, Z.; Li, F.; He, G.; Wang, S.; Li, Q.; Malhi, S.S. Optimizing nitrogen input by balancing winter wheat yield and residual nitrate-N in soil in a long-term dryland field experiment in the Loess Plateau of China. Field Crop. Res. 2015, 181, 32–41. [Google Scholar] [CrossRef]
- He, Z.; Hu, Q.; Zhang, Y.; Cao, H.; Nan, X. Effects of irrigation and nitrogen management strategies on soil nitrogen and apple yields in loess plateau of China. Agric. Water Manag. 2023, 280, 108220. [Google Scholar] [CrossRef]
- Hu, C.; Xia, X.; Chen, Y.; Qiao, Y.; Liu, D.; Fan, J.; Li, S. Yield, nitrogen use efficiency and balance response to thirty-five years of fertilization in paddy rice-upland wheat cropping system. Plant Soil Environ. 2019, 65, 55–62. [Google Scholar] [CrossRef]
- Wang, T.; Wang, Z.; Zhang, J.; Ma, K. An optimum combination of irrigation amount, irrigation water salinity and nitrogen application rate can improve cotton (for fiber) nitrogen uptake and final yield. Ind. Crops Prod. 2022, 187, 115386. [Google Scholar] [CrossRef]
- Shi, Z.; Liu, D.; Luo, W.; Hafeez, M.B.; Li, J.; Wen, P.; Wang, X. Combined nitrogen and phosphorus management based on nitrate nitrogen threshold for balancing crop yield and soil nitrogen supply capacity. Agric. Ecosyst. Environ. 2022, 337, 108071. [Google Scholar] [CrossRef]
- Luo, Z.; Hu, Q.; Tang, W.; Wang, X.; Lu, H.; Zhang, Z.; Kong, X. Effects of N fertilizer rate and planting density on short-season cotton yield, N agronomic efficiency and soil N using 15N tracing technique. Eur. J. Agron. 2022, 138, 126546. [Google Scholar] [CrossRef]
- Li, B.; Yan, L.; Zhang, W. Study on N application and N reduction potential of farmland in China. Environ. Monit. Assessmen 2023, 195, 1156. [Google Scholar] [CrossRef]
- Adams, A.M.; Gillespie, A.W.; Kar, G.; Koala, S.; Ouattara, B.; Kimaro, A.A.; Peak, D. Long-term effects of reduced fertilizer rates on millet yields and soil properties in the West-African Sahel. Nutr. Cycl. Agroecosystems 2016, 106, 17–29. [Google Scholar] [CrossRef]
- Li, C.; Aluko, O.O.; Yuan, G.; Li, J.; Liu, H. The responses of soil organic carbon and total nitrogen to chemical nitrogen fertilizers reduction base on a meta-analysis. Sci. Rep. 2022, 12, 16326. [Google Scholar] [CrossRef]
- Ren, K.; Xu, M.; Li, R.; Zheng, L.; Liu, S.; Reis, S.; Gu, B. Optimizing nitrogen fertilizer use for more grain and less pollution. J. Clean. Prod. 2022, 360, 132180. [Google Scholar] [CrossRef]
- Yan, L.; Zhang, Z.; Zhang, J.; Gao, Q.; Feng, G.; Abelrahman, A.M.; Chen, Y. Effects of improving nitrogen management on nitrogen utilization, nitrogen balance, and reactive nitrogen losses in a Mollisol with maize monoculture in Northeast China. Environ. Sci. Pollut. Res. Int. 2016, 23, 4576–4584. [Google Scholar] [CrossRef]
- Giacomo, T.; Paolo, B.; Michela, F.; Marcello, G.; Andrea, O.; Francesco, T. Processing tomato–durum wheat rotation under integrated, organic and mulch-based no-tillage organic systems: Yield, N balance and N loss. Agronomy 2019, 9, 718. [Google Scholar] [CrossRef]
- Rocha, K.F.; de Souza, M.; Almeida, D.S.; Chadwick, D.R.; Jones, D.L.; Mooney, S.J.; Rosolem, C.A. Cover crops affect the partial nitrogen balance in a maize-forage cropping system. Geoderma 2020, 360, 114000. [Google Scholar] [CrossRef]
- Xu, M.; Zhang, Y.; Wang, Y.; Wang, L.; Bai, Y.; Lu, Y. Optimizing nitrogen input and nitrogen use efficiency through soil nitrogen balance in a long-term winter wheat-summer maize rotation system in North China. Eur. J. Agron. 2023, 149, 126908. [Google Scholar] [CrossRef]
- Dhawan, G.; Dheri, G.S.; Gill, A.A.S. Long-term use of balanced fertilization decreases nitrogen losses in a maize-wheat system on Inceptisol of north India. Arch. Agron. Soil Sci. 2020, 68, 395–412. [Google Scholar] [CrossRef]
- Frerichs, C.; Glied-Olsen, S.; De Neve, S.; Broll, G.; Daum, D. Crop residue management strategies to reduce nitrogen losses during the winter leaching period after autumn spinach harvest. Agronomy 2022, 12, 653. [Google Scholar] [CrossRef]
- Tian, Y.; Tian, L.; Wang, F.; Shi, X.; Shi, F.; Hao, X.; Yang, G. Optimizing nitrogen application improves its efficiency by higher allocation in bolls of cotton under drip fertigation. Field Crop. Res. 2023, 298, 108968. [Google Scholar] [CrossRef]
- Li, H.; Mei, X.; Wang, J.; Huang, F.; Hao, W.; Li, B. Drip fertigation significantly increased crop yield, water productivity and nitrogen use efficiency with respect to traditional irrigation and fertilization practices: A meta-analysis in China. Agric. Water Manag. 2021, 244, 106534. [Google Scholar] [CrossRef]
- Kiani, M.; Gheysari, M.; Mostafazadeh-Fard, B.; Majidi, M.M.; Karchani, K.; Hoogenboom, G. Effect of the interaction of water and nitrogen on sunflower under drip irrigation in an arid region. Agric. Water Manag. 2016, 171, 162–172. [Google Scholar] [CrossRef]
- Wang, Y.; Shi, W.; Jing, B. Optimizing brackish water and nitrogen application regimes for soil salinity, yield, fertilizer and water productivity of a mulched drip irrigated cotton cropping system. Field Crop. Res. 2023, 302, 109097. [Google Scholar] [CrossRef]
- Rathore, V.S.; Nathawat, N.S.; Bhardwaj, S.; Sasidharan, R.P.; Yadav, B.M.; Kumar, M.; Yadav, O.P. Yield, water and nitrogen use efficiencies of sprinkler irrigated wheat grown under different irrigation and nitrogen levels in an arid region. Agric. Water Manag. 2017, 187, 232–245. [Google Scholar] [CrossRef]
- Wang, Z.; Zhang, K.; Shao, G.; Lu, J.; Gao, Y.; Song, E. Water and nitrogen use efficiencies in cotton production: A meta-analysis. Field Crop. Res. 2024, 309, 109322. [Google Scholar] [CrossRef]
- Pandey, K.R.; Maranville, W.J.; Admou, A. Deficit irrigation and nitrogen effects on maize in a Sahelian environment I. Grain Yield Yield Compon. Agric. Water Manag. 2000, 46, 1–13. [Google Scholar] [CrossRef]
- Ye, T.; Liu, B.; Wang, X.; Zhou, J.; Liu, L.; Tang, L.; Cao, W.; Zhu, Y. Effects of water-nitrogen interactions on the fate of nitrogen fertilizer in a wheat-soil system. Eur. J. Agron. 2022, 136, 126507. [Google Scholar] [CrossRef]
- Qin, W.; Zhang, X.; Chen, S.; Sun, H.; Shao, L. Crop rotation and N application rate affecting the performance of winter wheat under deficit irrigation. Agric. Water Manag. 2018, 210, 330–339. [Google Scholar] [CrossRef]
- Wu, B.; Zhang, L.; Tian, J.; Zhang, G.; Zhang, W. Nitrogen rate for cotton should be adjusted according to water availability in arid regions. Field Crop. Res. 2022, 285, 108606. [Google Scholar] [CrossRef]
- Ye, T.; Ma, J.; Zhang, P.; Shan, S.; Liu, L.; Tang, L.; Cao, W.; Liu, B.; Zhu, Y. Interaction effects of irrigation and nitrogen on the coordination between crop water productivity and nitrogen use efficiency in wheat production on the North China Plain. Agric. Water Manag. 2022, 271, 107787. [Google Scholar] [CrossRef]
- Shi, X.; Batchelor, W.D.; Liang, H.; Li, S.; Li, B.; Hu, K. Determining optimal water and nitrogen management under different initial soil mineral nitrogen levels in northwest China based on a model approach. Agric. Water Manag. 2020, 234, 106110. [Google Scholar] [CrossRef]
- Ma, B.; Tian, J.; Shen, H.; Li, W. Dry matter and yield as well as water-N coupling model of watermelon in gravel mulched field and its validation. Trans. Chin. Soc. Agric. Eng. 2016, 32, 129–136. [Google Scholar] [CrossRef]
- Gao, R.; Pan, Z.; Zhang, J.; Chen, X.; Qi, Y.; Zhang, Z.; Xu, X. Optimal cooperative application solutions of irrigation and nitrogen fertilization for high crop yield and friendly environment in the semi-arid region of North China. Agric. Water Manag. 2023, 283, 108326. [Google Scholar] [CrossRef]
- Sun, Y.; Nan, Z.; Yang, W.; Li, L. Projecting China’s future water footprints and water scarcity under socioeconomic and climate change pathways using an integrated simulation approach. Clim. Serv. 2023, 30, 100385. [Google Scholar] [CrossRef]
- Anapalli, S.S.; Fisher, D.K.; Pinnamaneni, S.R.; Reddy, K.N. Quantifying evapotranspiration and crop coefficients for cotton (Gossypium hirsutum L.) using an eddy covariance approach, China. Agric. Water Manag. 2020, 233, 106091. [Google Scholar] [CrossRef]
- Yoo, S.; Choi, J.; Jang, M. Estimation of design water requirement using FAO Penman–Monteith and optimal probability distribution function in South Korea. Agric. Water Manag. 2008, 95, 845–853. [Google Scholar] [CrossRef]
- Liu, W.; Wang, J.; Wang, C.; Ma, G.; Wei, Q.; Lu, H.; Kang, G. Root growth, water and nitrogen use efficiencies in winter wheat under different irrigation and nitrogen regimes in North China Plain. Front. Plant Sci. 2018, 9, 1798. [Google Scholar] [CrossRef]
- Guo, W.; Andersen, N.M.; Qi, X.; Li, P.; Li, Z.; Fan, X.; Zhou, Y. Effects of reclaimed water irrigation and nitrogen fertilization on the chemical properties and microbial community of soil. J. Integr. Agric. 2017, 16, 679–690. [Google Scholar] [CrossRef]
- Lu, D.; Song, H.; Jiang, S.; Chen, X.; Wang, H.; Zhou, J. Managing fertiliser placement locations and source types to improve rice yield and the use efficiency of nitrogen and phosphorus. Field Crop. Res. 2019, 231, 10–17. [Google Scholar] [CrossRef]
- Thompson, R. Editorial note on terms for soil analyses, nutrient content of fertilizers and Nitrogen Use Efficiency. Agric. Water Manag. 2023, 289, 108547. [Google Scholar] [CrossRef]
- Fernández, E. Editorial note on terms for crop evapotranspiration, water use efficiency and water productivity. Agric. Water Manag. 2023, 289, 108548. [Google Scholar] [CrossRef]
- Devkota, M.; Martius, C.; Lamers, J.P.A.; Sayre, K.D.; Devkota, K.P.; Vlek, P.L.G. Tillage and nitrogen fertilization effects on yield and nitrogen use efficiency of irrigated cotton. Soil Tillage Res. 2013, 134, 72–82. [Google Scholar] [CrossRef]
- Zheng, Y.; Han, X.; Li, Y.; Liu, S.; Ji, J.; Tong, Y. Effects of mixed controlled release nitrogen fertilizer with rice straw biochar on rice yield and nitrogen balance in Northeast China. Sci. Rep. 2020, 10, 9452. [Google Scholar] [CrossRef]
- Wang, D.; Mo, Y.; Li, G.; Wilkerson, C.J.; Hoogenboom, G. Improving maize production and decreasing nitrogen residue in soil using mulched drip fertigation. Agric. Water Manag. 2021, 251, 106871. [Google Scholar] [CrossRef]
- Zou, H.; Fan, J.; Zhang, F.; Xiang, Y.; Wu, L.; Yan, S. Optimization of drip irrigation and fertilization regimes for high grain yield, crop water productivity and economic benefits of spring maize in Northwest China. Agric. Water Manag. 2020, 230, 105986. [Google Scholar] [CrossRef]
- Wu, Y.; Guo, C.; Sun, Y.; Liu, Y.; Zhang, Q.; Xiang, K. Relationship of population quality and nitrogen fertilizer utilization characteristics of direct seeding rice under water-nitrogen interaction. Chin. J. Appl. Ecol. 2020, 31, 899–908. [Google Scholar] [CrossRef]
- Hammad, H.M.; Farhad, W.; Abbas, F.; Fahad, S.; Saeed, S.; Nasim, W.; Bakhat, H.F. Maize plant nitrogen uptake dynamics at limited irrigation water and nitrogen. Environ. Sci. Pollut. Res. Int. 2017, 24, 2549–2557. [Google Scholar] [CrossRef]
- Bai, Z.; Bai, W.; Xie, C.; Yu, J.; Dai, Y.; Pei, S.; Yin, F. Irrigation depth and nitrogen rate effects on seed cotton yield, fiber quality and water-nitrogen utilization efficiency in southern Xinjiang, China. Agric. Water Manag. 2023, 290, 108583. [Google Scholar] [CrossRef]
- Hou, X.; Fan, J.; Zhang, F.; Hu, W.; Xiang, Y. Optimization of water and nitrogen management to improve seed cotton yield, water productivity and economic benefit of mulched drip-irrigated cotton in southern Xinjiang, China. Field Crop. Res. 2024, 308, 109301. [Google Scholar] [CrossRef]
- Wen, S.; Cui, N.; Wang, Y.; Gong, D.; Xing, L.; Wu, Z.; Zhang, Y.; Zhao, L.; Fan, J.; Wang, Z. Optimizing deficit drip irrigation to improve yield, quality, and water productivity of apple in Loess Plateau of China. Agric. Water Manag. 2024, 296, 108798. [Google Scholar] [CrossRef]
- Jia, Y.; Yang, B.; Han, Y.; Wang, G.; Su, T.; Li, X.; Lei, Y.; Zhi, X.; Xiong, S.; Xin, M.; et al. Enhanced Cotton Yield and Fiber Quality by Optimizing Irrigation Amount and Frequency in Arid Areas of Northwest China. Agronomy 2024, 14, 266. [Google Scholar] [CrossRef]
- Hou, X.; Xiang, Y.; Fan, J.; Zhang, F.; Hu, W.; Yan, F.; Li, Z. Evaluation of cotton N nutrition status based on critical N dilution curve, N uptake and residual under different drip fertigation regimes in Southern Xinjiang of China. Agric. Water Manag. 2021, 256, 107134. [Google Scholar] [CrossRef]
- Li, X.; Liu, H.; He, X.; Gong, P.; Lin, E. Water–Nitrogen Coupling and Multi-Objective Optimization of Cotton under Mulched Drip Irrigation in Arid Northwest China. Agronomy 2019, 9, 894. [Google Scholar] [CrossRef]
- Du, Y.; Niu, W.; Zhang, Q.; Cui, B.; Zhang, Z.; Wang, Z.; Sun, J. A synthetic analysis of the effect of water and nitrogen inputs on wheat yield and water- and nitrogen-use efficiencies in China. Field Crop. Res. 2021, 265, 108105. [Google Scholar] [CrossRef]
- Lu, J.; Xiang, Y.; Fan, J.; Zhang, F.; Hu, T. Sustainable high grain yield, nitrogen use efficiency and water productivity can be achieved in wheat-maize rotation system by changing irrigation and fertilization strategy. Agric. Water Manag. 2021, 258, 107177. [Google Scholar] [CrossRef]
- Abdoul, K.M.H.; Sunusi, A.A.; Si, Z.; Kama, R.; Gao, Y.; Duan, A. Responses of grain yield and water-nitrogen dynamic of drip-irrigated winter wheat (Triticum aestivum L.) to different nitrogen fertigation and water regimes in the North China Plain. Agric. Water Manag. 2023, 288, 108494. [Google Scholar] [CrossRef]
- Wang, H.; Wu, L.; Wang, X.; Zhang, S.; Cheng, M.; Feng, H.; Xiang, Y. Optimization of water and fertilizer management improves yield, water, nitrogen, phosphorus and potassium uptake and use efficiency of cotton under drip fertigation. Agric. Water Manag. 2021, 245, 106662. [Google Scholar] [CrossRef]
- Yang, B.; Yang, G.; Feng, L.; Han, Y.; Lei, Y.; Fan, Z.; Wang, Z.; Li, Y. Effects of deficit irrigation on cotton growth and water use efficiency: A review. J. Appl. Ecol. 2021, 32, 1112–1118. [Google Scholar] [CrossRef]
- Stamatiadis, S.; Tsadilas, C.; Samaras, V.; Schepers, J.S.; Eskridge, K. Nitrogen uptake and N-use efficiency of Mediterranean cotton under varied deficit irrigation and N fertilization. Eur. J. Agron. 2016, 73, 144–151. [Google Scholar] [CrossRef]
- Rakesh, K.; Pareek, N.K.; Rathore, V.S.; Nangia, V. Effect of irrigation and nitrogen application on water productivity and performance of Cotton (Gossypium Sp.). J. Soil Water Conserv. 2019, 18, 2455–7145. [Google Scholar] [CrossRef]
- Li, P.; Dong, H.; Zheng, C.; Sun, M.; Liu, A.; Wang, G.; Zhao, X. Optimizing nitrogen application rate and plant density for improving cotton yield and nitrogen use efficiency in the North China Plain. PLoS ONE 2017, 12, e0185550. [Google Scholar] [CrossRef]
- Wei, K.; Zhang, J.; Wang, Q.; Guo, Y.; Mu, W. Irrigation with ionized brackish water affects cotton yield and water use efficiency. Ind. Crop. Prod. 2022, 175, 114244. [Google Scholar] [CrossRef]
- Wang, X.; Guo, T.; Wang, Y.; Xing, Y.; Wang, Y.; He, X. Exploring the optimization of water and fertilizer management practices for potato production in the sandy loam soils of Northwest China based on PCA. Agric. Water Manag. 2020, 237, 106180. [Google Scholar] [CrossRef]
- Yang, M.; Ma, S.; Mei, F.; Wei, L.; Wang, T.; Guan, X. Adjusting Nitrogen Application in Accordance with Soil Water Availability Enhances Yield and Water Use by Regulating Physiological Traits of Maize under Drip Fertigation. Phyton-Int. J. Exp. Bot. 2021, 90, 417–435. [Google Scholar] [CrossRef]
- Wu, B.; Zuo, W.; Yang, P.; Zhang, W. Optimal water and nitrogen management increases cotton yield through improving leaf number and canopy light environment. Field Crop. Res. 2023, 290, 108745. [Google Scholar] [CrossRef]
- Xu, J.; Wang, X.; Ding, Y.; Mu, Q.; Cai, H.; Ma, C.; Saddique, Q. Effects of irrigation and nitrogen fertilization management on crop yields and long-term dynamic characteristics of water and nitrogen transport at deep soil depths. Soil Tillage Res. 2020, 198, 104536. [Google Scholar] [CrossRef]
- Che, Z.; Wang, J.; Li, J. Modeling strategies to balance salt leaching and nitrogen loss for drip irrigation with saline water in arid regions. Agric. Water Manag. 2022, 274, 107943. [Google Scholar] [CrossRef]
- Zhou, W.; Lv, H.; Chen, F.; Wang, Q.; Li, J.; Chen, Q.; Liang, B. Optimizing nitrogen management reduces mineral nitrogen leaching loss mainly by decreasing water leakage in vegetable fields under plastic-shed greenhouse. Environ. Pollut. 2022, 308, 119616. [Google Scholar] [CrossRef]
- Brian, J.B.; Carl, J.R.; David, J.M. Impact of variable rate nitrogen and reduced irrigation management on nitrate leaching for potato. J. Environ. Qual. 2020, 49, 281–291. [Google Scholar] [CrossRef]
- Wang, Q.; Li, F.; Zhao, L.; Zhang, E.; Shi, S.; Zhao, W.; Song, W.; Vance, M.M. Effects of irrigation and nitrogen application rates on nitrate nitrogen distribution and fertilizer nitrogen loss, wheat yield and nitrogen uptake on a recently reclaimed sandy farmland. Plant Soil 2010, 337, 325–339. [Google Scholar] [CrossRef]
- Kamran, M.; Yan, Z.; Chang, S.; Chen, X.; Ahmad, I.; Jia, Q.; Hou, F. Enhancing resource use efficiency of alfalfa with appropriate irrigation and fertilization strategy mitigate greenhouse gases emissions in the arid region of Northwest China. Field Crop. Res. 2022, 289, 108715. [Google Scholar] [CrossRef]
- Li, W.; Ma, L.; Shi, F.; Wang, S.; Zhao, J.; Zheng, W.; Zhai, B. Regulation of soil water and nitrate by optimizing nitrogen fertilization and the addition of manure based on precipitation: An 8-year field record. Agric. Ecosyst. Environ. 2023, 354, 108586. [Google Scholar] [CrossRef]
- Hu, Z.; Liu, C.; Zhuang, W.; Liu, T.; Li, Z. Optimization of multi-objective crop pattern based on water and fertilizer resources allocation. Appl. Mech. Mater. 2014, 522–524, 1034–1038. [Google Scholar] [CrossRef]
- Mwinuka, R.P.; Mbilinyi, P.B.; Mbungu, B.W.; Mourice, K.S.; Mahoo, F.H.; Schmitter, P. Optimizing water and nitrogen application for neglected horticultural species in tropical sub-humid climate areas: A case of African eggplant (Solanum aethiopicum L.). Sci. Hortic. 2021, 276, 109756. [Google Scholar] [CrossRef]
- Xiao, C.; Zou, H.; Fan, J.; Zhang, F.; Li, Y.; Sun, S.; Pulatov, A. Optimizing irrigation amount and fertilization rate of drip-fertigated spring maize in northwest China based on multi-level fuzzy comprehensive evaluation model. Agric. Water Manag. 2021, 257, 107157. [Google Scholar] [CrossRef]
- Hou, X.; Fan, J.; Hu, W.; Zhang, F.; Yan, F.; Xiao, C.; Cheng, H. Optimal irrigation amount and nitrogen rate improved seed cotton yield while maintaining fiber quality of drip-fertigated cotton in northwest China. Ind. Crop. Prod. 2021, 170, 113710. [Google Scholar] [CrossRef]
- Wang, H.; Wu, L.; Cheng, M.; Fan, J.; Zhang, F.; Zou, Y.; Chau, W.; Gao, Z.; Wang, X. Coupling effects of water and fertilizer on yield, water and fertilizer use efficiency of drip-fertigated cotton in northern Xinjiang, China. Field Crop. Res. 2018, 219, 169–179. [Google Scholar] [CrossRef]
Disclaimer/Publisher’s Note: The statements, opinions and data contained in all publications are solely those of the individual author(s) and contributor(s) and not of MDPI and/or the editor(s). MDPI and/or the editor(s) disclaim responsibility for any injury to people or property resulting from any ideas, methods, instructions or products referred to in the content. |
© 2024 by the authors. Licensee MDPI, Basel, Switzerland. This article is an open access article distributed under the terms and conditions of the Creative Commons Attribution (CC BY) license (https://creativecommons.org/licenses/by/4.0/).