Review

Pasture Performance: Perspectives on Plant Persistence and Renewal in New Zealand Dairy Systems

by
Andrew D. Cartmill
* and
Daniel J. Donaghy
School of Agriculture and Environment, Massey University, Private Bag 11-222, Palmerston North 4440, New Zealand
*
Author to whom correspondence should be addressed.
Agronomy 2024, 14(8), 1673; https://doi.org/10.3390/agronomy14081673 (registering DOI)
Submission received: 4 June 2024 / Revised: 21 July 2024 / Accepted: 26 July 2024 / Published: 30 July 2024
(This article belongs to the Section Grassland and Pasture Science)

Abstract

:
Pasture systems dominate the landscape of Aotearoa, New Zealand, and are an integral component of sustainable and resilient livestock production. Predicting the response, performance, and dynamics of pasture species and adapting management practices is key to the long-term economic and environmental sustainability and resilience of the agricultural sector. However, there is limited information on the long-term productivity, performance, and persistence of forage cultivars and species for pasture production systems, particularly when linked to grazing and animal performance. Here, we sought to reduce scientific uncertainty, inform modelling efforts, and contribute to a predictive framework for understanding pasture performance, persistence, and renewal. Inter-annual pasture renewal (direct drilling and cultivation) rates vary by region and year, reflecting both opportunity and problem-based drivers, with the highest pasture renewal rates in Waikato and Canterbury on the North and South Island, respectively.

1. Introduction

The agricultural economy in Aotearoa, New Zealand (NZ), is predominantly export driven and heavily reliant on grass-based production systems, with ~95% of all dairy milk produced in New Zealand exported (milk or dairy products) and with an export revenue of ~22.6 billion New Zealand dollars per year [1]. While herd and dairy cow numbers have continued to decrease, milk production and milk solids have continued to remain steady, with continued emphasis from the industry on “more milk from less cows” [2]. Milk yield has increased by ~4.5 kg milk solids per cow per year over the past 28 years; this was coupled with a 23% increase in total feed consumed per cow and matched to 20% increase in feed conversion efficiency (0.54 kg milk solids per t DM consumed) (1990–2018) [3]. This efficiency was supported, in part, by the use of non-pasture feed supplements, increased use of nitrogen (N) fertilisers, irrigation, and increased stocking rates and through a sustained shift to productive crossbred cows, with ~50% of cows identified in 2020–2021, as Holstein–Friesian/Jersey crossbreed, ~32% as Holstein–Friesian, 8% Jersey cows, 0.4% Ayrshire, and 9% as other breeds through continued focus on livestock performance/herd testing [2].
Over time, NZ’s pasture production systems have undergone numerous advancements and improvements, as reviewed by Caradus et al. [4], and have emerged successfully into the global market as highly productive. Increasingly, it is recognised that matching the pasture species and cultivar selection to the climate, soil, and production system is a key element in resilient and productive grazing systems, with the best results being achieved when production goals/animal productivity are matched to pasture species performance and persistence and balanced against input costs and market value. Easton et al. [5] suggested that the NZ dairy industry’s ability to produce and perform in the international market is based on the quality of its pastures. However, there are increasing challenges ahead for the agriculture sector and dairy industry in particular. In the short-term, global supply chain challenges, tight feed markets, elevated fuel, fertiliser, and input prices (in general), and a relatively weak NZ dollar will continue to negatively affect dairy production. In the long-term, increasingly grazing systems will have to meet the challenges of climate variability (climate change), including greenhouse gas reduction/mitigation, increasing environmental regulation and legislation, and increased societal scrutiny.

2. Pasture Composition

Perennial ryegrass (Lolium perenne L.) and white clover (Trifolium repens L.) are the typical mainstay of the dairy industry in NZ, where high photosynthetic rates and grazing tolerance are combined with N-fixing capacity and feed quality of clover. Considerable attention has been focused on these grass/legume mixes in NZ, and improved yield/performance has been reported in many studies [6,7,8,9,10,11]. However, these improvements in yield may reflect, in part, high seeding rates, and the improved performance may be temporary in nature. Under high N, as a result of intensive stocking rates and/or over application of fertiliser, perennial ryegrass may outcompete white clover, which may be further compounded through preferential/selective grazing. Proportions of white clover in these permanent pastures typically range from 2–20% [12,13], although <10% is increasingly common [14], which indicates a large gap in current pasture potential and performance. Major reasons for these low clover contents in pastures include mismanagement and environmental stresses during spring, and Woodfield and Caradus [15] outlined multiple options to improve this.
New Zealand’s climate varies from subtropical in the far north to cool temperate in the far south, with alpine conditions in the mountainous areas. Under current climate change scenarios, increasing variability and intensity of rainfall and drought events are projected to negatively affect the persistence of both ryegrass and white clover [14,16] and potentially necessitate the use of other pasture species. For example, while pastures are typically dominated by perennial ryegrass, depending on conditions, annual (L. multiflorum Lam.) and hybrid ryegrass (L. × boucheanum Kunth syn. L. × hybridum Hausskn.), while short-lived by comparison, are becoming increasingly common [17]. Some cultivars of hybrid ryegrass may even persist, like perennial ryegrass, depending on climate and management. Hybrid ryegrass may be added to perennial pastures to increase winter production during establishment and to increase production in cooler conditions. In some situations, highly productive and deep-rooted perennial tall fescue (Festuca arundinacea Schreb.) may be used in areas prone to heat and moisture stresses [18,19]. McCahon et al. [14] suggested that persistent swards of mixed pasture species could reduce the costs and time associated with pasture renewal and would represent a significant production advantage, even if selected pasture species were no more productive than current ryegrass and white clover mixes.
Pyke et al. [20] reported that these perennial ryegrass, white clover, tall fescue, and annual and hybrid ryegrass mixed pastures currently account for ~98% of herbage seed grown in NZ, with L. perenne accounting for ~75% of this. Perennial ryegrass, white clover, and annual ryegrass accounted for 85% of annual herbage seed production between 2004 and 2014 [21]. However, caution should be taken when using seed sales or sowing data as indicators of actual pasture composition, as persistence and pasture composition may vary with time, grazing management/stocking rate, fertiliser application, weed pressure, pests and diseases, soil conditions (e.g., compaction), and climate [12].

2.1. Plant Diversity

The grazing of diverse plant species has implications for animal performance and production [22,23] and the potential to reduce negative environmental impacts from ruminants [24,25]. In this, diverse pastures may contribute to reduction in the carbon and nitrogen footprint of pasture production systems [26]. Isbell et al. [27] analysed 46 grassland studies and found that diverse grassland plant communities were more resistant and resilient to disturbance and suggested that biodiversity stabilises ecosystem productivity and services. Hector et al. [28] suggested that the primary mechanisms that drive positive relationships between plant diversity and pasture productivity include niche differentiation, positive interactions, and selection, whereby facilitation between pasture species, differences in morphological and physiological characteristics, and the selection of pasture species composed of different functional groups exhibit greater yield stability and resilience to biological and environmental disturbance [29,30]. In addition, in some cases, diverse multispecies pasture systems composed of plant species from different functional groups may demonstrate asynchronous growth (thereby reducing seasonality of yield) and overyielding (where the yield from the diverse mixture is greater than that from any of its member species grown in monoculture).
This asynchronous growth and overyielding may in reality be difficult to consistently achieve and manage, with the positive/complementary plant species response/effect declining over time and becoming transitory in nature. In that, growth and persistence may not be perfectly correlated to grazing/pasture management, which could be further compounded by plant species’ responses to pest, disease, and climate variability. This potentially results in a decline in portions/components of this beneficial pasture community, which in the short term may be masked through compensatory increases by other pasture species, thereby temporarily masking pasture productivity and persistence issues [31]. Unfortunately, maintaining high plant diversity in fertile, introduced pasture systems is challenging, as even in the most diverse pastures, one or two species tend to dominate over time [32,33], potentially resulting in a decline in pasture and livestock performance.

2.2. Plant Traits

Pasture species differ in leaf and fine-root traits, which are correlated with specific rates of net CO2 exchange and resource acquisition and productivity [34,35]. Differences in leaf and fine-root tissue chemistry between pasture species may influence feedback to nutrient dynamics through differences in litter decomposition and N availability [36]. Plant functional types may differ in their spatial and temporal patterns in leaf and fine-root production and turnover, which affects carbon and water fluxes, net ecosystem exchange, and evapotranspiration [37]. Variations in leaf and fine-root traits between pasture species, including N concentration, specific leaf area (SLA), specific root length, and C:N ratio, may have a pronounced effect on numerous pasture system processes, including persistence and livestock performance.

3. Stocking Rates and Pasture Performance

The performance of pasture, forage, and livestock are all species-, stocking rate-, and management-specific, and these need to be considered when evaluating pasture performance and adoption. The stocking rate is defined as the number of animals per hectare of farmland, and it defines the annual feed demand of the herd or flock [38]. Stocking rate is a strategic decision made on a farm that varies depending on pasture system, available forage, livestock type and age, management style, and market conditions. It is an important strategic decision that affects the utilisation of pasture and therefore profit [39].
Both daily liveweight gain and daily milk production are commonly greater at lower stocking rates [40] in that livestock have “options” and select forage that maximises their production and potentially health. Increased stocking rates will likely increase production per hectare; however, additional livestock units, depending on climatic conditions, could limit forage quality and quantity and thus reduce daily gain per hectare (i.e., overstocking). For example, livestock trampling creates gaps in the sward, changes light transmission through the canopy, and affects pasture growth and competition and where other pasture species or weeds can be established [41]. Weeds in pastures cause economic loss by reducing feed quality and quantity, affecting animal health and performance, and raising input costs (herbicide application).
In an attempt to determine an “optimum” stocking rate for profitability, Macdonald et al. [42] identified limitations when comparing across dairy farms due to total feed availability being affected by differences in pasture growth (regional and seasonal) and the profitability of feeding supplements, with cow requirements being affected by differences in cow breed and genetic merit. To overcome this, they introduced the concept of comparative stocking rate, which is defined as kilograms of cow liveweight per tonne of all feed available. The optimum comparative stocking rate for profitability was thus defined as between 80 and 90 kg liveweight per tonne of feed dry matter when pasture growth is standard across farms [42]. There is currently no comparable tool for other livestock systems, nor is it clear how widely used comparative stocking rate is within the dairy industry, even though multiple research studies have proven its effectiveness.

3.1. Interaction between Stocking Rate and Grazing Managment

Stocking rate and the duration between the grazing periods (i.e., grazing interval or grazing rotation) affect pasture diversity and performance (Allen et al., 2011). In general, both the quality and quantity of plant material are reduced under continuous grazing (colloquially known as set stocking) at high stocking rates. Sollenberger et al. [43] evaluated 27 studies that included rotational or continuous grazing treatments and reported that 85% showed an increase in forage quantity in response to rotational grazing when compared to continuous grazing. Reeves et al. [44] observed that beef cattle production under heavy stocking was more sensitive to seasonal weather variability than lighter stocking rates, suggesting that stocking rate is a driver of pasture resilience. Isbell et al. [27] analysed >40 studies and found that diverse pasture systems were more resistant to disturbance. Dodds et al. [45] reported that diverse swards returned to their initial composition more rapidly, which also suggests that diverse vegetation is more resilient to disturbance. Rotational grazing may increase the consumption or utilisation of pasture by increasing livestock density and reducing spatial variation in grazing pressure in that rotational grazing may be better suited to control post-grazing residues and pasture regrowth [46,47]. However, it is important to note that in general, pasture species that are more resistant to grazing may increase in coverage over time, and/or in the long term, pasture species that are unpalatable to livestock may start to dominate.

3.2. Grazing Managment

The frequency (i.e., rotation) and intensity (i.e., post-grazing residual) of grazing events combined with the age and type of plant material removed further coupled with the timing and duration of abiotic and/or biotic stress events affect the subsequent productivity and performance of pasture species [48,49,50]. Pasture species with meristematic zones (colloquially known as growing points) close to or below the soil surface, which are inaccessible to grazing animals, tend to be more resilient to grazing pressure. Maximum rates of photosynthesis are achieved at high light levels under optimum conditions (nutrients, water, and temperature) in newly expanded leaves in the upper portion of the plant canopy. As grass species grow, leaves age, becoming prone to shading and senescence; they become less efficient in light interception, and thus, photosynthetic rates decline. Therefore, if the upper leaves are removed during grazing events, the photosynthetic rate of the individual plant or overall sward declines, potentially resulting in reduced forage growth. Carbohydrate reserve stores may then be mobilised to support regrowth. However, prolonged and/or hard grazing may reduce carbohydrate stores within the plant [48,49,50,51] and negatively affect regrowth, performance, persistence, and diversity over time. Under this scenario, reduced grazing pressure will restore leaf area faster, and the demand for carbohydrate reserves will be lessened.
Typically, most plant species can adapt and adjust their photosynthetic system to a range of ambient conditions. In this, leaf growth and development are plastic in response to environmental drivers. For example, leaves formed in shade at low canopy positions have a lower maximum photosynthetic rate if subsequently exposed to high light levels; similar to how pasture species are outgrown by neighbouring species (i.e., shaded), leaves that were formed under high light levels in the upper portion of the canopy may be poorly adapted to subsequent low light levels and have reduced photosynthetic rates. These “shade-developed” leaves tend to be thinner, with fewer mesophyll cells and less chlorophyll when compared to leaves developed under high light levels.
Pasture canopies are dynamic and have a more complex response than component leaves when considering plant photosynthetic response and pasture performance. The photosynthetic response of grass species depends on the quality of the radiation intercepted and the efficiency of utilisation in that there may be competition for light and CO2; for example, dense canopies with high photosynthetic rates may, on a windless day with little atmospheric mixing, may have restricted leaf photosynthetic rates due to reduced availability of CO2 within the canopy.
Canopy architecture is determined by plant density, sowing patterns, morphological characteristics of the pasture species, and grazing intensity. Canopy architecture is a key to plant persistence and production, as it influences rapid attainment of optimum cover for the environmental conditions and the advantage that height may confer on competitive ability in mixed communities. Thus, high pasture productivity may result from high unit leaf rate and limited saturation at high light levels, coupled with increased number of vertical leaves in the upper canopy.
We feel that it is important to consider pasture species from the whole-plant perspective and ideally at the sward level, as illustrated when considering photosynthetic ability at the leaf and canopy levels. We suggest that leaf movement, leaf expansion, leaf loss, osmotic adjustment, and even belowground root growth and mycorrhizal status will influence pasture species, performance, and persistence. In this, under field conditions, water, light interception, and soil fertility individually are not the only or necessarily the most important resource governing pasture growth, performance, and/or persistence.

4. Pasture Persistence and Renewal

Pasture persistence (performance and diversity) may decline over time due to a variety of interactive and cumulative events and pressures, including overgrazing, selective and preferential grazing (particularly when coupled with treading), disruption of nutrient cycles, climate stress (e.g., soil water restriction/drought), and/or pest and disease pressure [52,53,54,55,56]. Any negative influence on pasture persistence and yield will increase reliance on supplementary feed to meet production shortfalls and necessitate more frequent pasture intervention (e.g., resowing, spraying for pests, and cultivation), resulting in increased production costs and/or disturbance to the pasture system [14]. For example, Dodd et al. [57] estimated that between 2008–2015, in the upper North Island, increased failure of perennial ryegrass resulted in ~30,000 ha of perennial dairy pasture being converted to annual crop rotation.
This move from perennial ryegrass/white clover to annual crop/pasture systems is not only more expensive but also introduces substantial risk to the farm system if crop/pasture failure occurs, for example, due to drought (or floods) in the key sowing period(s). The difficulties facing the persistence of perennial ryegrass in the upper North Island, which are expected to only become more prevalent and widespread under current climate change scenarios, will necessitate a re-thinking of the pastoral system, with alternative perennial species and/or more intensive pasture renewal practices requiring further study.
Declining pasture performance threatens the long-term persistence, productivity, and quality of the grazing system and will likely necessitate some form of pasture renewal (also termed renovation, reseeding, resowing or restoration). This is compounded by industry and market trends focused on producing more from “less”, which potentially translates into reduced livestock units and land area with maximum productivity or/and the need to intensify production and increase the quality and quantity of pasture feed. Pasture renewal is the semi- or complete removal of low-quality pasture species followed by resowing with improved pasture species and/or cultivars/varieties [58,59]. Methods of pasture renewal vary by operation and conditions and may include over-sowing seed into existing pasture, direct drilling seed into terminated pasture (herbicide, overgrazed, and/or tilled), or sowing into bare ground following a forage or row crop [60,61,62].
Pasture renewal may improve dry matter yield [55,63,64], herbage quality [63], and pasture utilisation [65]. On NZ farms, pasture renewal is a common management practice, with some form of pasture renewal being undertaken every 5–15 years [62,66]. However, there is limited information on how rates of pasture renewal are set [67], what this actually looks like on farm (in the real world), and the duration/persistence of “benefits”, perceived or otherwise. There are also no data available that would allow us to identify the success or otherwise of pasture renewal.

4.1. Rates of Pasture Renewal and Potential Benefits

In NZ, annual rates of pasture renewal have been estimated to vary from ~6–8% [62] to between 8–12% [68] of the farmed area, with Sanderson and Webster [69] suggesting that an increase to a consistent average around 12% or greater would significantly benefit both on-farm production and the NZ economy. Following renewal of pasture, Glassey et al. [63] reported increases in pasture yield and herbage quality of 4% and 7%, respectively, which were estimated to contribute ~NZD 900 per ha per year of additional profit to the farmer. Recommended rates of pasture renewal range from 7–14% for the farmed area per year on a rotational basis [62,70] depending on livestock enterprise (dairy, sheep, beef, or deer), with the upper level of pasture renewal recommended for more intensive pastoral systems (e.g., dairy).
Tozer et al. [64] reported that renewed pasture produced an additional 1.73 t DM per year over the first 3 years following renewal. Brazendale et al. [71] estimated that a 10% increase in dry matter yield from pasture renewal could increase annual on-farm profitability from NZD 271 per ha to NZD 478 per ha, while Sanderson et al. [72] reported that on dairy farms, doubling annual pasture renewal from 6 to 12% increased farm gate profits by ~16%. However, despite all this evidence for pasture renewal enhancing pasture production and profitability, pasture renewal in NZ has remained relatively low, ranging from between 6–12%, as previously mentioned.
Comparing between years, Dodd et al. [57] reported that higher levels of pasture renewal were associated with relatively high milk solids production and milk prices. Therefore, it appears that many farmers do not regard pasture renewal as an essential farm management practice that needs to be undertaken each year (or if they do, they are renewing small areas only) but rather something to be undertaken when they have sufficient cashflow to support it. It would be interesting to see if this apparent attitude prevails across the implementation of other technologies on farm.
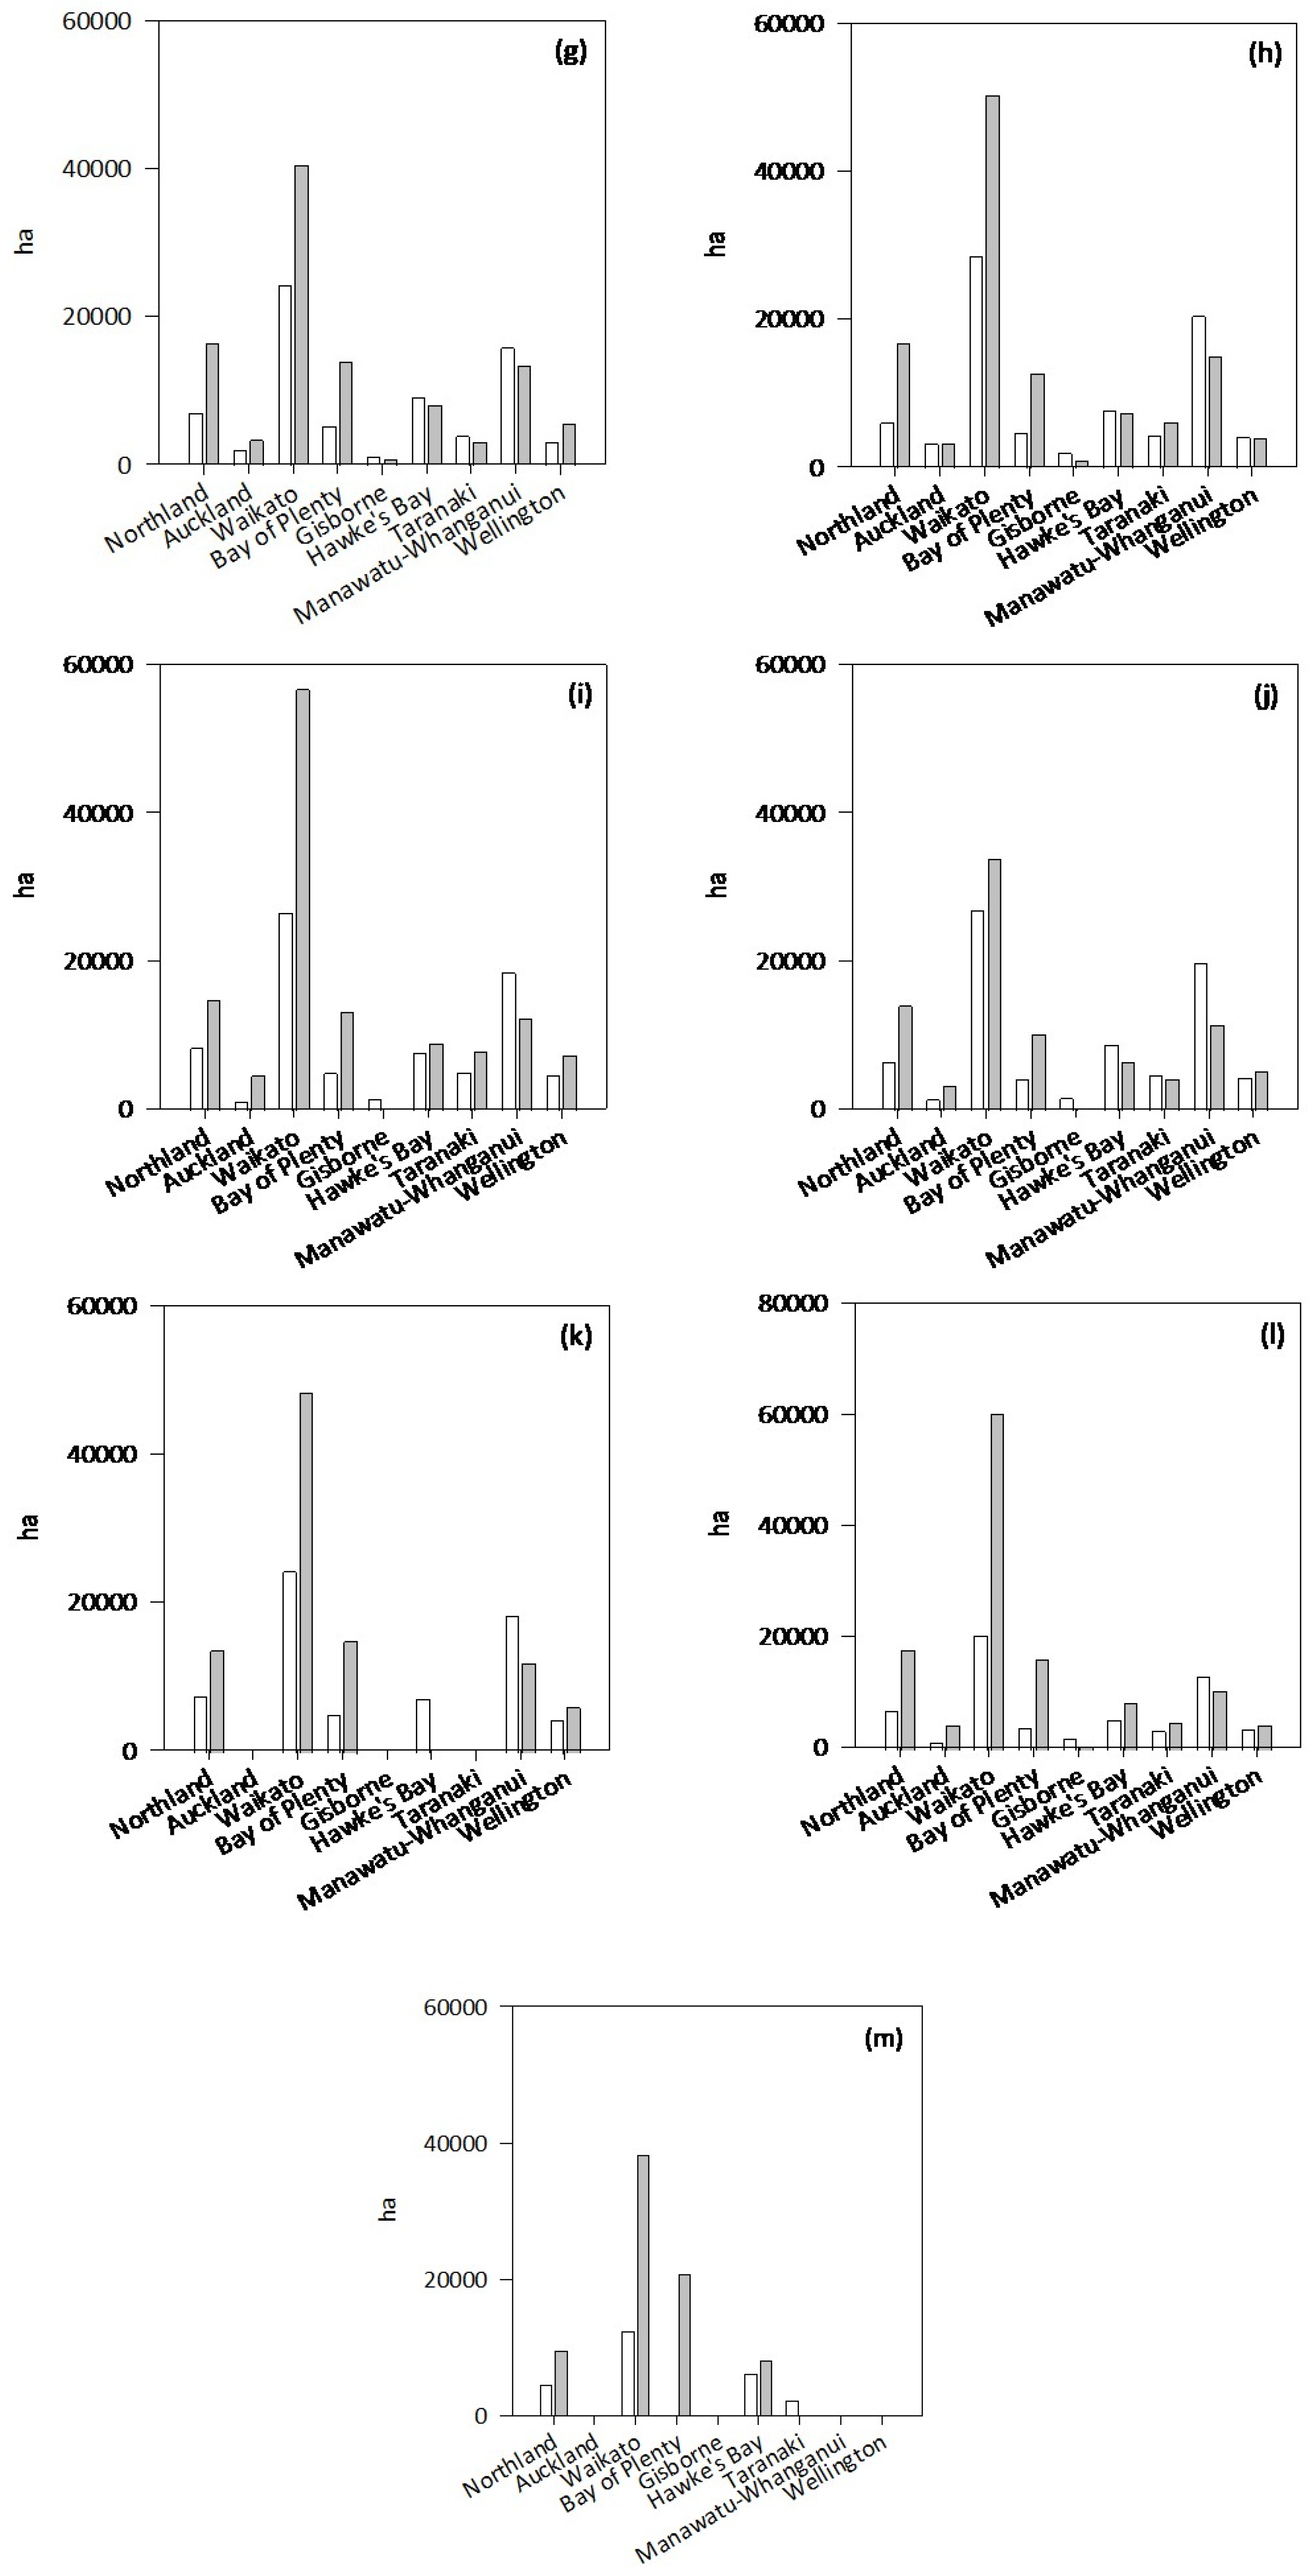
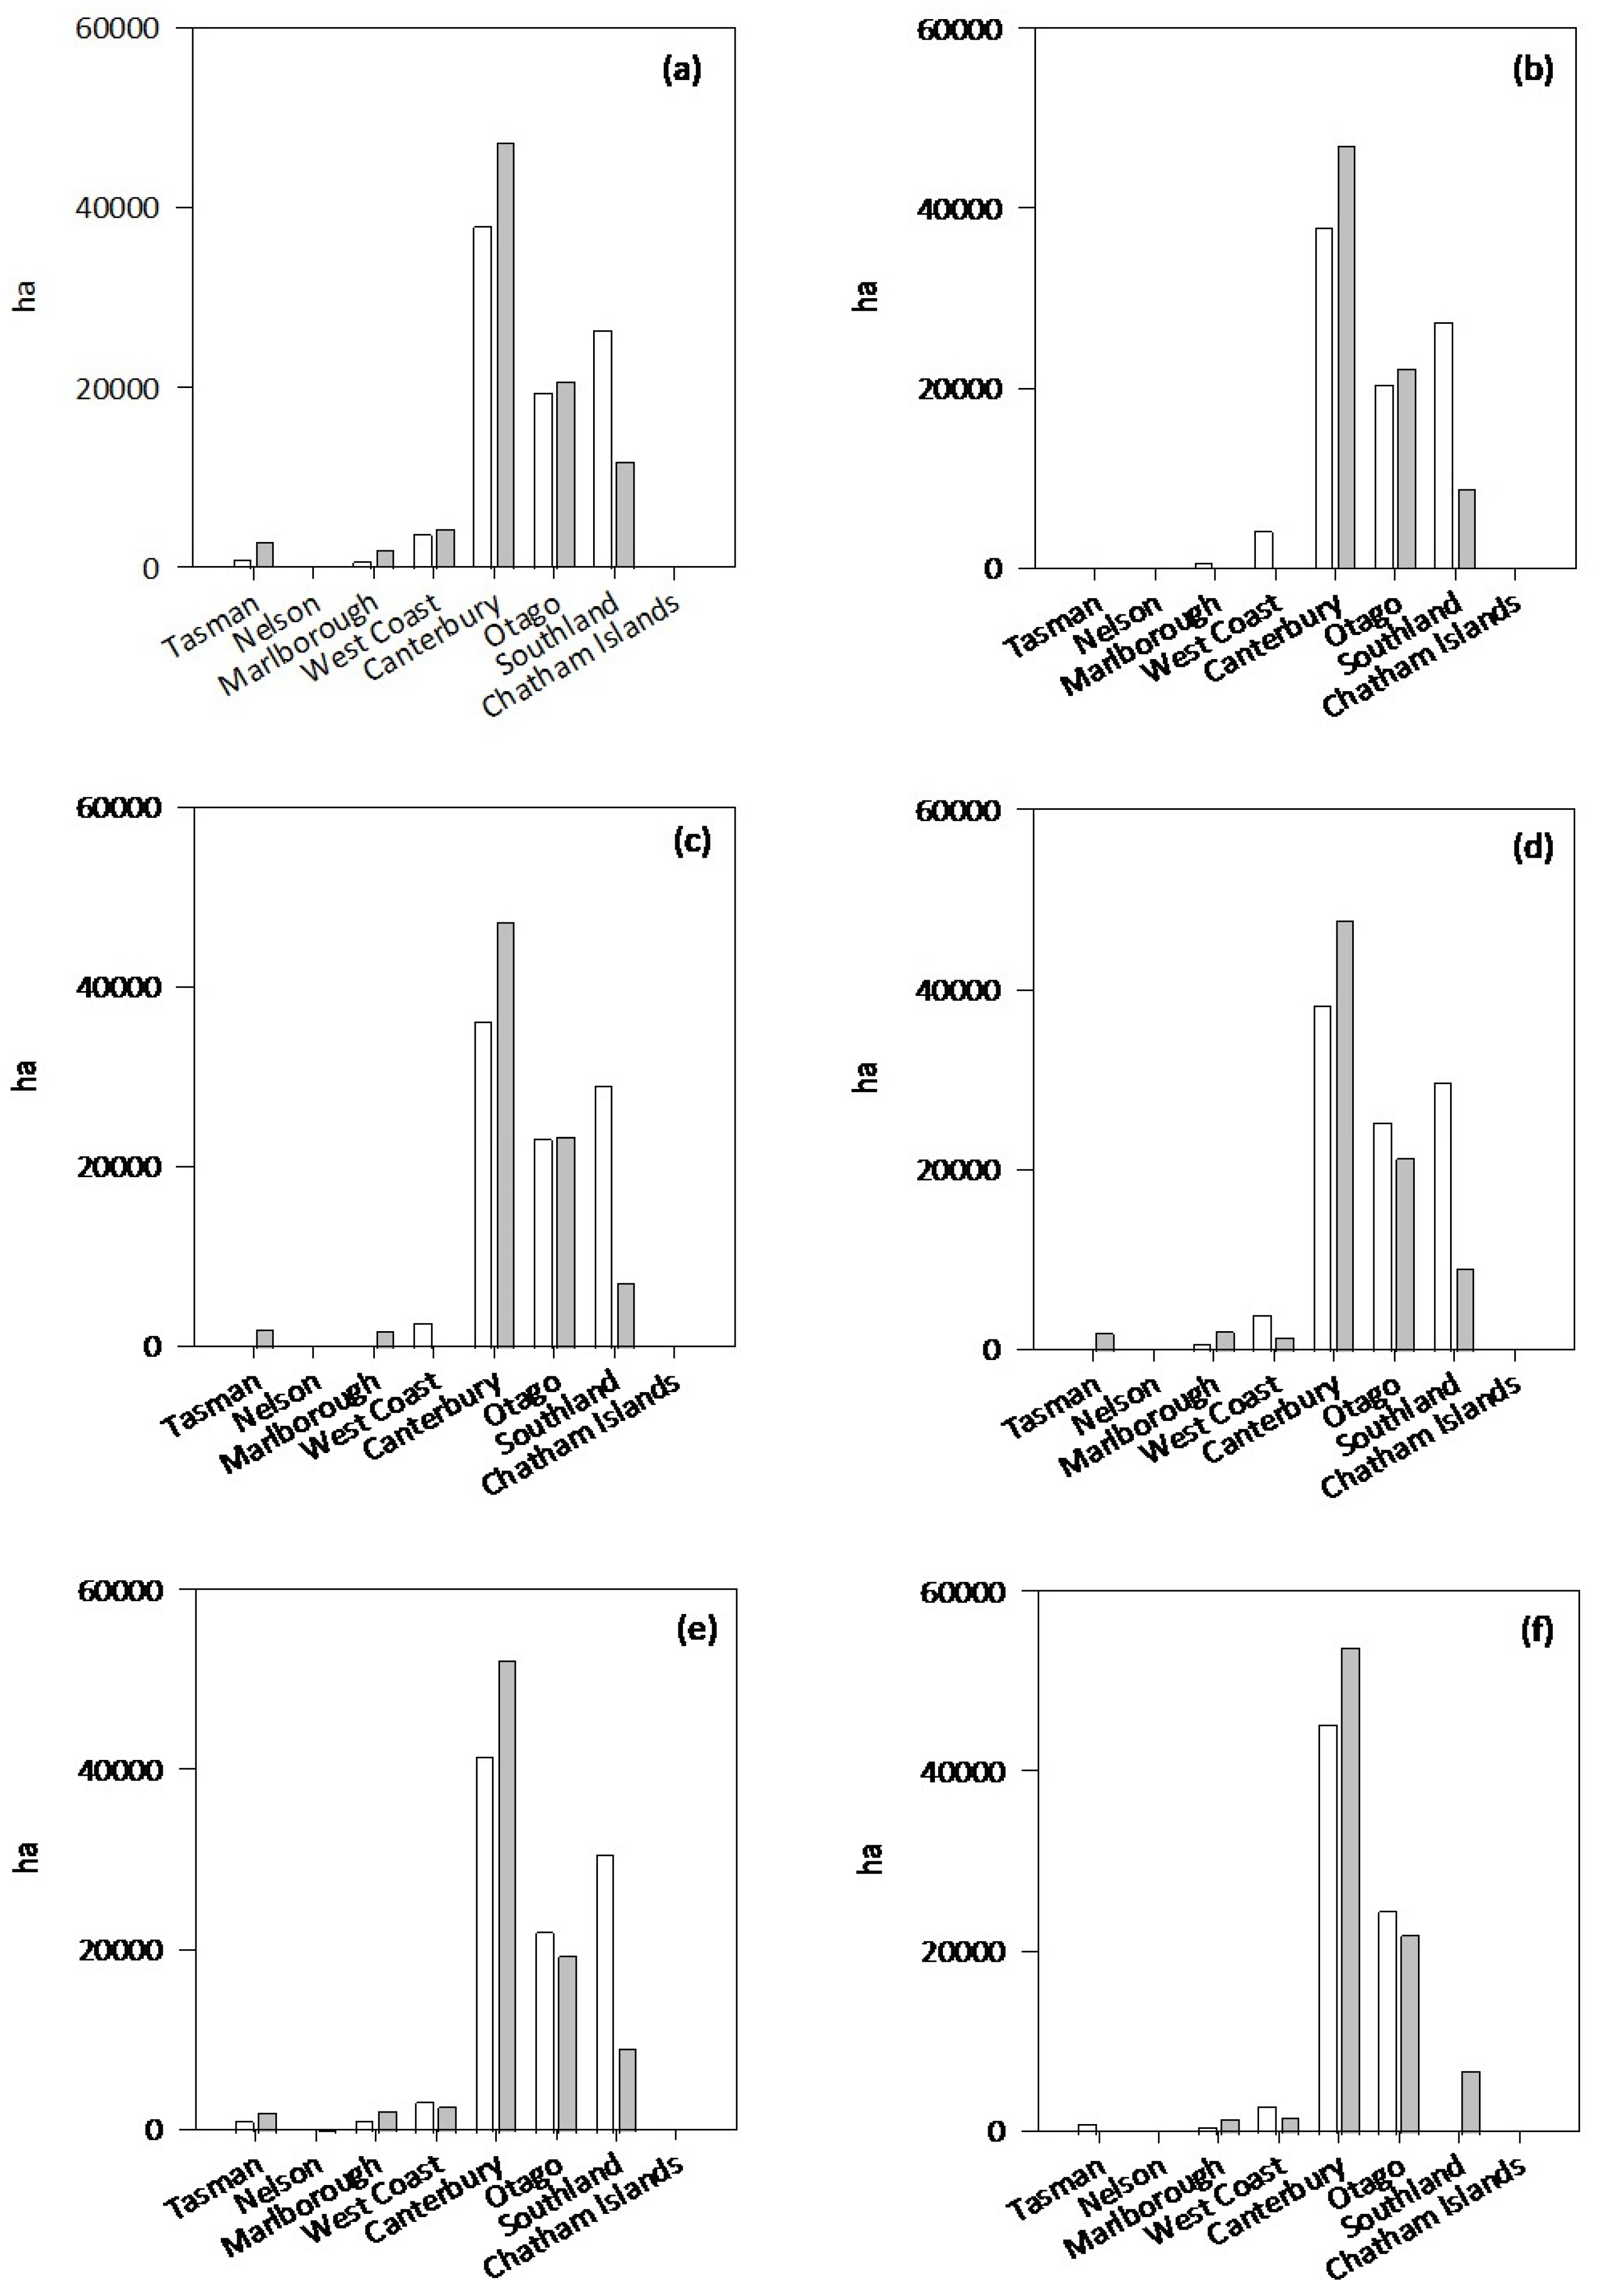
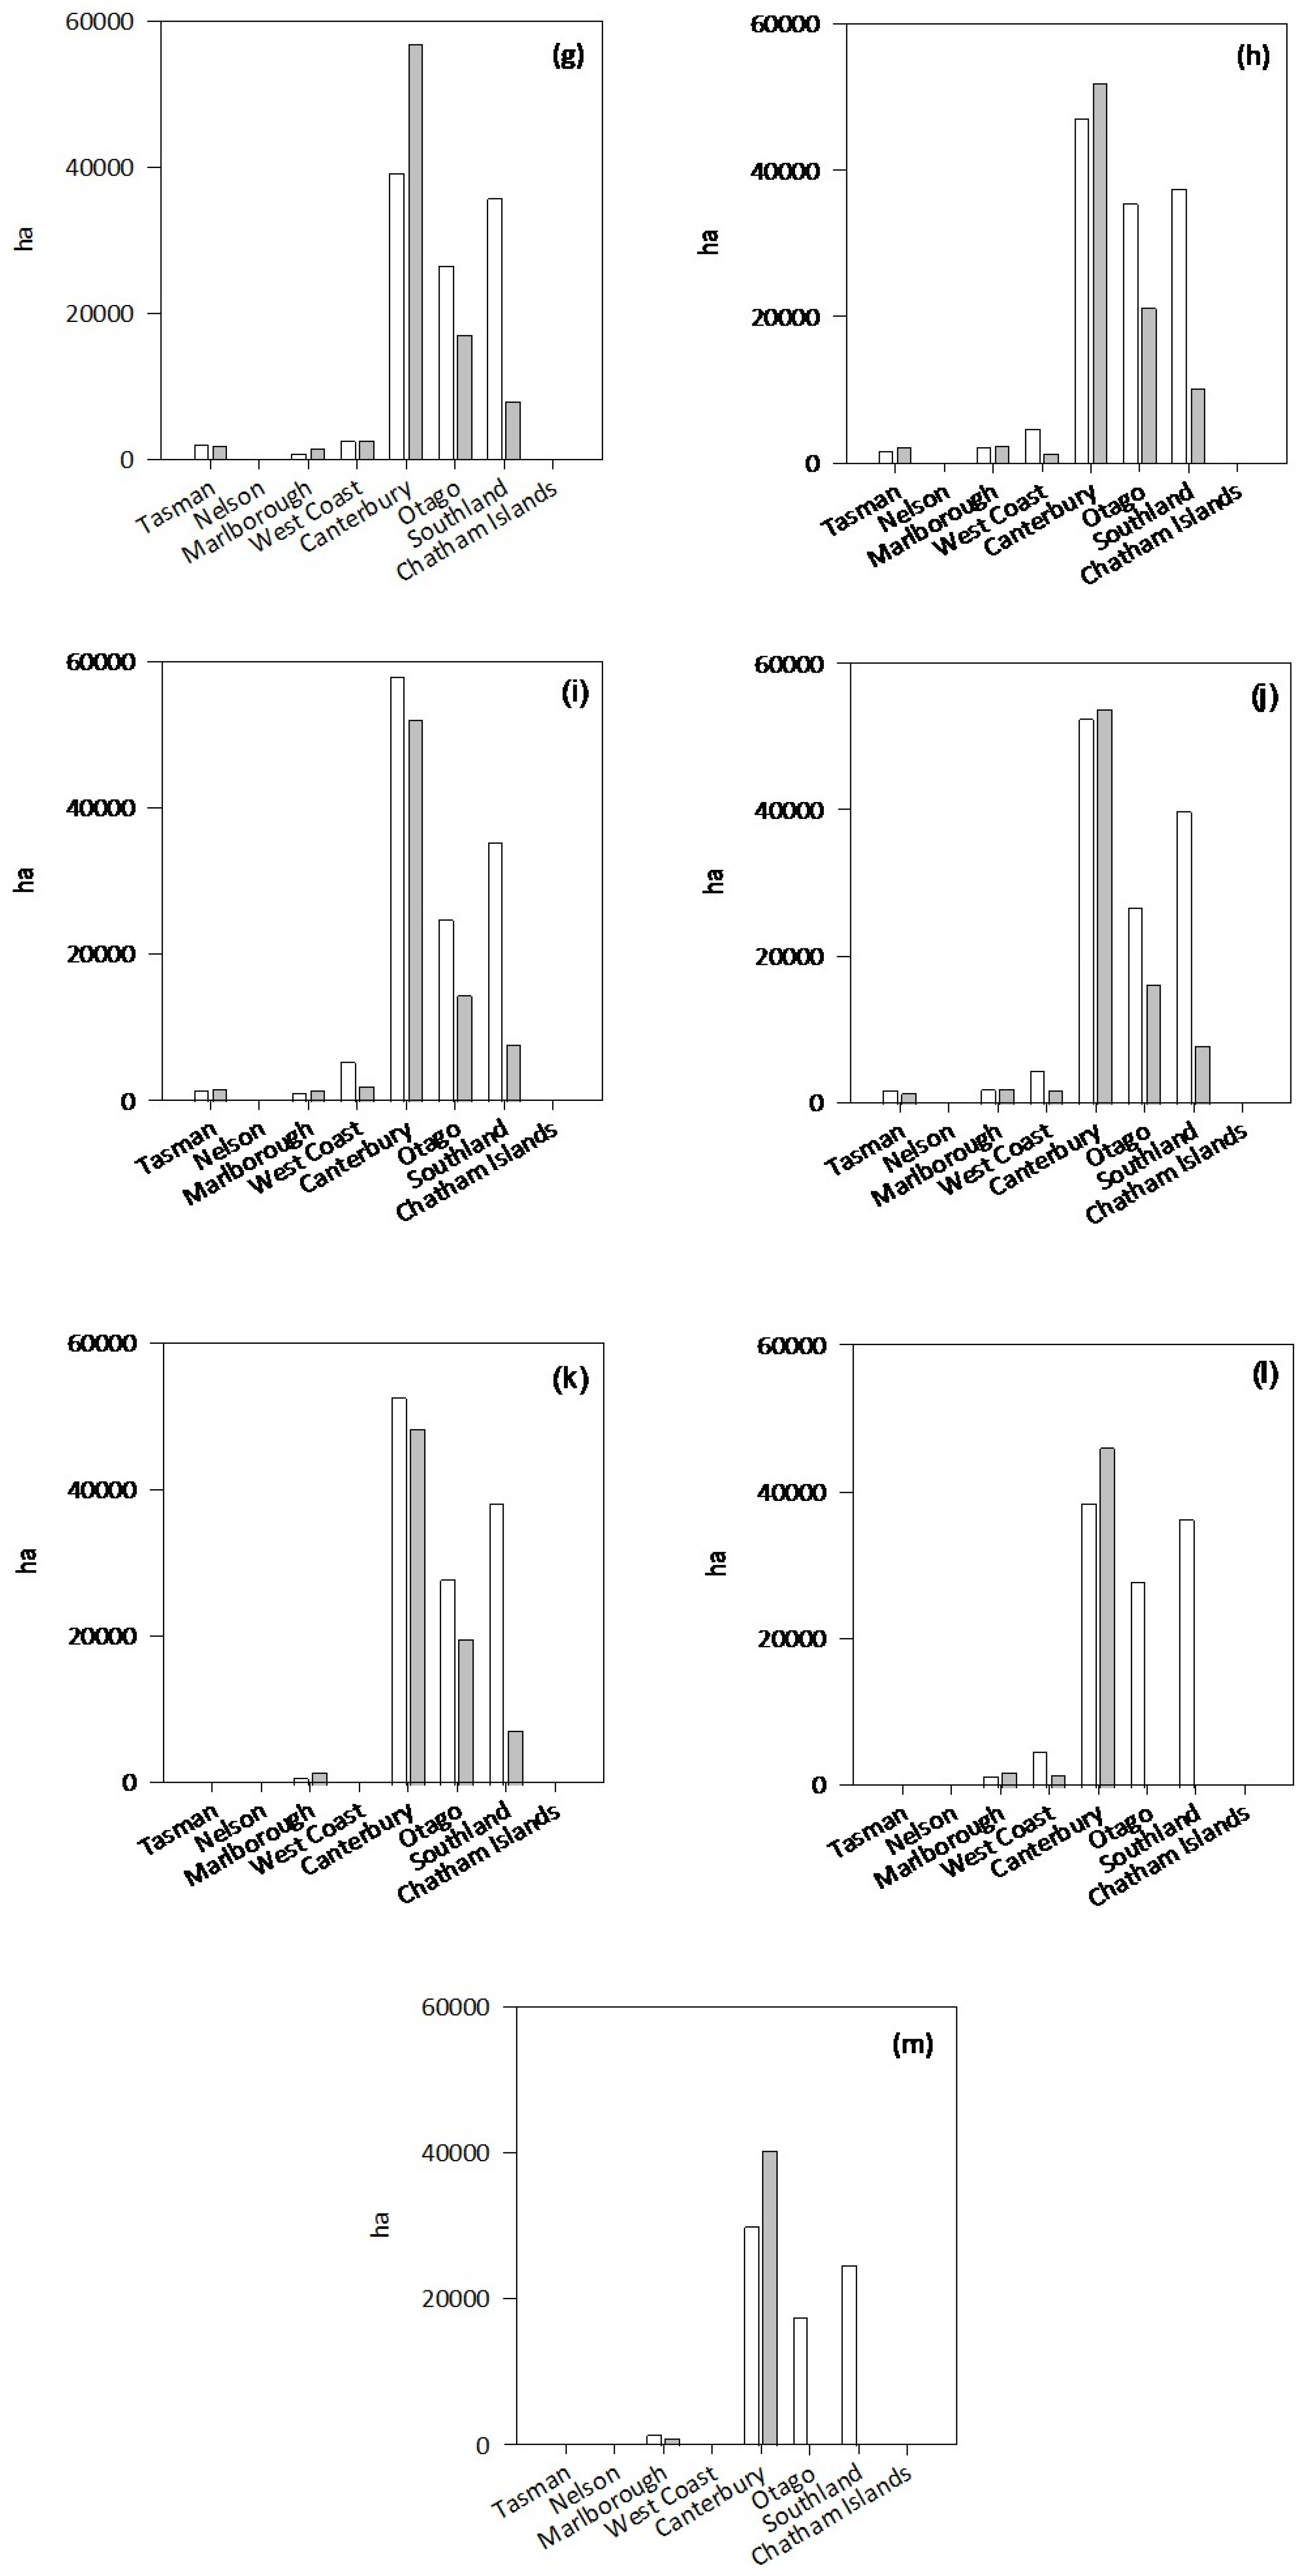
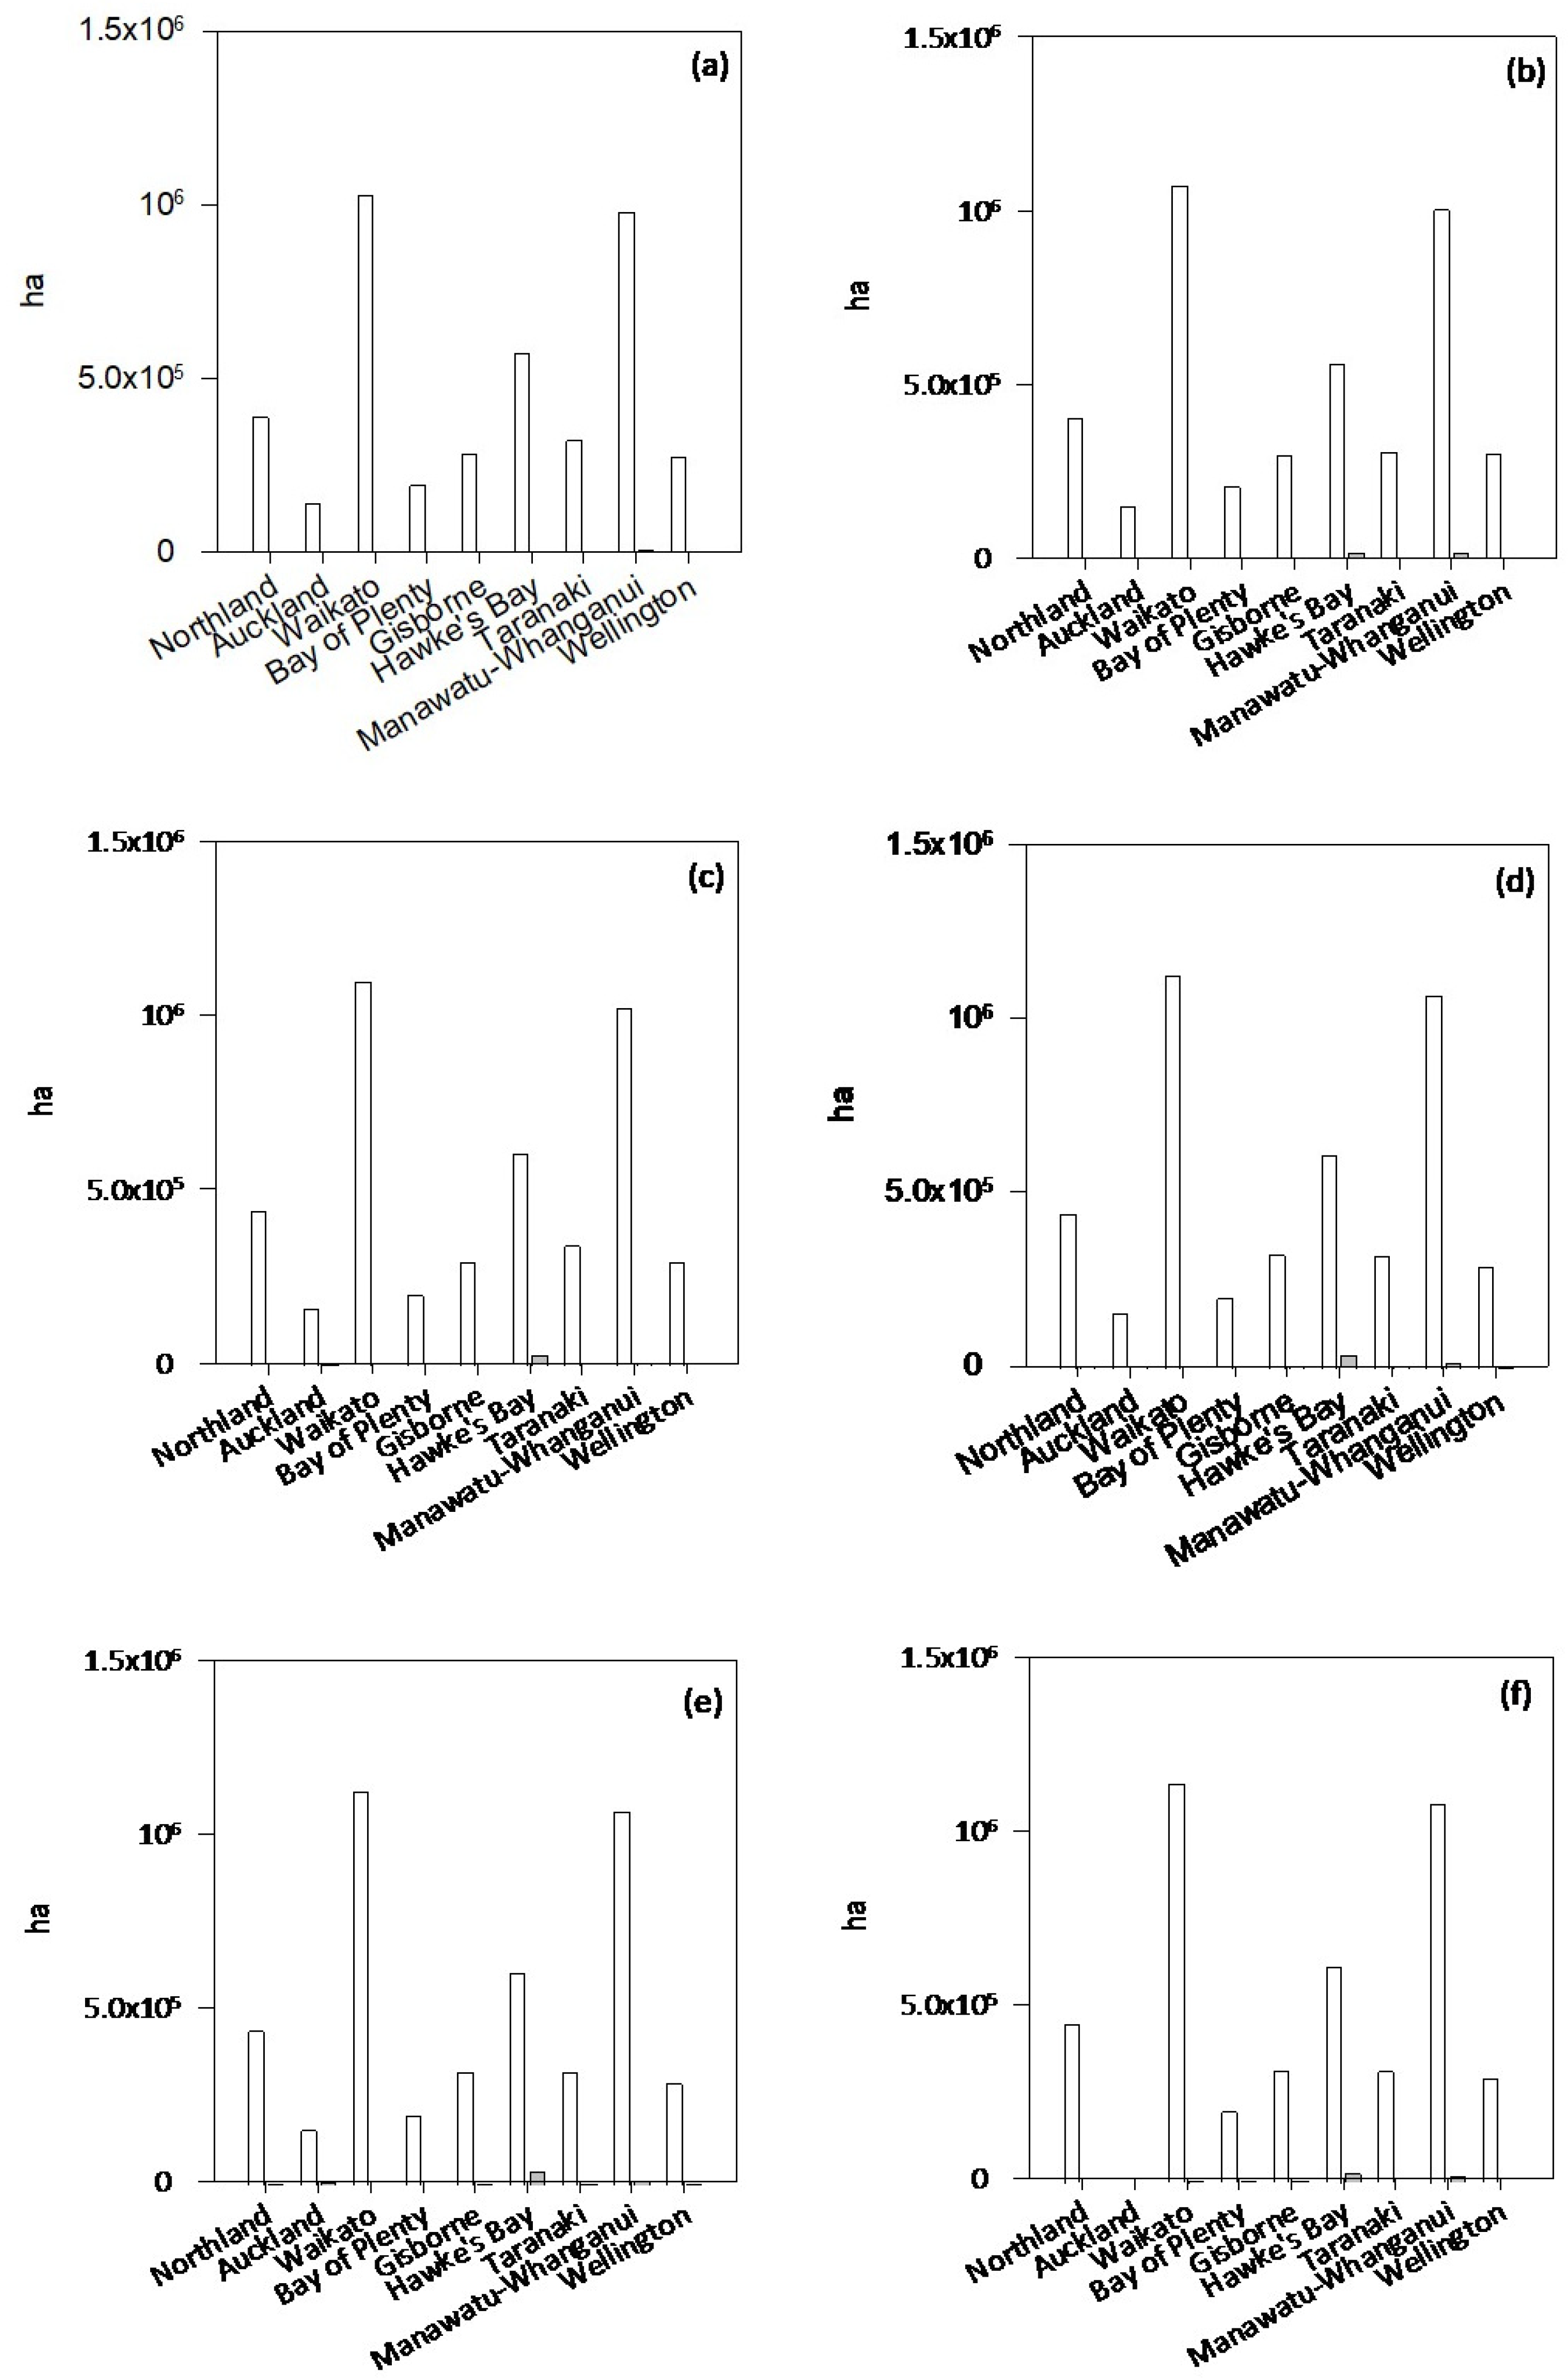
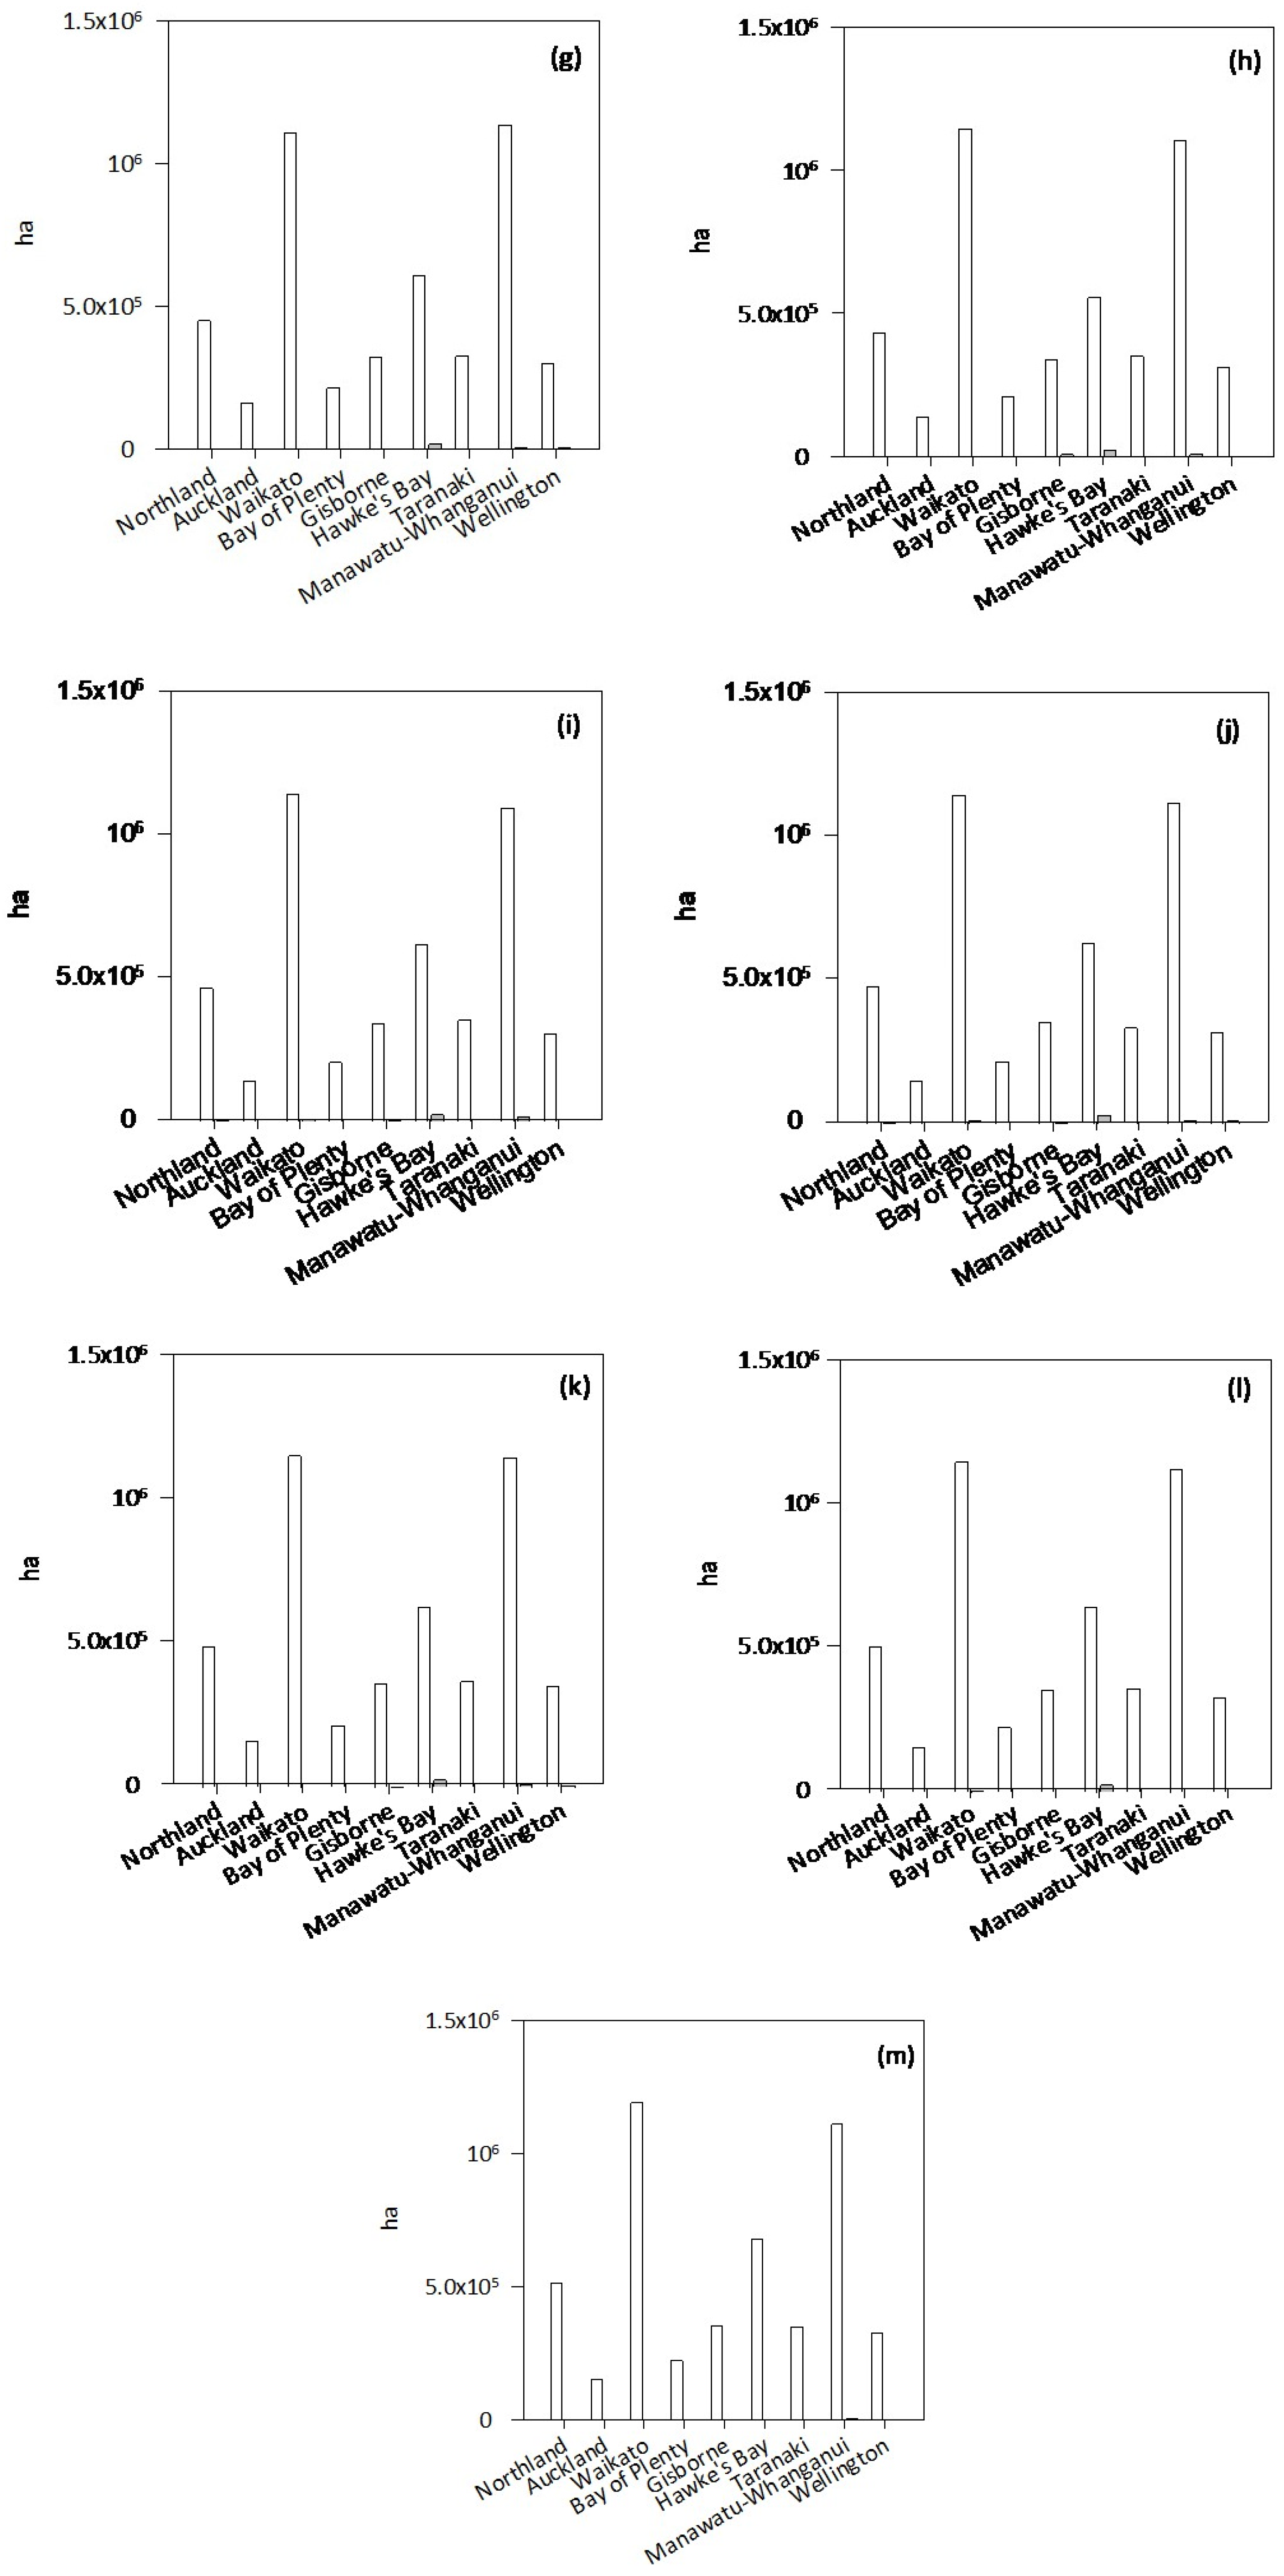
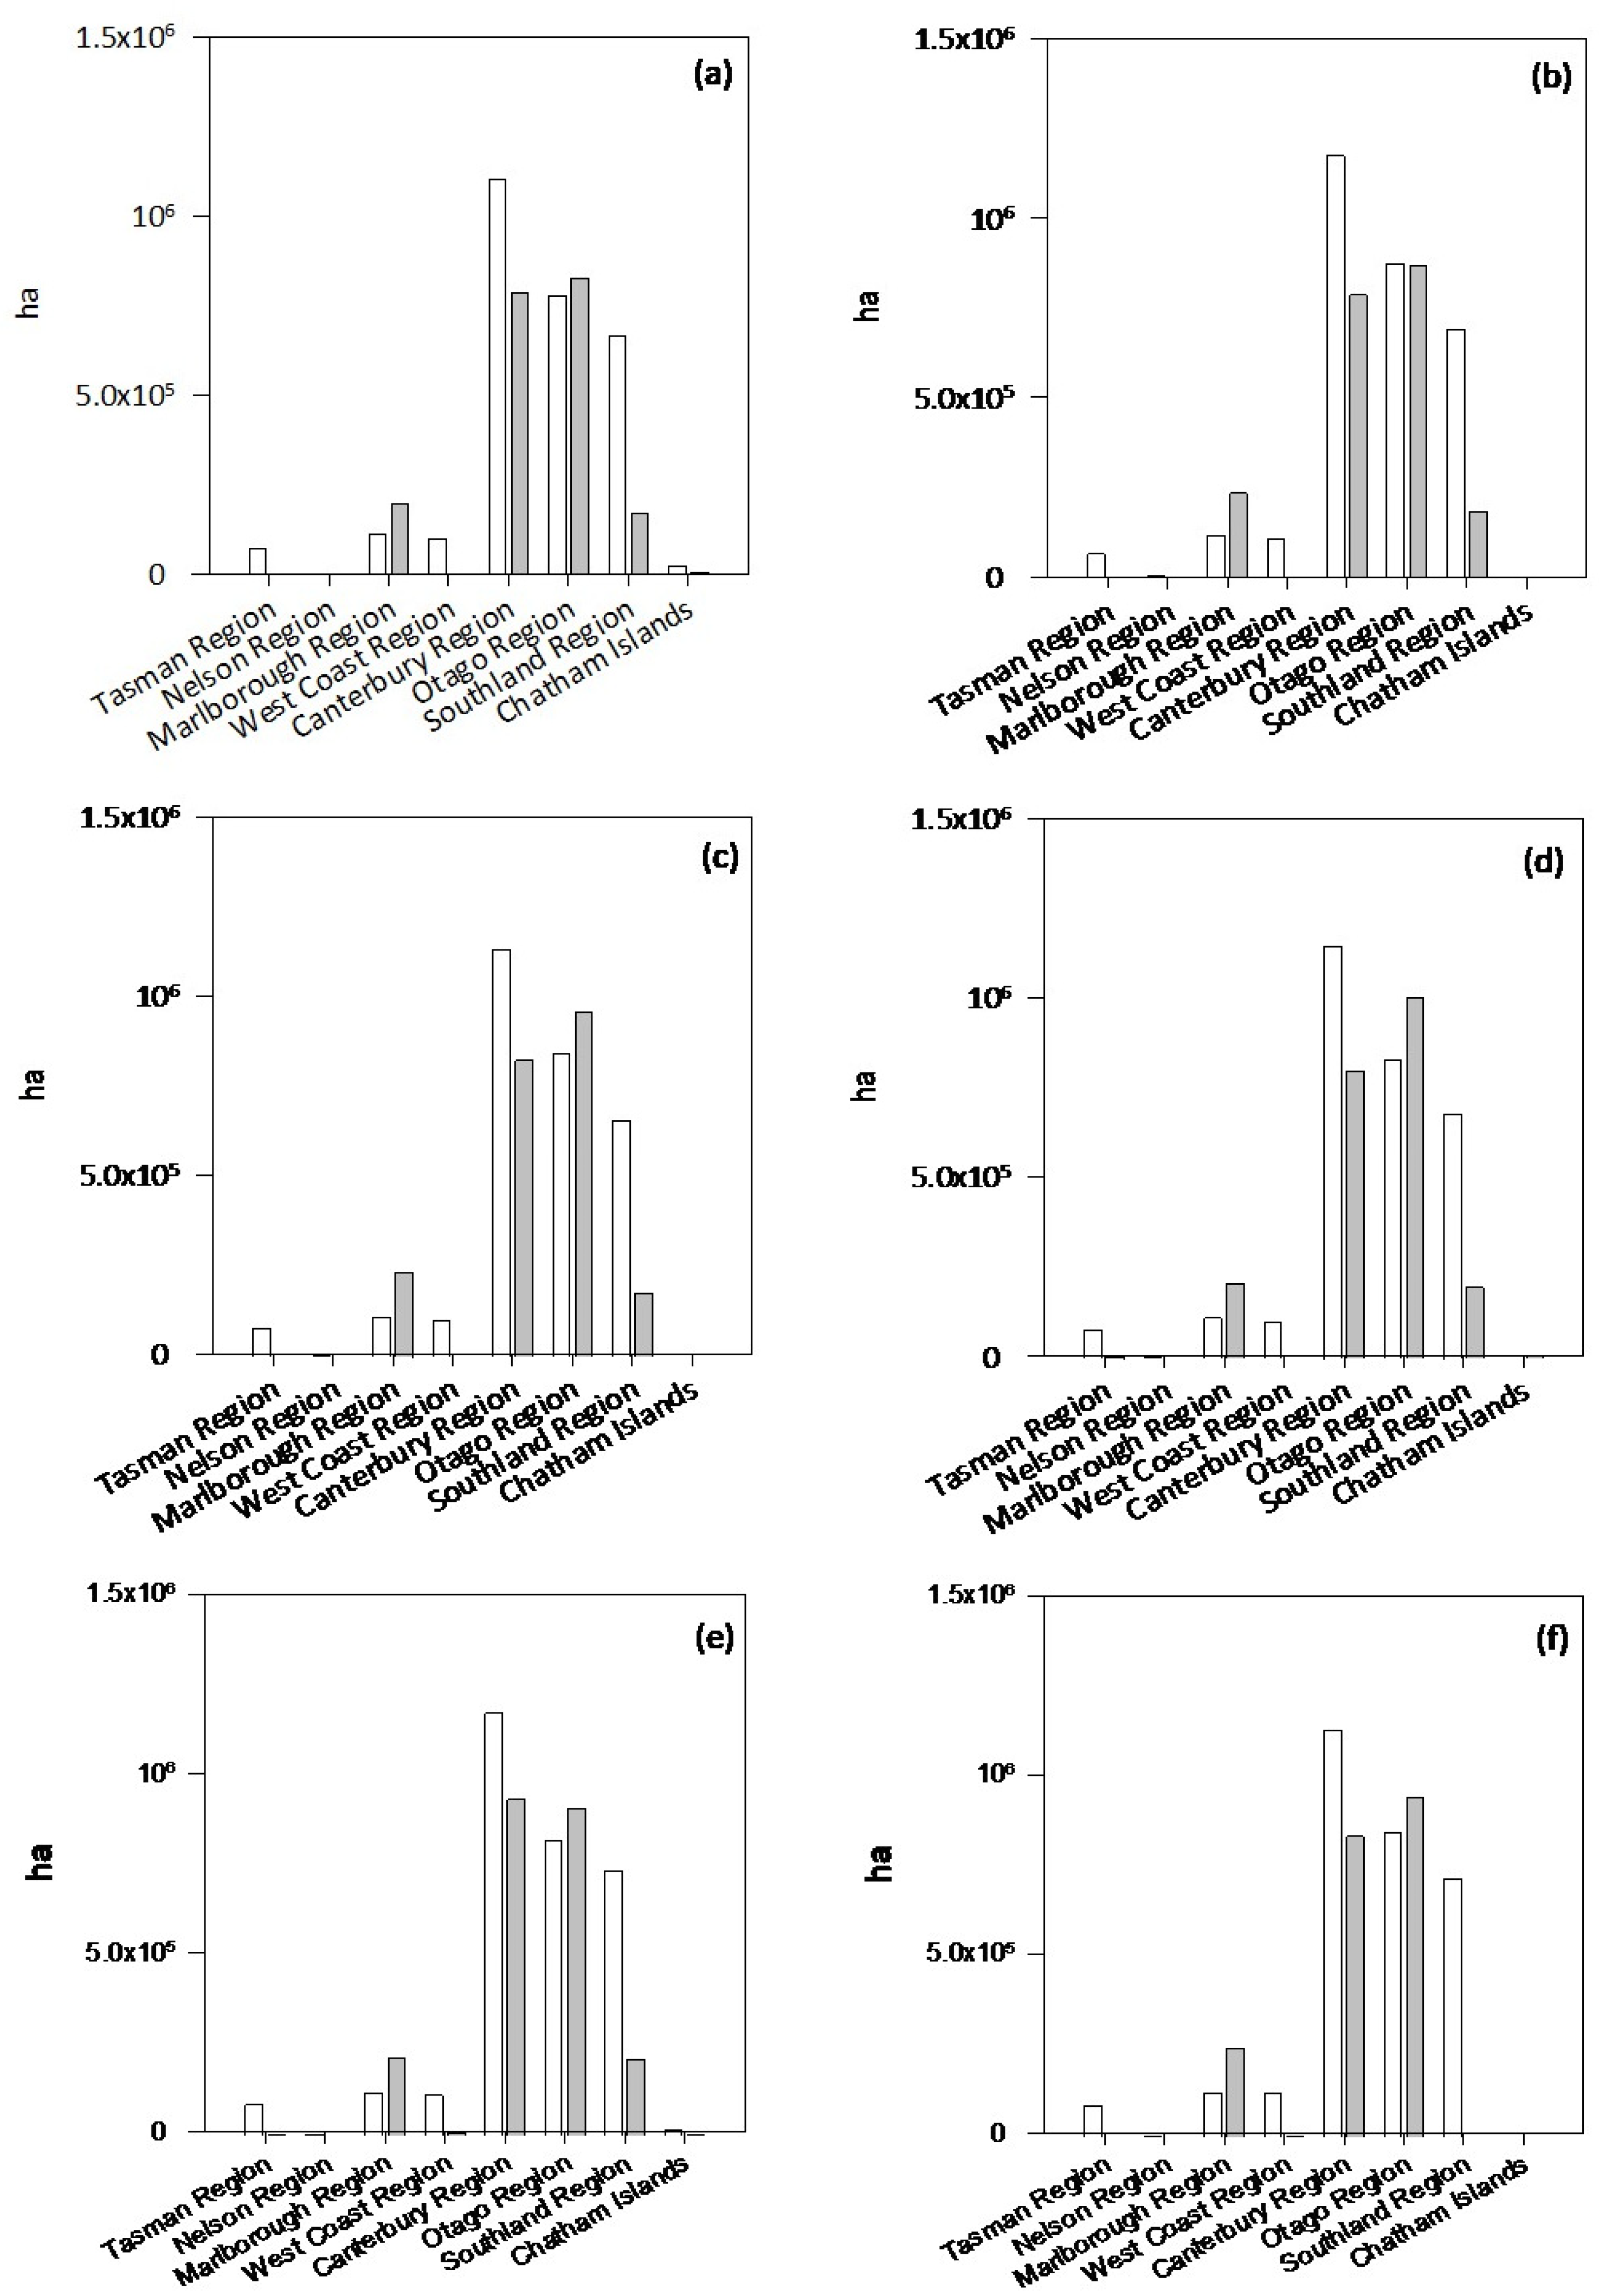
Although rates of pasture renewal appear to have increased over time in NZ, there is considerable variability in inter-annual pasture renewal rates and methods (direct drilling vs. cultivation), and these vary with region and year (Figure 1 and Figure 2). The highest pasture renewal rates were recorded in Waikato and Canterbury on the North and South Island, respectively, which most likely reflects both the scale and intensity of dairy production in these regions. For reference, the total area of grassland and tussocks (and danthonia) for the North and South Island are included (Figure 3 and Figure 4). Inter-annual variability in pasture renewal may also reflect both opportunity and problem-based drivers, for example, the availability of “new” crops, cultivars and varieties and/or response to climate variability, for example, the frequency and intensity of drought or flooding events or increase and ease of irrigation. However, the data available do not allow us to tease out any of these drivers but to merely speculate on them.
The limitations of these datasets include the fact that pasture renewal data were sourced from agricultural production statistics, Stats NZ, and their pasture renewal questions were introduced in 2009. No data were collected in 2021, as the frequency of the pasture renewal questions was changed from annual to every 5 years, with the next census year due in 2027. In addition, some data were not available due to confidentiality and/or quality suppression (provisions of the Statistics Act 1975).
The lack of clear data in NZ does not allow us to identify which areas of the farm are renewed each year, whether this varies between regions or years, and what drives it. For example, the figures that we collated would include pasture being sown into relatively bare soil following crops (e.g., maize and brassica) that were grown to fill feed gaps and have now been utilised as well as pasture being sown to fill gaps caused by insect attack, pugging, droughts, floods, and prolonged over- and undergrazing. Furthermore, and possibly more critically, the data do not allow us to comment on the success or otherwise of these renewal practices.

4.2. Adoption of Pasture Renewal and Related Technologies

Pasture renewal at scale has economic and environmental implications, coupled with potential short-term deficits in livestock feed during the renovation process. Kerr et al. [62] suggested that pasture renewal at the farm level is driven by a variety of independent and interactive factors, including (i) economics (cost/benefit); (ii) requirements for summer or winter feed and/or set annual budget allocation for a given area of pasture renewal/development; (iii) necessity/event-driven response to pasture species loss, for example, pest and disease, weed pressure, pugging, and drought and flood events.
Furthermore, proposed advantages of pasture renewal for dairy farm production may be relatively slow to materialise or difficult to initially quantify [64,67,73,74,75]. This is true of both expected increases in pasture yield and subsequent animal production. Stevens and Knowles [55] suggested that financial gain from pasture renewal may not make a significant or noticeable economic impact for 2–3 years and thereby discourage adoption and investment. In some instances, pasture renewal yield advantage may not materialise and/or persist over time [56,75]. Glassey et al. [63] reported a decline of 2275 kg DM per ha per year when comparing a 10-year-old pasture with a 1-year-old pasture over 2 years. Chapman et al. [76] reported that in general, yield did decline over time in a perennial ryegrass trial; however, some cultivars yielded more in the first 3 years, and this trend persisted through year 8 but not in year 10. This delay and/or lack of clarity in benefits/advantages to pasture renewal would be a further barrier to renewal being viewed as an essential farm management practice, as mentioned earlier.
Adoption rates of “new technologies” for grazing systems vary depending on the individual, operational constraints, political climate, state of the market, and economics. Caradus et al. (2013) suggested that new “on farm” technologies are typically resisted or rejected for a variety of reasons, for example, (i) failure to address or not perceived as directly addressing the “real” problem; (ii) not fitting readily into current farm production systems; (iii) requiring additional work/time, equipment, inputs, data collection, and interpretation to implement; (iv) being overly complex or being perceived to be so; (v) being unproven or inconsistent, depending on the year, climate, region, and cost benefit paradigm. This is compounded further by limited long-term “on farm” data from a variety of climatic zones, soils, and agronomic practices as well as the need to consider and include earnings before interest, taxes, and amortisation (EBITA) with depreciation (EBITDA) to gauge value, efficiency, and earning potential. Simply, pasture species selection is ideally based on climate, soil conditions, livestock production system/management, input costs, and market and financial considerations over time [57]. However, we feel that this still fails to address the complexity of the issues driving pasture performance, persistence, and renewal.
Brazendale et al. [71] reported that investment in pasture renewal is largely dependent on both relative yield advantage associated with the introduction of new pasture (pasture renewal) along with the duration over which this advantage will persist when compared to non-renewed pastures, with increased profits associated with new pastures that persisted for at least 4 years and had a 10% increase in pasture yield (or 0.6 MJ ME/kg DM increase in energy content). While this framework to assess new pasture species or cultivars appears robust (albeit by its nature reactive), again, it is not clear whether it is being used by plant breeders or industry professionals as a “screen” to determine the success of new cultivars or species.

5. Conclusions

There is limited information on the long-term productivity and persistence of new forage cultivars and species from pasture systems in NZ, particularly when grazed and linked with animal performance. Caution should be taken when using seasonal or annual seed sales or sowing data as indicators of pasture composition and/or renewal, as both species persistence and botanical composition will vary with time, grazing management/stocking rate, fertiliser application, weed pressure, pests and diseases, soil conditions, and climate. In addition, we suggest that there is also limited information regarding which individual or collective plant attributes/traits drive pasture persistence and performance, and we feel that this should be considered from a whole-plant perspective.
Furthermore, there is no one single resource for information relating to NZ’s dairy industry in general or pastures in particular; rather, it is spread across multiple stakeholders and is challenging (at best) to utilise due to variations in approaches used when categorising information and/or in the manner in which data were collected and presented. Going forward and beyond the remit of this manuscript, we feel a central standardisation and continuity of data collection is needed for the dairy industry in NZ, which would enable a more considered and holistic approach to future challenges.

Author Contributions

Writing—original draft preparation and writing—review and editing, A.D.C.; conceptualization, writing—review and editing, and funding acquisition, D.J.D. All authors have read and agreed to the published version of the manuscript.

Funding

This research was funded by Fonterra Co-operative Ltd.

Data Availability Statement

Restrictions apply to the availability of these data. Data were obtained from Stats NZ and are available upon request from Stats NZ (Home|Stats NZ).

Acknowledgments

We gratefully thank the T.R. Ellett Agricultural Research Trust for the financial support of Andrew D. Cartmill.

Conflicts of Interest

The authors declare no conflicts of interest. The funders had no role in the design of the study; in the collection, analyses, or interpretation of data; in the writing of the manuscript; or in the decision to publish the results.

References

  1. USDA. Dairy and Products Semi-Annual; NZ2023-0010; USDA Foreign Agricultural Service: Washington, DC, USA, 2023; p. 14.
  2. LIC and DairyNZ. New Zealand Dairy Statistics 2021-22; Livestock Improvement Corporation Limited & DairyNZ Limited: Hamilton, New Zealand, 2022; p. 64. [Google Scholar]
  3. Rys, G.J.; Gibbs, J.; Clark, D.A.; Lambert, G.; Clark, H.; Newman, M. Productivity, changes and resilience in New Zealand grassland agriculture over the last three decades. Grassl. Res. Pract. Ser. 2021, 17, 37–54. [Google Scholar] [CrossRef]
  4. Caradus, J.R.; Goldson, S.L.; Moot, D.J.; Rowarth, J.S.; Stewart, A.V. Pastoral agriculture, a significant driver of New Zealand’s economy, based on an introduced grassland ecology and technological advances. J. R. Soc. N. Z. 2023, 53, 259–303. [Google Scholar] [CrossRef]
  5. Easton, H.; Amyes, J.; Cameron, N.; Green, R.; Kerr, G.; Norriss, M.; Stewart, A. Pasture plant breeding in New Zealand: Where to from here? Proc. N. Z. Grassl. Assoc. 2002, 64, 173–179. [Google Scholar] [CrossRef]
  6. Dhakal, M.; West, C.P.; Villalobos, C.; Brown, P.; Green, P.E. Interseeding alfalfa into native grassland for enhanced yield and water use efficiency. Agron. J. 2020, 112, 1931–1942. [Google Scholar] [CrossRef]
  7. Moot, D.J. A review of legume research and extension in New Zealand (1990–2022). Crop Pasture Sci. 2022, 74, 647–660. [Google Scholar] [CrossRef]
  8. Ledgard, S.; Steele, K. Biological nitrogen fixation in mixed legume/grass pastures. Plant Soil 1992, 141, 137–153. [Google Scholar] [CrossRef]
  9. Sheath, G.; Hay, R. Overview of legume persistence in New Zealand. In Persistence Forage Legumes; Wiley: New York, NY, USA, 1989; pp. 23–36. [Google Scholar]
  10. Ledgard, S.F. Nitrogen cycling in low input legume-based agriculture, with emphasis on legume/grass pastures. Plant Soil 2001, 228, 43–59. [Google Scholar] [CrossRef]
  11. Moot, D. An overview of dryland legume research in New Zealand. Crop Pasture Sci. 2012, 63, 726–733. [Google Scholar] [CrossRef]
  12. Caradus, J.; Woodfield, D.; Stewart, A. Overview and vision for white clover: New Zealand’s competitive edge (Vol. Proceedings of White Clover Symposium). NZGA Res. Pract. Ser. 1995, 6, 1–6. [Google Scholar]
  13. Tozer, K.; Chapman, D.; Bell, N.; Crush, J.; King, W.; Rennie, G.; Wilson, D.; Mapp, N.; Rossi, L.; Aalders, L. Botanical survey of perennial ryegrass-based dairy pastures in three regions of New Zealand: Implications for ryegrass persistence. N. Z. J. Agric. Res. 2014, 57, 14–29. [Google Scholar] [CrossRef]
  14. McCahon, K.; McCahon, A.; Ussher, G. Diversified pastures at the front line of climate change in Northland: Farmers experiences, new directions and wider implications for other parts of the country. NZGA Res. Pract. Ser. 2021, 17, 213–224. [Google Scholar] [CrossRef]
  15. Woodfield, D.; Caradus, J. Factors affecting white clover persistence in New Zealand pastures. Proc. N. Z. Grassl. Assoc. 1996, 58, 229–235. [Google Scholar] [CrossRef]
  16. Lee, J.; Thom, E.; Waugh, D.; Bell, N.; McNeill, M.; Wilson, D.; Chapman, D. Trajectory and causes of decline in the botanical composition of dairy-grazed pasture in the Waikato. J. N. Z. Grasslands 2018, 79, 89–96. [Google Scholar] [CrossRef]
  17. Easton, S.; Baird, D.; Baxter, G.; Cameron, N.; Hainsworth, R.; Johnston, C.; Kerr, G.; Lyons, T.; Mccabe, R.; Nichol, W. Annual and hybrid ryegrass cultivars in New Zealand. Proc. N. Z. Grassl. Assoc. 1997, 59, 239–244. [Google Scholar] [CrossRef]
  18. Milne, G.; Shaw, R.; Powell, R.; Pirie, B.; Pirie, J. Tall fescue use on dairy farms. Proc. N. Z. Grassl. Assoc. 1997, 59, 163–167. [Google Scholar] [CrossRef]
  19. Rollo, M.; Sheath, G.; Slay, M.; Knight, T.; Judd, T.; Thomson, N. Tall fescue and chicory for increased summer forage production. Proc. N. Z. Grassl. Assoc. 1998, 60, 249–253. [Google Scholar] [CrossRef]
  20. Pyke, N.; Rolston, M.; Woodfield, D. National and export trends in herbage seed production. Proc. N. Z. Grassl. Assoc. 2004, 66, 95–102. [Google Scholar] [CrossRef]
  21. Chynoweth, R.; Pyke, N.; Rolston, M.; Kelly, M. Trends in New Zealand herbage seed production: 2004–2014. Agron. N. Z. 2015, 45, 47–56. [Google Scholar]
  22. Vasta, V.; Daghio, M.; Cappucci, A.; Buccioni, A.; Serra, A.; Viti, C.; Mele, M. Invited review: Plant polyphenols and rumen microbiota responsible for fatty acid biohydrogenation, fiber digestion, and methane emission: Experimental evidence and methodological approaches. J. Dairy Sci. 2019, 102, 3781–3804. [Google Scholar] [CrossRef] [PubMed]
  23. Distel, R.A.; Arroquy, J.I.; Lagrange, S.; Villalba, J.J. Designing diverse agricultural pastures for improving ruminant production systems. Front. Sustain. Food Syst. 2020, 4, 596869. [Google Scholar] [CrossRef]
  24. Mueller-Harvey, I.; Bee, G.; Dohme-Meier, F.; Hoste, H.; Karonen, M.; Kölliker, R.; Lüscher, A.; Niderkorn, V.; Pellikaan, W.F.; Salminen, J.-P. Benefits of condensed tannins in forage legumes fed to ruminants: Importance of structure, concentration, and diet composition. Crop Sci. 2019, 59, 861–885. [Google Scholar] [CrossRef]
  25. Lagrange, S.; Beauchemin, K.A.; MacAdam, J.; Villalba, J.J. Grazing diverse combinations of tanniferous and non-tanniferous legumes: Implications for beef cattle performance and environmental impact. Sci. Total Environ. 2020, 746, 140788. [Google Scholar] [CrossRef]
  26. Rochfort, S.; Parker, A.J.; Dunshea, F.R. Plant bioactives for ruminant health and productivity. Phytochemistry 2008, 69, 299–322. [Google Scholar] [CrossRef]
  27. Isbell, F.; Craven, D.; Connolly, J.; Loreau, M.; Schmid, B.; Beierkuhnlein, C.; Bezemer, T.M.; Bonin, C.; Bruelheide, H.; De Luca, E. Biodiversity increases the resistance of ecosystem productivity to climate extremes. Nature 2015, 526, 574–577. [Google Scholar] [CrossRef]
  28. Hector, A.; Bazeley-White, E.; Loreau, M.; Otway, S.; Schmid, B. Overyielding in grassland communities: Testing the sampling effect hypothesis with replicated biodiversity experiments. Ecol. Lett. 2002, 5, 502–511. [Google Scholar] [CrossRef]
  29. Polley, H.W.; Briske, D.D.; Morgan, J.A.; Wolter, K.; Bailey, D.W.; Brown, J.R. Climate change and North American rangelands: Trends, projections, and implications. Rangel. Ecol. Manag. 2013, 66, 493–511. [Google Scholar] [CrossRef]
  30. Cottingham, K.; Brown, B.; Lennon, J. Biodiversity may regulate the temporal variability of ecological systems. Ecol. Lett. 2001, 4, 72–85. [Google Scholar] [CrossRef]
  31. Hector, A.; Hautier, Y.; Saner, P.; Wacker, L.; Bagchi, R.; Joshi, J.; Scherer-Lorenzen, M.; Spehn, E.M.; Bazeley-White, E.; Weilenmann, M. General stabilizing effects of plant diversity on grassland productivity through population asynchrony and overyielding. Ecology 2010, 91, 2213–2220. [Google Scholar] [CrossRef]
  32. Skinner, R.H.; Dell, C.J. Yield and soil carbon sequestration in grazed pastures sown with two or five forage species. Crop Sci. 2016, 56, 2035–2044. [Google Scholar] [CrossRef]
  33. Sanderson, M.; Goslee, S.; Soder, K.; Skinner, R.; Tracy, B.; Deak, A. Plant species diversity, ecosystem function, and pasture management—A perspective. Can. J. Plant Sci. 2007, 87, 479–487. [Google Scholar] [CrossRef]
  34. Tjoelker, M.; Craine, J.M.; Wedin, D.; Reich, P.B.; Tilman, D. Linking leaf and root trait syndromes among 39 grassland and savannah species. New Phytol. 2005, 167, 493–508. [Google Scholar] [CrossRef]
  35. Craine, J.; Tilman, D.; Wedin, D.; Reich, P.; Tjoelker, M.; Knops, J. Functional traits, productivity and effects on nitrogen cycling of 33 grassland species. Funct. Ecol. 2002, 16, 563–574. [Google Scholar] [CrossRef]
  36. Yahdjian, L.; Sala, O.E.; Austin, A.T. Differential controls of water input on litter decomposition and nitrogen dynamics in the Patagonian steppe. Ecosystems 2006, 9, 128–141. [Google Scholar] [CrossRef]
  37. Chimner, R.; Welker, J. Ecosystem respiration responses to experimental manipulations of winter and summer precipitation in a Mixedgrass Prairie, WY, USA. Biogeochemistry 2005, 73, 257–270. [Google Scholar] [CrossRef]
  38. McMeekan, C. The pros and cons of high stocking rate. Massey Dairy Farming Annu. 1961, 13, 9–15. [Google Scholar]
  39. Roche, J.; Berry, D.; Bryant, A.; Burke, C.; Butler, S.; Dillon, P.; Donaghy, D.; Horan, B.; Macdonald, K.; Macmillan, K. A 100-year review: A century of change in temperate grazing dairy systems. J. Dairy Sci. 2017, 100, 10189–10233. [Google Scholar] [CrossRef] [PubMed]
  40. Burns, J.; Lippke, H.; Fisher, D. The relationship of herbage mass and characteristics to animal responses in grazing experiments. Grazing Res. Des. Methodol. Anal. 1989, 16, 7–19. [Google Scholar]
  41. Ignatavičius, G.; Sinkevičius, S.; Ložytė, A. Effects of grassland management on plant communities. Ekologija 2013, 59, 99–110. [Google Scholar] [CrossRef]
  42. Macdonald, K.; Penno, J.; Lancaster, J.; Roche, J. Effect of stocking rate on pasture production, milk production, and reproduction of dairy cows in pasture-based systems. J. Dairy Sci. 2008, 91, 2151–2163. [Google Scholar] [CrossRef] [PubMed]
  43. Sollenberger, L.E.; Agouridis, C.T.; Vanzant, E.S.; Franzluebbers, A.J.; Owens, L.B. Prescribed grazing on pasturelands. In Conservation Outcomes from Pastureland and Hayland Practices: Assessment, Recommendations, and Knowledge Gaps; NRCS: Washington, DC, USA, 2012; pp. 111–204. [Google Scholar]
  44. Reeves, J.L.; Derner, J.D.; Sanderson, M.A.; Hendrickson, J.R.; Kronberg, S.L.; Petersen, M.K.; Vermeire, L.T. Seasonal weather influences on yearling beef steer production in C3-dominated Northern Great Plains rangeland. Agric. Ecosyst. Environ. 2014, 183, 110–117. [Google Scholar] [CrossRef]
  45. Dodd, M.; Barker, D.; Wedderburn, M. Plant diversity effects on herbage production and compositional changes in New Zealand hill country pastures. Grass Forage Sci. 2004, 59, 29–40. [Google Scholar] [CrossRef]
  46. Walker, J.W.; Heitschmidt, R.K.; Dowhower, S.L. Some effects of a rotational grazing treatment on cattle preference for plant communities. Rangel. Ecol. Manag. /J. Range Manag. Arch. 1989, 42, 143–148. [Google Scholar] [CrossRef]
  47. Walker, J.W.; Heitschmidt, R.K. Some effects of a rotational grazing treatment on cattle grazing behavior. Rangel. Ecol. Manag. /J. Range Manag. Arch. 1989, 42, 337–342. [Google Scholar] [CrossRef]
  48. Brink, G.; Jackson, R.; Alber, N. Residual sward height effects on growth and nutritive value of grazed temperate perennial grasses. Crop Sci. 2013, 53, 2264–2274. [Google Scholar] [CrossRef]
  49. Alber, N.; Brink, G.; Jackson, R. Temperate grass response to extent and timing of grazing. Can. J. Plant Sci. 2014, 94, 827–833. [Google Scholar] [CrossRef]
  50. Volesky, J.D.; Anderson, B.E. Defoliation effects on production and nutritive value of four irrigated cool-season perennial grasses. Agron. J. 2007, 99, 494–500. [Google Scholar] [CrossRef]
  51. Fulkerson, W.; Donaghy, D. Plant-soluble carbohydrate reserves and senescence—Key criteria for developing an effective grazing management system for ryegrass-based pastures: A review. Aust. J. Exp. Agric. 2001, 41, 261–275. [Google Scholar] [CrossRef]
  52. Daly, M.; Fraser, T.; Perkins, A.; Moffat, C. Farmer perceptions of reasons for perennial pasture persistence and the relationship of these with management practice, species composition, and soil fertility. Proc. N. Z. Grassl. Assoc. 1999, 61, 9–15. [Google Scholar] [CrossRef]
  53. Bell, N.; Townsend, R.; Popay, A.; Mercer, C.; Jackson, T. Black beetle: Lessons from the past and options for the future. NZGA Res. Pract. Ser. 2011, 15, 119–124. [Google Scholar] [CrossRef]
  54. Tozer, K.; Cameron, C.; Thom, E. Pasture persistence: Farmer observations and field measurements. NZGA Res. Pract. Ser. 2011, 15, 25–30. [Google Scholar] [CrossRef]
  55. Stevens, D.; Knowles, I. Identifying the need for pasture renewal and valuing the contribution of renewal on a dairy farm-Telford Dairy, a case study. NZGA Res. Pract. Ser. 2011, 15, 211–216. [Google Scholar] [CrossRef]
  56. Parsons, A.; Edwards, G.; Newton, P.; Chapman, D.; Caradus, J.; Rasmussen, S.; Rowarth, J. Past lessons and future prospects: Plant breeding for yield and persistence in cool-temperate pastures. Grass Forage Sci. 2011, 66, 153–172. [Google Scholar] [CrossRef]
  57. Dodd, M.; Chapman, D.; Ogle, G. Regrassing trends and drivers in the New Zealand dairy industry. J. N. Z. Grassl. 2018, 80, 177–184. [Google Scholar] [CrossRef]
  58. Kayser, M.; Müller, J.; Isselstein, J. Grassland renovation has important consequences for C and N cycling and losses. Food Energy Secur. 2018, 7, e00146. [Google Scholar] [CrossRef]
  59. Reinsch, T.; Loges, R.; Kluß, C.; Taube, F. Renovation and conversion of permanent grass-clover swards to pasture or crops: Effects on annual N2O emissions in the year after ploughing. Soil Tillage Res. 2018, 175, 119–129. [Google Scholar] [CrossRef]
  60. Calvelo-Pereira, R.; Hedley, M.J.; Hanly, J.A.; Beare, M.H.; McNally, S.R.; Bretherton, M.R. Spring pasture renewal involving full inversion tillage and a summer crop can facilitate soil C storage, improve crop yields and lower N leaching. Soil Tillage Res. 2022, 219, 105347. [Google Scholar] [CrossRef]
  61. Rutledge, S.; Wall, A.; Mudge, P.; Troughton, B.; Campbell, D.; Pronger, J.; Joshi, C.; Schipper, L. The carbon balance of temperate grasslands part II: The impact of pasture renewal via direct drilling. Agric. Ecosyst. Environ. 2017, 239, 132–142. [Google Scholar] [CrossRef]
  62. Kerr, G.; Brown, J.; Kilday, T.; Stevens, D. A more quantitative approach to pasture renewal. J. N. Z. Grassl. 2015, 77, 251–258. [Google Scholar] [CrossRef]
  63. Glassey, C.; Roach, C.; Strahan, M.; McClean, N. Dry matter yield, pasture quality and profit on two Waikato dairy farms after pasture renewal. Proc. N. Z. Grassl. Assoc. 2010, 72, 91–96. [Google Scholar]
  64. Tozer, K.; Rennie, G.; King, W.; Mapp, N.; Aalders, L.; Bell, N.; Wilson, D.; Cameron, C.; Greenfield, R. Pasture renewal on Bay of Plenty and Waikato dairy farms: Impacts on pasture performance post-establishment. N. Z. J. Agric. Res. 2015, 58, 241–258. [Google Scholar] [CrossRef]
  65. Charltgn, J.; Belgrave, B. The range of pasture species in New Zealand and their use in different environments. Proc. N. Z. Grassl. Assoc. 1992, 54, 99–104. [Google Scholar] [CrossRef]
  66. Thomas, S.; Wallace, D.; Beare, M. Pasture Renewal Activity Data and Factors for New Zealand. In A Report Prepared for Ministry for Primary Industries; 2014. Available online: https://www.mpi.govt.nz/dmsdocument/10640/direct (accessed on 21 July 2024).
  67. Smith, K.; Brazendale, R. Pasture renewal in the Waikato and Bay of Plenty regions: An overview of farmer practice, experience and attitudes. NZGA Res. Pract. Ser. 2011, 15, 21–24. [Google Scholar] [CrossRef]
  68. Bewsell, D.; Botha, N.; Brown, M.; Fraser, T.; Wilson, J. Understanding pasture renewal in New Zealand. In Report on Market Research; Pasture Renewal Charitable Trust: Hamilton, OH, USA, 2008. [Google Scholar]
  69. Sanderson, K.; Webster, M. Economic analysis of the value of pasture to the New Zealand economy. In Report to Pasture Renewal Charitable Trust; BERL: Wellington, New Zealand, 2009; Volume 42. [Google Scholar]
  70. Stevens, D.; Gibson, A.; Casey, M. Improving on-farm profitability of sheep and deer systems using pasture renewal in the southern South Island. Proc. N. Z. Grassl. Assoc. 2000, 62, 201–205. [Google Scholar] [CrossRef]
  71. Brazendale, R.; Bryant, J.; Lambert, M.; Holmes, C.; Fraser, T. Pasture persistence: How much is it worth? NZGA: Res. Pract. Ser. 2011, 15, 3–6. [Google Scholar] [CrossRef]
  72. Sanderson, K.; Dustow, K.; Dixon, H. Economic impact assessment of arable production. In A Report for the Arable Food Council; Business and Economic Research Limited: Wellington, New Zealand, 2012. [Google Scholar]
  73. Rijswijk, K.; Brazendale, R. Pasture renewal practices, experiences and attitudes: A comparison over time. J. N. Z. Grassl. 2016, 78, 51–56. [Google Scholar] [CrossRef]
  74. Tozer, K.; Cameron, C.; Thom, E. Weed ingress and pasture persistence in Bay of Plenty dairy farms field observations and farmer perceptions. N. Z. Plant Prot. 2011, 64, 68–74. [Google Scholar] [CrossRef]
  75. Hopkins, A.; Gilbey, J.; Dibb, C.; Bowling, P.; Murray, P. Response of permanent and reseeded grassland to fertilizer nitrogen. 1. Herbage production and herbage quality. Grass Forage Sci. 1990, 45, 43–55. [Google Scholar] [CrossRef]
  76. Chapman, D.; Muir, P.; Faville, M. Persistence of dry matter yield among New Zealand perennial ryegrass (Lolium perenne L.) cultivars: Insights from a long-term data set. J. N. Z. Grassl. 2015, 77, 177–184. [Google Scholar] [CrossRef]
Figure 1. Total hectares (ha) of pasture renewal by region on the North Island, New Zealand, for (a) 2022, (b) 2020, (c) 2019, (d) 2018, (e) 2017, (f) 2016, (g) 2015, (h) 2014, (i) 2013, (j) 2012, (k) 2011, (l) 2010, and (m) 2009. Filled bars depict total land area (ha) direct drilled for pasture renewal, and unfilled bars depict total land (ha) area cultivated for pasture renewal. Data are sourced from agricultural production statistics, Stats NZ, and as such, some data are not available due to confidentiality and/or quality suppression (provisions of the Statistics Act 1975). Pasture renewal questions for agricultural production statistics were introduced in 2009. No data were collected in 2021, as the frequency of the pasture renewal questions was changed from annual to every 5 years. The next census year is 2027.
Agronomy 14 01673 g001aAgronomy 14 01673 g001b
Figure 2. Total hectares (ha) of pasture renewal by region on the South Island, New Zealand, for (a) 2022, (b) 2020, (c) 2019, (d) 2018, (e) 2017, (f) 2016, (g) 2015, (h) 2014, (i) 2013, (j) 2012, (k) 2011, (l) 2010, and (m) 2009. Filled bars depict total land area (ha) direct drilled for pasture renewal, and unfilled bars depict total land (ha) area cultivated for pasture renewal. Data are sourced from agricultural production statistics, Stats NZ, and as such, some data are not available due to confidentiality and/or quality suppression (provisions of the Statistics Act 1975). Pasture renewal questions for agricultural production statistics were introduced in 2009. No data were collected in 2021, as the frequency of the pasture renewal questions was changed from annual to every 5 years. The next census year is 2027.
Agronomy 14 01673 g002aAgronomy 14 01673 g002b
Figure 3. Total hectares (ha) of grassland by region on the North Island, New Zealand, for (a) 2022, (b) 2020, (c) 2019, (d) 2018, (e) 2017, (f) 2016, (g) 2015, (h) 2014, (i) 2013, (j) 2012, (k) 2011, (l) 2010, and (m) 2009. Unfilled bars depict total grassland area (ha), and filled bars depict total tussock and danthonia area (ha) used for grazing (whether oversown or not). Data are sourced from agricultural production statistics, Stats NZ, and as such, some data are not available due to confidentiality and/or quality suppression (provisions of the Statistics Act 1975).
Agronomy 14 01673 g003aAgronomy 14 01673 g003b
Figure 4. Total hectares (ha) of grassland by region on the South Island, New Zealand, for (a) 2022, (b) 2020, (c) 2019, (d) 2018, (e) 2017, (f) 2016, (g) 2015, (h) 2014, (i) 2013, (j) 2012, (k) 2011, (l) 2010, and (m) 2009. Unfilled bars depict total grassland area (ha), and filled bars depict total tussock and danthonia area (ha) used for grazing (whether oversown or not). Data are sourced from agricultural production statistics, Stats NZ, and as such, some data are not available due to confidentiality and/or quality suppression (provisions of the Statistics Act 1975).
Agronomy 14 01673 g004aAgronomy 14 01673 g004b
Disclaimer/Publisher’s Note: The statements, opinions and data contained in all publications are solely those of the individual author(s) and contributor(s) and not of MDPI and/or the editor(s). MDPI and/or the editor(s) disclaim responsibility for any injury to people or property resulting from any ideas, methods, instructions or products referred to in the content.