Abstract
Employing elevated CO2 (eCO2), similar to increasing atmospheric CO2 in a greenhouse, is a common practice used to increase vegetable crop yields. However, the responses of nutrient availability, nutrient uptake and use efficiency in leafy vegetables to eCO2 remain largely unknown. The plant biomass production, nitrogen (N), phosphorus (P) and potassium (K) contents, nutrient uptake, and soil enzymatic activities of three Brassica chinensis varieties of ‘Longpangqing’, ‘Heimeiren’ and ‘Qingjiangbai’ were thus assessed under ambient CO2 (C0, 420/470 ppm, day/night) and eCO2 (C1, C0 + 33.3%C0; C2, C0 + 66.7%C0; and C3, C0 + 100%C0) for 4 months. Biomass production was significantly enhanced in these three tested B. chinensis varieties along with eCO2 gradients, with the highest biomass production under C3. Moreover, the eCO2 significantly increased plant N and K uptake, P and K use efficiency, soil saccharase, urease, and phosphatase activities, but decreased plant P content, soil available N and K, and catalase activity. Under eCO2, ‘Qingjiangbai’ exhibited higher biomass production and P and K uptake, without a decrease in soil available N and P. Consequently, more external fertilizer supplementation (especially N, followed by K) is required to maintain or promote Brassica chinensis yield under eCO2, while these management strategies must be carefully considered for different crop varieties.
1. Introduction
Brassica chinensis (B. chinensis) L. is a species belonging to the Brassicaceae family and is extensively cultivated in greenhouses due to its economic and agricultural significance in China. It is a valuable source of dietary fiber, carotene, vitamins, polyphenols, and minerals. However, in greenhouses with closed ventilation, the concentration of atmospheric CO2 (aCO2) can decrease down to as low as 150 ppm during the day due to plant CO2 uptake, especially for leafy vegetable crops with large leafy areas and vigorous photosynthesis [1]. This can significantly impact crop growth and nutritional quality, potentially failing to meet consumer needs. A meta-analysis of 107 selected articles demonstrated that CO2 enrichment (827 ppm) has the potential to increase the yield of vegetables as a whole by 34% [2]. In northern countries, cucumbers and tomatoes can experience increases of up to 30% when CO2 concentrations in a greenhouse range from 600 to 5000 ppm during autumn, winter and spring [3]. However, excessive CO2 concentrations in greenhouses can lead to leaf damage, slower growth and increased costs. An appropriate increase in CO2 concentration for plant performance has become a demanding scientific and practical solution for improving the quality and yield of vegetables in greenhouses.
Elevated CO2 (eCO2) has been demonstrated to exert a ‘fertilization effect’ on various vegetable crops, including lettuce [4], Brassica napus [5], fennel [6], cucumber [7] and tomato [8], by stimulating photosynthesis, decreasing photorespiration, and generally resulting in an increased carbon (C) fixation and biomass accumulation. The beneficial effect of eCO2 on biomass accumulation affects not only the levels of nitrogen (N), phosphorus (P) and potassium (K) and other nutrients, but also alters the N:P:K ratio in plants and soils [9,10,11]. The alteration in the N:P:K ratio may have a significant impact on agricultural ecological processes, including nutrient cycling, microbial community composition and activities, soil organic matter decomposition [12,13,14], N, P and/or K use efficiency [15], and food quality [2,16,17]. However, the majority of studies have focused on the impact of eCO2 on the quality, physiology and metabolites of vegetable crops that are more nutrient-demanding than grain crops [18,19,20,21], whereas there has been less research on the feedback of eCO2 on plant nutrient uptake and rhizospheric soil properties.
N, P and K are the most important limiting nutrients for plant production, especially under eCO2. Studies on the effects of eCO2 on the uptake and utilization of N, P and K have yielded inconsistent results and have varied with plant species and experimental facilities. In the case of C3 crops, a significant proportion of the research has been carried out in controlled environments, where 550–1200 ppm eCO2 increased N uptake by 64% in the cucumber [13], 134% in the tomato [22], 40.4% in wheat [23], and 35% in the soybean [24]. However, the N content in plant tissue generally decreased under eCO2 conditions [7,8,25]. Such a reduction in N content at the leaf level has the potential to result in a downregulation of photosynthesis, consequently limiting the long-term CO2 fertilization effect [8,23]. In addition, higher plant C inputs to soil under eCO2 cause greater N immobilization, subsequently reducing soil N availability. This contributes to a progressive N limitation of eCO2-induced growth enhancement [15,26].
In comparison to plant N, the effects of elevated CO2 on plant P and K contents are more variable. The contents of P and K were increased in both Oryza sativa and Echinochloa crusgalli under eCO2 (200 ppm higher than aCO2) in a pot experiment in a free-air CO2 enrichment (FACE) system [27], but decreased in wheat [28] and the tomato [8] at 750–900 ppm eCO2 in controlled environment chambers, and no changes occurred at 620 ppm eCO2 in Origanum vulgare in controlled environment chambers [29]. Other studies have reported significant reductions in P with increases in K in Asparagus racemosus [30], or significantly reduced K and unchanged P in Cicer arietinum under 580–800 ppm eCO2 [31]. Moreover, the effects of 700 ppm eCO2 on K uptake in lettuce were species-specific, with increased K acquisition in red-pigmented lettuce but reduced acquisition in green-pigmented lettuce [32]. It thus appears that discrepancies exist when contrasting the results of different experiments and species, and there is considerable uncertainty about the impact of eCO2 on the uptake and utilization of N, P and K.
eCO2 frequently stimulates plant photosynthesis, improves biomass accumulation and thereby increases belowground carbon allocation [33,34]. This increase in plant productivity at the plant–soil interface results in changes to the soil organic carbon (SOC) [26,35], plant’s available nutrients [15,36], and microbial community composition and activity [37]. Soil enzymes are employed as indicators of soil microbial activity and soil fertility, and their activities reflect the specific microbial functions in organic matter decomposition and nutrient mobilization [38]. An exposure to 550 ppm eCO2 in open-top chambers increased the activity of soil enzymes in rice, including β-glucosidase, dehydrogenase activity, phosphatase and urease, which promote C, P or N acquisition [34,39]. In the FACE experiment, an increase in the activities of cellulose-degrading enzymes was also observed under temperate trees at 527 ppm eCO2, which was likely associated with an increased turnover of fine roots [40]. Nevertheless, minimal or no significant effects of 480–570 ppm eCO2 on soil enzymatic activities (α, β-1,4-glucosidase; β-1,4-N-acetylglucosaminidase; β-xylosidase; leucine aminopeptidase; acid phosphatase) were also observed in typical alpine grasslands [35] and P-limited Australian eucalyptus woodlands [41]. In addition, the responses of soil microbes to eCO2 may vary depending on soil types [37,41], plant varieties [26] and climate conditions [13,42]. These uncertainties make it difficult to predict the effects of eCO2 on belowground processes.
This experiment was conducted an in environmentally controlled glass-made chambers with three varieties of B. chinensis exposed to four CO2 concentration gradients. The specific objectives were to quantify the effects of eCO2 on biomass production, plant and soil nutrient content, nutrient uptake and use efficiency, as well as soil enzymatic activity, and to evaluate the correlation between biomass production, plant and soil nutrients, and soil enzymatic activity. The tested hypotheses were the following: (1) eCO2 will enhance biomass accumulation in B. chinensis, which will, in turn, influence the soil’s biochemical properties, such as its nutrients and enzymatic activity, and (2) different varieties of B. chinensis will exhibit differential responses with regard to plant growth and nutrient uptake, thereby modifying soil biochemical processes and plant performance under eCO2.
2. Materials and Methods
2.1. Experiment Design
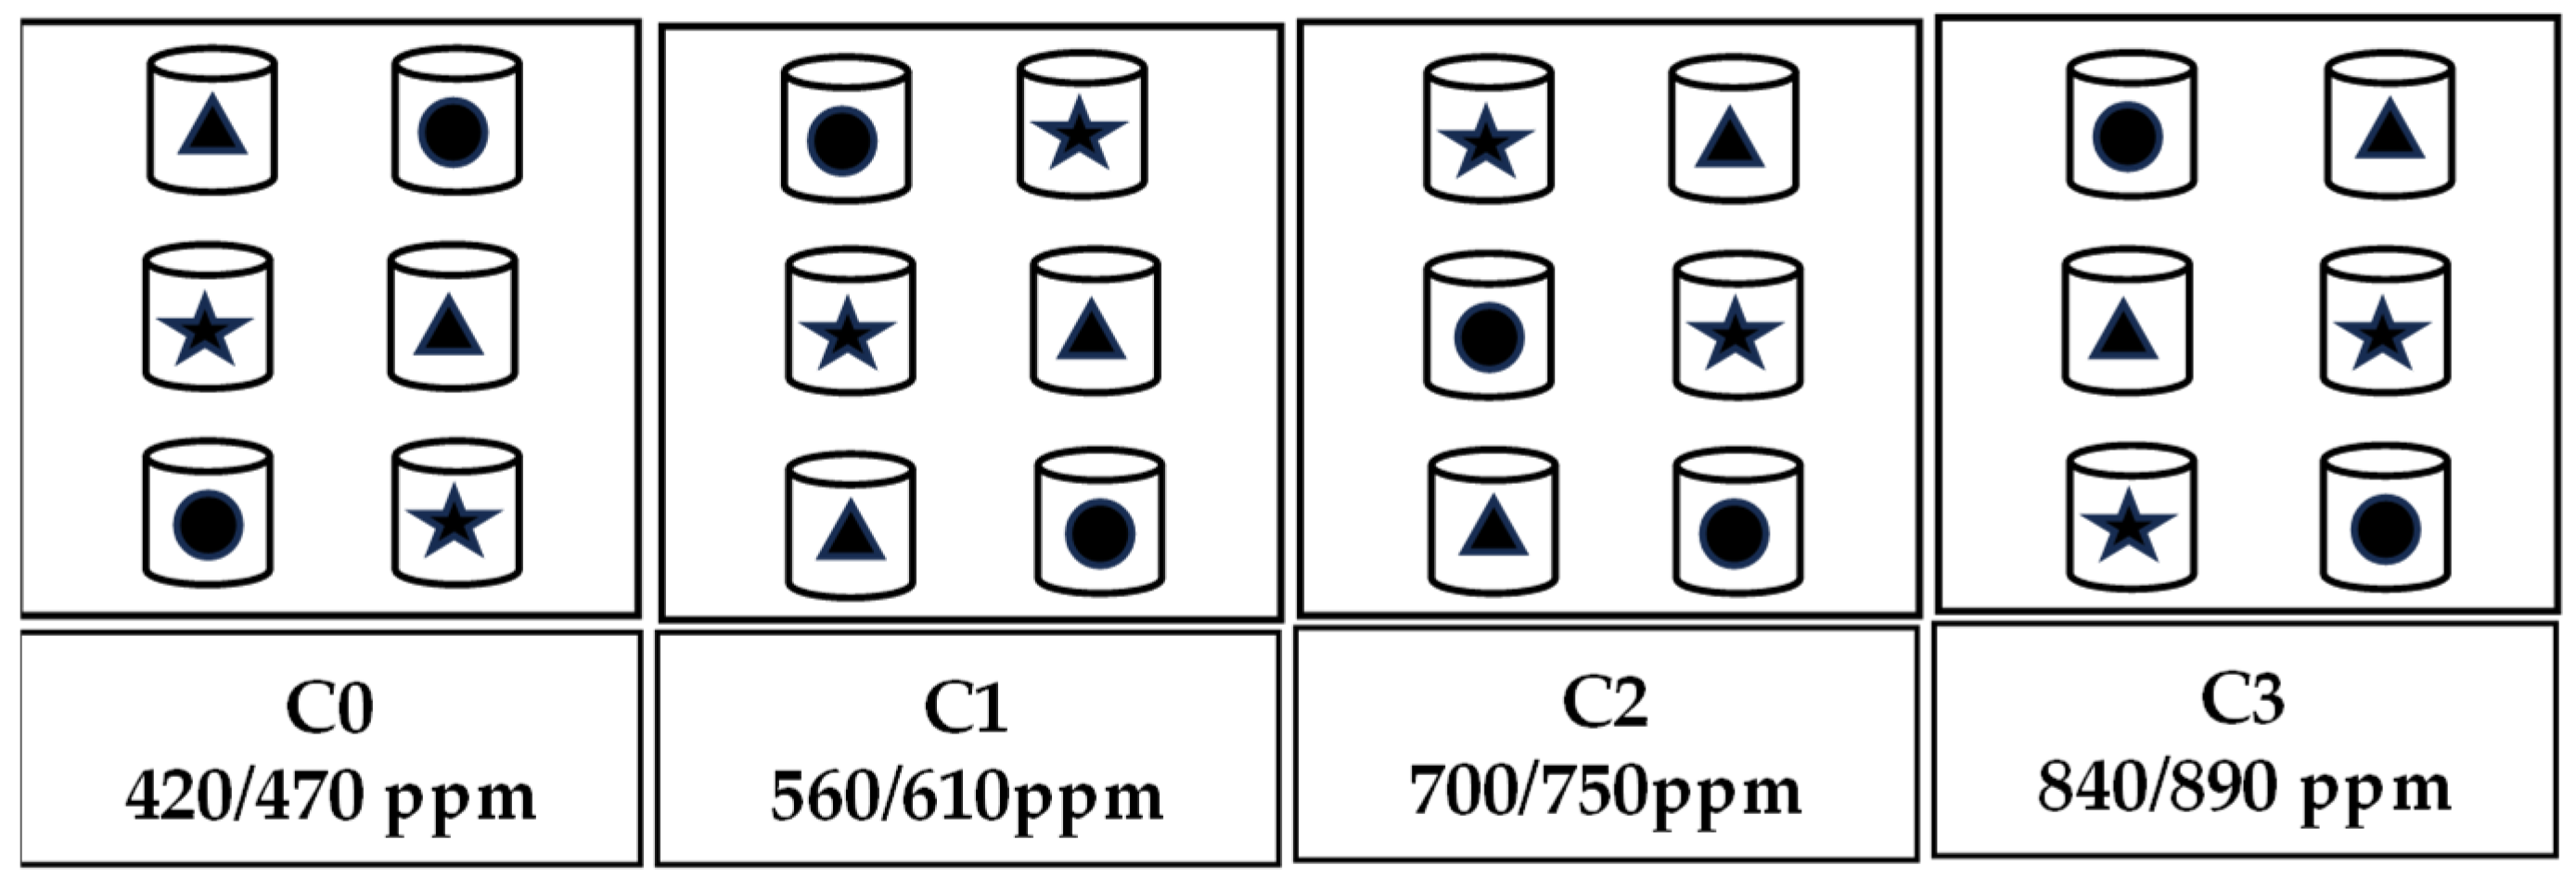
The experiment was conducted from October 2021 to February 2022 in an automatically controlled environment facility simulating the natural environment in the field. The facility is located in the National Monitoring Base for Purple Soil Fertility and Fertilizer Efficiency at Southwest University (29°48′ N, 106°24′ E, 266.3 m above sea level) Beibei District, Chongqing city, China. It consisted of 12 environmentally controlled glass growth chambers (1.5 m length, 1.0 m width and 2.5 m height) and a control system (Shengsen Corp., Qingdao, China). Further information about the facility can be found in previous studies [23,43]. The experiment followed a randomized split-plot design, with four levels of CO2 concentration as the main factors and three plant varieties (Brassica chinensis L. ‘Longpangqing’, ‘Heimeiren’ and ‘Qingjiangbai’) as the subfactors. The four CO2 concentration treatments were the following (±30 ppm): C0 (aCO2, 420 ppm), C1 (560 ppm), C2 (700 ppm) and C3 (840 ppm). These corresponded to an increase of approximately 33.33%, 66.67% and 100% of the on-site ambient CO2 concentration at the beginning of the experiment. During the night, the concentrations of CO2 were maintained at levels 50 ppm higher than those during the day. Each CO2 treatment occupied three chambers, and the twelve chambers were arranged randomly within three blocks (Figure 1). Apart from the CO2 concentration, the chambers had similar growth conditions such as the fertilizer, light, air humidity and temperature used. The temperature and humidity inside and outside the growth chambers were kept consistent with each other by the auto-controlling facility mentioned above [23,43]. The photosynthetic active radiation (PAR) was supplied by natural light, though tempered glass which had 90% light transmission.
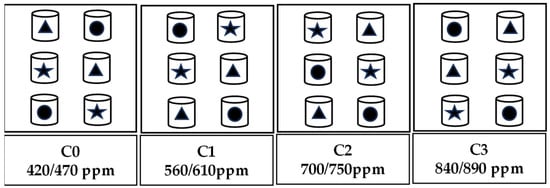
Figure 1.
A schematic diagram showing the experimental layout. There were four levels of CO2 concentration and three plant varieties of B. chinensis used for the experiment. Two pots of each variety were placed in each chamber, resulting in six pots in each chamber. Triangles represent Brassica chinensis L. ‘Longpangqing’, stars represent ‘Heimeiren’ and circles represent ‘Qingjiangbai’.
2.2. Experimental Materials
Seeds of three B. chinensis varieties were obtained from the Institute of Vegetables and Flowers, Chongqing Academy of Agricultural Sciences, Jiulongpo District, Chongqing city, China, which are the main planting varieties in the southwest of China. Ten seeds were sown directly into a plastic pot (21 cm diameter and 17 cm height) filled with 3.4 kg of soil.
The soil was collected from the cultivated ground layer (0–20 cm) of the National Purple Soil Fertility and Fertilizer Effect Monitoring Station of Southwest University. This soil was classified as Eutric Regosol according to the FAO Soil Classification System. It was air-dried and sieved by passing it through a 2 mm mesh. The initial soil material characteristics were the following: pH of 6.95, soil organic carbon (SOC) of 7.37 g kg−1, available nitrogen (AN) of 9.51 mg kg−1, available phosphorus (AP) of 19.20 mg kg−1 and available potassium (AK) of 12.5 mg kg−1.
Two pots per variety were placed in each chamber, resulting in six replicated pots for each CO2 treatment (Figure 1). Four weeks after emergence, only two healthy seedlings were retained per pot. Total amounts of 150 kg ha−1 N, 75 kg ha−1 P and 100 kg ha−1 K were applied to meet the nutrient requirements for plant growth. The chemical fertilizer sources were commercial urea (46% N), single superphosphate (12% P2O5) and potassium chloride (52% K), respectively. Chemical fertilizer was applied in splits: 40% as basal, 20% at 60 days, 20% at 80 days after planting (DAS) and the remaining 20% at 100 DAS. Soil moisture was maintained at a 70% field water-holding capacity. To minimize differences in growth conditions, the pots in the chambers were relocated weekly.
2.3. Sampling Harvest
After 122 days of CO2 exposure, plant and soil samples were collected. The plant tissues were separated into shoots and roots, washed with distilled water, and dried at 105 °C for 30 min and then at 75 °C for more than 48 h until a consistent dry weight was achieved. This was conducted to determine the biomass production and N, P and K contents. The soil samples were homogenized and sieved (<2 mm) to remove fine roots and litter fractions. The samples were then further divided into two parts. The first part was immediately transferred to the laboratory and stored at −20 °C for enzymatic activity determination. The second part was dried at room temperature until the soil reached a constant weight for analysis of the soil’s physicochemical properties.
2.4. Determination of N, P and K in Plants and Soils
The oven-dried shoot and root samples were ground into fine powder and then digested with 98% sulfuric acid and 30% hydrogen peroxide. N content in the plants was determined using the micro-Kjeldahl method, P content using the vanadium molybdate yellow colorimetric method, and K content by flame photometry [44]. Nutrient uptake was calculated by the content and biomass production. The nutrient use efficiency was calculated by the biomass production and nutrient uptake using the following equation [45]:
Nutrient use efficiency (g plant−1) = (biomass, g plant−1)2∕(nutrient uptake, mg plant−1).
SOC was measured by the potassium dichromate–ulfuric acid oxidation method. Soil available nitrogen (AN) was measured by the microdiffusion technique after alkaline hydrolysis. Soil available phosphorus (AP) was extracted with 0.5 N NaHCO3 and then measured by the Mo–Sb anti–spectrophotometric method. Soil available potassium (AK) was extracted with 1.0 N ammonium acetate and then determined by flame photometry [44].
2.5. Determination of Soil Enzymatic Activity
The soil enzymatic activity was analyzed using modified methods as described by Guan et al. [46]. Soil sucrase activity was determined by incubating 5 g of fresh soil with 15 mL of 8% sucrose solution (w/v), 5 mL of phosphate buffer (pH 5.5) and 0.1 mL of toluene for 24 h at 37 °C. Subsequently, 1 mL of filtrate was combined with 3 mL of 3,5-dinitrosalicylic acid and incubated in boiling water for 5 min. Following this, the reaction solution was rapidly cooled and filled to 50 mL with distilled water. The absorbance was then measured spectrophotometrically at a wavelength of 508 nm. Soil urease activity was determined by incubating 5 g of fresh soil with 1 mL of toluene, 10 mL of 10% urea solution (w/v) and 20 mL of citrate buffer (pH 6.7) for 24 h at 37 °C. After incubation, 2 mL of the filtrate was mixed with 4 mL of sodium phenol solution and 3 mL of 0.9% (v/v) sodium hypochlorite solution in a 50 mL volumetric flask. After 20 min, the reaction solution was filled to 50 mL with distilled water and measured spectrophotometrically at 578 nm. To determine neutral phosphatase activity, 5 g of fresh soil was incubated with 1 mL of toluene and 5 mL of disodium phenyl phosphate solution and 5 mL of citrate buffer (pH 7.0) for 24 h at 37 °C. Subsequently, 1 mL filtrate was combined with 5 mL of borate buffer (pH 9.0), 3 mL of 2.5% potassium ferrocyanide (w/v) and 3 mL of 0.5% 4-aminoantipyrine (w/v) in a 50 mL volumetric flask. The reaction solution was then filled to 50 mL with distilled water and spectrophotometrically measured at 570 nm. The soil catalase activity was measured by shaking 5 g of fresh soil with 5 mL of 0.3% H2O2 in 40 mL of deionized water for 30 min. Then, 5 mL of 3 N H2SO4 was added, and 25 mL of the filtrate was titrated with 0.1 N KMnO4 until it turned pink.
2.6. Statistical Analysis
The statistical analysis of the data was conducted using the IBM SPSS Statistics 27.0 (StatSoft Inc., Tulsa, OK, USA). The results are presented as means ± standard error (SE, n = 3 as data were arranged for the 2 plots in one chamber). A two-way analysis of variance (ANOVA) was used to analyze the effects of CO2 and variety on the variables. Significant differences among treatments were compared using Duncan’s Multiple Range Test at p < 0.05. Pearson’s correlation coefficients were calculated to assess the relationships between biomass production, plant nutrition, soil nutrients and soil enzymatic activity. Graphs were plotted using OriginPro2022 software (OriginLab Corp., Northampton, MA, USA).
3. Results
3.1. Plant Biomass Production
Shoot, root and total biomass production of the three varieties of B. chinensis were generally significantly higher under eCO2 (C1, C2, C3) than under aCO2 (C0, Table 1). Compared to C0 shoot or root biomass production under C1, C2 and C3 was increased by 22.2%, 20.6% and 32.4% or 24.8%, 35.8% and 65.3% in ‘Longpangqing’, by 21.1%, 18.9% and 32.4% or 37.9%, 39.0% and 75.9% in ‘Heimeiren’, and by 25.4%, 29.1% and 50.4% or 34.1%, 78.3% and 103.1% in ‘Qingjiangbai’, respectively. Total plant biomass production also increased significantly when CO2 concentrations tripled, with an increase from 2.89 to 3.91 g plant−1 (35.4%) in ‘Longpangqing’, from 3.03 to 3.99 g plant−1 (32.0%) in ‘Heimeiren’, and from 3.20 to 4.94 g plant−1 (54.4%) in ‘Qingjiangbai’. Significantly higher shoot and total biomass production occurred between B. chinensis varieties under eCO2 patterned as ‘Qingjiangbai’ > ‘Heimeiren’ ≈ ‘Longpangqing’, whereas they were similar under aCO2. In contrast, a significant CO2 × variety interaction was observed only in root biomass production (p < 0.05, Table 1), but not in shoot biomass or total biomass production (p > 0.05, Table 1).

Table 1.
Shoot, root and total biomass production were measured for three 4-month-old varieties of Brassica chinensis L. under four CO2 concentrations.
3.2. Plant N, P and K Content
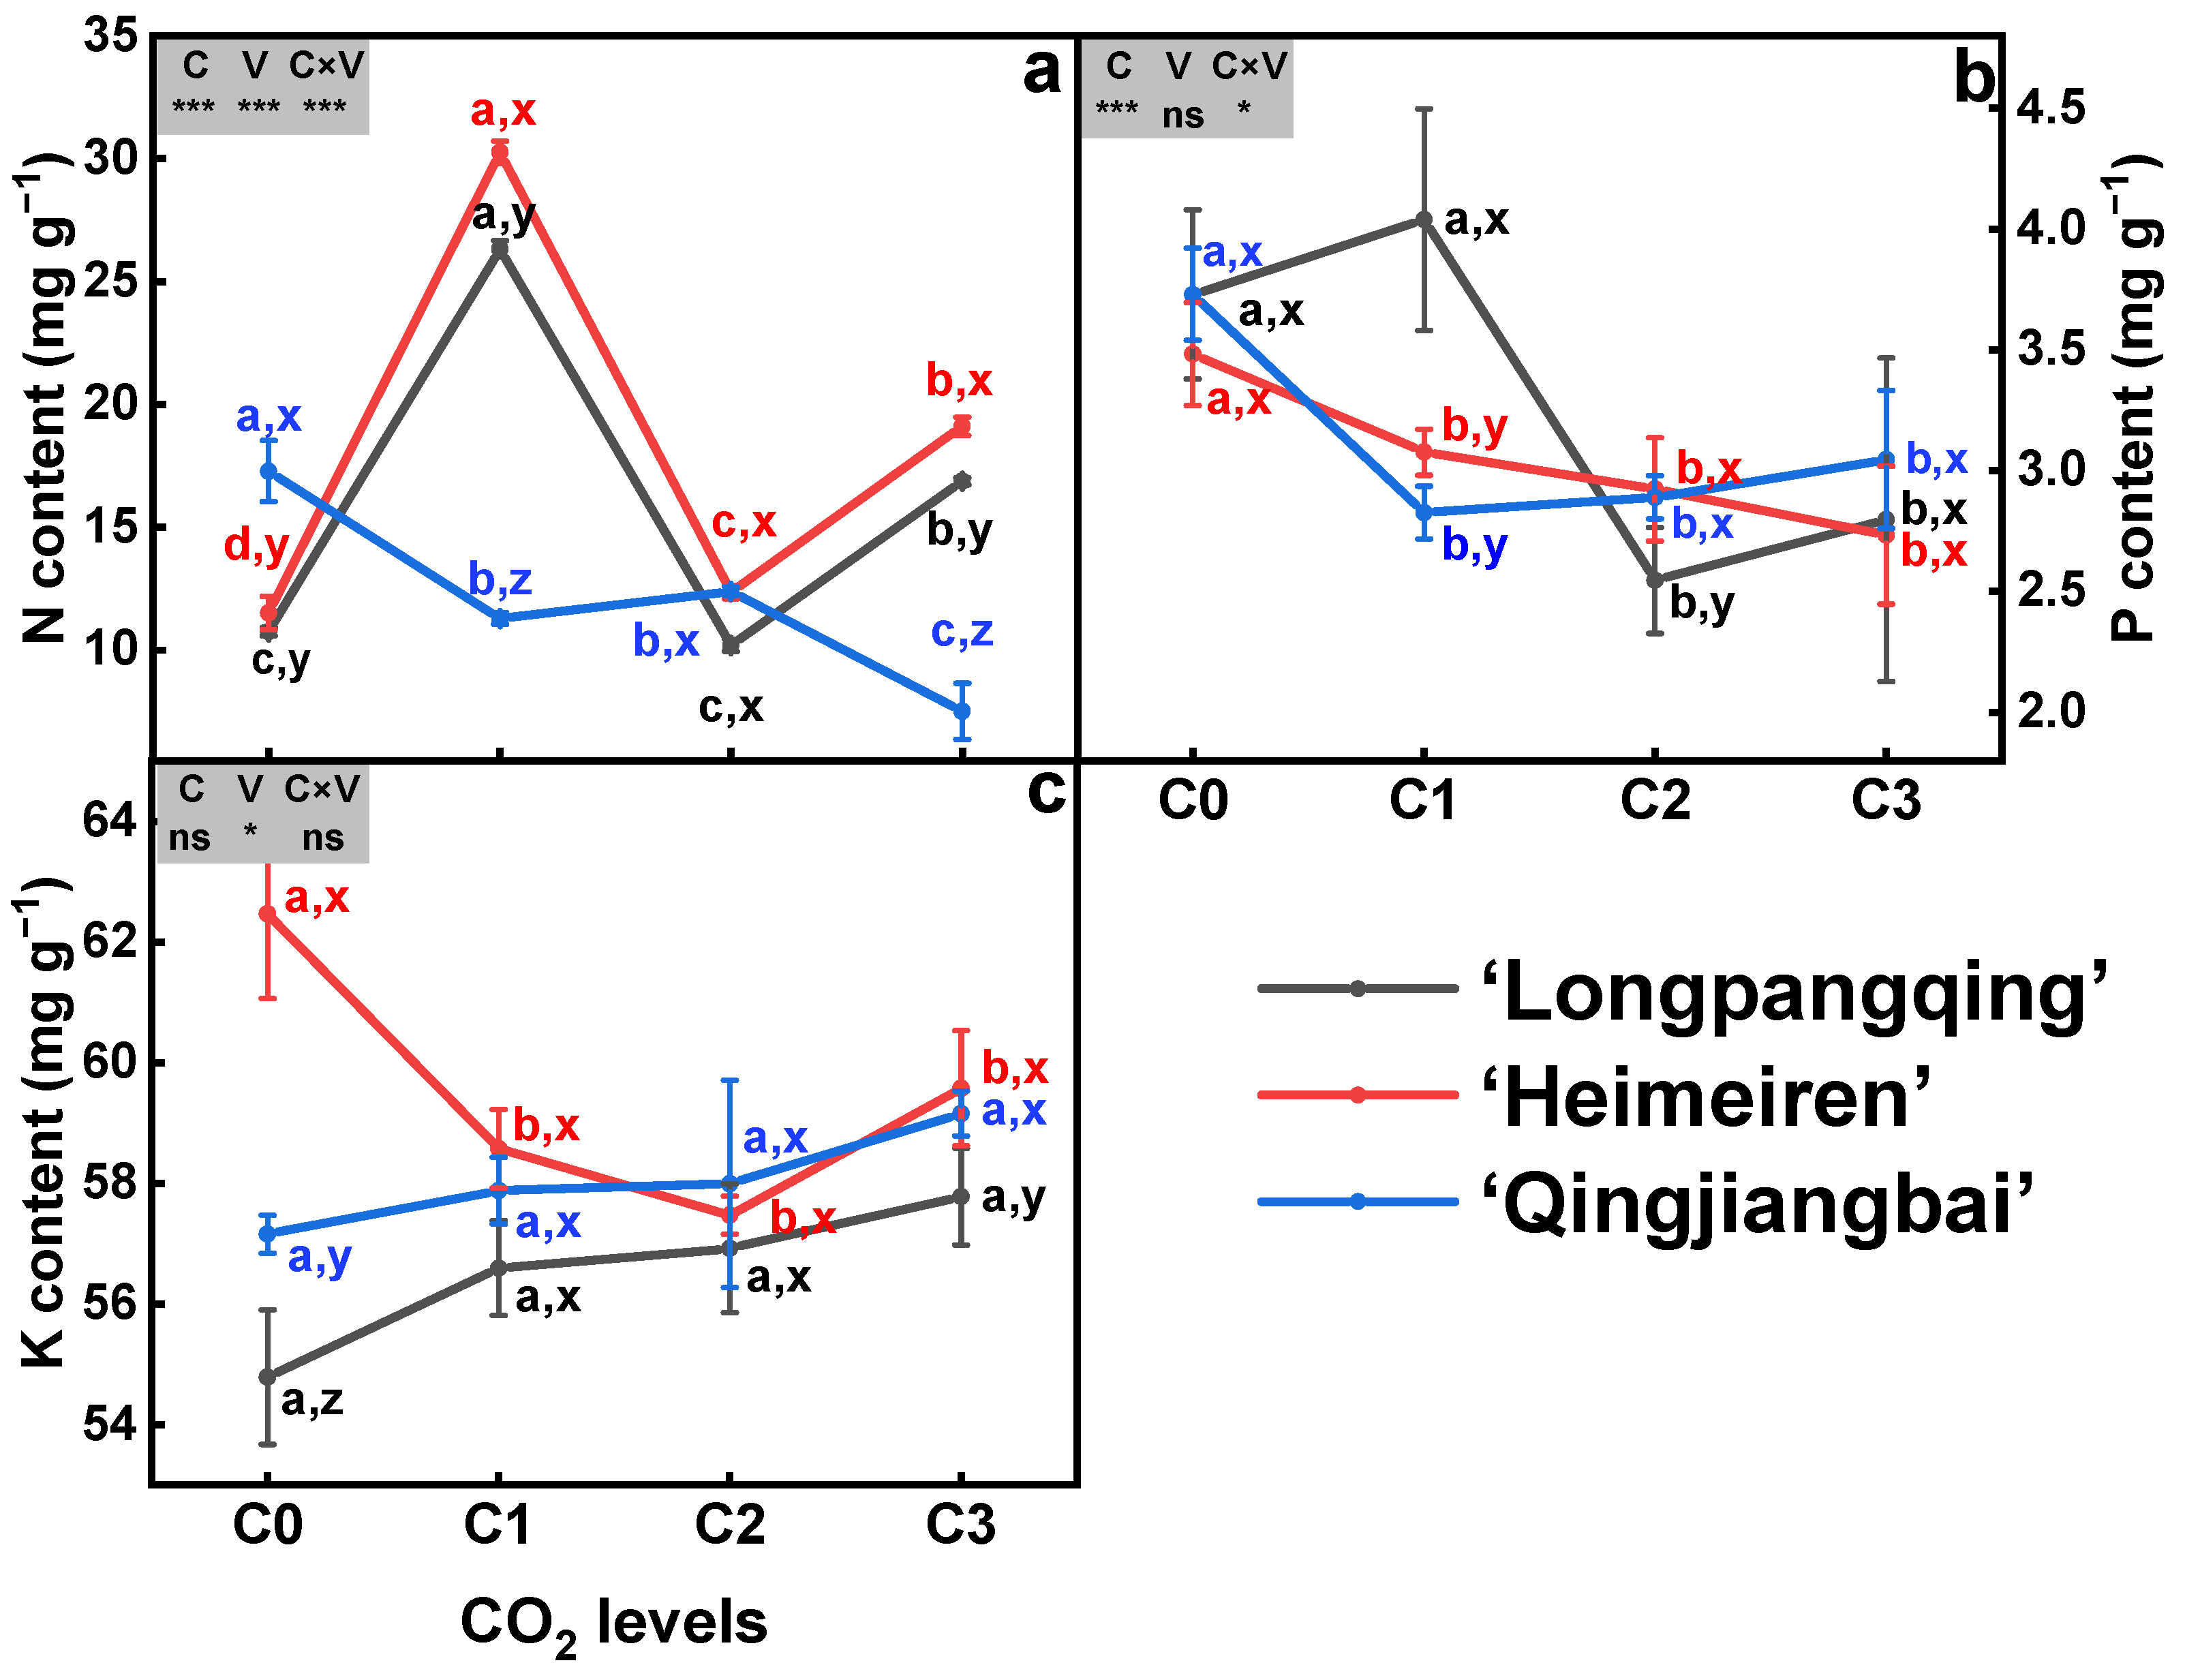
The N content in the three varieties of B. chinensis was significantly affected by eCO2 (p < 0.05, Figure 2a). In ‘Longpangqing’, the N content was, respectively, increased by 145.0% and 56.9% under C1 and C3 compared to C0, while C2 showed no significant difference. Compared to C0, the N content was, respectively, increased by 162.9%, 7.4% and 66.0% under C1, C2 and C3 treatments in ‘Heimeiren’. In contrast, the N content of ‘Qingjiangbai’ was significantly decreased by 34.7%, 28.3% and 56.6% under C1, C2 and C3 treatments compared to C0, respectively. Significant differences were also observed among the three varieties with the same CO2 content. Additionally, the N content was influenced by the interaction between CO2 concentration and variety (Figure 2a).
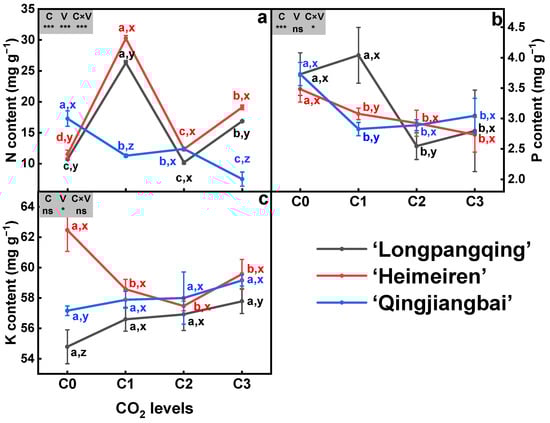
Figure 2.
Contents of nitrogen (N, (a)), phosphorus (P, (b)) and potassium (K, (c)) in plants of three varieties of Brassica chinensis L. under four different CO2 conditions. Different letters indicate significant differences between the CO2 treatments within the same variety (a, b, c, d) and between different varieties within the same CO2 treatment (x, y, z) at a significance level of p < 0.05, as revealed by Duncan’s test. Statistical comparisons (two-way ANOVA) between CO2 treatments and varieties, as well as their interaction (CO2 × variety), are presented for each variable. ANOVA: ns, not significant; *, ** and *** significant at p ≤ 0.05, p ≤ 0.01 and p ≤ 0.001, respectively.
The eCO2 treatment resulted in a significant decrease in P contents for both ‘Heimeiren’ and ‘Qingjiangbai’ varieties. In the case of ‘Heimeiren’, the P content was decreased by 11.7%, 18.2% and 25.7% under C1, C2 and C3 treatments, respectively, compared to C0. Similarly, the P content was, respectively, reduced by 24.2%, 29.7% and 23.7% in ‘Qingjiangbai’. However, in ‘Longpangqing’, the P content was significantly reduced by 29.3% and 36.7% under C2 and C3 treatments, respectively, but there was no significant change under C1 treatment. Although no significant differences were found among the three varieties, the P content was influenced by the interaction between CO2 content and variety (Figure 2b).
In comparison to C0, the K content was decreased by 6.2%, 8.0% and 4.6%, respectively, under C1, C2 and C3 treatments in ‘Heimeiren’, while no significant changes were observed in both ‘Longpangqing’ and ‘Qingjiangbai’. Moreover, ‘Heimeiren’ exhibited higher K content than ‘Qingjiangbai’ and ‘Longpangqing’ under both C0 and C3. Neither CO2 nor the CO2 × variety had a significant effect on the K content (Figure 2c).
3.3. Plant N, P and K Uptake
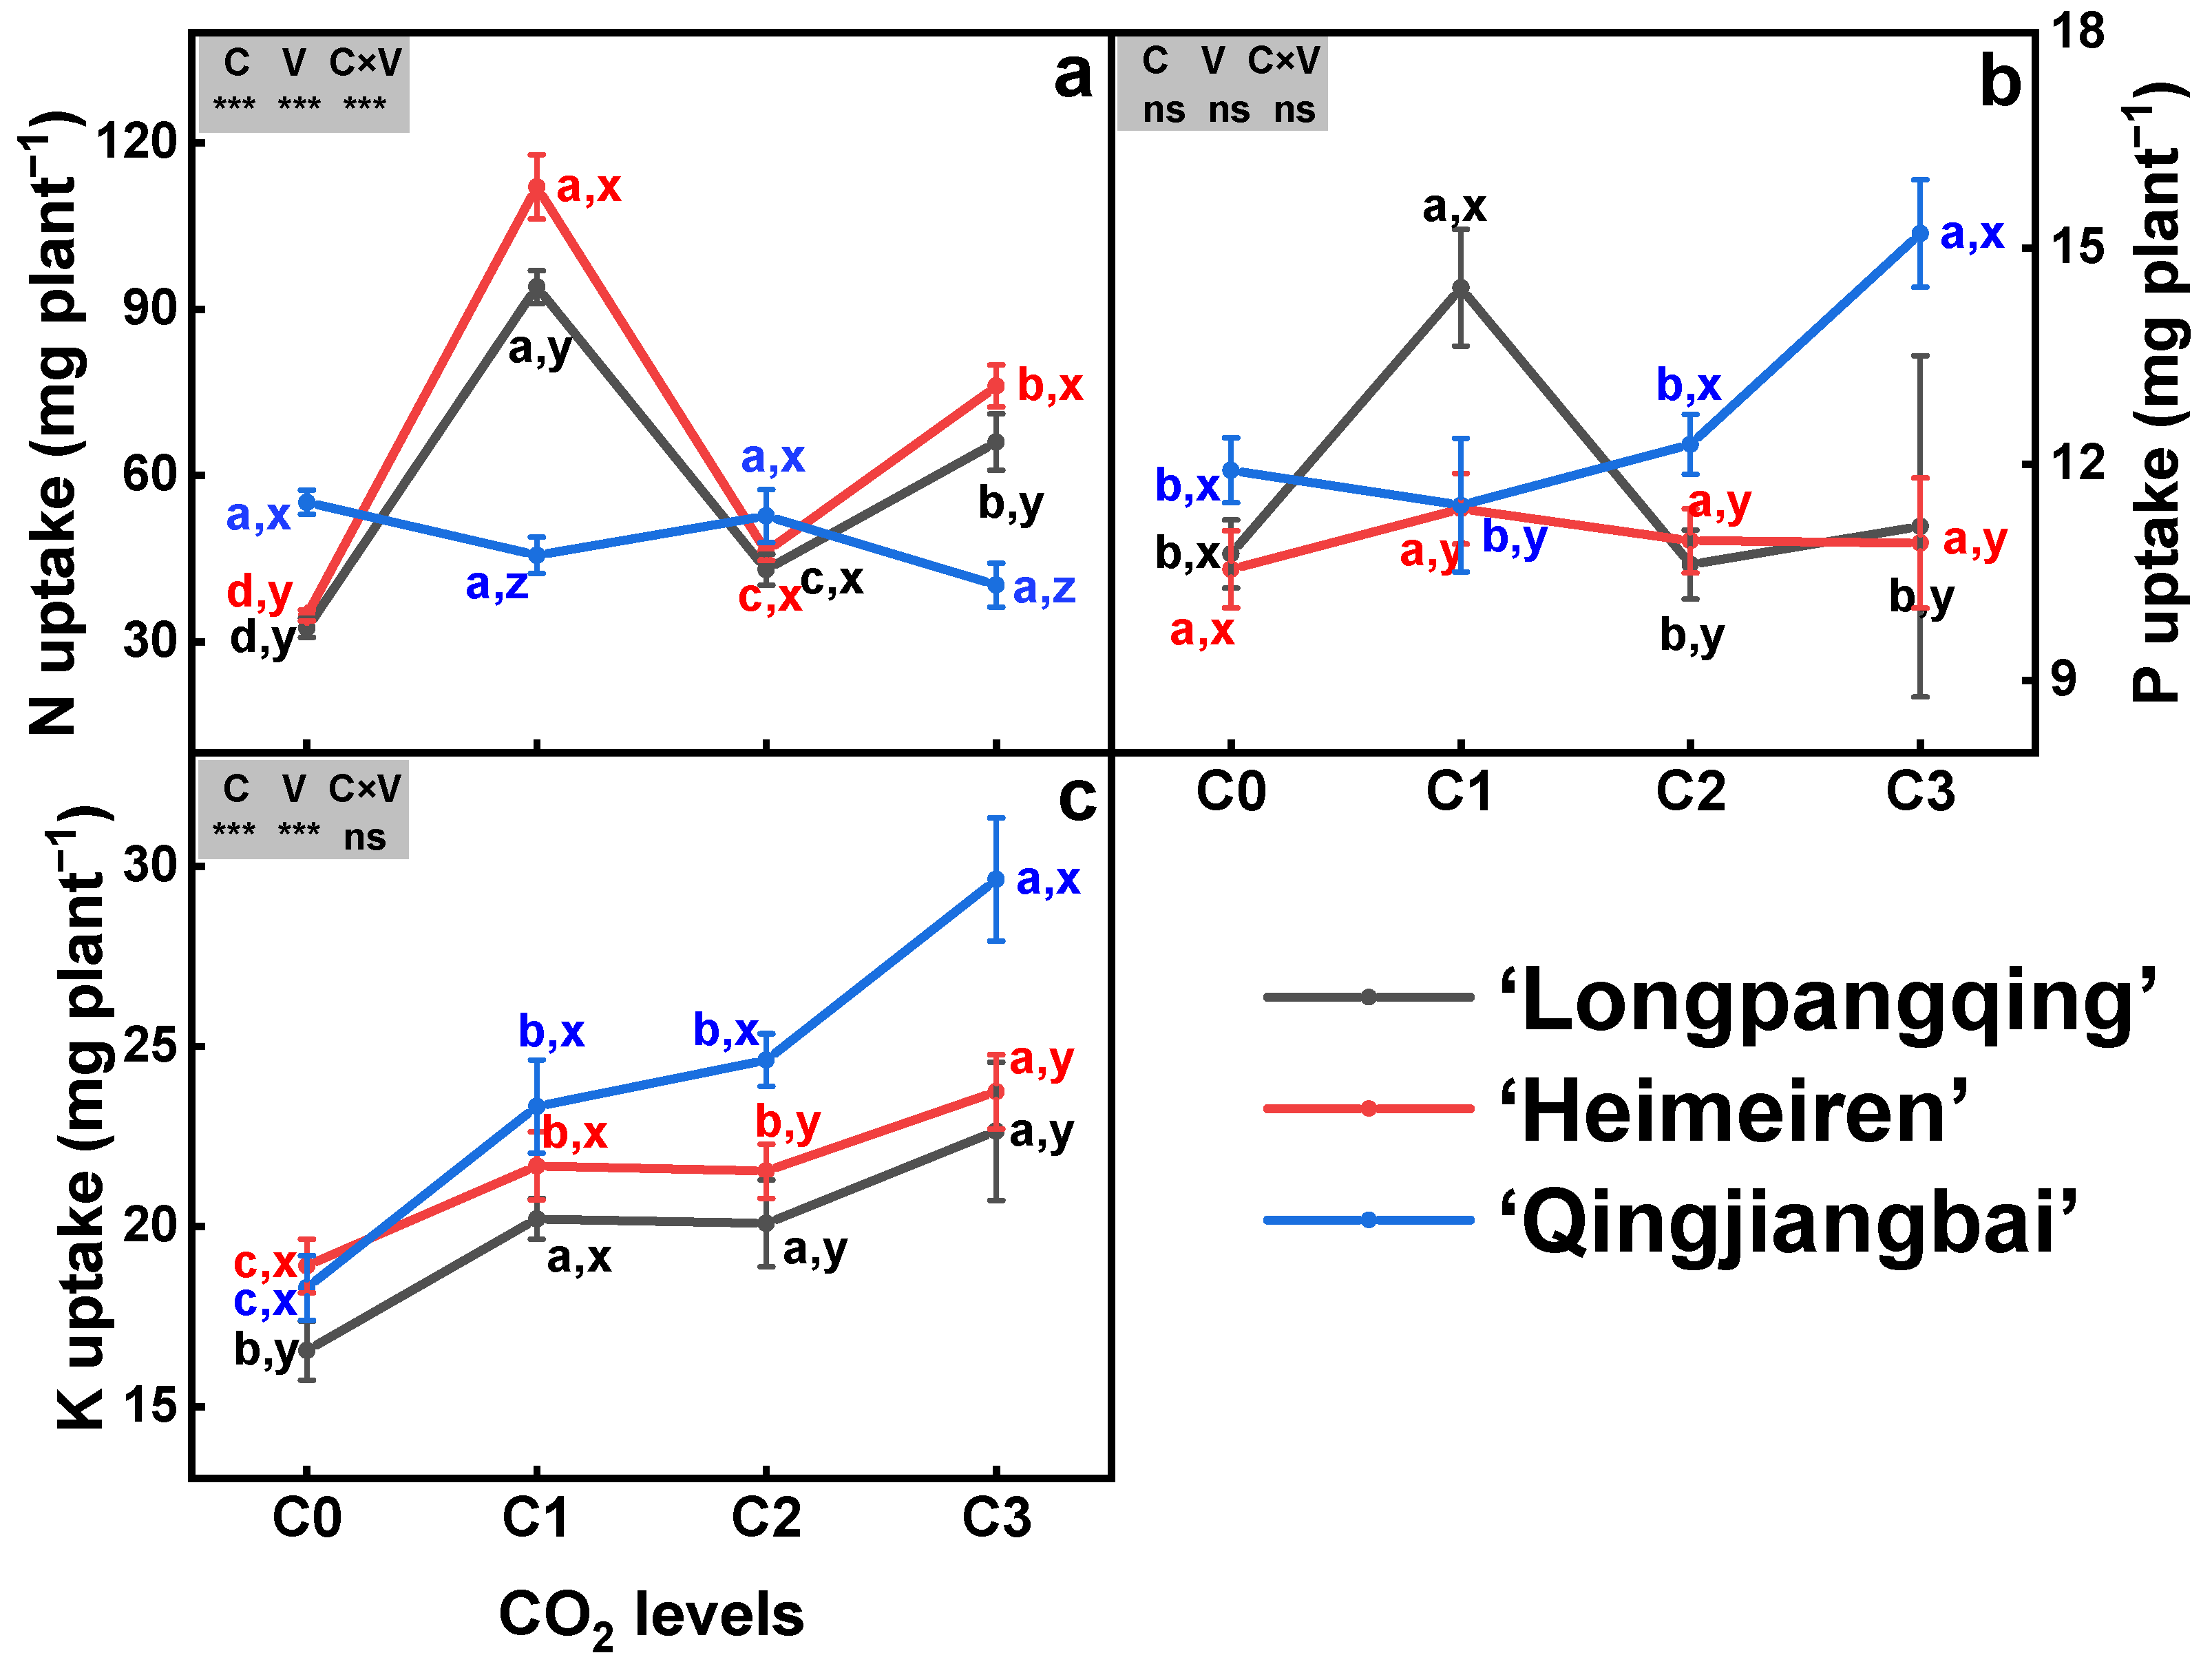
The eCO2 had a significant impact on the N uptake in ‘Longpangqing’ and ‘Heimeiren’, but not in ‘Qingjiangbai’ (Figure 3a). Compared to C0, N uptake under C1, C2 and C3 treatments was enhanced by 189%, 32% and 103% in ‘Longpangqing’, and also by 222%, 33% and 119% in ‘Heimeiren’, respectively (Figure 3a). The increased P uptake was only observed in ‘Longpangqing’ under C1 treatment, and in ‘Qingjiangbai’ under C3 treatment. However, P uptake in ‘Heimeiren’ was not affected by CO2 enrichment (Figure 3b). The three varieties of B. chinensis showed significant increases in K uptake under eCO2 compared to their respective aCO2 counterparts. Generally, significantly higher differences among CO2 treatments are ranked as the following: C3 > C2 ≈ C1 > C0 in ‘Longpangqing’ and ‘Heimeiren’, and C3 ≈ C2 ≈ C1 > C0 in ‘Qingjiangbai’ (Figure 3c). Meanwhile, the uptake of N and K was significantly affected by both CO2 and variety, but there were no additive effects observed between CO2 and variety for K uptake (Figure 3).
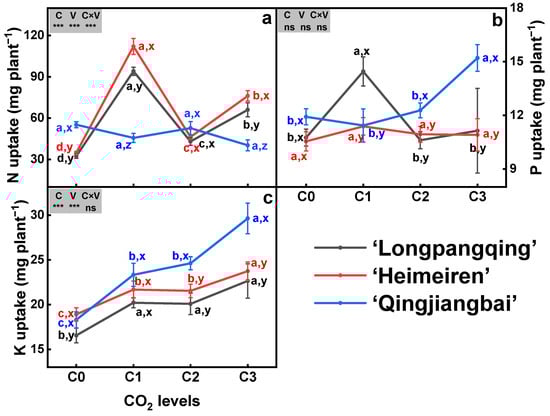
Figure 3.
The uptake of nitrogen (N, (a)), phosphorus (P, (b)) and potassium (K, (c)) in plants of three varieties of Brassica chinensis L. under four different CO2 conditions. Different letters indicate significant differences between the CO2 treatments within the same variety (a, b, c, d) and between different varieties within the same CO2 treatment (x, y, z) at a significance level of p < 0.05, as revealed by Duncan’s test. Statistical comparisons (two-way ANOVA) between CO2 treatments and varieties, as well as their interaction (CO2 × variety), are presented for each variable. ANOVA: ns, not significant; *, ** and *** significant at p ≤ 0.05, p ≤ 0.01 and p ≤ 0.001, respectively.
3.4. Plant N, P and K Use Efficiency
N use efficiency exhibited different trends in the four CO2 treatments, and it was highest in the C2 treatment and lowest in the C1 treatment for both ‘Longpangqing’ and ‘Heimeiren’. For ‘Qingjiangbai’, N use efficiency showed an increase with increasing CO2 concentration and reached its maximum in the C3 treatment (Table 2). Additionally, there were no significant differences in the P and K use efficiencies of the three varieties under the C0 treatment. However, differences were observed among the varieties with the increase in CO2 concentration (Table 2). This study also found that eCO2 had a significant impact on the P and K use efficiencies of the three varieties (‘Longpangqing’, ‘Heimeiren’ and ‘Qingjiangbai’). Specifically, eCO2 increased P use efficiency by 13–83%, 39–69% and 66–93%, and K use efficiency by 17–28%, 31–39% and 25–52%, respectively, compared to the C0 treatment (Table 2). While a significant interaction of CO2 × variety was observed for N use efficiency (p < 0.001, Table 2), no such interaction was observed for P and K use efficiency (p > 0.05, Table 2).
Table 2.
The nitrogen, phosphorus and potassium use efficiencies in three varieties of Brassica chinensis L. under four levels of CO2 concentration.
3.5. Soil Available Nutrients
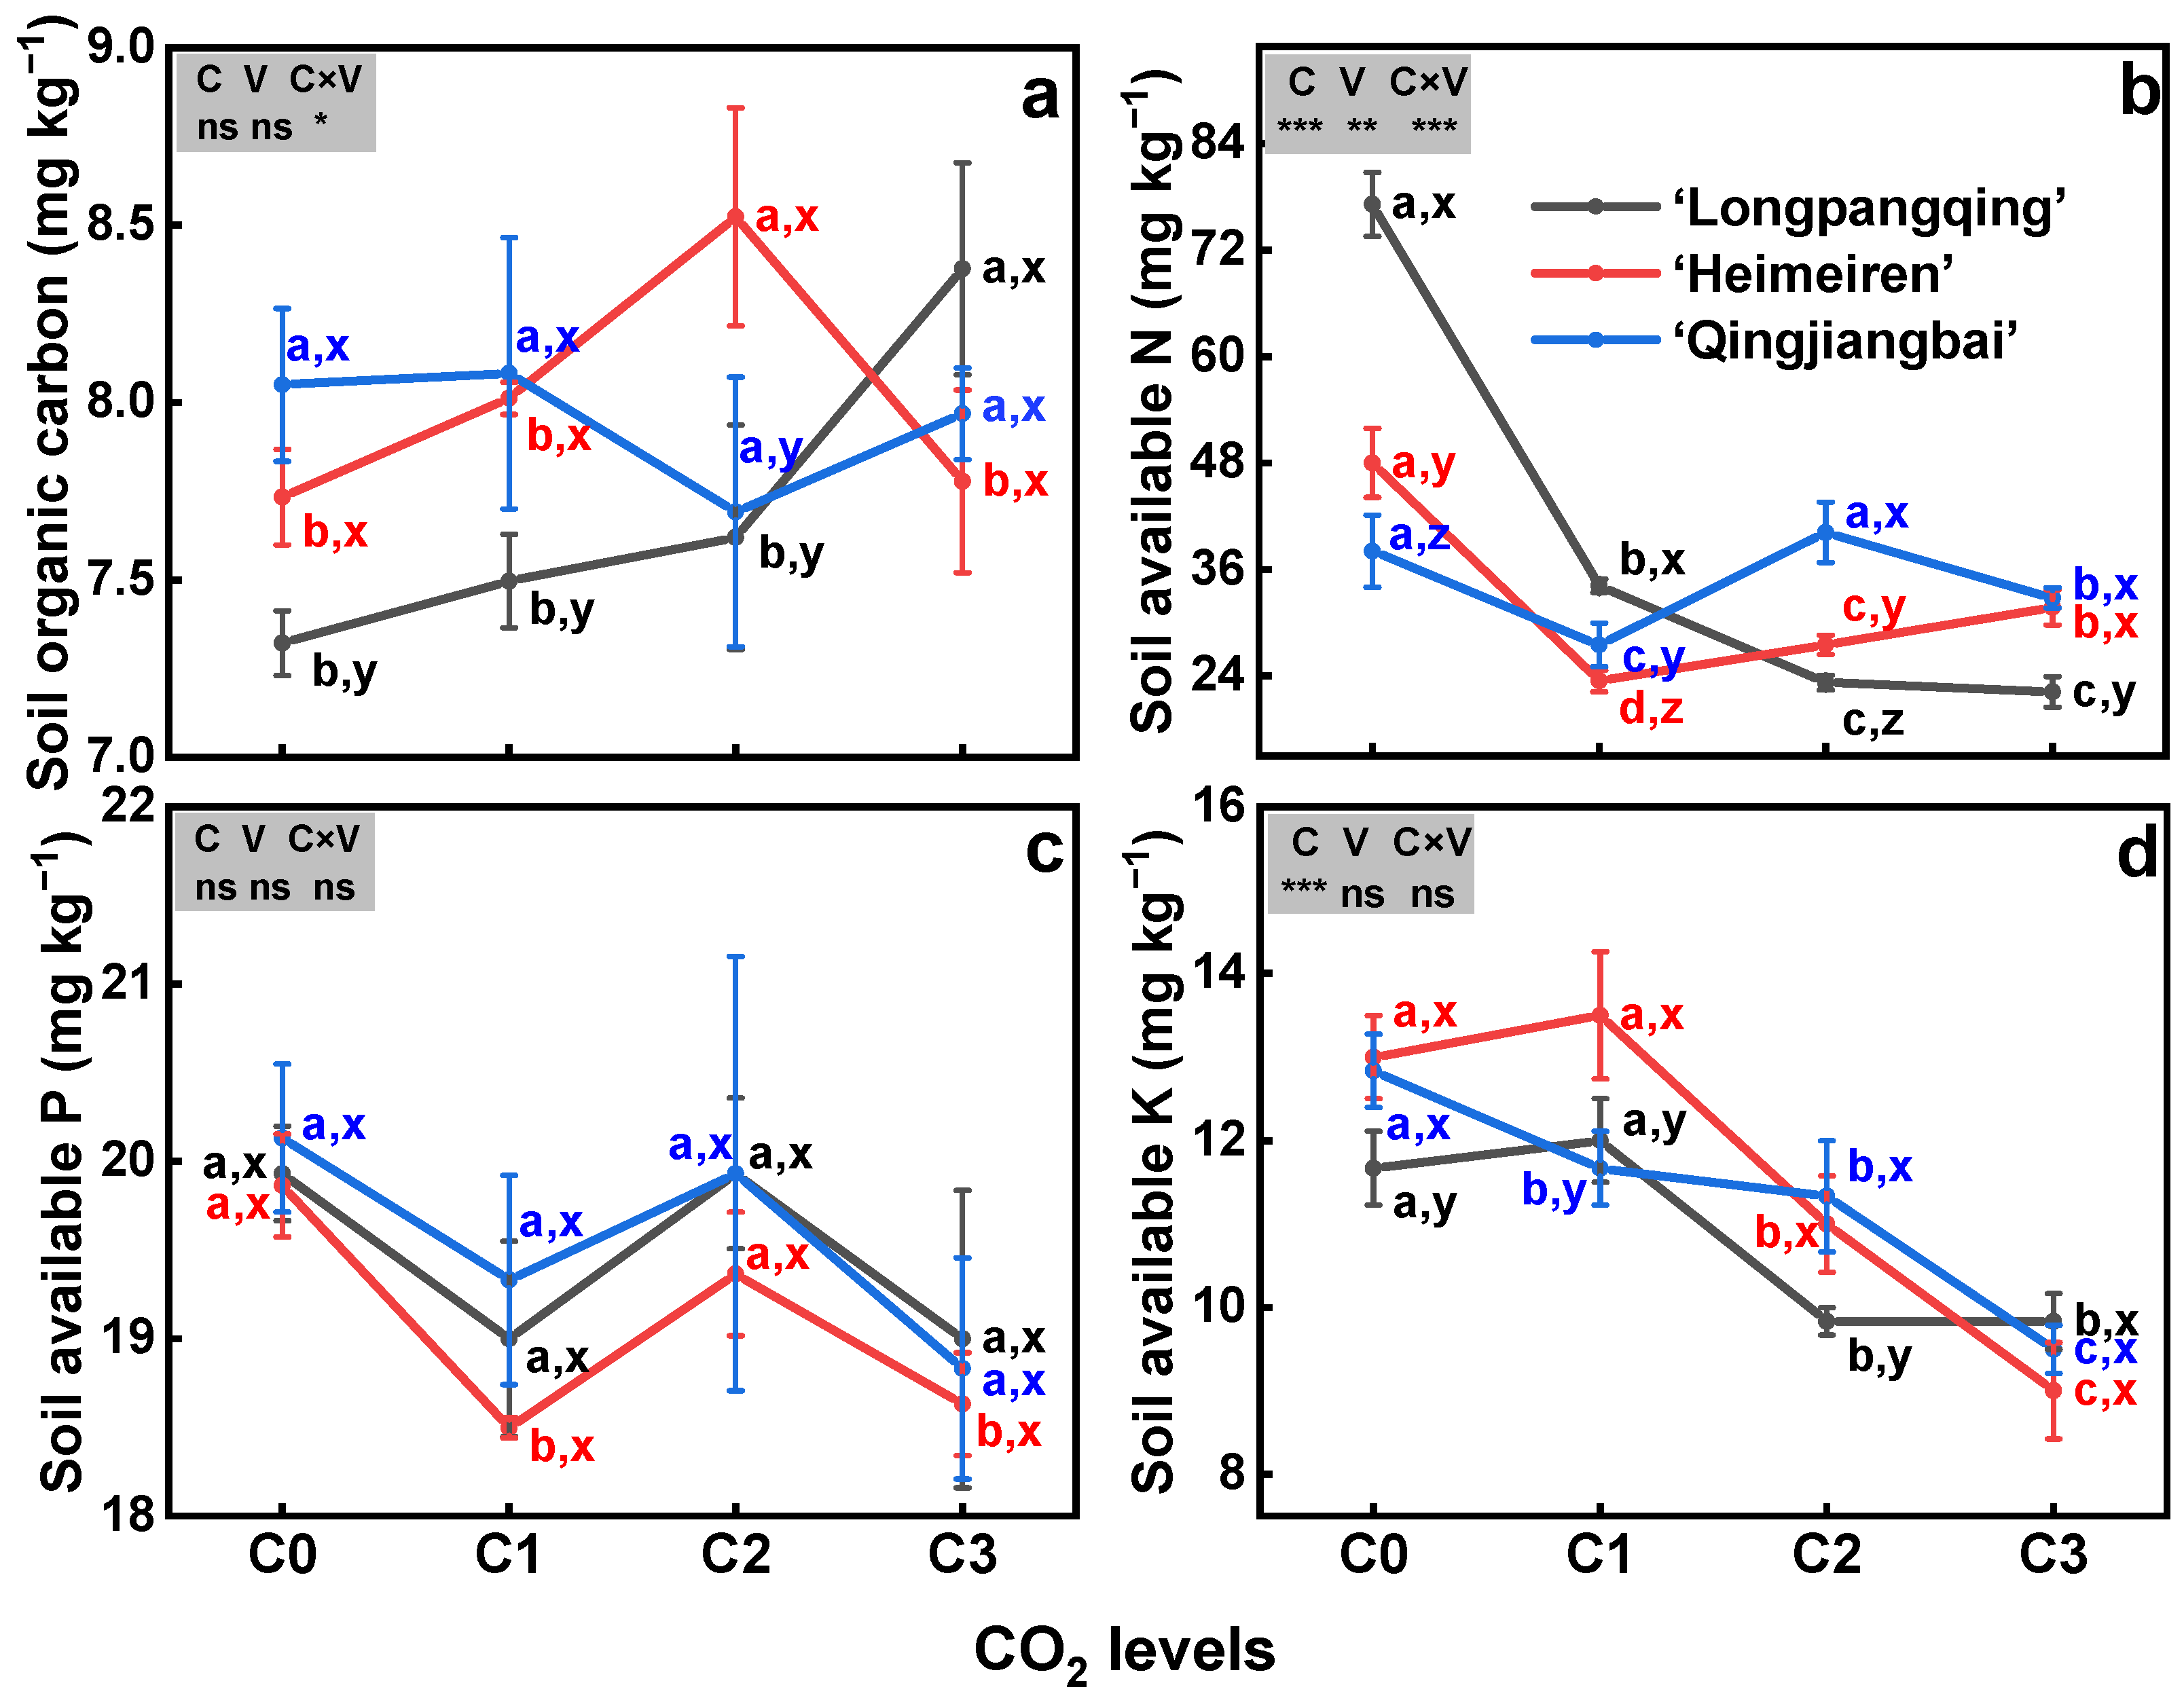
The eCO2 significantly decreased soil AN (p < 0.01, Figure 4b) and AK for all three varieties (p < 0.01, Figure 4d), but had no effect on SOC (p = 0.41, Figure 4a) and soil AP (p = 0.06, Figure 4c). Specifically, compared to C0, soil AN was reduced by 56%, 70% and 71% in ‘Longpangqing’, 51%, 43% and 34% in ‘Heimeiren’, and also 31%, 5% and 18% in ‘Qingjiangbai’, respectively, under C1, C2 and C3 treatments. Similarly, the soil AKs of the three varieties all showed a significant decrease with the increase in CO2 concentration. Under C3 treatment, soil AKs in ‘Longpangqing’, ‘Heimeiren’ and ‘Qingjiangbai’ were decreased by 22%, 31% and 26%, respectively (Figure 4d). No significant differences were observed among three varieties in terms of SOC (p = 0.21, Figure 4a), AP (p = 0.51, Figure 4c) and AK (p = 0.09, Figure 4d), except for AN (p < 0.01, Figure 4b). Furthermore, a significant interaction of the CO2 × variety was observed in SOC and AN (p < 0.05, Figure 4a,b).
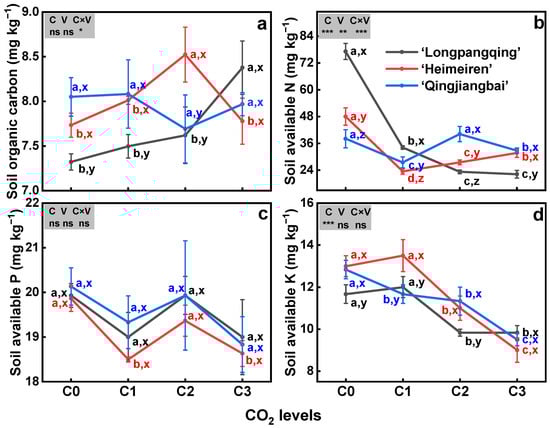
Figure 4.
The soil organic carbon (SOC, (a)), soil available nitrogen (AN, (b)), soil available phosphorus (AP, (c)) and soil available potassium (AK, (d)) contents in soils of three varieties of Brassica chinensis L. under four different CO2 conditions. Different letters indicate significant differences between the CO2 treatments within the same variety (a, b, c, d) and between different varieties within the same CO2 treatment (x, y, z) at a significance level of p < 0.05, as revealed by Duncan’s test. Statistical comparisons (two-way ANOVA) between CO2 treatments and varieties, as well as their interaction (CO2 × variety), are presented for each variable. ANOVA: ns, not significant; *, ** and *** significant at p ≤ 0.05, p ≤ 0.01 and p ≤ 0.001, respectively.
3.6. N:P:K Ratios
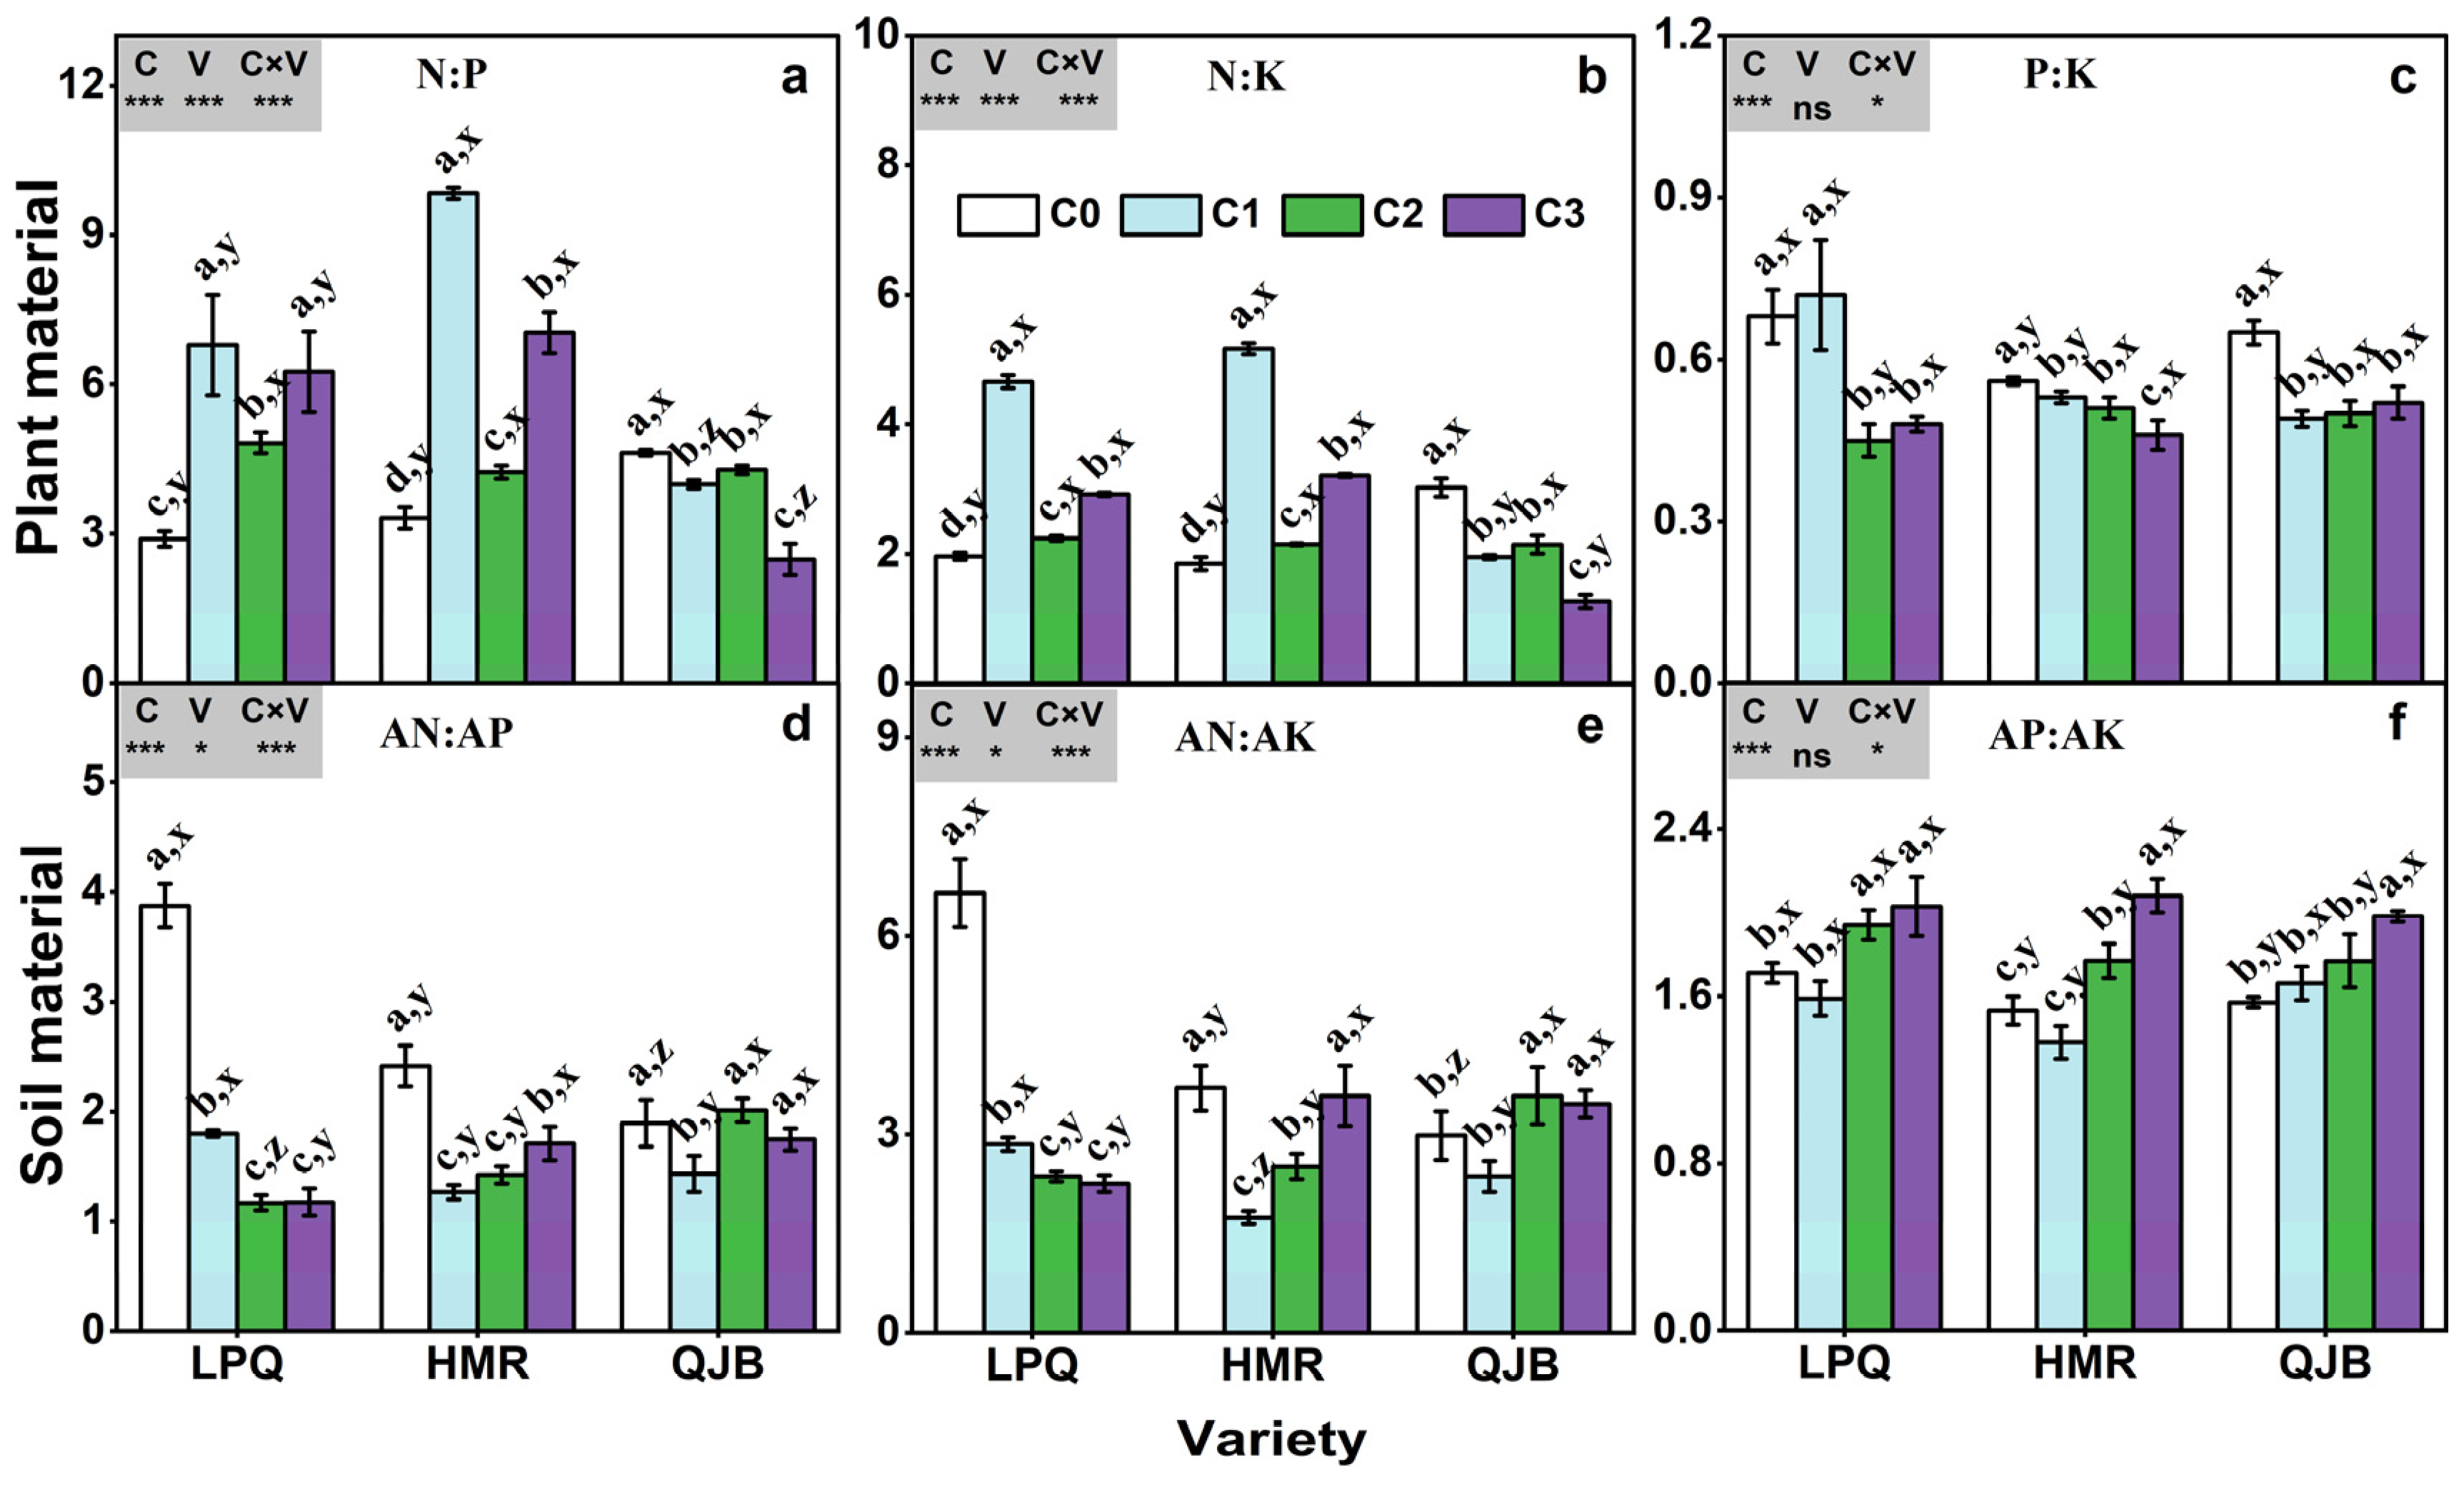
Elevated CO2 significantly increased the N:P ratio and the N:K ratio in the plants of both ‘Longpangqing’ and ‘Heimeiren’, while significantly decreased the N:P ratio by 7–46% and the N:K ratio by 30–58% in the plant of ‘Qingjiangbai’ (Figure 5a,b). Moreover, eCO2 significantly decreased the P:K ratio in plants of all three varieties except for ‘Longpangqing’, where it remained unchanged under C1 treatment (Figure 5c). The soil AN:AP ratio decreased in response to eCO2, by 54%, 54%, 70% and 41%, 48% and 29% in ‘Longpangqing’ and ‘Heimeiren’ under C1, C2 and C3 treatments, respectively, and decreased by 24% in ‘Qingjiangbai’ under C1 treatment (Figure 5d). Similarly, eCO2 significantly decreased the soil AN:AK ratio of ‘Longpangqing’ and ‘Heimeiren’, and the extent of decrease in the soil AN:AK ratio varied from 57 to 66% for ‘Longpangqing’ and 3 to 53% for ‘Heimeiren’. For ‘Qingjiangbai’, the soil AN:AK ratio decreased by 20% in C1 treatment but increased by 20% and 16% in the C2 and C3 treatments, respectively, compared to the C0 treatment. In contrast, the AP:AK ratio in soil showed an increase with increasing CO2 concentration, except for ‘Longpangqing’ and ‘Heimeiren’ under C1 treatment (Figure 5e). The soil AP:AK ratio was highest in the C3 treatment for all the three varieties and was increased by 17%, 36% and 26% in ‘Longpangqing’, ‘Heimeiren’ and ‘Qingjiangbai’, respectively, compared to the C0 treatment (Figure 5f). The responses of plants’ N:P and N:K ratios, as well as soils’ AN:AP and AN:AK ratios to eCO2 varied among the different varieties (Figure 5). Furthermore, there was a significant interaction of CO2 × variety observed for plant N:P, N:K and P:K ratios, as well as for soil AN:AP, AN:AK and AP:AK ratios (Figure 5).

Figure 5.
The N:P (a), N:K (b) and P:K (c) ratios in plant material, and AN:AP (d), AN:AK (e) and AP:AK (f) ratios in soil material of three varieties (LPQ, ‘Longpangqing’; HMR, ‘Heimeiren’; and QJB, ‘Qingjiangbai’) of Brassica chinensis L. under four different CO2 conditions. Different letters indicate significant differences between the CO2 treatments within the same variety (a, b, c, d) and between different varieties within the same CO2 treatment (x, y, z) at a significance level of p < 0.05, as revealed by Duncan’s test. Statistical comparisons (two-way ANOVA) between CO2 treatments and varieties, as well as their interaction (CO2 × variety), are presented for each variable. ANOVA: ns, not significant; *, ** and *** significant at p ≤ 0.05, p ≤ 0.01 and p ≤ 0.001, respectively.
3.7. Soil Enzymatic Activities
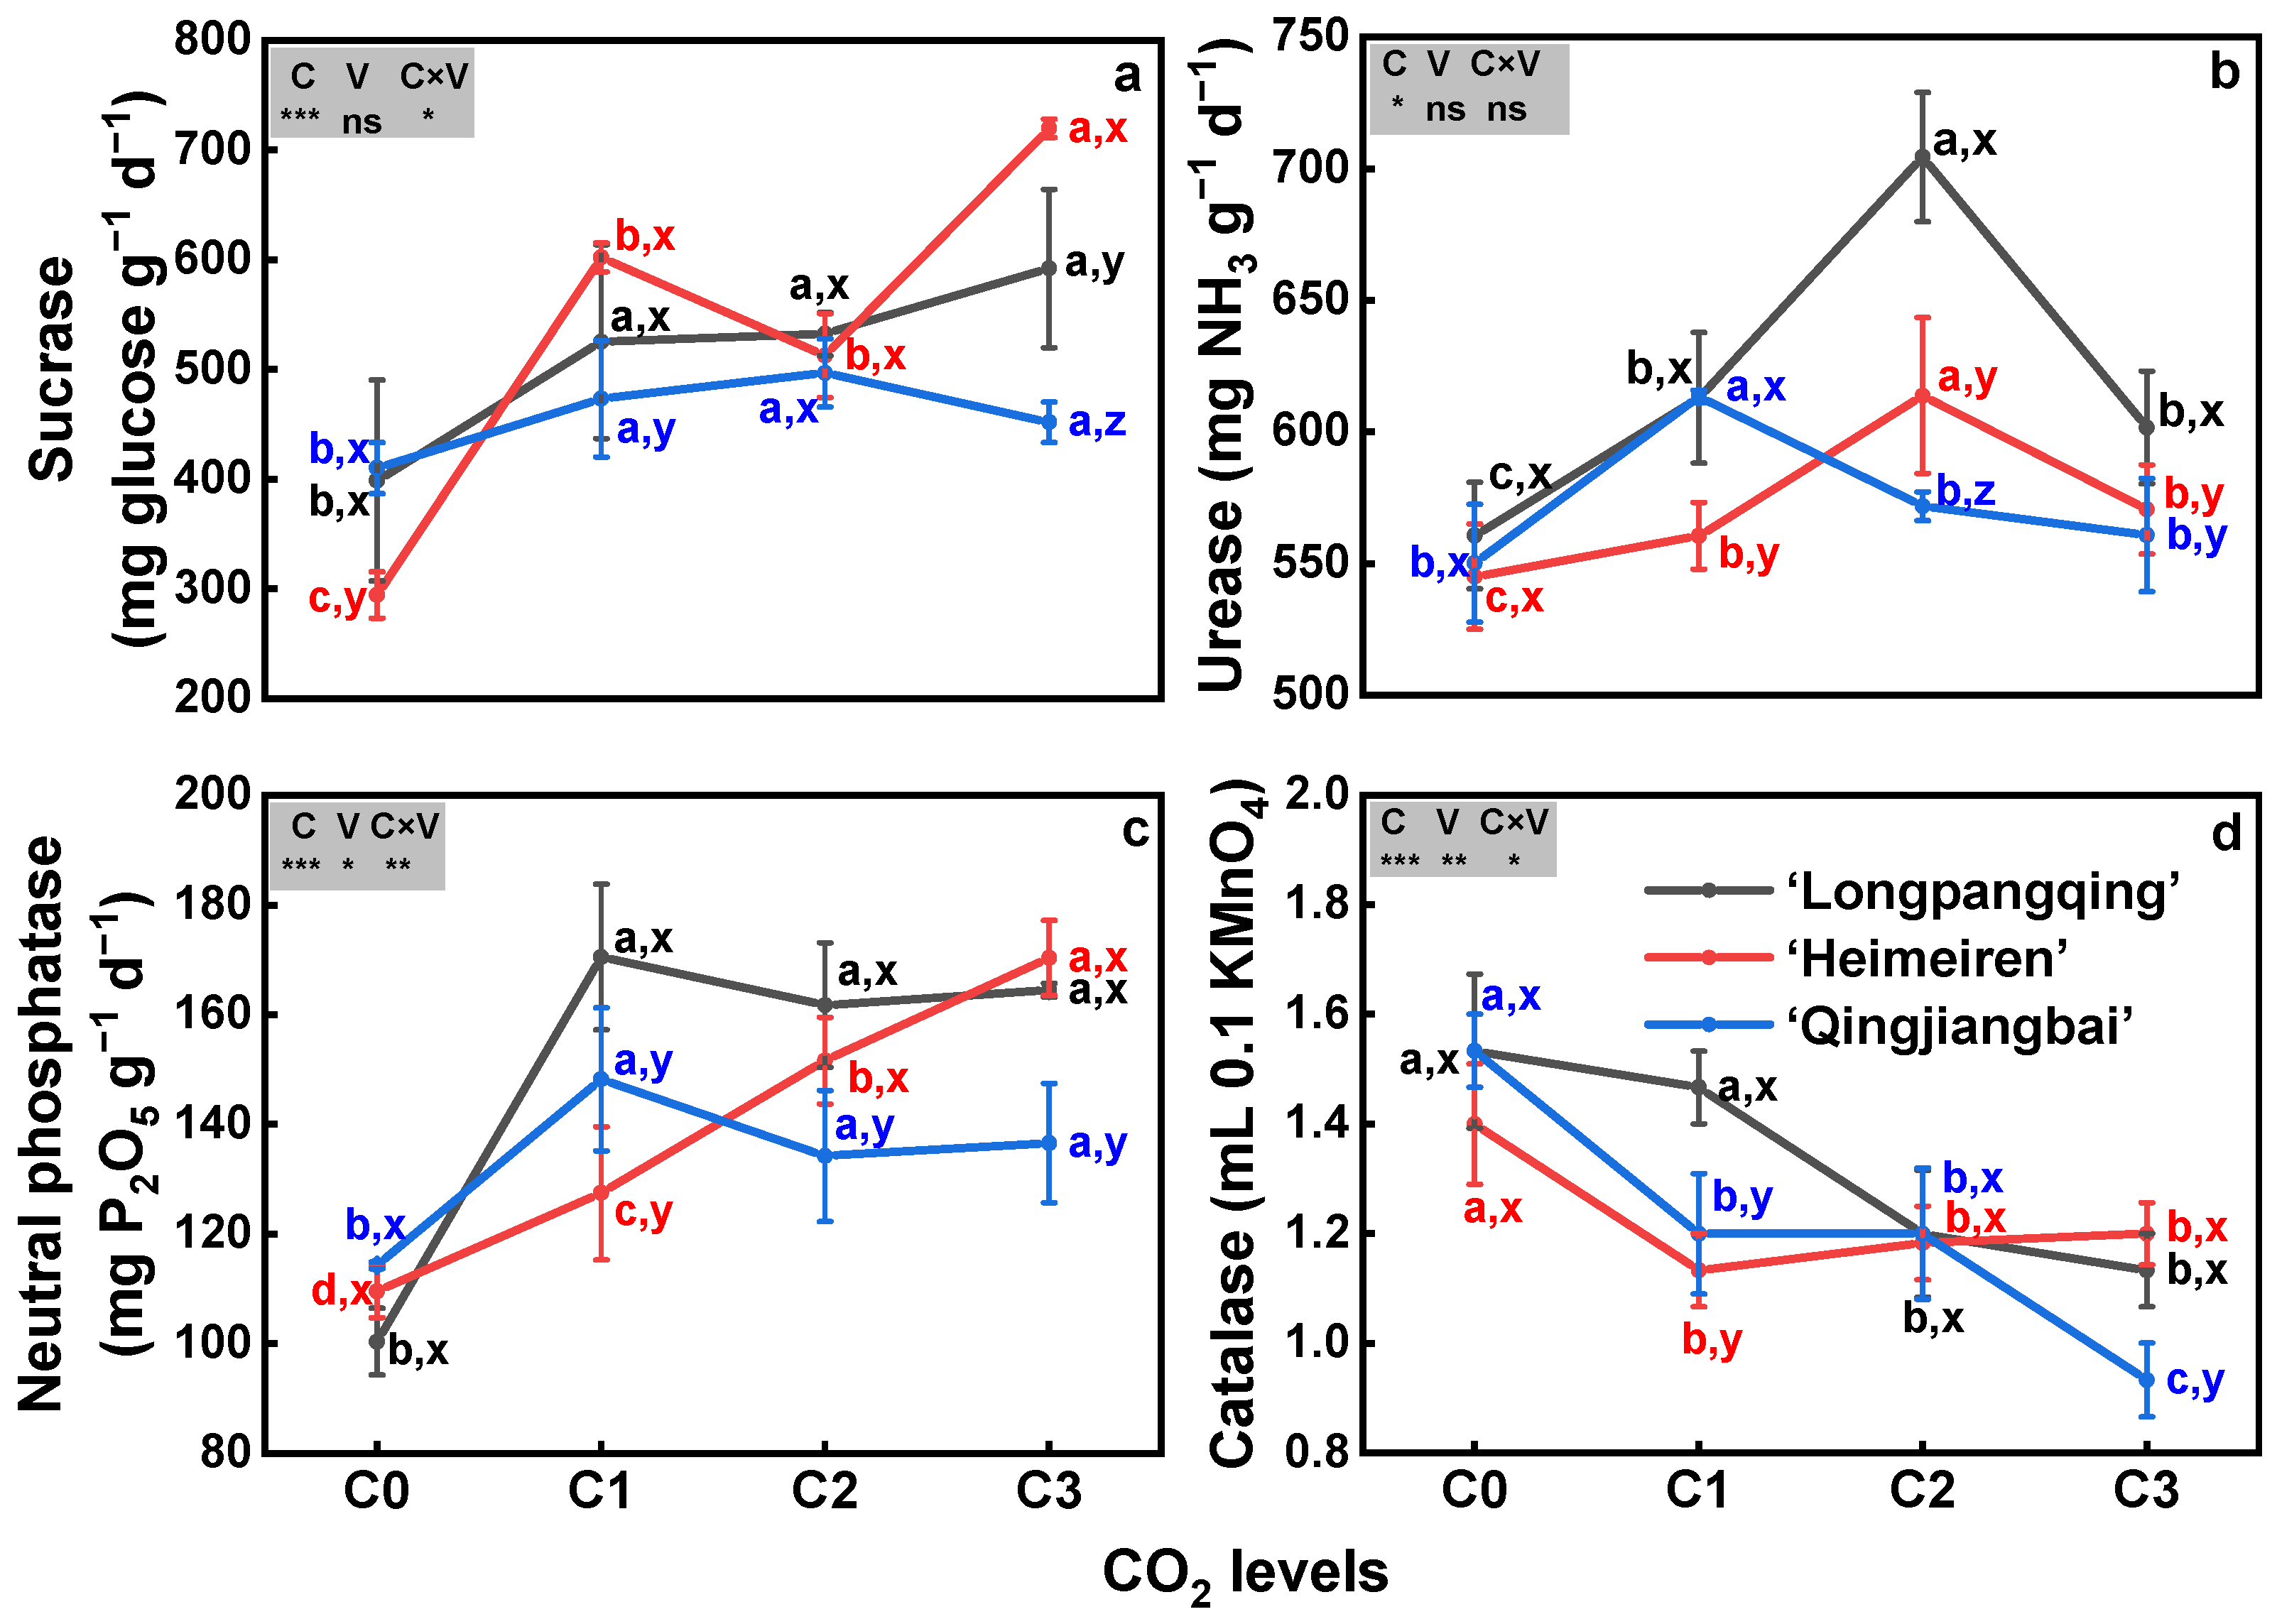
The soil activities of sucrase, urease and neutral phosphatase were increased while catalase activity was decreased under eCO2 in the three varieties of B. chinensis, except for the urease of ‘Qingjiangbai’ under C2 and C3 treatments and catalase of ‘Heimeiren’ under C2 treatment (Figure 6). Elevated CO2 stimulated sucrase activity by 32–49% in ‘Longpangqing’ soil, by 21–70% in ‘Heimeiren’ soil and by 10–21% in ‘Qingjiangbai’ soil. The highest sucrase activity was observed under C3 treatment for both ‘Longpangqing’ and ‘Heimeiren’ soil and under C2 treatment for ‘Qingjiangbai’ soil (Figure 6a). Soil urease activity initially increased and then decreased with the increase in CO2 concentration, but it was still greater than that under C0 treatment. The highest urease activity was exhibited under C2 treatment in ‘Longpangqing’ and ‘Heimeiren’ soil, while under C1 treatment in ‘Qingjiangbai’ soil (Figure 6b). Soil neutral phosphatase activity was increased by 70%, 61% and 64% in ‘Longpangqing’, 16%, 38% and 55% in ‘Heimeiren’, and 30%, 17% and 19% in ‘Qingjiangbai’, respectively (Figure 6c). In contrast, soil catalase activity was reduced by 4%, 21% and 26% in ‘Longpangqing’, 19%, 16% and 14% in ‘Heimeiren’, and 39%, 39% and 48% in ‘Qingjiangbai’, respectively, under C1, C2 and C3 treatments, respectively, compared to C0 (Figure 6d). There were no significant differences in sucrase (p = 0.41, Figure 6a) and urease activity (p = 0.55, Figure 6b) among the three varieties. However, a significant interaction of the CO2 × variety was found for sucrase, neutral phosphatase and catalase (p < 0.05, Figure 6a,c,d), but not for urease activity (p = 0.64, Figure 6b).
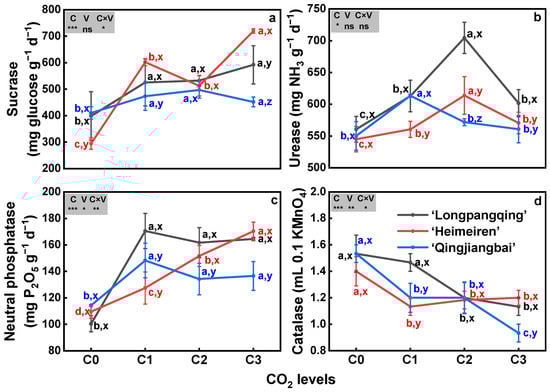
Figure 6.
The activities of sucrase (a), urease (b), neutral phosphatase (c) and catalase (d) in soils of three varieties of Brassica chinensis L. under four different CO2 conditions. Different letters indicate significant differences between the CO2 treatments within the same variety (a, b, c, d) and between different varieties within the same CO2 treatment (x, y, z) at a significance level of p < 0.05, as revealed by Duncan’s test. Statistical comparisons (two-way ANOVA) between CO2 treatments and varieties, as well as their interaction (CO2 × variety), are presented for each variable. ANOVA: ns, not significant; *, ** and *** significant at p ≤ 0.05, p ≤ 0.01 and p ≤ 0.001, respectively.
3.8. Correlations
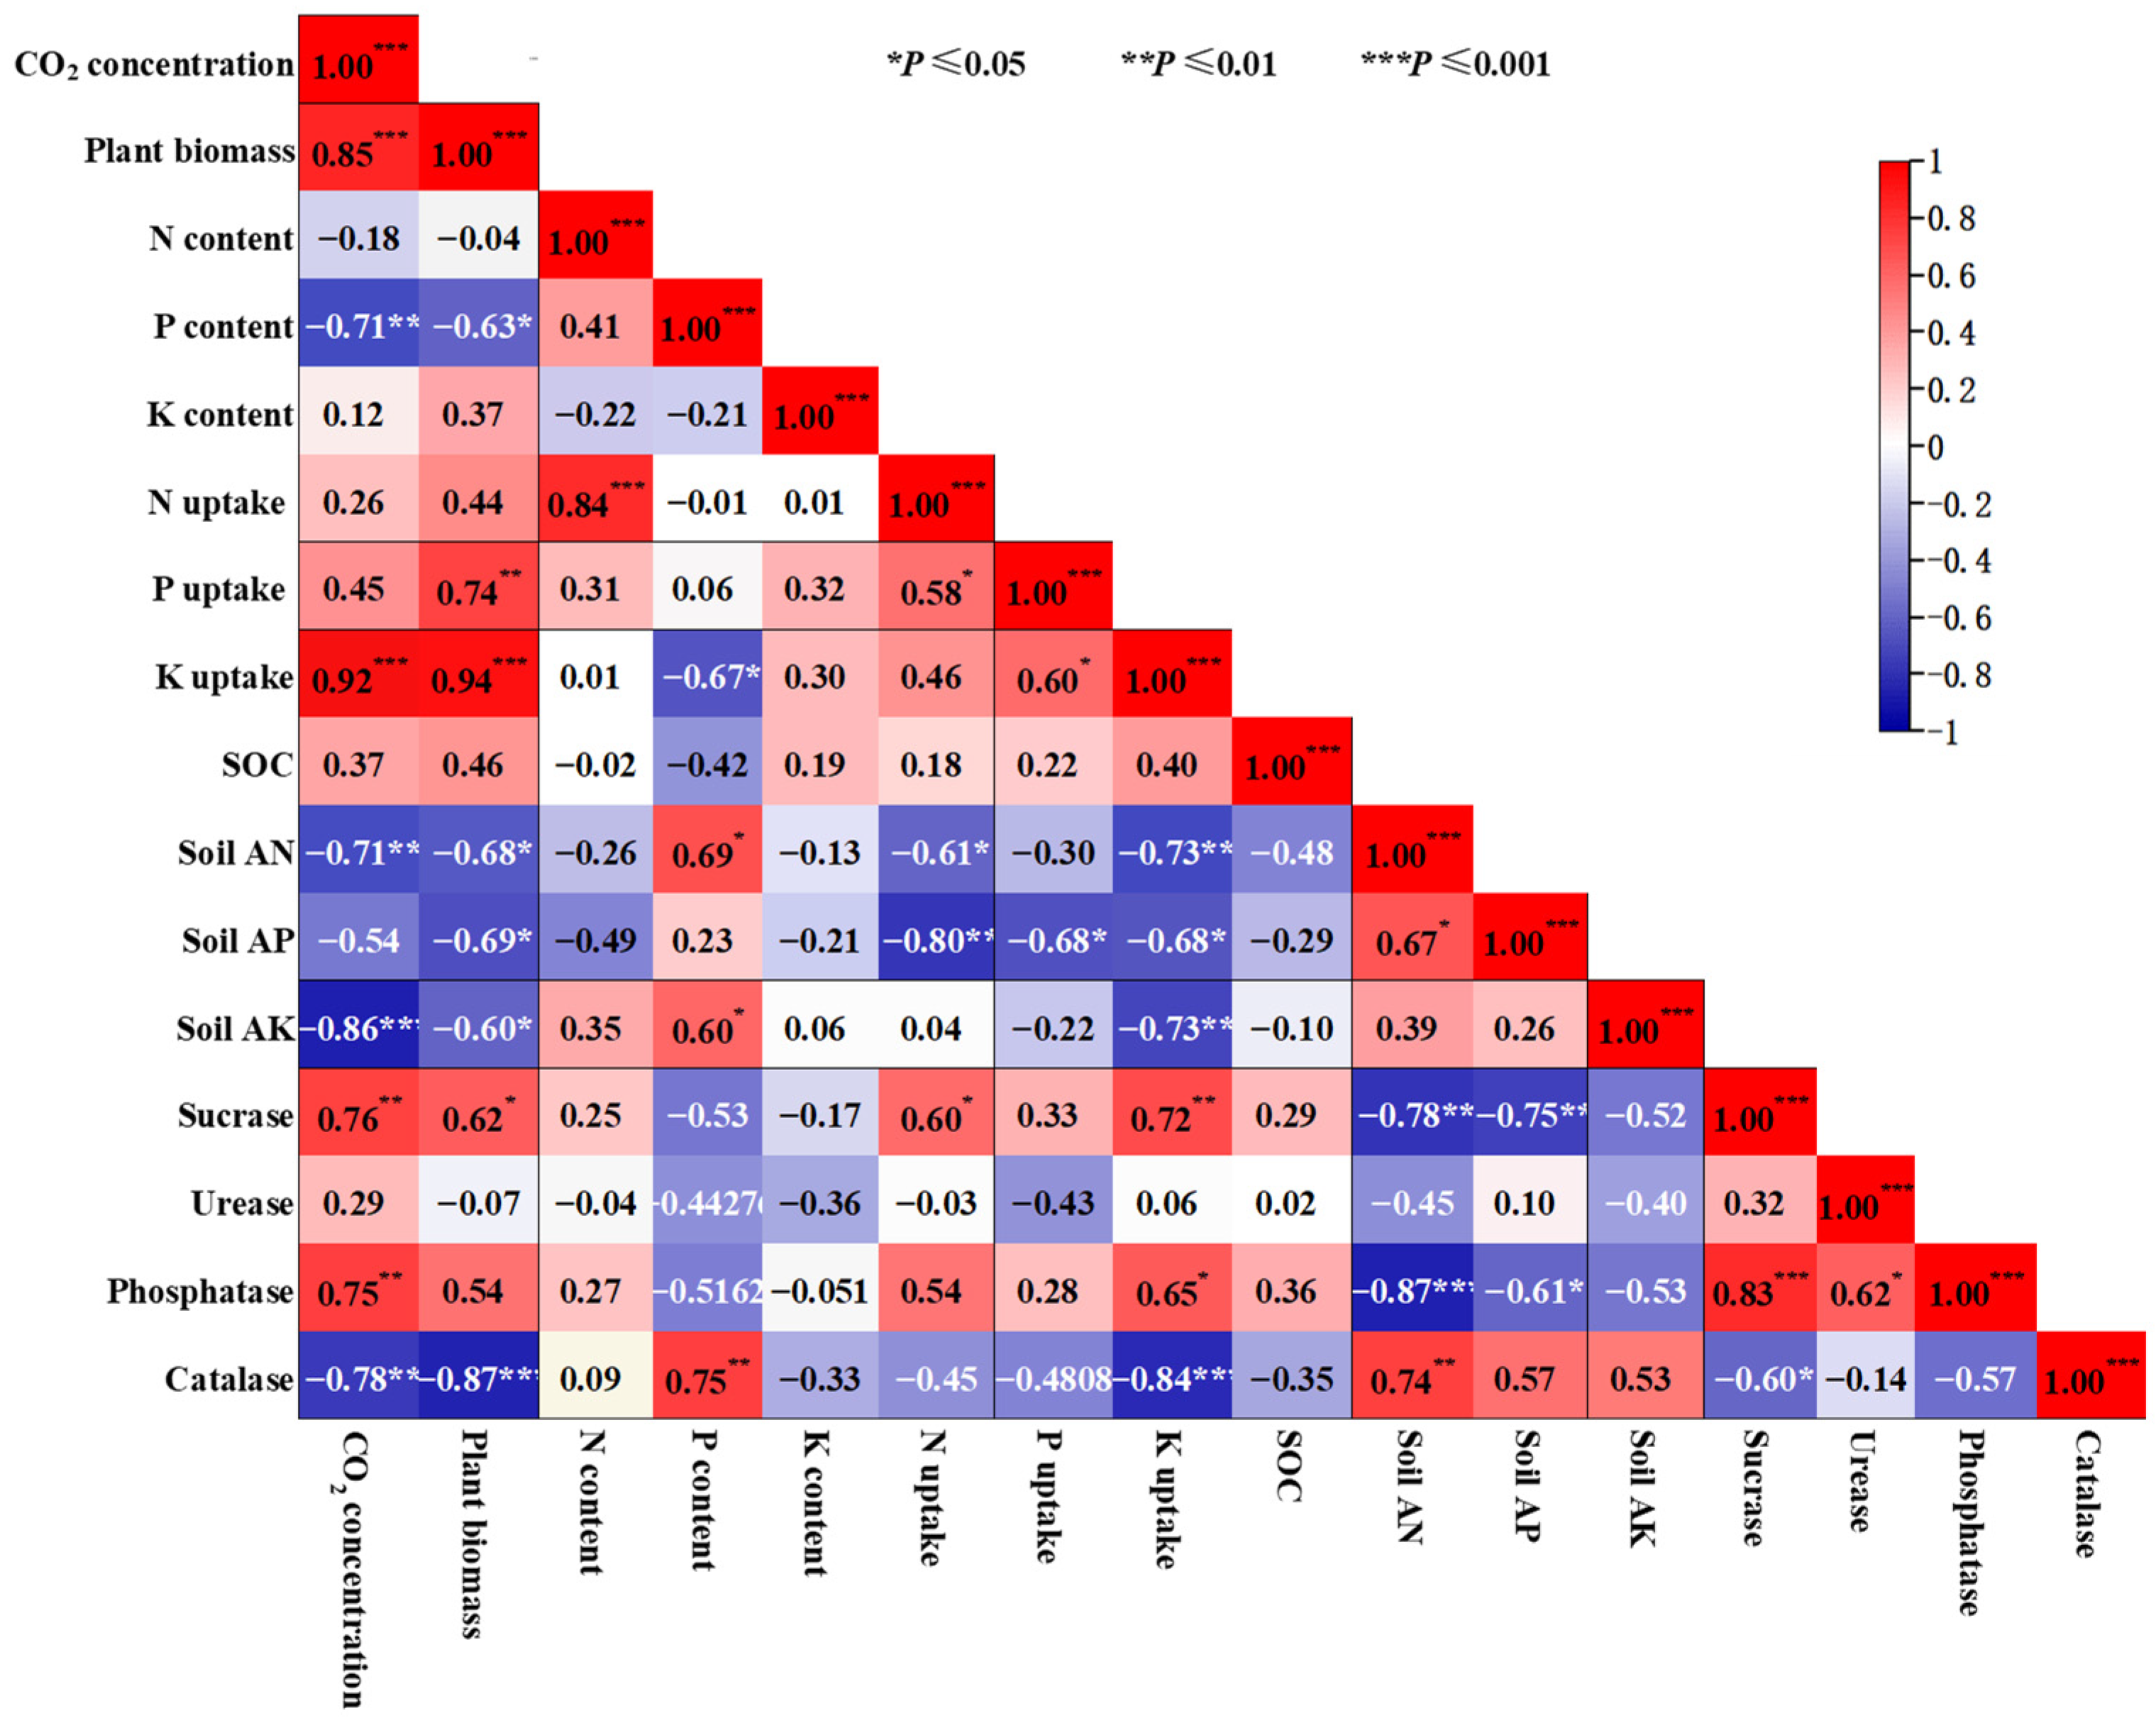
The data obtained from three varieties of B. chinensis were analyzed for their correlations (Figure 7). The results showed that CO2 concentration was significantly positively correlated with the plant biomass production, K uptake, soil sucrase and phosphatase, but negatively correlated with the plant P content, soil AN, soil AK and soil catalase (p < 0.05, Figure 7). Plant biomass production was significantly positively correlated with the P uptake, K uptake, sucrase and phosphatase (p < 0.05, Figure 7). Conversely, it showed a significant negative correlation with P content, soil AN, AP and AK, and catalase (p < 0.05, Figure 7). N content exhibited a highly significant positive correlation with N uptake (p < 0.05, Figure 7). P content also displayed significant positive correlations with soil AN, AK and catalase, but a negative correlation with K uptake (p < 0.05, Figure 7). N uptake was significantly positively correlated with P uptake and sucrase, while was significantly negatively correlated with soil AN and soil AP (p < 0.05, Figure 7). P uptake was significantly positively correlated with K uptake, and significantly negatively correlated with soil AP (p < 0.05, Figure 7). K uptake had a significant positive correlation with sucrase and phosphatase, and a significant negative correlation with soil AN, AP, AK and catalase (p < 0.05, Figure 7). Soil AN had a significant positive correlation with soil AP and catalase, and a significant negative correlation with sucrase and phosphatase (p < 0.05, Figure 7). Soil AP had significant negative correlation with sucrase and phosphatase (p < 0.05, Figure 7). Additionally, sucrase showed a significant positive correlation with phosphatase and a significant negative correlation with catalase (p < 0.05, Figure 7). Urease exhibited a significant positive correlation with phosphatase (p < 0.05, Figure 7).

Figure 7.
Correlation analysis conducted to examine the relationship between plant dry matter biomass, plant N, P and K concentrations, plant N, P and K uptake, soil nutrients, and enzymatic activities after exposure to elevated CO2 concentrations. Positive effects are represented by fuchsia boxes, negative effects by blue boxes and non-significant correlations by white boxes. *, ** and *** significant at p ≤ 0.05, p ≤ 0.01 and p ≤ 0.001, respectively.
4. Discussion
4.1. eCO2 Linearly Increases Biomass Production of the Three Tested B. chinensis Varieties
Photosynthesis is a fundamental process that is essential for the growth and development of plants. It involves the utilization of enzymes to convert CO2 and water into organic matter [47]. As a fundamental raw material required for plant photosynthesis, eCO2 increases the rate of photosynthesis in green leaves, which increases the accumulation of leaf carbohydrates and consequently in other plant tissues [48,49]. A meta-analysis showed an averaged increase of crop yield by 17% under 475–600 ppm eCO2 [50] and by 34% of vegetable biomass under 827 ppm eCO2 [2]. These increases were greater than those of wheat by 24% [36], rice by 23% [51] and soybean by 23% [52,53]. In this study, the biomass production of three B. chinensis varieties was significantly increased to some extent under all three eCO2 concentrations, and the greatest biomass accumulation was under C3 compared to the C0 treatment (Table 1). These results are consistent with previous studies of leafy vegetables, although the extent of this increase has varied depending on the location and cultivar [6,25,54,55]. CO2 enrichment reduces the oxygen inhibition of photosynthesis while increasing the net photosynthesis. The additional assimilate can be used directly to increase leaf development, resulting in a greater biomass improvement, especially in leafy vegetables, as demonstrated in this study (Table 1). Moreover, our results showed that there was a significantly positive relationship between CO2 concentration and total plant biomass (p < 0.05, Figure 7), indicating that plants have a greater photosynthetic capacity under high CO2 conditions, leading to increased fixation and transformation of C, and ultimately resulting in the accumulation of more biomass. Similar results were reported by Long et al. [56], who used a meta-analysis on crop yield response for the CO2 enrichment of over 340 independent chamber studies which demonstrated a linear response of crop yield to an increase in CO2 level.
4.2. Effect of eCO2 on N, P and K Uptake Depends on the Variety of B. chinensis
This study clearly demonstrated that plant N, K and P contents in three varieties of B. chinensis responded differently to eCO2 (Figure 2). It is noteworthy that as the CO2 concentration increased, the P content showed a consistent downward trend across all the three B. chinensis varieties. This trend may be attributed to a dilution effect resulting from an increase in biomass, as evidenced by a significantly negative relationship between plant biomass production and P content (p < 0.05, Figure 7). However, the ‘dilution effect’ alone cannot fully explain the nutrient changes observed in our study, particularly with regard to N and K contents. The N content of ‘Qingjiangbai’ was, respectively, decreased by 34.7%, 28.3% and 56.6% under C1, C2 and C3 treatments compared to C0, which is consistent with previous studies [7,8,25]. However, both ‘Longpangqing’ and ‘Heimeiren’ showed an increase in N content, which contrasts with numerous studies under eCO2. Genotypic variation may be associated with the observed difference in N demand, absorption and utilization efficiency in response to eCO2. It was found that the nitrate reductase activity, RuBisco activity per unit of N, chlorophyll content and photosynthetic rate were closely related to plant varieties [57,58]. Furthermore, our results showed that eCO2 had a significant decreased impact on the K content in ‘Heimeiren’, but not in ‘Longpangqing’ and ‘Qingjiangbai’, suggesting a complex response of leaf K concentration to eCO2 with vegetable crop varieties. The possible explanation for this was that partially stomatal closure and subsequent decline in leaf transpiration rate under eCO2 may have caused a lower transpiration-driven mass flow of K through the soil to the root surface, thereby reducing the absorption of K [59]. There was a significant positive correlation between K and transpiration rate [7]. However, further research is required to fully understand the mechanism by which K content responds to eCO2.
Our results showed that eCO2 had a positive effect on P uptake in the ‘Qingjiangbai’ variety, while no significant impact was observed in ‘Longpangqing’ and ‘Heimeiren’. Moreover, eCO2 significantly increased N uptake in ‘Longpangqing’ and ‘Heimeiren’, but not in ‘Qingjiangbai’ (Figure 3). These findings suggest that eCO2 has varying implications for nutrient dynamics requirements among different B. chinensis varieties. Varying responses of nutrient uptake to eCO2 among species not only indicate differently physiological mechanisms, such as transpiration efficiency and photosynthesis rate, resulting in yield variations [53,60,61], but also reveal inherent differences between plant species in their capacity to access soil nutrients [26]. Increased uptake of N and P has been reported under eCO2 (200 ppm above ambience), suggesting that this may be related to an increased root growth and dependent on soil nutrient status [62,63]. Similarly, we found that root biomass under eCO2 was substantially, respectively, increased by 24.8%−103.1% in three varieties of B. chinensis (Table 1), which enhanced the plant’s ability to take up nutrients. Indeed, our results showed a positive correlation between biomass production and uptake of P and K, while N, P and K uptake was negatively correlated with soil AN, AP and AK (p < 0.05, Figure 7). These results are consistent with previous findings that eCO2 promotes plant nutrient uptake to meet their growth demand [64,65,66]. These results indicate that plant nutrient uptake capacity is also related to the dynamics and availability of soil nutrients. A study of the rotation of wheat, field pea and canola showed that 550 ppm eCO2 significantly reduced soil labile N and P due to an increased nutrient uptake [15]. Similar patterns of changes in soil AN and AP responses were also found in the soil of fast-growing Tectona grandis under 550 ppm eCO2 exposure for 46 months [26]. This view was further supported by an eCO2-induced decrease in soil AN and AK contents in this study (Figure 4). Thus, it is possible that the intrinsic soil nutrient supply may not be able to satisfy the increasing nutrient demand resulting from eCO2-stimulated biomass growth (Table 1). In contrast to soil AN and AK, soil AP did not change significantly under eCO2 in this study, suggesting that P was not the limiting nutrient for plant growth. Due to the limited mobility of P in soil, the increase in root growth in this study may have facilitated P acquisition as the root proliferation increased the root ablation volume in the soil profiles [67]. Moreover, changes occurred in the soil AN:AP ratio, AN:AK ratio and AP:AK ratio (Figure 5), reflecting that the decrease in AN content was less than that of AK content under eCO2 (Figure 4), which indicates that the K pool was higher than the N pool in soil under eCO2. Consequently, more external fertilizer supplement (especially N, followed by K) would be necessary to maintain or promote plant growth constantly under eCO2.
4.3. eCO2 Improves N, P and K Use Efficiency of B. chinensis
Nutrient use efficiency has been used as a long-term indicator of the availability of nutrient utilization for C acquisition in plants. This study revealed that eCO2 resulted in greater NUE, PUE and KUE, except for the NUE in ‘Longpangqing’ and ‘Heimeiren’ (Table 2). These findings suggest that the plants accumulated the same amount of nutrients at eCO2 and aCO2, but produced greater dry matter under eCO2 condition. Consistently positive responses in nutrient use efficiency were observed under 571–700 ppm eCO2, across various crops, including the tomato [68], mulberry [23], Stylosanthes capitata [45], wheat [17] and indica and japonica cultivars [64]. Nutrient use efficiency can be improved in three ways: (a) maintaining constant biomass and reducing nutrient uptake; (b) increasing biomass while maintaining constant nutrient uptake; and (c) increasing biomass at a greater rate than nutrient uptake [69]. This study confirmed that an increase in KUE could be attributed to constant nutrient absorption and thus biomass increase. However, an increased PUE and NUE in ‘Qingjiangbai’ suggests that the increase in nutrient uptake rate might not keep up with the increase in biomass. ‘Longpangqing’ and ‘Heimeiren’ both exhibited an increase in N uptake and a decrease in N use efficiency under eCO2 compared to aCO2 (Figure 3 and Table 2). This indicates that enhancing N uptake while preserving or increasing N use efficiency will pose a significant challenge for B. chinensis production in the future.
4.4. eCO2 Stimulates Soil Enzyme Activities to Reduce Soil Nutrient Limitation
Microbial extracellular hydrolytic enzymes in soil play a crucial role in the degradation of labile C and specific nutrient cycling, such as N-releasing enzymes and P-targeting phosphatases. A 46-month exposure to 550 ppm eCO2 in the IndoGangetic Plain region of India significantly increased soil β-glucosidase, dehydrogenase and acidic phosphatase activities in both Tectona grandis and Butea monosperma [26]. A total of 750 ppm eCO2 also had a significant impact on the activities of soil saccharase and urease, as well as catalase activity in the rhizospheres of Bothriochloa ischaemum in loess soil, but had no effects on these enzymes under Medicago sativa [70]. Similarly, our results showed an increase in soil saccharase, urease and neutral phosphatases, while a decrease occurred in the catalase activities of the three tested B. chinensis varieties along the three eCO2 gradients (p < 0.05, Figure 6 and Figure 7). There are two possible reasons that could explain this increased soil enzymatic activity. On the one hand, eCO2 generally increased the inputs of simple C to soil through greater leaf and root production and enhanced root exudation [71], resulting in a general activation of microbes. This activation would result in a significant increase in enzymatic activities related to C, N and P, such as β-glucosidase, invertase, phenol oxidase, urease, protease, phosphatase and xylanase under 480–800 ppm eCO2 [26,35,72,73]. On the other hand, the higher enzymatic activities under eCO2 may be associated with higher plant productivity and its greater demand for nutrients (Table 1, Figure 3). In fact, the considerable decrease in AN under eCO2 (Figure 4b), and significant negative correlation between soil AN with sucrase and phosphatase (p < 0.05, Figure 7), supports the view in the present study. A generally increased N limitation with rising CO2 level might lead soil microbes to increase their activity of soil enzymes including urease (Figure 6b), protease [33] and β-1,4-N-acetyl-glucosamine [37] to release more relevant nutrients for plant growth. A meta-analysis of 34 studies from a 250 to 500 ppm CO2 gradient experiment showed that eCO2-induced nutrient limitation could significantly increase soil enzymatic activities [37].
5. Conclusions
Elevated CO2 had a linear effect on the biomass production of three varieties of B. chinensis, with the highest biomass production observed under the C3 CO2 treatment. Moreover, eCO2 resulted in a significant increase in the uptake of N and K, P and K use efficiency, and soil saccharase, urease and phosphatase activities, but decreased soil available N and K and catalase activity in B. chinensis. However, eCO2 had different effects on the contents of N and K and the N use efficiency of the three varieties. Under eCO2, the ‘Qingjiangbai’ variety exhibited higher biomass production, P and K uptake, as well as N, P and K use efficiency, without a decrease in soil AN and AP. This variety is therefore more suitable for cultivation in a greenhouse under eCO2. Consequently, a greater input of nutrients may be necessary to sustain the yield of B. chinensis under eCO2, particularly with regard to N and K, but a supplement must be also considered with a greater precision for different varieties of crop. Furthermore, the effect of eCO2 on nutrient uptake and biomass accumulation in vegetables may involve a series of changes in gene expression and metabolites. Studies on the impact of biomass accumulation and yield combined with omics technologies such as genomics, transcriptomics, metabolomics and nutritional quality have comprehensively explored the response of vegetables to climate change.
Author Contributions
S.S., conceptualization, methodology, writing—original draft and writing—review and editing; X.W., H.L. and J.S., methodology, data curation, formal analysis and writing—review and editing; X.H. and Z.Y., conceptualization, supervision, resources, project administration, writing—review and editing and funding acquisition. All authors have read and agreed to the published version of the manuscript.
Funding
This research was supported by the National Natural Science Foundation of China (42267056), Yunnan Fundamental Research Projects (202301AU070115) and Key Science and Technology Special Projects of Yunnan Province (202402AE090012).
Data Availability Statement
The data presented in this study are available in this article.
Conflicts of Interest
The authors declare no conflicts of interest.
Abbreviations
| aCO2 | atmospheric carbon dioxide |
| eCO2 | elevated carbon dioxide |
| B. chinensis | Brassica chinensis |
| C | carbon |
| N | nitrogen |
| P | phosphorus |
| K | potassium |
| FACE | free-air CO2 enrichment |
| ANOVA | analysis of variance |
| SOC | soil organic carbon |
| AN | available nitrogen |
| AP | available phosphorus |
| AK | available potassium |
| NUE | nitrogen use efficiency |
| PUE | phosphorus use efficiency |
| KUE | potassium use efficiency |
References
- Kläring, H.P.; Hauschild, C.; Heissner, A.; Bar-Yosef, B. Model-based control of CO2 concentration in greenhouses at ambient levels increases cucumber yield. Agric. For. Meteorol. 2007, 143, 208–216. [Google Scholar] [CrossRef]
- Dong, J.L.; Gruda, N.; Li, X.; Tang, Y.; Zhang, P.J.; Duan, Z.Q. Sustainable vegetable production under changing climate: The impact of elevated CO2 on yield of vegetables and the interactions with environments—A review. J. Clean. Prod. 2020, 253, 119920. [Google Scholar] [CrossRef]
- Willits, D.H.; Peet, M.M. Predicting yield responses to different greenhouse CO2 enrichment schemes-cucumbers and tomatoes. Agric. For. Meteorol. 1989, 44, 275–293. [Google Scholar] [CrossRef]
- Holley, J.; Mattson, N.; Ashenafi, E.; Nyman, M. The impact of CO2 enrichment on biomass, carotenoids, xanthophyll, and mineral content of Lettuce (Lactuca sativa L.). Horticulturae 2022, 8, 820. [Google Scholar] [CrossRef]
- Zhang, Z.H.; Wu, Z.M. CO2 enhances low-nitrogen adaption by promoting amino acid metabolism in Brassica napus. Plant Physiol. Biochem. 2023, 201, 107864. [Google Scholar] [CrossRef] [PubMed]
- Jo, N.Y.; Lee, J.; Byeon, J.E.; Park, H.J.; Ryoo, J.W.; Hwang, S.G. Elevated CO2 concentration induces changes in plant growth, transcriptome, and antioxidant activity in fennel. Front. Plant Sci. 2022, 13, 1067713. [Google Scholar] [CrossRef]
- Li, X.; Dong, J.L.; Gruda, N.S.; Chu, W.Y.; Duan, Z.Q. Interactive effects of the CO2 enrichment and nitrogen supply on the biomass accumulation, gas exchange properties, and mineral elements concentrations in cucumber plants at different growth stages. Agronomy 2020, 10, 139. [Google Scholar] [CrossRef]
- Halpern, M.; Bar-Tal, A.; Lugassi, N.; Egbaria, A.; Granot, D.; Yermiyahu, U. The role of nitrogen in photosynthetic acclimation to elevated [CO2] in tomatoes. Plant Soil 2019, 434, 397–411. [Google Scholar] [CrossRef]
- Deng, Q.; Hui, D.F.; Luo, Y.Q.; Elser, J.; Wang, Y.P.; Loladze, I.; Zhang, Q.F.; Dennis, S. Down-regulation of tissue N:P ratios in terrestrial plants by elevated CO2. Ecology 2015, 96, 3354–3362. [Google Scholar] [CrossRef]
- Lenka, N.K.; Lenka, S.; Mahapatra, P.; Sharma, N.; Kumar, S.; Aher, S.B.; Yashona, D.S. The fate of 15N labeled urea in a soybean-wheat cropping sequence under elevated CO2 and/or temperature. Agric. Ecosyst. Environ. 2019, 282, 23–29. [Google Scholar] [CrossRef]
- Du, C.J.; Wang, X.D.; Zhang, M.Y.; Jing, J.; Gao, Y.H. Effects of elevated CO2 on plant C-N-P stoichiometry in terrestrial ecosystems: A meta-analysis. Sci. Total Environ. 2019, 650, 697–708. [Google Scholar] [CrossRef]
- Bhattacharyya, P.; Varghese, E.; Dash, P.K.; Padhy, S.R.; Das, A.; Santra, P.; Mohapatra, T. Anticipated atmospheric CO2 elevation differentially influenced the soil microbial diversities in crop, grassland, and forest: A meta-analysis. Rhizosphere 2023, 25, 100630. [Google Scholar] [CrossRef]
- Li, D.; Zhang, J.B.; Gruda, N.S.; Wang, Z.Y.; Duan, Z.Q.; Müller, C.; Li, X. The regulation of gross nitrogen transformation rates in greenhouse soil cultivated with cucumber plants under elevated atmospheric [CO2] and increased soil temperature. Geoderma 2023, 439, 116680. [Google Scholar] [CrossRef]
- Tan, M.D.; Zong, R.; Lin, H.X.; Dhital, Y.P.; Ayantobo, O.O.; Chen, P.P.; Li, H.Q.; Chen, R.; Wang, Z.H. Responses of soil nutrient and enzyme activities to long-term mulched drip irrigation (MDI) after the conversion of wasteland to cropland. Appl. Soil Ecol. 2023, 190, 104976. [Google Scholar] [CrossRef]
- Jin, J.; Armstrong, R.; Tang, C.X. Impact of elevated CO2 on grain nutrient concentration varies with crops and soils—A long-term FACE study. Sci. Total Environ. 2019, 651, 2641–2647. [Google Scholar] [CrossRef]
- Loladze, I. Hidden shift of the ionome of plants exposed to elevated CO2 depletes minerals at the base of human nutrition. eLife 2014, 3, e02245. [Google Scholar] [CrossRef]
- Zhu, X.C.; Song, F.B.; Liu, S.Q.; Liu, F.L. Arbuscular mycorrhiza improves growth, nitrogen uptake, and nitrogen use efficiency in wheat grown under elevated CO2. Mycorrhiza 2016, 26, 133–140. [Google Scholar] [CrossRef]
- Piñero, M.C.; Otálora, G.; Porras, M.E.; Sánchez-Guerrero, M.C.; Lorenzo, P.; Medrano, E.; del Amor, F.M. The form in which nitrogen is supplied affects the polyamines, amino acids, and mineral composition of sweet pepper fruit under an elevated CO2 concentration. J. Agric. Food Chem. 2017, 65, 711–717. [Google Scholar] [CrossRef]
- Pérez-López, U.; Sgherri, C.; Miranda-Apodaca, J.; Micaelli, F.; Lacuesta, M.; Mena-Petite, A.; Quartacci, M.F.; Muñoz-Rueda, A. Concentration of phenolic compounds is increased in lettuce grown under high light intensity and elevated CO2. Plant Physiol. Biochem. 2018, 123, 233–241. [Google Scholar] [CrossRef]
- Lupitu, A.; Moisa, C.; Gavrilas, S.; Dochia, M.; Chambre, D.; Ciutina, V.; Copolovici, D.M.; Copolovici, L. The influence of elevated CO2 on volatile emissions, photosynthetic characteristics, and pigment content in Brassicaceae plants species and varieties. Plants 2022, 11, 973. [Google Scholar] [CrossRef]
- Lupitu, A.; Moisa, C.; Bortes, F.; Peteleu, D.; Dochia, M.; Chambre, D.; Ciutina, V.; Copolovici, D.M.; Copolovici, L. The impact of increased CO2 and drought stress on the secondary metabolites of cauliflower (Brassica oleracea var. botrytis) and cabbage (Brassica oleracea var. capitata). Plants 2023, 12, 3098. [Google Scholar] [CrossRef] [PubMed]
- Rangaswamy, T.C.; Sridhara, S.; Manoj, K.N.; Gopakkali, P.; Ramesh, N.; Shokralla, S.; El-Abedin, T.Z.K.; Almutairi, K.F.; Elansary, H.O. Impact of elevated CO2 and temperature on growth, development and nutrient uptake of tomato. Horticulturae 2021, 7, 509. [Google Scholar] [CrossRef]
- Shi, S.M.; Xu, X.; Dong, X.S.; Xu, C.Y.; Qiu, Y.L.; He, X.H. Photosynthetic acclimation and growth responses to elevated CO2 associate with leaf nitrogen and phosphorus concentrations in mulberry (Morus multicaulis Perr.). Forests 2021, 12, 660. [Google Scholar] [CrossRef]
- Li, Y.S.; Yu, Z.H.; Liu, X.B.; Mathesius, U.; Wang, G.H.; Tang, C.X.; Wu, J.J.; Liu, J.D.; Zhang, S.Q.; Jin, J. Elevated CO2 increases nitrogen fixation at the reproductive phase contributing to various yield responses of soybean varieties. Front. Plant Sci. 2017, 8, 1546. [Google Scholar] [CrossRef] [PubMed]
- Giri, A.; Armstrong, B.; Rajashekar, C.B. Rajashekar. Elevated carbon dioxide level suppresses nutritional quality of lettuce and spinach. Am. J. Plant Sci. 2016, 7, 246–258. [Google Scholar] [CrossRef]
- Singh, A.K.; Rai, A.; Kushwaha, M.; Chauhan, P.S.; Pandey, V.; Singh, N. Tree growth rate regulate the influence of elevated CO2 on soil biochemical responses under tropical condition. J. Environ. Manag. 2019, 231, 1211–1221. [Google Scholar] [CrossRef] [PubMed]
- Zeng, Q.; Liu, B.; Gilna, B.; Zhang, Y.L.; Zhu, C.W.; Ma, H.L.; Pang, J.; Chen, G.P.; Zhu, J.G. Elevated CO2 effects on nutrient competition between a C3 crop (Oryzasativa L.) and a C4 weed (Echinochloa crusgalli L.). Nutr. Cycl. Agroecosys. 2011, 89, 93–104. [Google Scholar] [CrossRef]
- Chakwizira, E.; Dunbar, H.J.; Andrews, M.; Moot, D.J.; Teixeira, E. Elevated carbon-dioxide effects on wheat grain quality differed under contrasting nitrogen and phosphorus fertiliser supply. Ann. Appl. Biol. 2024, 184, 152–162. [Google Scholar] [CrossRef]
- Saleh, A.M.; Abdel-Mawgoud, M.; Hassan, A.R.; Habeeb, T.H.; Yehia, R.S.; AbdElgawad, H. Global metabolic changes induced by Arbuscular mycorrhizal fungi in oregano plants grown under ambient and elevated levels of atmospheric CO2. Plant Physiol. Biochem. 2020, 151, 255–263. [Google Scholar] [CrossRef]
- Sharma, R.; Singh, H. Alteration in biochemical constituents and nutrients partitioning of Asparagus racemosus in response to elevated atmospheric CO2 concentration. Environ. Sci. Pollut. Res. 2022, 29, 6812–6821. [Google Scholar] [CrossRef]
- Saha, S.; Chakraborty, D.; Sehgal, V.K.; Pal, M. Potential impact of rising atmospheric CO2 on quality of grains in chickpea (Cicer arietinum L.). Food Chem. 2015, 187, 431–436. [Google Scholar] [CrossRef] [PubMed]
- Usue, P.L.; Jon, M.A.; Maite, L.; Amaia, M.P.; Alberto, M.R. Growth and nutritional quality improvement in two differently pigmented lettuce varieties grown under elevated CO2 and/or salinity. Sci. Hortic. 2015, 195, 56–66. [Google Scholar] [CrossRef]
- Duan, B.; Zhang, Y.; Xu, G.; Chen, J.; Paquette, A.; Peng, S. Long-term responses of plant growth, soil microbial communities and soil enzyme activities to elevated CO2 and neighbouring plants. Agric. For. Meteorol. 2015, 213, 91–101. [Google Scholar] [CrossRef]
- Bhattacharyya, P.; Roy, K.S.; Neogi, S.; Manna, M.C.; Adhya, T.K.; Rao, K.S.; Nayak, A.K. Influence of elevated carbon dioxide and temperature on belowground carbon allocation and enzyme activities in tropical flooded soil planted with rice. Environ. Monit. Assess. 2013, 185, 8659–8671. [Google Scholar] [CrossRef] [PubMed]
- Chen, Y.; Zhang, Y.J.; Bai, E.D.; Piao, S.L.; Chen, N.; Zhao, G.; Zheng, Z.T.; Zhu, Y.X. The stimulatory effect of elevated CO2 on soil respiration is unaffected by N addition. Sci. Total Environ. 2022, 813, 151907. [Google Scholar] [CrossRef] [PubMed]
- Wang, L.; Feng, Z.Z.; Schjoerring, J.K. Effects of elevated atmospheric CO2 on physiology and yield of wheat (Triticum aestivum L.): A meta-analytic test of current hypotheses. Agric. Ecosyst. Environ. 2013, 178, 57–63. [Google Scholar] [CrossRef]
- Kelley, A.M.; Fay, P.A.; Polley, H.W.; Gill, R.A.; Jackson, R.B. Atmospheric CO2 and soil extracellular enzyme activity: A meta-analysis and CO2 gradient experiment. Ecosphere 2011, 2, 96. [Google Scholar] [CrossRef]
- Burns, R.G.; DeForest, J.L.; Marxsen, J.; Sinsabaugh, R.L.; Stromberger, M.E.; Wallenstein, M.D.; Weintraub, M.N.; Zoppini, A. Soil enzymes in a changing environment: Current knowledge and future directions. Soil Biol. Biochem. 2013, 58, 216–234. [Google Scholar] [CrossRef]
- Adak, T.; Munda, S.; Kumar, U.; Berliner, J.; Pokhare, S.S.; Jambhulkar, N.N.; Jena, M. Effect of elevated CO2 on chlorpyriphos degradation and soil microbial activities in tropical rice soil. Environ. Monit. Assess. 2016, 188, 105. [Google Scholar] [CrossRef]
- Larson, J.L.; Zak, D.R.; Sinsabaugh, R.L. Extracellular enzyme activity beneath temperate trees growing under elevated carbon dioxide and ozone. Soil Sci. Soc. Am. J. 2002, 66, 1848–1856. [Google Scholar] [CrossRef]
- Piñeiro, J.; Pathare, V.; Ochoa-Hueso, R.; Carrillo, Y.; Power, S.A. No CO2 fertilization effect on plant growth despite enhanced rhizosphere enzyme activity in a low phosphorus soil. Plant Soil 2022, 471, 359–374. [Google Scholar] [CrossRef]
- Piñeiro, J.; Ochoa-Hueso, R.; Serrano-Grijalva, L.; Power, S.A. Phosphorus and water supply independently control productivity and soil enzyme activity responses to elevated CO2 in an understorey community from a Eucalyptus woodland. Plant Soil 2023, 483, 643–657. [Google Scholar] [CrossRef]
- Shi, S.; Luo, X.; Wen, M.; Dong, X.; Sharifi, S.; Xie, D.; He, X. Funneliformis mosseae improves growth and nutrient accumulation in wheat by facilitating soil nutrient uptake under elevated CO2 at daytime, not nighttime. J. Fungi 2021, 7, 458. [Google Scholar] [CrossRef] [PubMed]
- Yang, J.; Wang, C.; Dai, H. Soil Agrochemical Analysis and Environmental Monitoring Techniques(M); Chinese Dadi Press: Beijing, China, 2008; pp. 18–64. [Google Scholar]
- Carvalho, J.M.; Barreto, R.F.; Prado, R.D.; Habermann, E.; Martinez, C.A.; Branco, R.B.F. Elevated [CO2] and warming increase the macronutrient use efficiency and biomass of Stylosanthes capitata Vogel under field conditions. J. Agron. Crop Sci. 2020, 206, 597–606. [Google Scholar] [CrossRef]
- Guan, S.Y.; Zhang, D.; Zhang, Z. Soil Enzyme and Its Research Methods (M); Agricultural Press: Beijing, China, 1986; pp. 274–340. [Google Scholar]
- Suboktagin, S.; Khurshid, G.; Bilal, M.; Abbassi, A.Z.; Kwon, S.Y.; Ahmad, R. Improvement of photosynthesis in changing environment: Approaches, achievements and prospects. Plant Biotechnol. Rep. 2024, 18, 21–32. [Google Scholar] [CrossRef]
- Srivastava, A.C.; Pal, M.; Das, M.; Sengupta, U.K. Growth, CO2 exchange rate and dry matter partitioning in mungbean (Vigna radiata L.) grown under elevated CO2. Indian J. Exp. Biol. 2001, 39, 572–577. [Google Scholar]
- Gamez, A.L.; Han, X.; Aranjuelo, I. Differential effect of free-air CO2 enrichment (FACE) in different organs and growth stages of two cultivars of durum wheat. Plants 2023, 12, 686. [Google Scholar] [CrossRef]
- Ainsworth, E.A.; Long, S.P. What have we learned from 15 years of free-air CO2 enrichment (FACE)? A meta-analytic review of the responses of photosynthesis, canopy properties and plant production to rising CO2. New Phytol. 2005, 165, 351–371. [Google Scholar] [CrossRef]
- Hu, S.W.; Chen, W.; Tong, K.C.; Wang, Y.X.; Jing, L.Q.; Wang, Y.L.; Yang, L.X. Response of rice growth and leaf physiology to elevated CO2 concentrations: A meta-analysis of 20-year FACE studies. Sci. Total Environ. 2022, 807, 151017. [Google Scholar] [CrossRef]
- Jablonski, L.M.; Wang, X.Z.; Curtis, P.S. Plant reproduction under elevated CO2 conditions: A meta-analysis of reports on 79 crop and wild species. New Phytol. 2002, 156, 9–26. [Google Scholar] [CrossRef]
- Ainsworth, E.A.; Davey, P.A.; Bernacchi, C.J.; Dermody, O.C.; Heaton, E.A.; Moore, D.J.; Morgan, P.B.; Naidu, S.L.; Ra, H.S.Y.; Zhu, X.G. A meta-analysis of elevated [CO2] effects on soybean (Glycine max) physiology, growth and yield. Glob. Chang. Biol. 2002, 8, 695–709. [Google Scholar] [CrossRef]
- Becker, C.; Kläring, H.P. CO2 enrichment can produce high red leaf lettuce yield while increasing most flavonoid glycoside and some caffeic acid derivative concentrations. Food Chem. 2016, 199, 736–745. [Google Scholar] [CrossRef] [PubMed]
- Samuel, E.B.; Krishna, N.; Gioia, D.M.; Raymond, M.W.; Robert, C.M.; Cary, A.M. Growth and photosynthetic responses of Chinese cabbage (Brassica rapa L. cv. Tokyo Bekana) to continuously elevated carbon dioxide in a simulated space station “Veggie” crop-production environment. Life Sci. Space Res. 2020, 27, 83–88. [Google Scholar] [CrossRef]
- Long, S.P.; Ainsworth, E.A.; Leakey, A.D.; Nosberger, J.; Ort, D.R. Food for thought: Lower-than-expected crop yield stimulation with rising CO2 concentrations. Science 2006, 312, 1918–1921. [Google Scholar] [CrossRef] [PubMed]
- Zhang, Y.L.; Lv, H.J.; Wang, D.S.; Deng, J.C.; Song, W.J.; Makeen, K.; Shen, Q.R.; Xu, G.H. Partial nitrate nutrition amends photosynthetic characteristics in rice (Oryza sativa L. var. japonica) differing in nitrogen use efficiency. Plant Growth Regul. 2011, 63, 235–242. [Google Scholar] [CrossRef]
- Anjana; Umar, S.; Abrol, Y.P.; Iqbal, M. Modulation of nitrogen-utilization efficiency in wheat genotypes differing in nitrate reductase activity. J. Plant Nutr. 2011, 34, 920–933. [Google Scholar] [CrossRef]
- Drake, B.G.; Gonzalez-Meler, M.A.; Long, S.P. More efficient plants: A consequence of rising atmospheric CO2? Annu. Rev. Plant Physiol. 1997, 48, 609–639. [Google Scholar] [CrossRef]
- Becklin, K.M.; Mullinix, G.W.R.; Ward, J.K. Host plant physiology and mycorrhizal functioning shift across a glacial through future CO2 gradient. Plant Physiol. 2016, 172, 789–801. [Google Scholar] [CrossRef]
- Denis, F.; Michael, D.; Yin, X.; Anne, C.; Sandrine, R.; Armelle, S.; Delphine, L. Genotypic variation in source and sink traits affects the response of photosynthesis and growth to elevated atmospheric CO2. Plant Cell Environ. 2020, 43, 579–593. [Google Scholar] [CrossRef]
- Yang, L.X.; Huang, H.Y.; Yang, H.J.; Dong, G.C.; Liu, H.J.; Liu, G.; Zhu, J.G.; Wang, Y.L. Seasonal changes in the effects of free-air CO2 enrichment (FACE) ion nitrogen (N) uptake and utilization of rice at three levels of N fertilization. Field Crop Res. 2007, 100, 189–199. [Google Scholar] [CrossRef]
- Yang, L.X.; Wang, Y.L.; Huang, J.Y.; Zhu, J.G.; Yang, H.J.; Liu, G.; Liu, H.J.; Dong, G.C.; Hu, J. Seasonal changes in the effects of free-air CO2 enrichment (FACE) on phosphorus uptake and utilization of rice at three levels of nitrogen fertilization. Field Crop Res. 2007, 102, 141–150. [Google Scholar] [CrossRef]
- Jiang, Q.; Zhang, J.S.; Xu, X.; Liu, G.; Zhu, J.G. Effects of free-air CO2enrichment (FACE) and nitrogen (N) supply on N uptake and utilization of indica and japonica cultivars (Oryza sativa L.). Ecol. Process. 2020, 9, 35. [Google Scholar] [CrossRef]
- Wang, B.; Guo, C.; Wan, Y.F.; Li, J.L.; Ju, X.T.; Cai, W.W.; You, S.C.; Qin, X.B.; Wilkes, A.; Li, Y.E. Air warming and CO2 enrichment increase N use efficiency and decrease N surplus in a Chinese double rice cropping system. Sci. Total Environ. 2020, 706, 136063. [Google Scholar] [CrossRef] [PubMed]
- Zhuang, M.H.; Li, Y.C.; Guo, Z.W.; Li, Y.Q.; Pan, W.T.; Chen, S.L. Elevated CO2 and O3 levels influence the uptake and leaf concentration of mineral N, P, K in Phyllostachys edulis (Carrière) J.Houz. and Oligostachyum lubricum (wen) King f. Forests 2018, 9, 195. [Google Scholar] [CrossRef]
- Pang, J.Y.; Ryan, M.H.; Lambers, H.; Siddique, K.H.M. Phosphorus acquisition and utilisation in crop legumes under global change. Curr. Opin. Plant Biol. 2018, 45, 248–254. [Google Scholar] [CrossRef] [PubMed]
- Wei, Z.H.; Du, T.S.; Li, X.N.; Fang, L.; Liu, F.L. Interactive effects of CO2 concentration elevation and nitrogen fertilization on water and nitrogen use efficiency of tomato grown under reduced irrigation regimes. Agric. Water Manag. 2018, 202, 174–182. [Google Scholar] [CrossRef]
- An, Y.A.; Wan, S.Q.; Zhou, X.H.; Subedar, A.A.; Wallace, L.L.; Luo, Y.Q. Plant nitrogen concentration, use efficiency, and contents in a tallgrass prairie ecosystem under experimental warming. Glob. Chang. Biol. 2005, 11, 1733–1744. [Google Scholar] [CrossRef]
- Xue, S.; Yang, X.M.; Liu, G.B.; Gai, L.T.; Zhang, C.S.; Ritsema, C.J.; Geissen, V. Effects of elevated CO2 and drought on the microbial biomass and enzymatic activities in the rhizospheres of two grass species in Chinese loess soil. Geoderma 2017, 286, 25–34. [Google Scholar] [CrossRef]
- Sulman, B.N.; Phillips, R.P.; Oishi, A.C.; Shevliakova, E.; Pacala, S.W. Microbe-driven turnover offsets mineral-mediated storage of soil carbon under elevated CO2. Nat. Clim. Chang. 2014, 4, 1099–1102. [Google Scholar] [CrossRef]
- Bhattacharyya, R.; Bhatia, A.; Chakrabarti, B.; Saha, N.D.; Pramanik, P.; Ghosh, A.; Das, S.; Singh, G.; Singh, S.D. Elevated CO2 alters aggregate carbon and microbial community but does not affect total soil organic C in the semi-arid tropics. Appl. Soil Ecol. 2023, 187, 104843. [Google Scholar] [CrossRef]
- Xu, Q.; Lu, J.; Dijkstra, F.A.; Yin, L.; Wang, P.; Cheng, W. Elevated CO2 and nitrogen interactively affect the rhizosphere priming effect of Cunninghamia lanceolata. Soil Biol. Biochem. 2023, 187, 109219. [Google Scholar] [CrossRef]
Disclaimer/Publisher’s Note: The statements, opinions and data contained in all publications are solely those of the individual author(s) and contributor(s) and not of MDPI and/or the editor(s). MDPI and/or the editor(s) disclaim responsibility for any injury to people or property resulting from any ideas, methods, instructions or products referred to in the content. |
© 2024 by the authors. Licensee MDPI, Basel, Switzerland. This article is an open access article distributed under the terms and conditions of the Creative Commons Attribution (CC BY) license (https://creativecommons.org/licenses/by/4.0/).