Article

The Role of Organic Matter in Phosphorus Retention in Eutrophic and Dystrophic Terrestrial Ecosystems

by
Magdalena Debicka
Institute of Soil Science, Plant Nutrition and Environmental Protection, Wrocław University of Environmental and Life Sciences, 50-375 Wrocław, Poland
Agronomy 2024, 14(8), 1688; https://doi.org/10.3390/agronomy14081688
Submission received: 25 June 2024 / Revised: 24 July 2024 / Accepted: 27 July 2024 / Published: 31 July 2024

Abstract

:
Phosphorus (P) retention in soils in the presence of organic matter (OM) has been, for years, a topic with no clear conclusions. Considering the important ecological functions of peatlands, the objective of this study is to examine the role of OM transformation in relation to P status in Histosols in the Oder Valley (Poland). Basic physical and chemical properties and the following P forms were determined in the organic horizons of 5 soil profiles from two habitats (eutrophic and dystrophic): total (Pt) and organic P (Po), available P (PM3), easily soluble P (PCaCl2), water-soluble P (PW), and fraction of Po in humic (Po_HA) and fulvic (Po_FA) acids after extraction with 0.5 mol L−1 NaOH. The results were statistically verified in both examined habitat groups separately. The higher values of mobile P forms were found in the upper organic horizons released from OM constituents as a result of their decomposition. The role of OM in P retention was strongly related to the activity of humic substances (HS): a higher Po percentage (6.9–99.4% of Po) was observed in dystrophic, whereas a lower (9.3–28.6% of Po) was observed in eutrophic Histosols. Humic acids played a dominant role in P retention compared to fulvic acids in most peat horizons, especially at pH < 5. The role of HA and FA in P retention was clearly dependent on forms found only in eutrophic Histosols. The important role of FA in P retention during OM transformation was confirmed by negative correlations between Po_FA and macronutrient ratios in both soil groups. The results confirm the variable role of OM in P retention, depending on soil environmental conditions and OM type (peat and moorsh). This may have important applications not only in areas of natural importance, for which the release of mobile P forms may be a threat, but also in agricultural areas where, for a change, we struggle to increase P availability.

1. Introduction

The importance of organic matter (OM) in forming soil quality is indisputable. Reactive SOM components influence soil fertility and productivity and are involved in most chemical, biological, and physical processes occurring in the soil environment [1,2,3,4,5,6]. Among many other aspects, it is a valuable source of macronutrients necessary for the accurate functioning of all ecosystems.
The accelerated degradation of soil organic matter (SOM) under conditions of anthropopressure and climate change is widely observed. Faster decomposition and intensified mineralization of OM and erosion processes lead to a successively significant depletion of SOM stocks, which is not without significance for soil fertility [7]. For this reason, it appears important to pay attention to the OM transformation processes. The conditions under which they occur regulate macronutrient dynamics in the environment and determine their availability, which can thus affect the quality of soils [8,9,10]. The meaning of OM transformation in the formation of environmental quality is hence essential, both in agricultural areas and in other areas of natural significance. An important example of such natural areas is peatlands, which are huge OM reservoirs of global importance, but due to their high sensitivity to environmental alterations, they currently undergo major transformations leading to a drastic reduction in their area [9,11,12,13,14,15,16].
The course and effects of OM transformation on macronutrient behavior still require in-depth research under varying environmental conditions [17]. Among the least understood in this respect is still the relationship between OM and phosphorus [9,18]. Particularly relevant are studies on the retention and release of P, which is an environmentally problematic nutrient in the context of its limited natural resources [19,20], but also problems concerning the chemical aspects of this nutrient as an essential component for plants [9,21]. As OM can be one of the important natural sources of P (30–50%), research on P release into the environment is also highly desirable [14]. This macroelement can secure the nutritional needs of plants but, on the other hand, it can also pose a threat in terms of eutrophication in excessive quantities [14,22,23,24,25]. The processes of P retention in soils, in connection with the presence of OM, have been a topic for years with no clear conclusions [26,27,28,29,30,31]. In principle, the competitive relationship between SOM and P should increase P availability as a result of blocking the sorption sites for P by OM constituents [32,33,34,35,36,37,38]. However, a number of studies also indicate an increase in P sorption in the presence of OM [28,39,40,41,42]. It is likely that both the quantity and the quality of the OM and the conditions under which P sorption takes place play a decisive role in this process. The dissolved organic matter (DOM) released during the OM transformation can interact differently with P, affecting its bonding in the soil, depending on the environmental conditions, properties, and quality of the OM [43]. Some authors [40] have even proposed that the quality and quantity of DOM are probably the main factors defining the influence of OM on the course of P sorption in soil. DOM is a complex mixture of organic compounds, of which humic (HA) and fulvic acids (FA) constitute an important part [33,44]. Due to the numerous functional groups on their surfaces, in which carboxylic (–COOH) and hydroxyl (–OH) groups play the most important role, OM molecules can strongly influence the sorption of P. Nevertheless, they do not sorb P directly but by other soil components, for example, polyvalent cations (e.g., Ca2+, Fe2+, Al3+), sesquioxides, and clay minerals [43,45]. The FA, the low-molecular and mobile C fraction [46], binds P by forming bridging bonds with Al and Fe oxides or through their chelating abilities. Their behavior depends strongly on environmental conditions [6,44,47]. The HA, on the other hand, having a more complex aromatic structure and much higher molecular weight, takes an active part in P retention mostly through bridging bonds with Ca and Mg, which show greater solubility at lower pH values. Still, the quantitative aspects of P retention by humic substances (HS) have not been clearly defined [48]. P binding by these OM constituents may be crucial for the dynamics of different forms of P in the soil. Therefore, its transformation conditions and constituents may be an important factor here, especially in such OM-rich peat soils.
Natural peat ecosystems, which are considered to be one of the most important carbon pools in terrestrial ecosystems, store approximately one-third of the world’s soil carbon [49,50], although these soils represent only 3.7% of the world’s land area [8,51]. This highlights the huge ecological importance of peatlands and their alterations, especially since around 45% of peatlands have been drained [50]. Anthropogenic and natural changes in hydrological conditions are currently a common direct reason for peatland degradation [8,11,12,13,50,52]. A decrease in the moisture level leads to an increase in the intensity of OM decomposition and mineralization due to the development of aerobic conditions, becoming the beginning of OM transformation [13,50,53].
Peatlands are included in organic soils—referred to as Histosols according to the World Reference Base for Soil Resources [54]—in which, unlike mineral soils, OM is the determining factor in their development [13]. Within the organic soils, different degrees of development can be distinguished depending on the transformation and nature of the SOM. However, the behavior of SOM is closely linked not only to moisture conditions but also to the chemistry of the environment [8], which significantly influences the behavior of macronutrients, including phosphorus [9]. Therefore, the conduct of comparative studies across different terrestrial ecosystems with varying degrees of eutrophy and dystrophy is still an issue of more than just local importance. This can highlight how universal or specific the observed mechanisms are and identify potential ecosystem-specific factors affecting P retention or release.
The important ecological functions of peatlands and a growing need to protect them, the need to better understand the mechanisms of their transformation in relation to different environmental conditions, and the relationship between OM transformation and P behavior in soils of different habitats are some of the rationales for the persistent need to deepen the research in this area. Therefore, the present study on the role of OM transformations in relation to P status in peatlands located in conditions differing in fertility and pH was undertaken. In this paper, we present the results of a study conducted on Histosols located in different habitats—eutrophic and dystrophic ecosystems. The aim of the study was to assess the influence of OM under transformation in these different habitat conditions on P retention potential in Histosols in the peatland area of the Oder Valley (southwest Poland).

2. Materials and Methods

2.1. Soil Material, Location, and Samples Preparation

The studies were carried out on soils representing different stages of organic soil transformation, which are associated with different moisture conditions. Soil samples were collected from 5 profiles located in the floodplain of the Odra proglacial valley near the locality of Przedmoście (51°11′24″ N, 16°40′03″ E), situated approximately 25 km north-west of Wrocław, in Lower Silesia (SW part of Poland). A detailed description of the study area was presented in a previous paper [55]. Soil profiles (Supplementary Materials Table S1) were variously used as forests or grasslands [geoportal.gov.pl]. The described profiles (P1–P5) were represented by the organic soils from the Histosols reference group [54]. Most of the soil horizons showed a high degree of moisture content. Peat soils represented a weak (PtI) or medium (PtII) degree of wetness and moorsh soils represented a medium (MtII) or strong (MtIII) degree of wetness [56]. Soil samples were collected after soil excavations from each genetic horizon or were taken by means of a 6.0 cm diameter Instorf peat auger (Eijkelcamp Soil and Water, Giesbeek, The Netherlands). Peat cores were sliced according to the genetic horizons. Further processing of the study material was in accordance with Debicka et al. [55]. The collected material was divided into two parts: the first one was placed in a refrigerator at 4 °C for determinations in fresh material; the other was dried at room temperature, then ground and sieved through a 2 mm mesh sieve. Biological debris was not removed from the organic samples. Plant remnants were removed only in the mineral samples. The weights of the fresh samples were corrected for the current moisture content, while the hygroscopic water content was not corrected in the air-dry samples.

2.2. Basic Soil Characteristics

The degree of SOM decomposition was determined in fresh organic material using the half-syringe method based on analysis of rubbed and unrubbed fiber content [57] and the SPEC (Sodium Phosphate Extract Colour) method that was used to calculate the pyrophosphate index (PI) to determine the degree of peat humification [57]. The degree of humification of OM (H1–H10) in Histosols was also determined according to the von Post scale. Then, the specific density (ρw) was calculated from the following formula [58]:
ρw = 0.011 Ac + 1.451 g cm−3,
where Ac is the ash density; volumetric density (ρo) was determined using the Kopecky cylinders with volume v = 100 cm3; and total porosity (Pc) was calculated from the specific and volumetric densities.
The following basic chemical and physicochemical soil properties were determined in all soil samples: pH potentiometrically in H2O and 1 mol L−1 KCl solutions at a soil:solution volume ratio of 1:5 (in organic samples, the pH was determined in fresh material); the ash content (Ac) by burning at 550 °C for 4 h; total organic carbon (TOC) and total nitrogen (TN) on a Vario Macro Cube macroanalyser (Elementar Analysensysteme GmbH, Langenselbold, Germany); exchangeable acidity (EA) by the Sokołow method; and exchangeable base (EB) cation content (Ca2+, Mg2+, K+, and Na+) extracted with 1 mol L−1 NH4OAc at pH 7.0 (1:10 w/v). Their concentration in extracts was measured using Microwave Plasma–Atomic Emission Spectrometry (MP-AES 4200 Agilent Technologies, Santa Clara, CA, USA). The effective cation exchange capacity (CEC) and base saturation (BS) were also calculated based on the sum of EA and EB. The ratios of C:N, N:P, and C:P were calculated from the content of TOC, TN, and TP.

2.3. Content of Phosphorus Forms

The organic P (Po) content was determined using the ignition method [59], modified by Walker, Adams [60], and Shah et al. [61], in which the difference between the P content of soil samples (1 g finely ground soil) after extraction in 50 mL of 0.5 mol L−1 H2SO4 in a sample ignited for 2 h at 550 °C (approximate total P content; TP) and in an unignited sample (mineral P content; Pmin) was calculated. The following soluble forms of P were determined in soil samples: available P (PM3) by the Mehlich III method [62], water-soluble P (PW), and easily soluble P (PCaCl2) extracted using a 0.01 mol L−1 CaCl2 solution [63]. All extracted P forms were measured in replicates using an ICP-OES analyzer (iCAP 7400 Thermo Scientific apparatus, Thermo Fisher Scientific Inc., Waltham, MA, USA).
Additionally, the fraction of organic P in humic (Po_HA) and fulvic (Po_FA) acids was determined after extraction with 0.5 mol L−1 NaOH as a sequential analysis step of P compounds according to Kovar [64]. The extracts, after shaking for 6 h, were centrifuged and filtered, then divided into 2 portions: 1. subjected to persulfate digestion to determine total P in solution and 2. acidified to pH 1–1.5 to precipitate humic acids in order to determine the Po_FA in the persulfate digested filtrates. Then, Po_HA was calculated from the difference between total P and Po_FA. The molybdenum blue method [65] was used for P content determination in the extracts, which were measured using the Agilent Technologies Cary 60 UV-Vis Spectrophotometer (Santa Clara, CA, USA).

2.4. Statistics

Results were statistically verified using Statistica 13 [66]. The significance of differences between the mean values in organic horizons was validated using Tukey’s RIR post-hoc test at a confidence level of P < 0.05 separately for both groups of pH: < 5 (dystrophic habitats) and pH > 5 (eutrophic habitats), as well as in both groups of OM: Peat, Moorsh. Statistical relationships among selected properties of Histosols were found using the r-Spearman correlation coefficient at a significance level of P < 0.05. A statistical summary explaining the variation between properties of organic horizons was presented using Principal Component Analysis (PCA) diagrams analyzing the principal components in both habitat groups separately.

3. Results and Discussion

3.1. Soil Basic Characteristics against the Background of Organic Matter Transformations

The evolution of OM in the studied soils leads us to distinguish two types of organic horizons (peat and moorsh), reflecting the direction of the transformations taking place depending on agroecological soil conditions: eutrophic (pH > 5) and dystrophic (pH < 5). These horizon types are distinguished by their different intensities; they are specific to soil types but they have also been identified within a soil profile on the basis of the dominant character of OM transformation. The physical (Table 1), chemical, and physicochemical properties (Figure 1 and Figure 2) reflect the OM transformation, becoming useful indicators of them at the same time.

3.1.1. Physical Properties

The Ac content in the organic horizons of the studied profiles is comparable and increases with the advancement of OM transformation (Figure 1). In the peat (O horizons), it is the lowest, usually assuming values in the range of 30–55%; in the moorsh (M horizons), it increases to about 60–70%, while the highest Ac values are found in the most heavily transformed horizons, in the horizons with mineral admixtures (Ac is more than 70% in them). Following the diversity of Ac content within P1 and P2 profiles, silted and strongly silted organic horizons can be distinguished here. Silted and only occasionally heavily silted horizons were observed in profiles P3–P5 [56].
The Ac content is strongly related to the specific density of the soils [58]. Calculated ρw values exceeded 1.75 g cm−3. Samples with a high ash content (Ac) are often highly compacted. This condition is characterized by low peats of the highly decomposed type [67]. The values of ρo in the organic samples ranged from 0.20 to 0.38 g cm−3 (Table 1). The variability of ρo in the investigated soils is compatible with the tendencies observed for the values of Ac i ρw. The total porosity (Pc), calculated from the ρw and ρo characteristics, generally obtained higher values for peats compared to moorsh and gyttja. However, organic horizons did not obtain values (Pc) exceeding 90% of the soil volume (Table 1). A good numerical index describing the development of the moorshing process is the soil water absorption index (W1), according to Gawlik [68]. The moorsh horizons (M) in the study obtained W1 values ranging from 0.46 to 0.76, which allowed us to classify moorsh into the initial (I), weakly (II), and moderately (III) transformed stages in the P2 and P5 profiles (Table 1). The fiber content after rubbing (B) classifies the peats as the strongly decomposed sapric type [69]. The degrees of peat decomposition, according to von Post, ranged from H4 to H7, and the PI index [57] emphasized only a high degree of peat humification (Table 1).

3.1.2. Chemical and Physicochemical Properties

The pHH2O values presented a wide range in the studied soils: from pH 5.4 to pH 7.5 in the eutrophic habitat (profiles P1–P2) and from pH 3.6 to 5.0 in the dystrophic habitat (P3–P5). This allowed us to classify the organic horizons of P1 and P2 profiles as acidic, slightly acidic, neutral, and basic, while profiles P3–P5 were classified as strongly acidic and acidic.
On the basis of the TOC content, all the studied horizons in the upper parts of profiles may be classified as organic; they contain more than 120 g kg−1 of carbon in soil dry matter. The TOC content in the organic horizons of the soils ranges from 127–436 g kg−1. The strong variation in TOC content between horizons indicates, on the one hand, their siltation [54] and, on the other hand, the development of the moorshing process [56,67]. The TOC content decreases visibly with the progress of mineralization and humification of SOM in peat and moorsh horizons.
The nitrogen (TN) content in peat horizons ranged from 12.8 to 23.3 g kg−1. In the moorsh and gyttjas horizons, lower values of TN were generally observed: from 6.24 to 14.6 g kg−1 (Figure 1).
The studied soils differ considerably in their soil sorption complex structure and properties (Figure 1). In eutrophic conditions, the exchangeable acidity (EA) obtained low values not exceeding 1.8 cmol(+) kg−1 of soil dry matter (with the exception of the Cgg horizon (P1) of 4.55 cmol(+) kg−1). In dystrophic conditions, the EA values were generally higher and ranged from 1.25 to 21.79 cmol(+) kg−1 (data not presented). The capacity of the sorption complex (CEC) was high and ranged from 29.62 to 83.10 cmol(+) kg−1 in P1 and P2 (Figure 1). In profiles P3–P5, the CEC values were much lower, ranging from 12.46 to 26.23 cmol(+) kg−1 in the organic horizons. The BS values in P1 and P2 were well above the 50% value (Figure 1), considered the limit for eutrophic soils. On the other hand, P3 and P4 were characterized by much lower BS values, not exceeding the 50% value, which is typical for soils considered dystrophic [70]. The P5 shows higher BS values; however, due to its low CEC and pH values, it was also included as a dystrophic soil in this study.

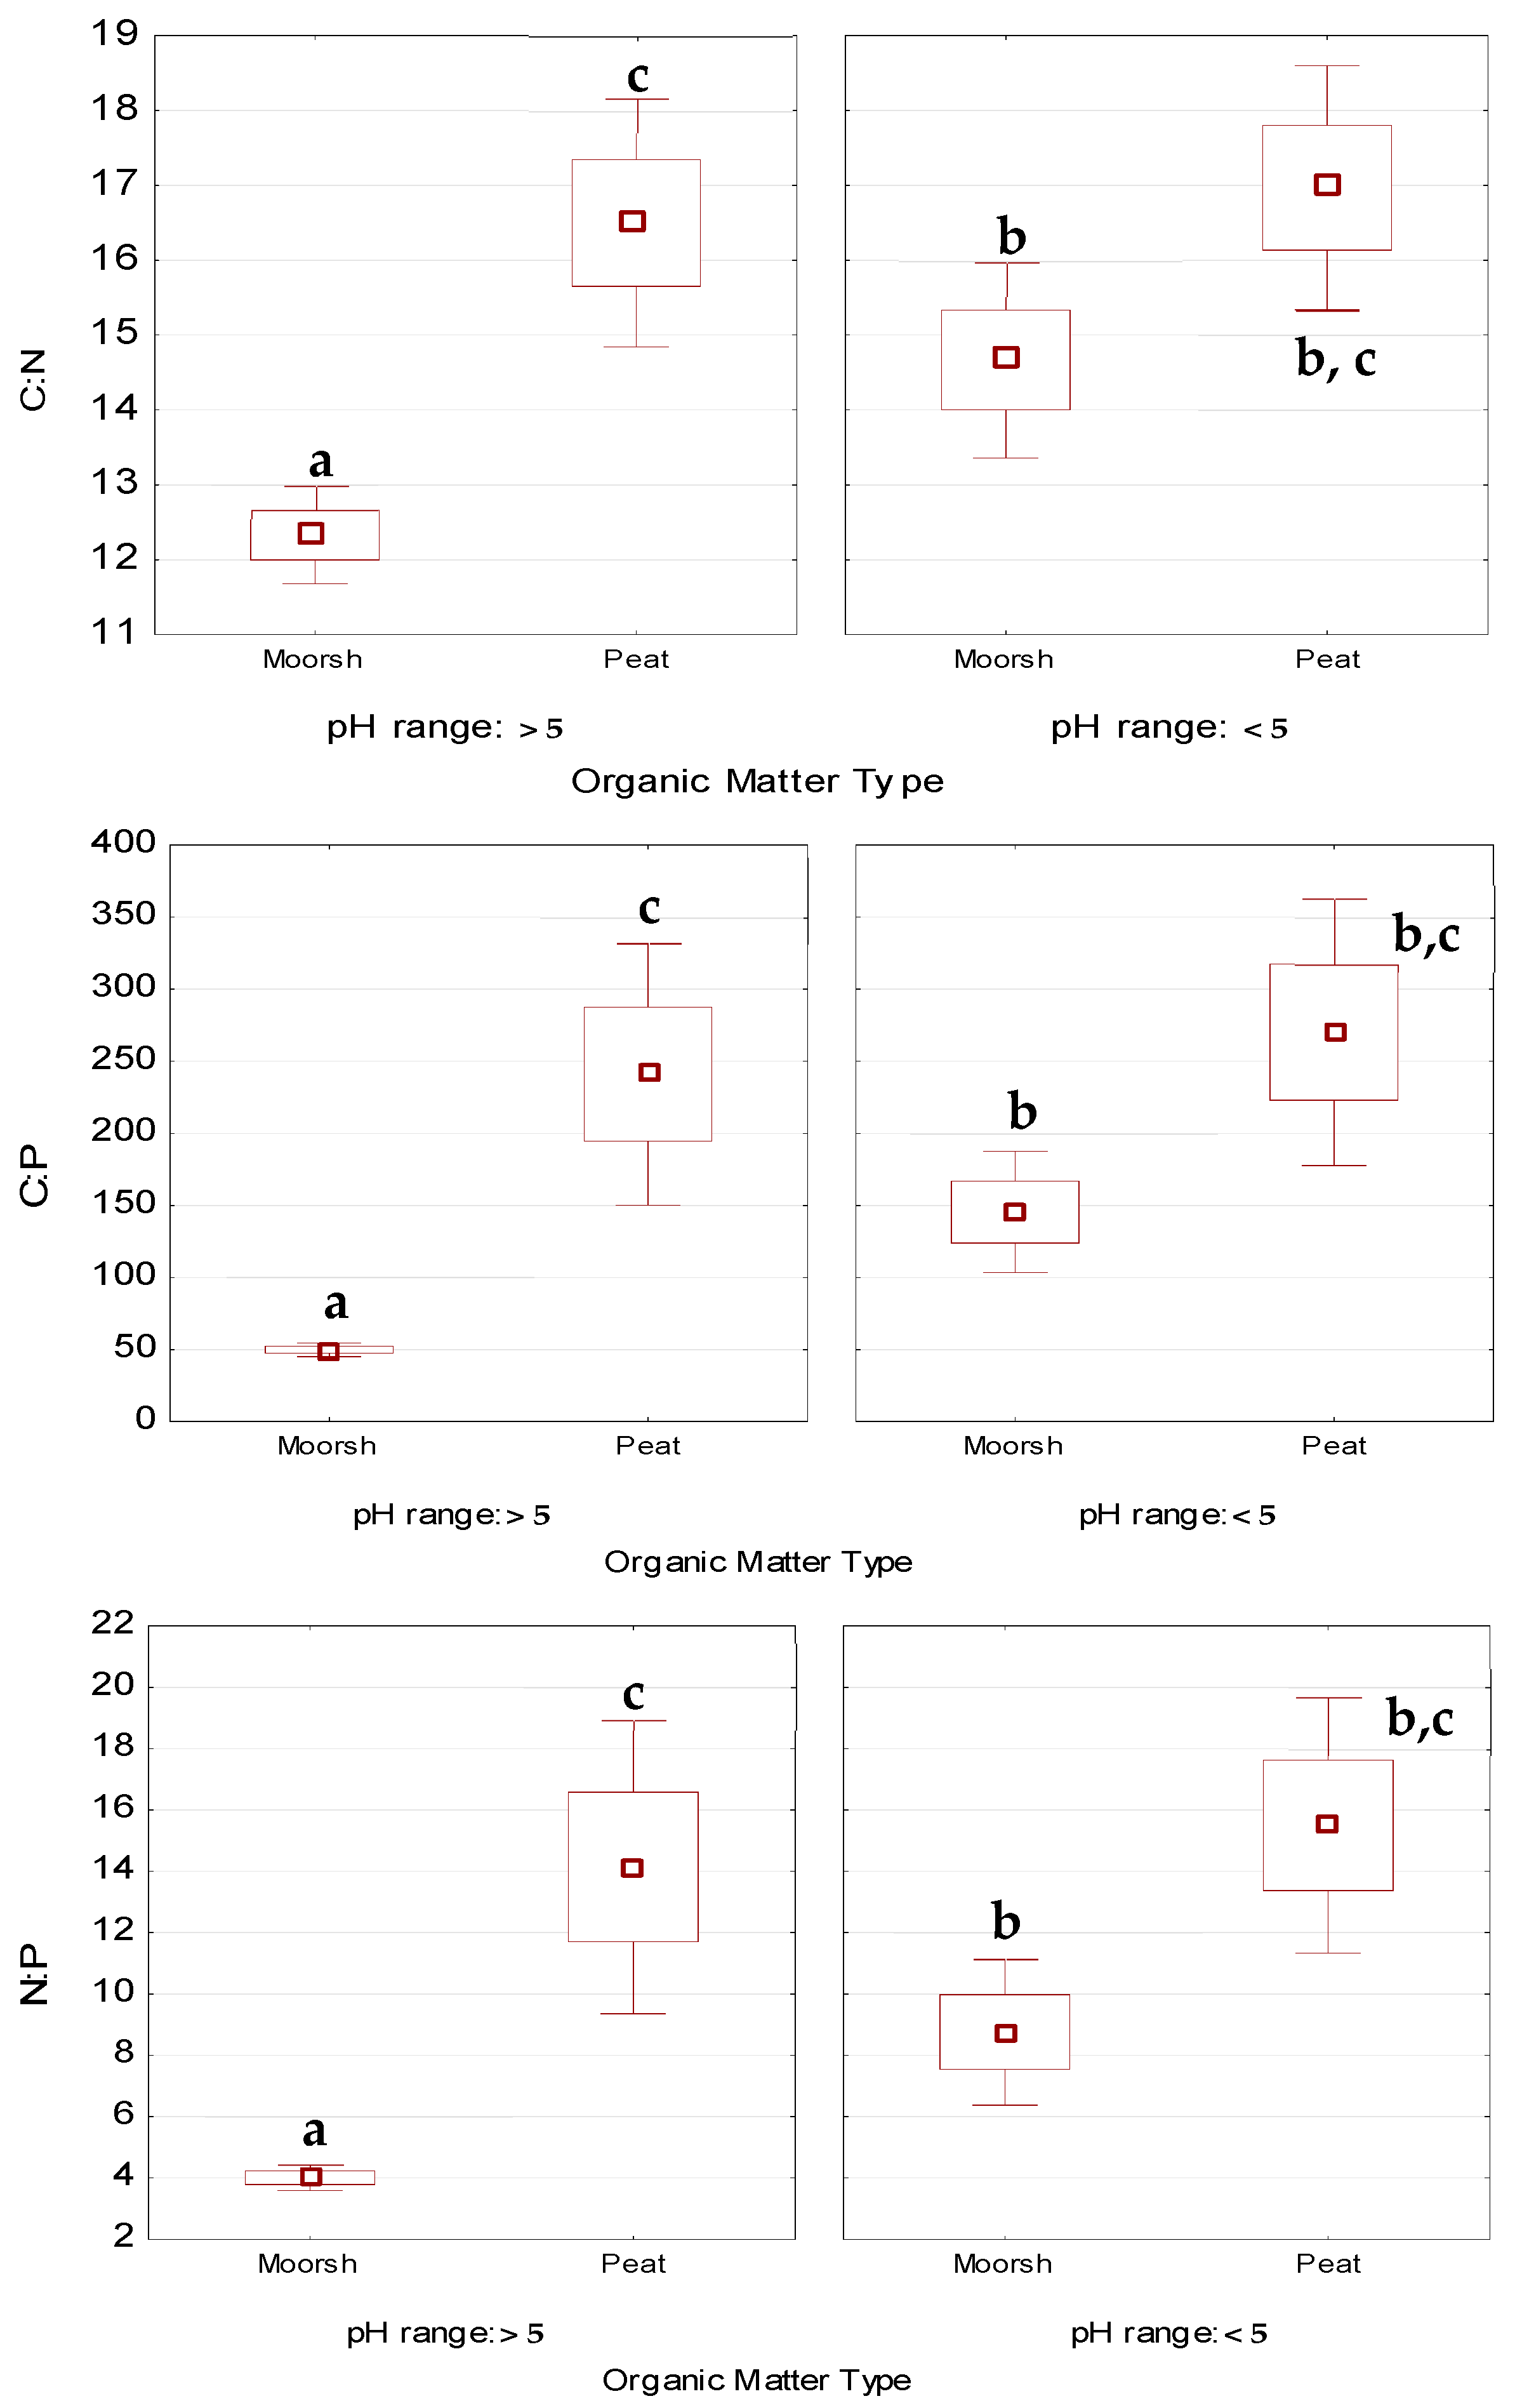
3.1.3. Macronutrient Conversion—C:N, N:P, and C:P Ratios

Macronutrient ratios are closely related to transformations occurring during the mineralization of OM, which lead to the release of mineral components. Soil C evolution is closely related to soil N and P transformations [71,72]. The soil sequestration capacity for N and P must change with increased aeration and pH, as enhanced biological activity promotes C loss and peat humification [72]. For this reason, the C:N, C:P, and N:P ratios constitute a good illustration of OM transformation. Their values decrease with the advancement of OM transformation (Figure 2). The C:N ratio for P1 and P2 (pH > 5) in peat (O) horizons is usually 15–20; in moorsh (M) horizons, it is lower (12–14). In pH < 5 (P3–P5), the C:N ratio takes on similar values and is also lower in the M horizons than in the peat horizons, indicating a higher rate of OM mineralization, which is often more oxygenated [50,73,74]. The differences observed between the O and M horizons in both pH groups are of statistical significance, as confirmed by the Tukey test (Figure 2). Comparable C:N values in organic soils have been reported in other studies [72,75].
The C:P ratio is indicative of the soil’s capability to accumulate OM and sequester P in SOM [71,72]. The C:P ratio shows a high sensitivity to the pH conditions of the environment so that in eutrophic soils with pH > 5, the highest values for peat (O) horizons (163–356) decrease significantly to 46–57 in the moorsh (M) horizons. In dystrophic soils with pH < 5, similar values were obtained for the C:P ratio in peats (225–332); in moorsh, this value decreased to 107–175.5; however, these are much higher values compared to M horizons with pH > 5. This indicates that OM under acidic conditions is much more stable and less chemically active so that the release of organic P from organic linkages is less intense in acidic moorsh horizons than in eutrophic horizons (higher pH). In an acidic environment, OM is much slower to decompose in comparison to neutral or alkaline conditions. When the pH is rather low, fungi play a crucial role in OM decomposition, which is reflected in the high values of the C:N ratio. In a neutral or more alkaline environment, microbial activity is higher; therefore, the transformation of OM may occur more rapidly. Lower values of the C:N ratio as well as faster release of P from organic residues may be the result of this phenomenon [76]. However, it is also worth taking into account that these processes are overlaid by the individual characteristics of organic soils, where anaerobic conditions occurring continuously or periodically may also significantly modify these conversions. The low values of the C:N ratio in peat soils may also be the result of a diverse vegetation type, as reported in other studies [77]. Similar trends are found for the N:P ratio, the values of which become narrower with the progress of OM transformation and are more stable in the dystrophic soils with pH < 5. In the peat horizons, the N:P ratio is 10–20 for pH > 5 and 13.5–18.8 for pH < 5, which is not a significant difference among this type of OM, peat (Figure 2). In the moorsh horizons, the ratio decreases to 3.8–4.4 in eutrophic soils (pH > 5), while in dystrophic soils (pH < 5), it takes on about two times higher values, which makes the difference statistically significant (Figure 2).

3.2. Phosphorus Behavior in Histosols

3.2.1. Phosphorus Forms

The content of P forms and transformations in the eutrophic soils (P1 and P2) has been discussed in detail in previous work [55]. For the purposes of the present study, only a comparison of these data is presented with the results obtained for the soils of dystrophic habitat (Table 2), where the organic soils differ significantly in characteristics. The transformation of P forms is therefore significantly different in these two groups of soils. The content of total P in both of these groups shows similar trends, slightly increasing with OM transformations; within the profiles, its content decreases with depth.
The behavior of the different forms of P varies significantly in the studied groups of soils—no or very weak trends were observed in acidic soils compared to soils with higher pH. The Po content shows no clear trends. The bioavailable P content (PM3), which increases with the progression of OM mineralization, is less marked in soils with a pH > 5 but it is still observed (Table 2). In profile terms, the higher values of PM3 are found in the upper horizons of all soils, which are released from OM and are more heavily processed in these parts of the profiles. The readily soluble forms of P—PCaCl2 and PW—behave similarly. In acidic peats, the content of these P forms is higher by about two times compared to peat horizons of pH > 5. In the moorsh soils, the PCaCl2 values for both groups are similar, whereas PW is released in significantly smaller amounts in the moorsh of dystrophic soils. This is related to the occurrence of P immobilized as bound to Al- and Fe-oxides at pH conditions < 5, as well as to the significantly lower concentration of Ca ions in these soils and also the lower chemical activity of OM components in these conditions. At the same time, in dystrophic conditions, an increase in the release of soluble forms of P can be observed as the transformation of OM progresses. This can be explained by the negatively charged organic molecules decomposed with SOM mineralization, which can compete with P for the adsorption sites available in Al- and Fe-oxides [78,79,80,81,82]. Then, the elevated OM occurrence can lead to a decrease in the P fixation degree of soil particles and create conditions to increase the P solubility and higher mobility in soil.

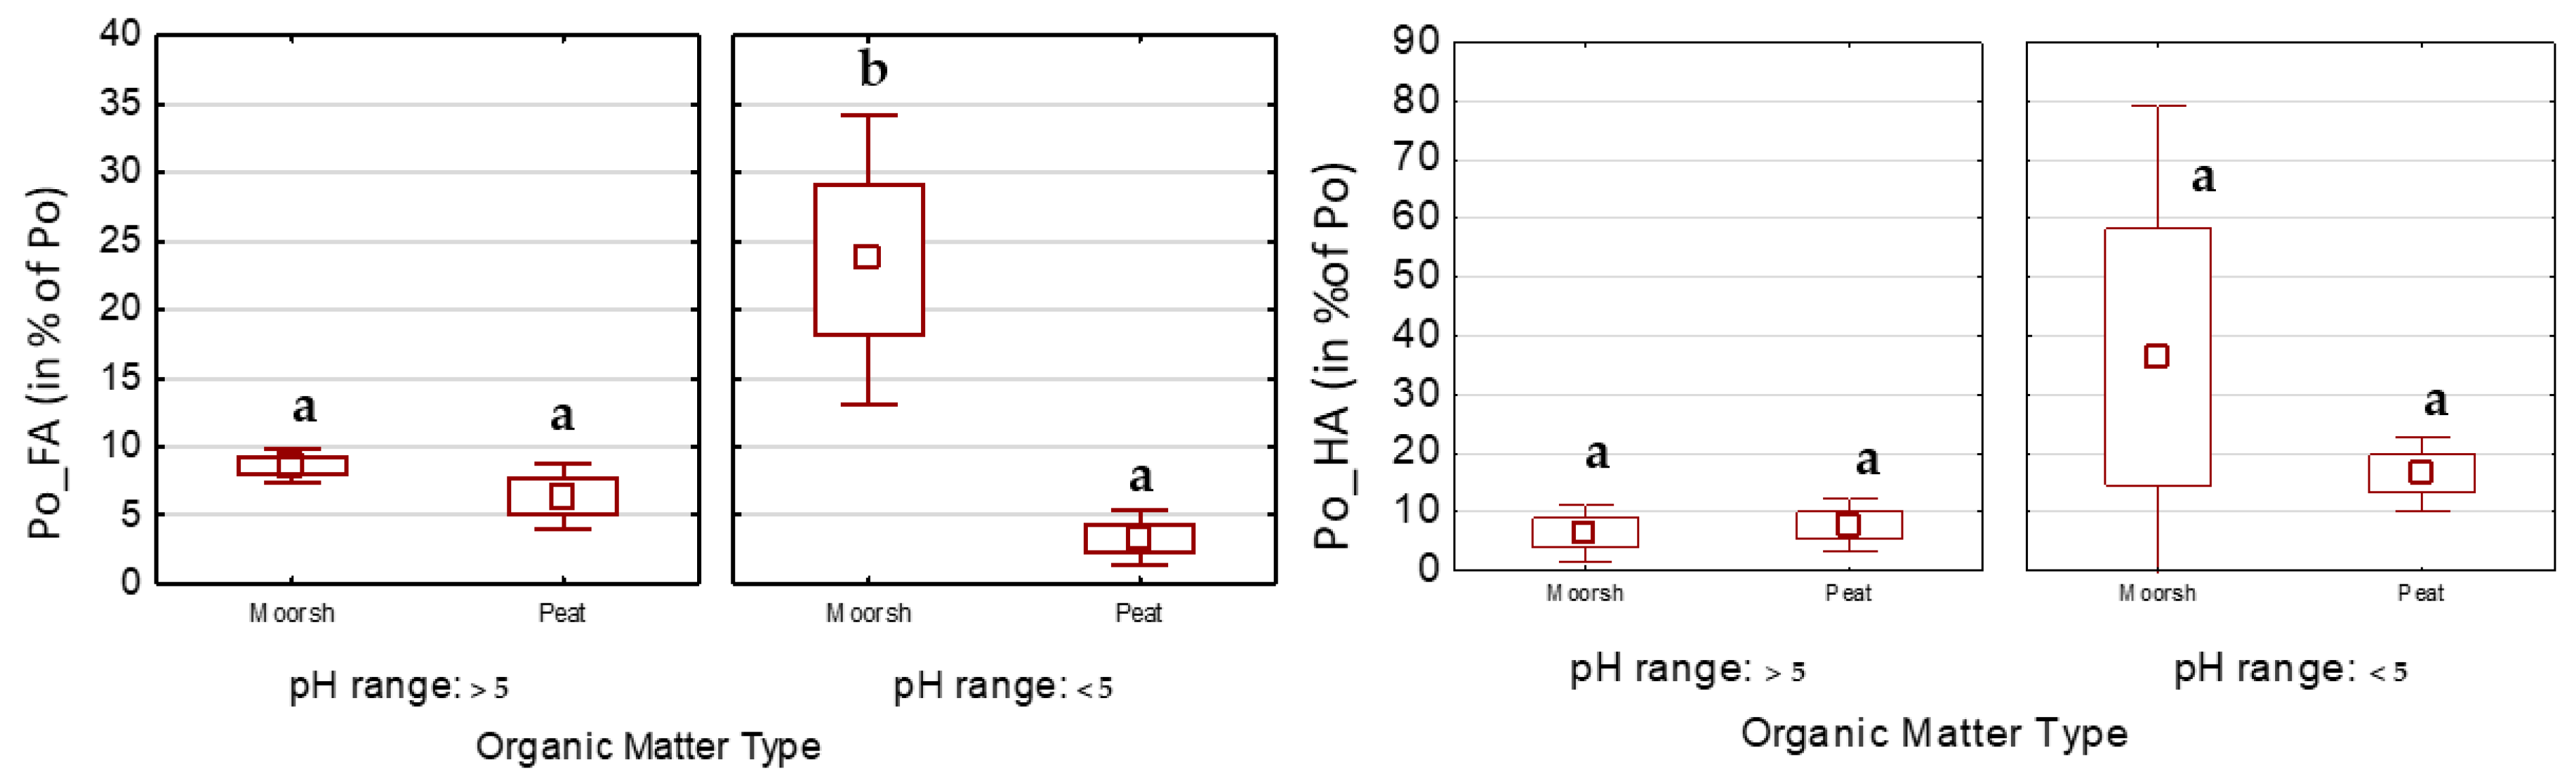
3.2.2. Retention of P in Humic and Fulvic Acids

In the studied soils (P1–P5), the Po content in HS ranged from 6.9 to 99.4% of Po, which means from 4.3% to 56.6% of Pt (Table 3). A lower proportion of Po (Po_HA + FA) was observed in eutrophic soils (pH > 5)—from 9.3 to 28.6% of Po. In dystrophic soils (pH < 5), the HS contained a much higher proportion of Po, from 6.9 to 99.4% of Po (Table 3).
Humic acids (Po_HA) play a main role in the retention of P in comparison to fulvic acids (Po_FA) in most peat horizons (O) (Table 3, Figure 3). Of particular note, however, is the strongly dominant role of humic acids (HA) in Po retention, especially in peats with pH < 5, where Po_HA accounted for 5.5–32.0% of Po (4.0–19.1% of Pt), while Po_FA in O horizons ranged only between 0.9–8.1% of Po (0.66–5% of Pt) (Table 3). In eutrophic soils (pH > 5), this proportion was not so significant (Figure 3).
Among the many individual properties of HS, the activity of HS depends essentially on the functional groups affecting total acidity [5,6,83,84,85]. The most predominant are the phenolic (–OH) and carboxylic (–COOH) groups [44,47]. Phenolic functional groups chelate multivalent metal ions, such as Fe3+ and Al3+; carboxyl functional groups bind mainly Ca2+ [27,85]. In these functional groups, hydrogen is highly reactive and determines the ion-exchange potential, so their reactivity at different pHs varies significantly. HS has a significant ability to form complex and intracomplex (chelate) compounds with Fe and Al, as well as with Cu and other polyvalent cations [86]. In a more acidic environment, when the pH is below 5, HAs form mostly complex compounds with metals, while FAs form in neutral and alkaline media [87]. HS forms binary complexes with cations and ternary complexes with anions, including phosphate, via cation bridging [27,45,88]. The formation of the ternary OM-cations-phosphate complexes is highly dependent on the structures of OM, the location of acidic functional groups, and pH [27,34,38]. The chelation reaction prevails when the soil pH increases to the conditions suitable for the ionization of the phenolic groups [83]. Although FA has higher total acidity values than HA, the substantially larger molecules and more complex structures of HA are more effective than FA in complexation or chelation [89].
The percentage of Po_FA in organic horizons of eutrophic soils ranged from 3.5–11.1% of Po and generally increased in moorsh horizons: P1 (3.5–8.7% of Po) < P2 (7.3–11.1% of Po), as well as with the depth in each profile, i.e., with the advancement of OM transformation in profile (Table 3). In dystrophic soils, such a trend is also evident: P3 (0.9–6.8% of Po) < P4 (1.3–8.1% of Po) < P5 (17.1–34.3% of Po) and the content of Po_FA fell within a wider range, from 0.9 to 34.4% of Po (Table 3), giving the significant difference between peat and moorsh horizons (Figure 3).
In a dystrophic habitat, we observed significantly higher Po_HA values (5.5–80% of Po) than in eutrophic habitat (1.6–18.2% of Po). The percentage of Po_HA generally increased deeper into the soil profile in both groups of soils but only in peat horizons (Table 3). No clear pattern was observed in the moorsh layers. Po retention in HA was higher in the moorsh layers in pH < 5 and it ranged from 11.6 to 79.9% of Po than in moorsh in pH > 5, where the proportion of Po in HA (P5) was much lower: 2.1–10.53% (Table 3). The Tukey test did not confirm the significance of the observed differences between OM types (peat and moorsh) and between soils of different habitats (Figure 3).
Previous studies on the distribution of Po in FA and HA provide very inconclusive and contradictory results. In some of them, Po dominates in FA, in other studies, no dominant role of either fraction has been shown but there are also reports of Po dominating in HA [48,90,91,92]. These relationships are discussed more extensively by Makarov and Malysheva [48]. In their study, in acidic soils, the major part of extracted Po is bound to HA and Po in FA dominates in neutral and calcareous soils. Herein, it is highly relevant that the condition-dependent behavior of Po, like inorganic P, is associated with different metals in acidic and neutral soils. This interaction probably governs its distribution among the HA and FA, depending on soil acidity. In acidic soils, organophosphates are stabilized as Fa and Al compounds, while iron inositol hexaphosphates (the most abundant organophosphorus compound in soils) are insoluble in acidic environments and move to the HA during humus fractionation. Calcium inositol hexaphosphates in neutral soils, on the contrary, are acid-soluble and convert to FA [48]. Soil inositol phosphates are considered to be mainly bound in high-molecular compounds to SOM [90,93] after [48]. Makarov and Malysheva [48] showed in their study that the distribution of Po in HA and FA depends on the interaction of Po with Fe and Al in acidic soils, with Ca and Mg in neutral and calcareous soils, and on the solubility of the resulting compounds in the acid-base system (strongly dependent on the methodological approaches used in SOM fractionation). In acidic soils, bonds with Fe and Al (which reduce the acid solubility of organophosphates) are broken; hence, the Po content in HA decreases and the Po content in FA increases. When the bonds with Ca and Mg are broken, the solubility of Po does not change, which determines the lower impact of the chemical effect of Po redistribution between the acid groups of humus in neutral soil.

3.3. Relationships between Organic P in Fulvic and Humic Acids and Selected Properties of the Histosols Studied

The Po content in HA and FA clearly depended on habitat quality and OM type (Figure 3). The r-Spearman’s correlation coefficients showed very different relationships for these two variables and selected properties of soils in groups: pH > 5 and pH < 5 (Table 4), confirming the different effects of OM evolution on P retention and transformation depending on pH conditions.
Statistically significant correlations were only shown for Po in fulvic acids (Po_FA). However, no correlations were confirmed for Po_HA in the Histosols studied. Strongly positive correlations were confirmed between Po_FA and all forms of P in the eutrophic soils (pH > 5) (Table 4). In soils with pH < 5, no such significant relationships were confirmed, indicating the important influence of FA on P behavior in Histosols especially under conditions of pH > 5. Also, the Po_FA content was significantly positively correlated with pH and negatively with macronutrient ratios in both groups of pH (Table 4).
The explanation for the above observations is probably related to the OM content that decreases as a result of mineralization during the moorshing process. The proportion of different nutrients, including different forms of P, released into the soil rises during the transformation of OM, increasing their availability and mobility. Thus, their increased content (with lowered C:N, C:P, and N:P ratios) goes along with the higher content of Po_FA. This may be an effect of releasing P and the low-molecular-weight fulvic fraction from OM, even at the initial stages of OM chemical transformation. The amount of Po can also follow the same trend as a result of the release of whole organic molecules containing P as a component.
Under conditions of pH > 5, phosphorus commonly exists as calcium phosphates, which are relatively insoluble in neutral to alkaline soils.
However, OM can be in a complex with calcium and magnesium, potentially increasing the phosphorus availability by preventing the formation of insoluble calcium phosphate. The strong positive correlation between the majority of P forms and Po_FA in the soils in eutrophic habitats can support the above. In relation to Histosols in eutrophic habitats (pH > 5), higher nutrient levels and favorable microbial activity conditions enhance the decomposition and transformation of OM, leading to greater P release. This process is facilitated by the formation of HS that can bind metals, increasing P availability. In contrast, dystrophic Histosols (pH < 5), characterized by lower nutrient levels and more acidic conditions, exhibit slower OM decomposition. Lower microbial activity and higher acidity lead to greater P fixation through binding with Fe and Al. In acidic soils (pH < 5), although P commonly binds with Fe- and Al-oxides, organic acids from decomposing OM can increase P availability by complexing these metals. There are some studies supporting such mechanisms, indicating the critical role of soil pH and OM quality in phosphorus dynamics [94,95,96,97]. Likewise, Reddy et al. [98] and Stevenson [85] support these observations, highlighting the critical role of OM transformation and habitat nutrient status in P dynamics in Histosols.

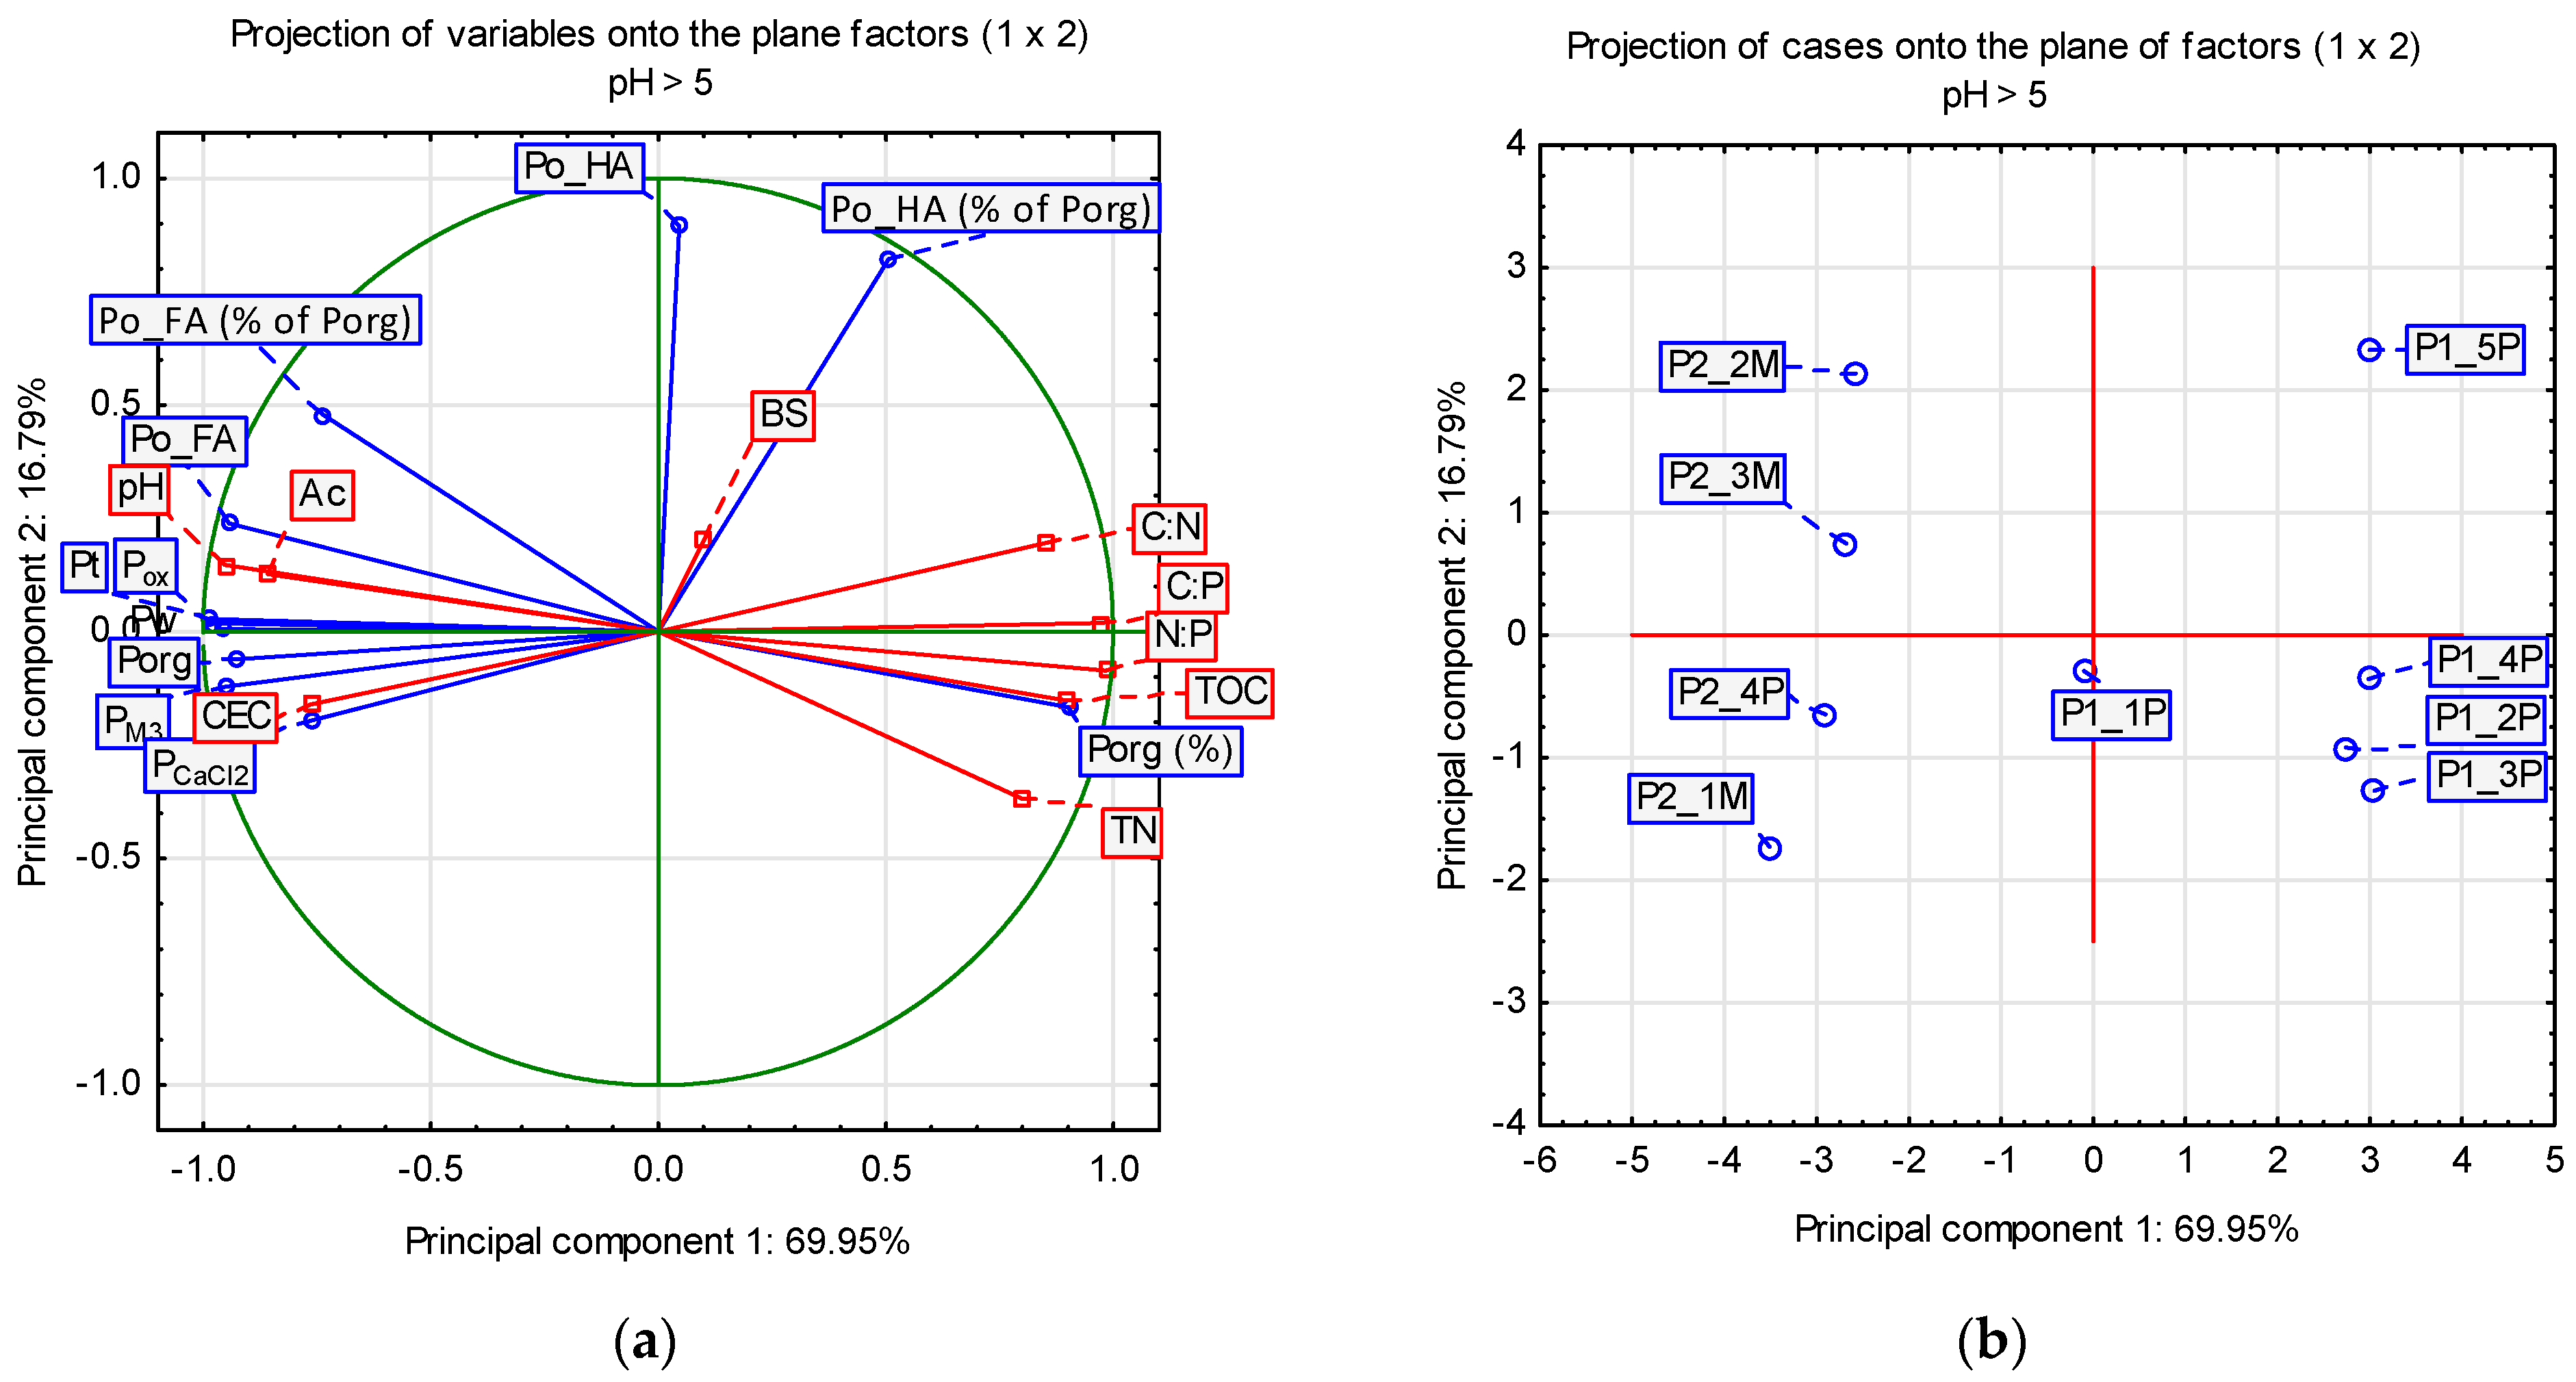
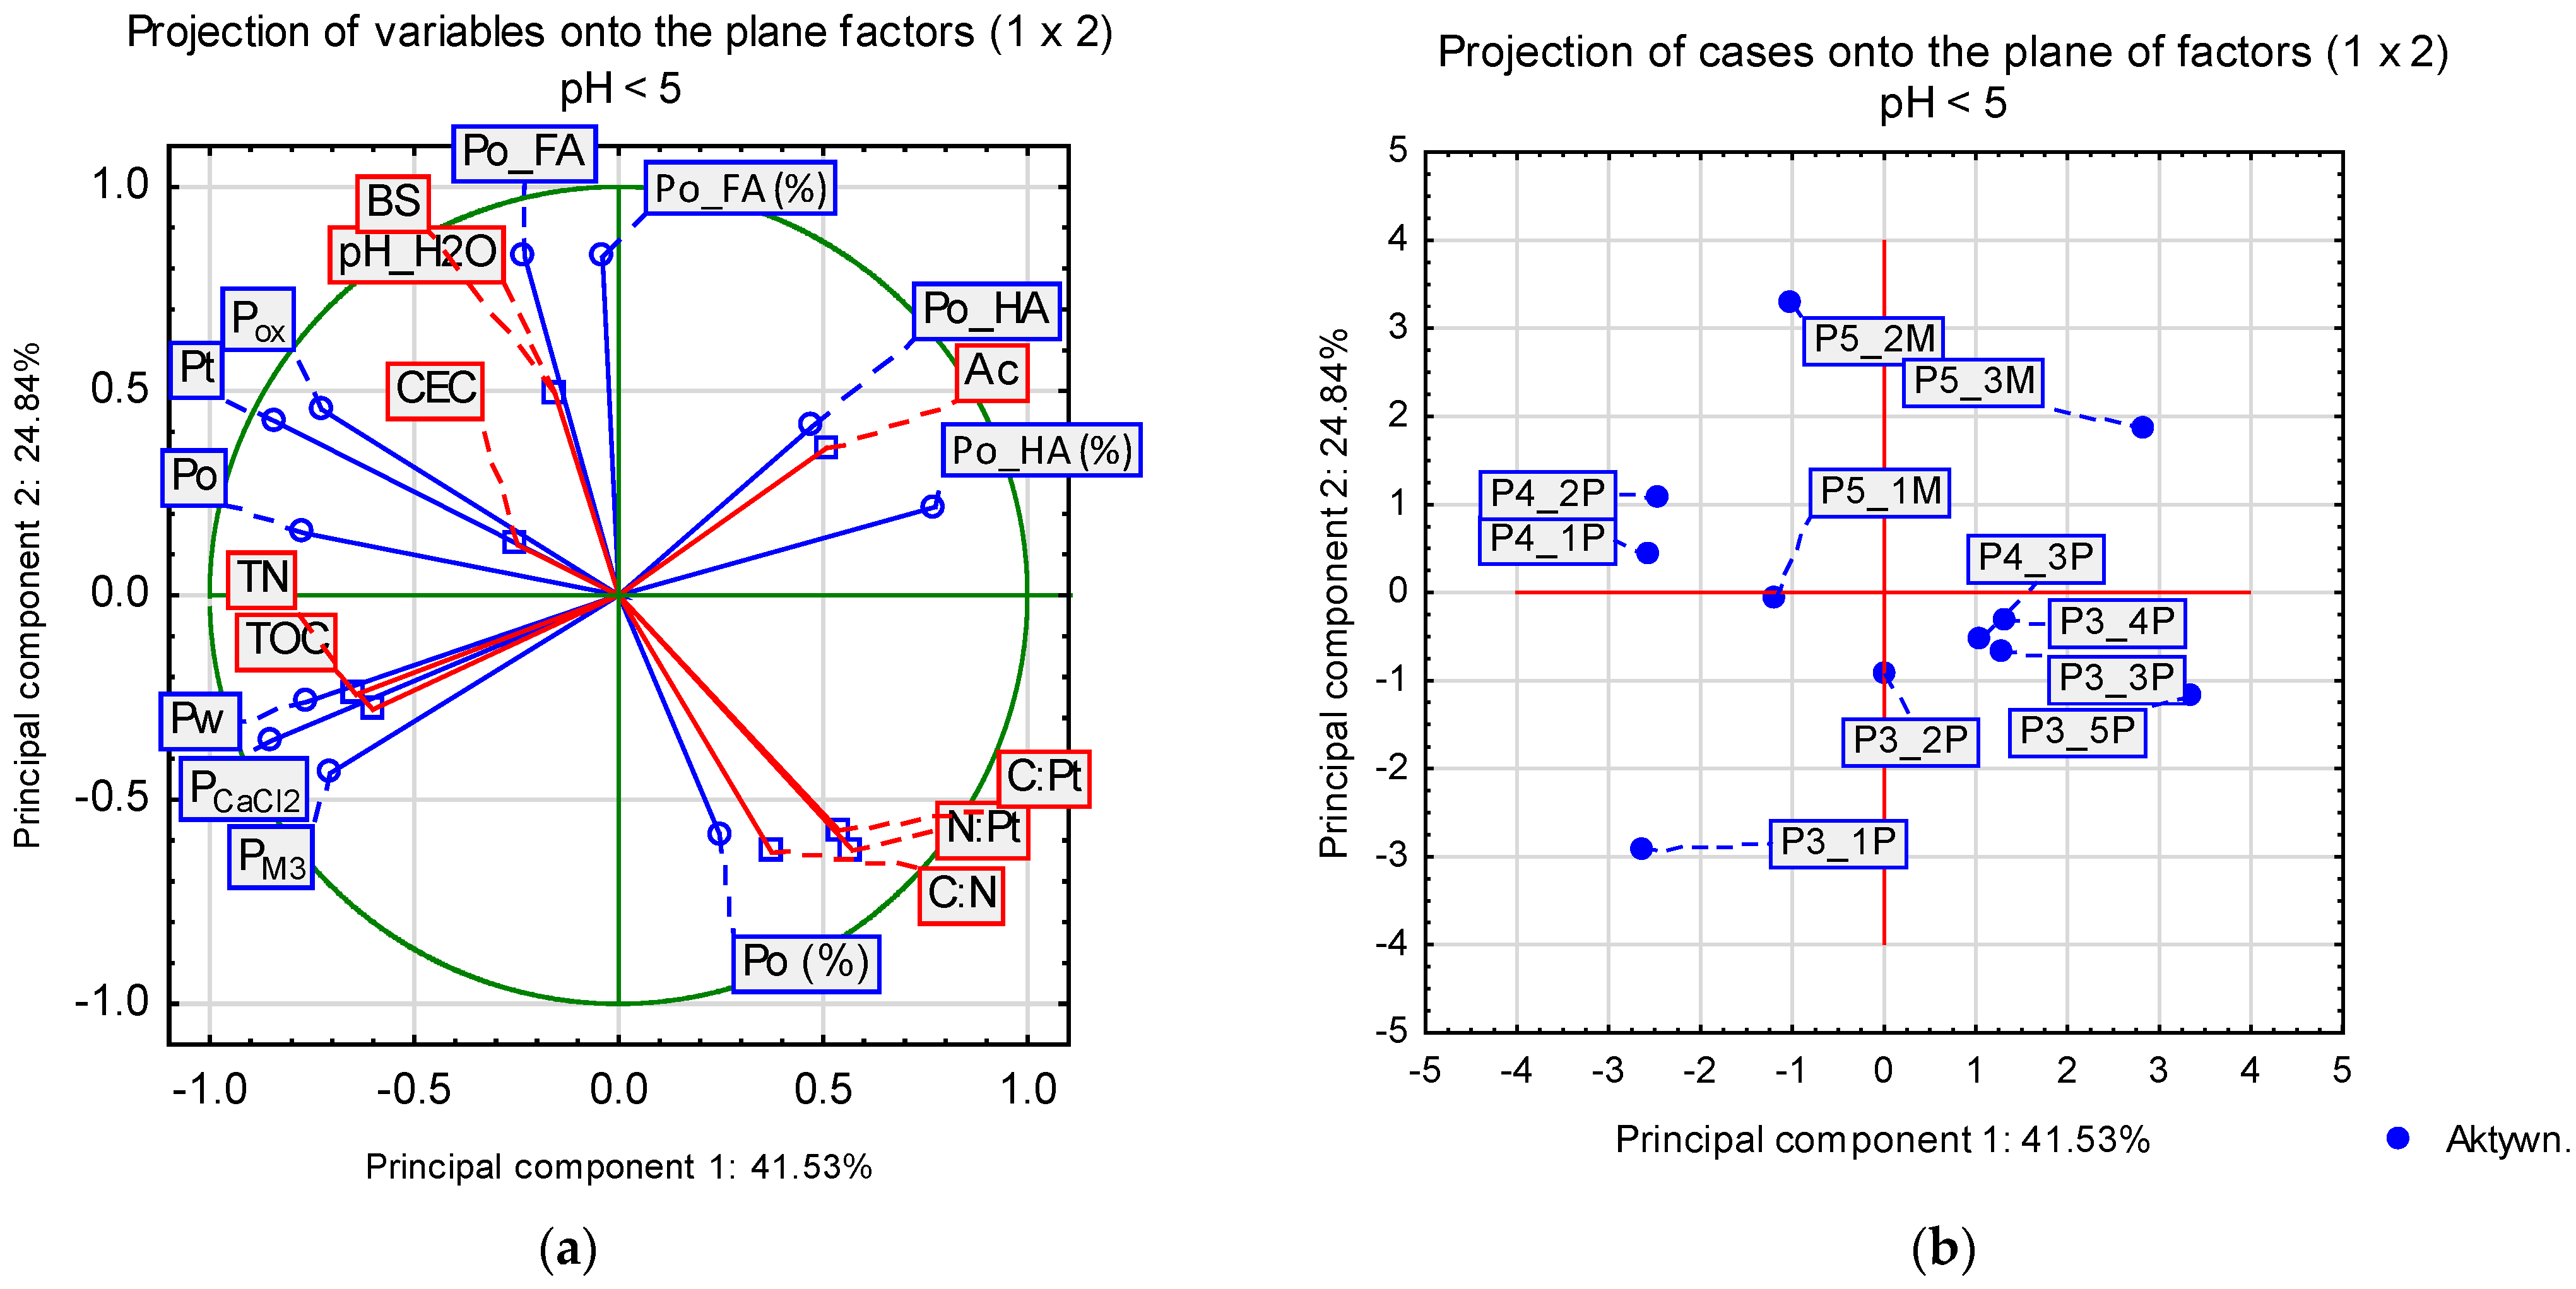
3.4. Principal Component Analysis on the Main Factors Governing the Connections between Organic Matter Transformations and Phosphorus Retention in Eutrophic (pH > 5) and Dystrophic (pH < 5) Histosols

The PCA diagrams presented below for eutrophic (Figure 4) and dystrophic (Figure 5) soils provide a representation of the relationships between the organic horizons of the studied soils and an indication of the variables that potentially best describe each sample. The distribution of the measured characteristics in terms of their relationship to the principal components (PC1 and PC2) included in the two-dimensional PCA representation explains, to some extent, the total variation occurring between the analyzed samples. PC1 and PC2 explain, in eutrophic (pH > 5) soils, 86.74% (69.95% for PC1 + 16.79% for PC2) and, in dystrophic (pH < 5) soils, 66.21% (40.76% for PC1 + 25.45% for PC2) of the total variation between selected properties of organic horizons. In eutrophic soils, C:P, N:P, C:N, TOC, Po (%), Ac, pH, and most P forms (Pt, Po, POX, PW, PM3) provide the largest contribution to PC1, while Po_HA and Po_FA (%) are the properties contributing the most to PC2. In poor dystrophic environments, Po, PW, PCaCl2, PM3, and Po_HA (%) are the main contributors to PC1, while Po (%), C:N, N:P, C:P, and Po_FA and Po_FA (%) are the most important in PC2.
The longer vectors of variables give better explanations for the variability among organic horizons than the shorter ones. In eutrophic soils, longer vectors are much more abundant than in dystrophic soils (Figure 4). Vectors situated closer to each other indicate variables that may have a strong positive correlation, whereas vectors that form an angle closer to 180° may have a negative linear correlation. On the PC1–PC2 coordinate space in eutrophic soils (Figure 4a), two main groups of positively correlated vectors can be distinguished and among the first are all the P forms located in the diagram close to AC, pH, CEC, and Po_FA, indicating the existence of a relationship between increasing AC and CEC (according to OM mineralization progression) and increasing the content of P forms. This relationship was observed and discussed in a previous study [55]. A positive correlation with Po_FA was also distinguished in this group, which indicates the important role of fulvic acids in P retention and was confirmed by the correlation coefficient in these soils (Table 4). The second group of positively correlated characteristics includes C:N, C:P, N:P, TOC, Po (%), and TN. These specific variables are strongly combined with the transformation of OM, which is why the ratios lowered substantially along with the content of TOC and TN in moorsh horizons. Therefore, all variables in this group show strong negative relations with the previous group of properties (Figure 4a). In the PCA diagram for cases of eutrophic soils (Figure 4b), peat (P1) and moorsh horizons (P2) are generally clearly divided into two groups: on the left, moorsh horizons (including the peat layer, the deepest organic horizon in P2—P2_4P) and on the right, peat horizons. Such a distribution of studied cases is related to the higher content of P forms (particularly P labile forms), increased Ac content, substantially lower macronutrient ratios, and TOC and TN content in moorsh layers in comparison to peat. The peat horizon in profile P2 was included here in the moorsh OM type due to its specific properties being comparable to those of moorsh horizons that may indicate the beginning of OM transformation and the start of the moorshing process in the P2_4P.
Although the peat horizons in P1 are separately placed in the diagram, the middle part of the profile shows much more coherence than the surface and is the deepest horizon in this profile (Figure 4b). The surface peat horizon (P1_1P) of this profile, which occupies a distinct position in the diagram—in between the two OM types—has particularly different characteristics. Due to seasonal fluctuations in the water level and periodically arising aerobic conditions, peat decomposition and the initiation of mineralization may begin, as confirmed by the results obtained previously [55].
Clearly, inverse relationships between P form content, Ac content, TOC, C:N, C:P, and N:P were shown. It is also confirmed with correlation coefficients (Table 4) that as the proportion of macronutrients decreases, which is most often related to an intense loss of TOC. The Po_FA content increases concomitantly with the release of macronutrients from OM, as reflected by the decreasing C:N, C:P, and N:P ratios. This indicates an important role for FA in P retention during the transformation of OM in soils in eutrophic conditions.
In dystrophic Histosols, the main component variables explain the variation between them to a weaker extent (66.21%). However, we can distinguish certain groups of vectors indicating close relationships between variables in the organic horizons of these soils; these are often relationships of only moderately strong character. The first includes C:P, N:P, C:N, and % of Po; the next group includes TOC, TN, and the mobile forms of P—PM3, PCaCl2, and PW; and then we have Po, Pt, and POX, which are in negative relationships to the first above-mentioned. A negative relationship is also shown between these variables (macronutrient ratios, Po in %) and Po_FA, BS, and pH. The other strong negative correlations are shown between the content of Ac and Po_HA and the second group mentioned earlier, PM3, PCaCl2, PW, TOC, and TN. Most of these negative relationships were also present in eutrophic soils. Nevertheless, Ac, TOC, and TN behave differently at pH < 5 and reveal inverse relationships. The behavior of soluble P forms is also different in these soils, which are not negatively correlated with macronutrient ratios and Po (%), as was seen in eutrophic soils, in which all P forms as well as Po_FA showed strongly negative correlations with C:N, C:P, N:P, TOC, and TN. These discrepancies have a clear link to differences in OM activity in relation to pH and soil fertility.
The differences between the two habitat types are also apparent in the distribution of the organic horizons in the PCA diagrams (Figure 4b and Figure 5b). The distinctness of the groups in the eutrophic soils (Figure 4b), indicating the type of OM: peat (P1) and moorsh (P2), as already mentioned above, is much more pronounced. We can also identify some groups in the dystrophic soils but they are far less distinct. The first group is the moorsh horizons of P5, which are placed relatively close to each other in the same quarters as Po_FA, Po_HA, and also (of the lower meaning) Ac, BS, and pH. We can also distinguish two groups of peat horizons: the first includes the peat horizons of the middle parts of profiles P3 and P4, distinguished by clearly similar C:N, C:P, N:P, and Po (%) values, which are high in these materials. In the second peat group, we can include most of the upper peat horizons of P3 and P4, which are essentially accumulative horizons that are often in the aerobic zone, allowing OM to undergo gradual mineralization. Hence, a higher P fraction (including soluble P) is observed in these horizons. These distinguishing variables may indicate more advanced P transformations in the upper horizons as a result of more intense OM transformations.

4. Conclusions

Depending on eutrophic or dystrophic soil conditions, investigated peat and moorsh reflect the direction of OM transformations, in which advancement was expressed in changes in basic soil properties. The progress of mineralization and humification of OM in peat and moorsh is closely linked to increased microbial activity and therefore manifests in visibly greater changes in eutrophic habitats than in dystrophic and acidic ones.
A significant influence of OM and its transformation on P retention as well as the content of its different forms was demonstrated. The higher values of available and soluble P found in the upper organic horizons may be related to the release of OM constituents in those parts of the profiles with stronger OM decomposition. Under dystrophic conditions, P release was slower, due to the immobilization of P on Al and Fe oxides at pH < 5, as well as the lower chemical activity of highly saturated functional groups in OM components under these conditions.
The important role of OM in the retention of P in the investigated soils is also reflected in the activity of HS and varies according to habitat conditions. HS contained a significantly higher percentage of Po in dystrophic than in eutrophic histosols. Humic acids played a major role in P retention compared to fulvic acids in most peat (O) horizons, especially at pH < 5. Meanwhile, the Po_FA in the organic horizons of eutrophic soils increased with the advancement in OM transformation—in the moorsh levels and with depth in each profile. This indicates an important role of FA in P retention during OM transformation in soils, especially under eutrophic conditions.
The variable role of OM in P retention depending on soil environmental conditions and OM type may have important applications not only in areas of natural importance, for which the release of mobile P forms may pose a threat, but also in agricultural areas where, for a change, we struggle to increase P availability. In light of global problems with limited phosphate resources, this points in the direction of future research.

Supplementary Materials

The following supporting information can be downloaded at https://www.mdpi.com/article/10.3390/agronomy14081688/s1. Table S1: Soil profile morphology, location, and classification.

Funding

This research was funded by the Wrocław University of Environmental and Life Sciences (Poland) as part of the PhD research program “MISTRZ”, No. N090/003/22. The APC was funded by the Institute of Soil Science, Plant Nutrition, and Environmental Protection (Wrocław University of Environmental and Life Sciences) from a subsidy from the Ministry of Education and Science of Poland.

Data Availability Statement

The original contributions presented in the study are included in the article and Supplementary Materials. Further inquiries can be directed to the author.

Acknowledgments

I would like to express my gratitude to Adam Bogacz for his support in field research and laboratory studies and for advice on the interpretation of some results. I am also very grateful to Elżbieta Jamroz for her help, continuous support, and critical comments on the preliminary version of the manuscript. I also highly appreciated the assistance and support received from the technical personnel of the Institute of Soil Science, Plant Nutrition, and Environmental Protection (WUELS).

Conflicts of Interest

The author declares no conflict of interest.

References

  1. Bai, Y.; Weng, L.; Hiemstra, T. Interaction of fulvic acid with soil organo-mineral nano-aggregates and corresponding phosphate release. Geoderma 2024, 441, 116737. [Google Scholar] [CrossRef]
  2. Murphy, B. Key soil functional properties affected by soil organic matter-Evidence from published literature. IOP Conf. Ser. Earth Environ. Sci. 2015, 25, 012008. [Google Scholar] [CrossRef]
  3. Whitbread, A.M. Soil Organic Matter: Its Fractionation and Role in Soil Structure. In Proceedings of the Soil Organic Matter Management for Sustainable Agriculture, Ubon, Thailand, 24–26 August 1994. [Google Scholar]
  4. Chenu, C.; Angers, D.A.; Barré, P.; Derrien, D.; Arrouays, D.; Balesdent, J. Increasing organic stocks in agricultural soils: Knowledge gaps and potential innovations. Soil Tillage Res. 2019, 188, 41–52. [Google Scholar] [CrossRef]
  5. Weber, J.; Chen, Y.; Jamroz, E.; Miano, T. Preface: Humic substances in the environment. J. Soils Sediments 2018, 18, 2665–2667. [Google Scholar] [CrossRef]
  6. Jamroz, E.; Jerzykiewicz, M. Humic fractions as indicators of soil organic matter responses to clear-cutting in mountain and lowland conditions of southwestern Poland. Land Degrad. Dev. 2022, 33, 368–378. [Google Scholar] [CrossRef]
  7. Obalum, S.E.; Chibuike, G.U.; Peth, S.; Ouyang, Y. Soil organic matter as sole indicator of soil degradation. Environ. Monit. Assess. 2017, 189, 176. [Google Scholar] [CrossRef]
  8. Martin, M.; Celi, L.; Bonifacio, E.; Nardi, S.; Barberis, E. Characteristics of soil organic matter in a limnic histosol of the alpine morainic system. Soil Sci. 2006, 171, 527–540. [Google Scholar] [CrossRef]
  9. Pu, Y.; Luo, Y.; Zhang, S.; Li, T.; Yuan, D.; Xu, X.; Qian, H.; Wang, G.; Jia, Y.; Li, Y. Transformation of phosphorus forms and its regulation on phosphorus availability across differently degraded marsh soils. Land Degrad. Dev. 2024, 35, 264–279. [Google Scholar] [CrossRef]
  10. Żukowski, E. Transformation of Organic Matter in Soils of Drained Peat Bogs in the Valley of Upper Reach of the Muchawka River. Ph.D. Thesis, Uniwersytet Przyrodniczo-Humanistyczny w Siedlcach, Siedlce, Poland, 2023. (In Polish). [Google Scholar]
  11. Glina, B.; Piernik, A.; Mocek-Płóciniak, A.; Maier, A.; Glatzel, S. Drivers controlling spatial and temporal variation of microbial properties and dissolved organic forms (DOC and DON) in fen soils with persistently low water tables. Glob. Ecol. Conserv. 2021, 27, e01605. [Google Scholar] [CrossRef]
  12. Bogacz, A.; Glina, B.; Januszewska, K.; Midor, A.; Tomaszewska, K.; Podlaska, M.; Telega, P.; Dradrach, A. The effect of long-term peatlands drainage on the properties of soils in Microrelief in the Długie Mokradło Bog (Central sudetes–SW Poland). Polish J. Soil Sci. 2017, 50, 237–247. [Google Scholar] [CrossRef]
  13. Łachacz, A.; Kalisz, B.; Sowiński, P.; Smreczak, B.; Niedźwiecki, J. Transformation of Organic Soils Due to Artificial Drainage and Agricultural Use in Poland. Agriculture 2023, 13, 634. [Google Scholar] [CrossRef]
  14. Becher, M.; Pakuła, K.; Jaremko, D. Phosphorus accumulation in the dehydrated peat soils of the Liwiec river valley. J. Ecol. Eng. 2020, 21, 213–220. [Google Scholar] [CrossRef]
  15. Negassa, W.; Acksel, A.; Eckhardt, K.U.; Regier, T.; Leinweber, P. Soil organic matter characteristics in drained and rewetted peatlands of northern Germany: Chemical and spectroscopic analyses. Geoderma 2019, 353, 468–481. [Google Scholar] [CrossRef]
  16. Negassa, W.; Eckhardt, K.U.; Regier, T.; Leinweber, P. Dissolved organic matter concentration, molecular composition, and functional groups in contrasting management practices of peatlands. J. Environ. Qual. 2021, 50, 1364–1380. [Google Scholar] [CrossRef]
  17. Hunt, J.F.; Ohno, T.; He, Z.; Honeycutt, C.W.; Dail, D.B. Influence of Decomposition on Chemical Properties of Plant- and Manure-Derived Dissolved Organic Matter and Sorption to Goethite. J. Environ. Qual. 2007, 36, 135–143. [Google Scholar] [CrossRef]
  18. Oliveira, J.F.; de Oliveira, J.C.S.; Ruiz, D.B.; de Cesare Barbosa, G.M.; Filho, J.T. Changes in carbon and phosphorus storages and humic substances in a Ferralsol, after tillage and animal manures applications. Soil Tillage Res. 2022, 220, 105358. [Google Scholar] [CrossRef]
  19. Vanden Nest, T.; Amery, F.; Fryda, L.; Boogaerts, C.; Bilbao, J.; Vandecasteele, B. Renewable P sources: P use efficiency of digestate, processed animal manure, compost, biochar and struvite. Sci. Total Environ. 2021, 750, 141699. [Google Scholar] [CrossRef]
  20. Desmidt, E.; Ghyselbrecht, K.; Zhang, Y.; Pinoy, L.; Van Der Bruggen, B.; Verstraete, W.; Rabaey, K.; Meesschaert, B. Global phosphorus scarcity and full-scale P-recovery techniques: A review. Crit. Rev. Environ. Sci. Technol. 2015, 45, 336–384. [Google Scholar] [CrossRef]
  21. Amarh, F.; Voegborlo, R.B.; Essuman, E.K.; Agorku, E.S.; Tettey, C.O.; Kortei, N.K. Effects of soil depth and characteristics on phosphorus adsorption isotherms of different land utilization types: Phosphorus adsorption isotherms of soil. Soil Tillage Res. 2021, 213, 105139. [Google Scholar] [CrossRef]
  22. Pöthig, R.; Behrendt, H.; Opitz, D.; Furrer, G. A universal method to assess the potential of phosphorus loss from soil to aquatic ecosystems. Environ. Sci. Pollut. Res. 2010, 17, 497–504. [Google Scholar] [CrossRef]
  23. Nair, V.D. Soil phosphorus saturation ratio for risk assessment in land use systems. Front. Environ. Sci. 2014, 2, 6. [Google Scholar] [CrossRef]
  24. Messiga, A.J.; Lam, C.; Li, Y. Phosphorus saturation index and water-extractable phosphorus in high-legacy phosphorus soils in southern British Columbia, Canada. Can. J. Soil Sci. 2021, 101, 365–377. [Google Scholar] [CrossRef]
  25. McDowell, R.W.; Condron, L.M.; Stewart, I. Variation in environmentally- and agronomically-significant soil phosphorus concentrations with time since stopping the application of phosphorus fertilisers. Geoderma 2016, 280, 67–72. [Google Scholar] [CrossRef]
  26. Regelink, I.C.; Egene, C.E.; Tack, F.M.G.; Meers, E. Speciation of P in solid organic fertilisers from digestate and biowaste. Agronomy 2021, 11, 2233. [Google Scholar] [CrossRef]
  27. Jindo, K.; Audette, Y.; Olivares, F.L.; Canellas, L.P.; Smith, D.S.; Voroney, R.P. Biotic and abiotic effects of soil organic matter on the phytoavailable phosphorus in soils: A review. Chem. Biol. Technol. Agric. 2023, 10, 29. [Google Scholar] [CrossRef] [PubMed]
  28. Guppy, C.N.; Menzies, N.W.; Moody, P.W.; Blamey, F.P.C. Competitive sorption reactions between phosphorus and organic matter in soil: A review. Aust. J. Soil Res. 2005, 43, 189–202. [Google Scholar] [CrossRef]
  29. Debicka, M.; Kocowicz, A.; Weber, J.; Jamroz, E. Organic matter effects on phosphorus sorption in sandy soils. Arch. Agron. Soil Sci. 2015, 62, 840–855. [Google Scholar] [CrossRef]
  30. Yang, X.; Chen, X.; Yang, X. Effect of organic matter on phosphorus adsorption and desorption in a black soil from Northeast China. Soil Tillage Res. 2019, 187, 85–91. [Google Scholar] [CrossRef]
  31. Hawkins, J.M.B.; Vermeiren, C.; Blackwell, M.S.A.; Darch, T.; Granger, S.J.; Dunham, S.J.; Hernandez-Allica, J.; Smolders, E.; McGrath, S. The effect of soil organic matter on long-term availability of phosphorus in soil: Evaluation in a biological P mining experiment. Geoderma 2022, 423, 115965. [Google Scholar] [CrossRef]
  32. Horta, C. Fertilisation with Compost: Effects on Soil Phosphorus Sorption and on Phosphorus Availability in Acid Soils. Open J. Soil Sci. 2019, 9, 255–268. [Google Scholar] [CrossRef]
  33. Gao, Y.; Zhu, B.; He, N.; Yu, G.; Wang, T.; Chen, W.; Tian, J. Phosphorus and carbon competitive sorption-desorption and associated non-point loss respond to natural rainfall events. J. Hydrol. 2014, 517, 447–457. [Google Scholar] [CrossRef]
  34. Audette, Y.; Smith, D.S.; Parsons, C.T.; Chen, W.; Rezanezhad, F.; Van Cappellen, P. Phosphorus binding to soil organic matter via ternary complexes with calcium. Chemosphere 2020, 260, 127624. [Google Scholar] [CrossRef]
  35. Strawn, D.G. Sorption mechanisms of chemicals in soils. Soil Syst. 2021, 5, 13. [Google Scholar] [CrossRef]
  36. Chase, A.J.; Erich, M.S.; Ohno, T. Bioavailability of Phosphorus on Iron (Oxy)hydroxide Not Affected by Soil Amendment–Derived Organic Matter. Agric. Environ. Lett. 2018, 3, 170042. [Google Scholar] [CrossRef]
  37. Wang, C.; Wang, Z.; Lin, L.; Tian, B.; Pei, Y. Effect of low molecular weight organic acids on phosphorus adsorption by ferric-alum water treatment residuals. J. Hazard. Mater. 2012, 203–204, 145–150. [Google Scholar] [CrossRef]
  38. Wang, H.; Zhu, J.; Fu, Q.; Hong, C.; Hu, H.; Violante, A. Phosphate adsorption on uncoated and humic acid-coated iron oxides. J. Soils Sediments 2016, 16, 1911–1920. [Google Scholar] [CrossRef]
  39. Debicka, M.; Morshedizad, M.; Leinweber, P. The Effects of Dissolved Organic Matter Derived from Agricultural Waste Materials on Phosphorus Sorption in Sandy Soils. Agriculture 2023, 13, 2164. [Google Scholar] [CrossRef]
  40. Hunt, J.F.; He, Z. Characteristics of plant-derived water-extractable organic matter and its effects on phosphorus sorption behavior. In Labile Organic Matter—Chemical Compositions, Function, and Significance in Soil and the Environment; Wiley: Hoboken, NJ, USA, 2015; Volume 70124, pp. 99–118. [Google Scholar] [CrossRef]
  41. Hiradate, S.; Uchida, N. Effects of soil organic matter on ph-dependent phosphate sorption by soils. Soil Sci. Plant Nutr. 2004, 50, 665–675. [Google Scholar] [CrossRef]
  42. Du, Z.Y.; Wang, Q.H.; Liu, F.C.; Ma, H.L.; Ma, B.Y.; MalhI, S.S. Movement of Phosphorus in a Calcareous Soil as Affected by Humic Acid. Pedosphere 2013, 23, 229–235. [Google Scholar] [CrossRef]
  43. Sokołowska, Z.; Szajdak, L.; Boguta, P. Effect of phosphates on dissolved organic matter release from peat-muck soils. Int. Agrophysics 2011, 25, 173–180. [Google Scholar]
  44. Ampong, K.; Thilakaranthna, M.S.; Gorim, L.Y. Understanding the Role of Humic Acids on Crop Performance and Soil Health. Front. Agron. 2022, 4, 848621. [Google Scholar] [CrossRef]
  45. Cheng, W.P.; Chi, F.H.; Yu, R.F. Effect of phosphate on removal of humic substances by aluminum sulfate coagulant. J. Colloid Interface Sci. 2004, 272, 153–157. [Google Scholar] [CrossRef] [PubMed]
  46. Debska, B.; Banach-szott, M. Properties of humic acids of soil under different management regimes. Polish J. Soil Sci. 2023, 42, 131–138. [Google Scholar]
  47. Nardi, S.; Schiavon, M.; Francioso, O. Chemical structure and biological activity of humic substances define their role as plant growth promoters. Molecules 2021, 26, 2256. [Google Scholar] [CrossRef] [PubMed]
  48. Makarov, M.I.; Malysheva, T.I. Phosphorus in humus acids. Eurasian Soil Sci. 2006, 39, 1208–1216. [Google Scholar] [CrossRef]
  49. Gorham, E. Northern peatlands: Role in the carbon cycle and probable responses to climatic warming. Ecol. Appl. 1991, 1, 182–195. [Google Scholar] [CrossRef]
  50. Lasota, J.; Błońska, E. C:N:P stoichiometry as an indicator of Histosol drainage in lowland and mountain forest ecosystems. For. Ecosyst. 2021, 8, 39. [Google Scholar] [CrossRef]
  51. Charman, D. Peatlands and Environmental Change; John Wiley & Sons, Ltd.: Hoboken, NJ, USA, 2002. [Google Scholar]
  52. Joosten, H.; Tanneberger, F.; Moen, A. Mires and Peatlands of Europe: Status Distribution and Conservation; Schweizerbart Science Publishers: Stuttgart, Germany, 2017; ISBN 9783510653836. [Google Scholar]
  53. Błońska, E.; Lasota, J. Soil organic matter accumulation and carbon fractions along a moisture gradient of forest soils. Forests 2017, 8, 448. [Google Scholar] [CrossRef]
  54. IUSS Working Group WRB. World Reference Base for Soil Resources. In International Soil Classification System for Naming Soils and Creating Legends for Soil Maps, 4th ed.; International Union of Soil Sciences (IUSS): Vienna, Austria, 2022; Volume 4, ISBN 9798986245119. [Google Scholar]
  55. Debicka, M.; Bogacz, A.; Kowalczyk, K. Phosphorus behaviour and its basic indices under organic matter transformation in variable moisture conditions: A case study of fen organic soils in the odra river valley, Poland. Agronomy 2021, 11, 1997. [Google Scholar] [CrossRef]
  56. Okruszko, H. Soil properties in drained peatlands (in polish with English summary). Zesz. Probl. Post. Nauk Rol. 1967, 72, 13–27. [Google Scholar]
  57. Lynn, W.C.; McKinzie, W.E.; Grossman, R.B. Field laboratory tests for characterization of histosols. In Histosols: Their Characteristics, Classification, and Use; Wiley: Hoboken, NJ, USA, 1974; pp. 11–20. ISBN 9780891189015. [Google Scholar]
  58. Okruszko, H. Determination on specific gravity of hydrogenic soils on the basis of their minerl particles content (in Polish; summary in English). Wiadomości Inst. Melior. Użytków Zelonych Użytków Zelonych 1971, 10, 47–54. [Google Scholar] [CrossRef]
  59. Saunders, W.M.H.; Williams, E.G. Observations on the determination of total organic phosphorus in soils. J. Soil Sci. 1955, 6, 254–267. [Google Scholar] [CrossRef]
  60. Walker, T.W.; Adams, A.F.R. Studies on soil organic matter. J. Soil Sci. 1958, 85, 307–318. [Google Scholar] [CrossRef]
  61. Shah, R.; Syers, J.K.; Williams, J.D.H.; Walker, T.W. The forms of inorganic phosphorus extracted from soils by n sulphuric acid. New Zeal. J. Agric. Res. 1968, 11, 184–192. [Google Scholar] [CrossRef]
  62. Mehlich, A. Mehlich 3 soil test extractant: A modification of Mehlich 2 extractant. Commun. Soil Sci. Plant Anal. 1984, 15, 1409–1416. [Google Scholar] [CrossRef]
  63. Houba, V.J.G.; Temminghoff, E.J.M.; Gaikhorst, G.A.; van Vark, W. Soil analysis procedures using 0.01 M calcium chloride as extraction reagent. Commun. Soil Sci. Plant Anal. 2000, 31, 1299–1396. [Google Scholar] [CrossRef]
  64. Kovar, J.L.; Pierzynski, G.M. Methods of Phosphorus Analysis for Soils, Sediments, Residuals and Waters. South. Coop. Ser. Bull. 2009, 408, 131. [Google Scholar]
  65. Murphy, J.; Riley, J.P. A modified single solution method for the determination of phosphate in natural waters. Anal. Chim. Acta 1962, 27, 31–36. [Google Scholar] [CrossRef]
  66. TIBCO Software Inc. Statistica (Data Analysis Software System). 2017, Version 13. Available online: http://statistica.com (accessed on 29 September 2021).
  67. Okruszko, H. Transformation on fen-peat soil decomposition under the impact of draining. Zesz. Probl. Post. Nauk Rol. 1993, 406, 3–73. [Google Scholar]
  68. Gawlik, J. Division of differently silted formation into classes according to their state of secondary transformation. Acta Agrophysica 2000, 26, 17–24. [Google Scholar] [CrossRef]
  69. Soil Survey Staff. Soil Taxonomy. A Basic System of Soil Classification for Making and Interpreting Soil Surveys; USDA Natural Resources Conservation Service: Washington, DC, USA, 1975. [Google Scholar]
  70. Soil Survey Staff. Keys to Soil Taxonomy, 13th ed.; USDA Natural Resources Conservation Service: Washington, DC, USA, 2022; Volume 12, ISBN 0926487221. [Google Scholar]
  71. Stevenson, F.J.; Cole, M.A. Cycles of Soil, 2nd ed.; John Wiley & Sons, INC.: New York, NY, USA, 1999; Volume 144. [Google Scholar]
  72. Parent, L.E.; Viau, A.A.; Anctil, F. Nitrogen and phosphorus fractions as indicators of organic soil quality. Suo 2000, 51, 71–81. [Google Scholar]
  73. Leifeld, J.; Klein, K.; Wüst-Galley, C. Soil organic matter stoichiometry as indicator for peatland degradation. Sci. Rep. 2020, 10, 7634. [Google Scholar] [CrossRef]
  74. Watmough, S.; Gilbert-Parkes, S.; Basiliko, N.; Lamit, L.J.; Lilleskov, E.A.; Andersen, R.; del Aguila-Pasquel, J.; Artz, R.E.; Benscoter, B.W.; Borken, W.; et al. Variation in carbon and nitrogen concentrations among peatland categories at the global scale. PLoS ONE 2022, 17, e0275149. [Google Scholar] [CrossRef]
  75. Becher, M.; Tołoczko, W.; Godlewska, A.; Pakuła, K.; Żukowski, E. Fractional Composition of Organic Matter and Properties of Humic Acids in the Soils of Drained Bogs of the Siedlce Heights in Eastern Poland. J. Ecol. Eng. 2022, 23, 208–222. [Google Scholar] [CrossRef]
  76. Jamroz, E.; Kocowicz, A.; Bekier, J.; Weber, J. Properties of soil organic matter in Podzols under mountain dwarf pine (Pinus mugo Turra.) and norway spruce (Picea abies (L.) Karst.) in various stages of dieback in the east sudety mountains, poland. For. Ecol. Manag. 2014, 330, 261–270. [Google Scholar] [CrossRef]
  77. Biester, H.; Knorr, K.H.; Schellekens, J.; Basler, A.; Hermanns, Y.M. Comparison of different methods to determine the degree of peat decomposition in peat bogs. Biogeosciences 2014, 11, 2691–2707. [Google Scholar] [CrossRef]
  78. Zhu, J.; Li, M.; Whelan, M. Phosphorus activators contribute to legacy phosphorus availability in agricultural soils: A review. Sci. Total Environ. 2018, 612, 522–537. [Google Scholar] [CrossRef]
  79. Bai, J.; Ye, X.; Jia, J.; Zhang, G.; Zhao, Q.; Cui, B.; Liu, X. Phosphorus sorption-desorption and effects of temperature, pH and salinity on phosphorus sorption in marsh soils from coastal wetlands with different flooding conditions. Chemosphere 2017, 188, 677–688. [Google Scholar] [CrossRef]
  80. Cui, H.; Ou, Y.; Wang, L.; Yan, B.; Han, L.; Li, Y. Change in the distribution of phosphorus fractions in aggregates under different land uses: A case in sanjiang plain, Northeast China. Int. J. Environ. Res. Public Health 2019, 16, 212. [Google Scholar] [CrossRef]
  81. Li, J.; Ding, Y.; Shi, Z. Binding Properties of Fulvic Acid before and after Fractionation on Ferrihydrite: Effects of Phosphate. ACS Earth Space Chem. 2021, 5, 1535–1543. [Google Scholar] [CrossRef]
  82. Hua, Q.-X.; Li, J.-Y.; Zhou, J.-M.; Wang, H.-Y.; Du, C.-W.; Chen, X.-Q. Enhancement of Phosphorus Solubility by Humic Substances in Ferrosols. Pedosphere 2008, 18, 533–538. [Google Scholar] [CrossRef]
  83. Tan, K.H. Humic Matter in Soil and the Environment, Principles and Controversies, 2nd ed.; CRC-Press: Boca Raton, FL, USA; Taylor & Francis Group: Boca Raton, FL, USA; London, UK; New York, NY, USA, 2014; ISBN 978-1-4822-3446-6. [Google Scholar]
  84. Senesi, N.; Loffredo, E. Soil Humic Substances. In Biopolymers Online; Wiley: Hoboken, NJ, USA, 2005; ISBN 9783527600038. [Google Scholar]
  85. Stevenson, F.J. Humus Chemistry: Genesis, Composition, Reactions; Wiley: Hoboken, NJ, USA, 1994; ISBN 9780471594741. [Google Scholar]
  86. Kononova, M.M. Soil Organic Matter, Its Nature, Properties and Methods of Study; Publishing House of the Academia of Science of the U.S.S.R.: Moscow, Russia, 1963. [Google Scholar]
  87. Rashad, M.; Hafez, M.; Popov, A.I. Humic substances composition and properties as an environmentally sustainable system: A review and way forward to soil conservation. J. Plant Nutr. 2022, 45, 1072–1122. [Google Scholar] [CrossRef]
  88. Gerke, J. Humic (organic matter)-Al(Fe)-phosphate complexes: An underestimated phosphate form in soils and source of plant-available phosphate. Soil Sci. 2010, 175, 417–425. [Google Scholar] [CrossRef]
  89. Fahmi, A.; Radjagukguk, B.; Purwanto, B.H.; Hanudin, E. The Role of Peat Layers on Iron Dynamics in Peatlands. J. TANAH Trop. (J. Trop. Soils) 2010, 15, 195–201. [Google Scholar] [CrossRef]
  90. Borie, F.; Zunino, H.; Martínez, L. Macromolecule-P associations and inositol phosphates in some chilean volcanic soils of temperate regions. Commun. Soil Sci. Plant Anal. 1989, 20, 1881–1894. [Google Scholar] [CrossRef]
  91. Dormaar, J.F. Extraction of organic phosphorus in Chernozemic soils. Plant Soil 1968, 28, 268–279. [Google Scholar] [CrossRef]
  92. Ivanoff, D.B.; Reddy, K.R.; Robinson, S. Chemical fractionation of organic phosphorus in selected Histosols. Soil Sci. 1998, 163, 36–45. [Google Scholar] [CrossRef]
  93. Hong, J.K.; Yamane, I. Inositol phosphate and inositol in humic acid and fulvic acid fractions extracted by three methods. Soil Sci. Plant Nutr. 1980, 26, 491–496. [Google Scholar] [CrossRef]
  94. Hinsinger, P. Bioavailability of soil inorganic P in the rhizosphere as affected by root-induced chemical changes: A review. Plant Soil 2001, 237, 173–195. [Google Scholar] [CrossRef]
  95. Violante, A.; Cozzolino, V.; Perelomov, L.; Caporale, A.G.; Pigna, M. Mobility and bioavailability of heavy metals and metalloids in soil environments. J. Soil Sci. Plant Nutr. 2010, 10, 268–292. [Google Scholar] [CrossRef]
  96. Jones, D.L.; Oburger, E. Solubilization of phosphorus by soil microorganisms. In Phosphorus in Action; Bünemann, E., Oberson, A., Frossard, E., Eds.; Springer: Berlin/Heidelberg, Germany, 2011; Volume 26, pp. 169–198. ISBN 978-3-642-15270-2. [Google Scholar]
  97. Richardson, A.E.; Lynch, J.P.; Ryan, P.R.; Delhaize, E.; Smith, F.A.; Smith, S.E.; Harvey, P.R.; Ryan, M.H.; Veneklaas, E.J.; Lambers, H.; et al. Plant and microbial strategies to improve the phosphorus efficiency of agriculture. Plant Soil 2011, 349, 121–156. [Google Scholar] [CrossRef]
  98. Reddy, K.R.; DeLaune, R.D.; Inglett, P.W. Biogeochemistry of Wetlands; CRC Press: Boca Raton, FL, USA, 2022; ISBN 9780429155833. [Google Scholar]
Figure 1. Comparison of basic soil properties* in groups of OM type (Moorsh, Peat) for eutrophic (pH > 5) and dystrophic (pH < 5) habitats. Explanation: Central squares—mean values; boxes—mean values ± standard errors; whiskers—mean values ± 2 × standard deviations; letters: a,b,c,d—significance of differences among tested groups (homogeneous groups of means) by RIR Tukey test (at P < 0.05) conducted in the groups of pH and in the groups of same OM type. * pHH2O—pH measured in distilled water; Ac—ash content; TOC—total organic carbon; TN—total nitrogen; CEC—cationic exchangeable capacity; BS—base saturation.
Agronomy 14 01688 g001
Figure 2. Macronutrients ratio (C:N, C:P, and N:P) comparison in groups of OM type (Moorsh, Peat) for eutrophic (pH > 5) and dystrophic (pH < 5) habitats. Explanation: central squares—mean values; boxes—mean values ± standard errors; whiskers—mean values ± 2 × standard deviations; letters a,b,c—significance of differences among tested groups (homogeneous groups of means) by RIR Tukey test (at P < 0.05). Tukey test was conducted in the groups of pH and in the groups of the same OM type.
Agronomy 14 01688 g002
Figure 3. Comparison of Po retention in fulvic (FA) and humic acids (HA) in groups of OM type (Moorsh, Peat) for eutrophic (pH > 5) and dystrophic (pH < 5) Histosols. Explanation: central squares—mean values; boxes—mean values ± standard errors; whiskers—mean values ± 2 × standard deviations in Histosols; letters a,b—significance of differences among tested groups (homogeneous groups of means) by RIR Tukey test (at P < 0.05). Tukey test was conducted in the groups of pH and in the groups of the same OM type.
Agronomy 14 01688 g003
Figure 4. Principal component analysis diagram of variables (a) and cases (b) for organic horizons of eutrophic soils (pH > 5).
Agronomy 14 01688 g004
Figure 5. Principal component analysis diagram of variables (a) and cases (b) for organic horizons of dystrophic soils (pH < 5).
Agronomy 14 01688 g005
Table 1. Physical characteristics of organic material in studied soils *.
Profile No.Soil
Horizon
Horizon Depth
[cm]
ρwρoPcW1Fibre Volume
(%)
A/BPIVon Post ScaleOM
Type
g cm−3% AB
P1Oe0–141.800.2287.80.274494.74H4hemic
Oa114–341.960.2786.20.452965.03H5sapric
Oa2 34–621.810.2287.80.443493.73H6sapric
Oa3 62–701.890.2586.80.284485.73H5sapric
Oa4 70–831.860.2487.10.274759.03H6sapric
Lc83–1062.370.4282.2n.d.47133.53H5sapric
P2M1 0–102.190.3683.60.765086.42n.d.sapric
M2 10–252.210.3783.20.6073711.03n.d.sapric
M325–422.230.3882.90.508699.63n.d.sapric
Oa42–552.140.3484.10.4558414.03H6sapric
Lcca55–702.290.3983.00.31not determined
P3Oa10–151.800.2287.70.163193.43H5sapric
Oa215–272.050.3184.80.245687.01H5sapric
Oa327–371.830.2287.90.3049104.92H6sapric
Oa437–491.870.2287.10.2348316.03H7sapric
Ogy49–792.110.3384.30.322755.44H6sapric
P4Oe0–51.750.2088.6n.d.n.d.n.d.n.d.4H4hemic
Oa15–251.850.2387.50.385168.51H6sapric
Oa225–331.940.2786.10.3343314.31H6sapric
Lc33–382.300.4082.60.312446.01H6sapric
P5M10–102.160.3583.80.63n.d.n.d.n.d.1n.d.sapric
M210–232.080.3284.60.76n.d.n.d.n.d.2n.d.sapric
M323–392.210.3683.70.46n.d.n.d.n.d.1n.d.sapric
* Symbols: ρw—specific density; ρo—volumetric density; Pc—total porosity; W1—soil water absorption index; A unrubbed fibre; B—rubbed fibre; A/B—the index of OM vulnerability to decomposition; PI—the pyrophosphate index.; n.d.—not determined.
Table 2. P forms in organic horizons of Histosols under study *.
Soil
Profile
Soil
Horizon
Depth
(in cm)
PtPoPOXPM3PCaCl2PW
mg kg−1
P1Oe0–142099.31048.01308.83.71.72.9
Oa114–341216.3990.3551.01.50.91.1
Oa2 34–621009.3758.3430.81.20.71.0
Oa3 62–701096.3682.2539.01.10.30.6
Oa4 70–83899.5583.9450.41.40.30.5
P2M1 0–102922.81323.51825.59.15.78.1
M2 10–253027.51376.51838.85.82.96.9
M325–423011.81317.51960.55.62.56.5
Oa42–553141.31211.82315.55.51.04.7
P3Oa10–151312.21032.0571.414.45.19.9
Oa215–271374.01044.6826.94.02.23.4
Oa327–371151.0876.1665.42.41.62.2
Oa437–491027.2744.8539.92.41.72.3
Ogy49–79230.4137.772.02.20.30.0
P4Oe0–52296.2839.31712.98.23.55.2
Oa15–252359.51305.01815.95.12.83.9
Oa225–331159.0739.7734.42.01.22.0
P5M10–101327.7716.0710.410.82.68.3
M210–231881.01035.81102.92.61.63.6
M323–39974.2554.8616.92.71.22.7
* Symbols: Pt—total P; Po—organic P; Pox—oxalate P; PM3—available P; PCaCl2—P soluble in CaCl2; PW—water-soluble P.
Table 3. P organic content in humic (Po_FA) and fulvic acids (Po_HA) in organic horizons of Histosols under study *.
Soil
Profile
Soil
Horizon
Depth
(in cm)
Po_FAPo_HAΣPoPo_FAPo_HAΣPoPo_FAPo_HAΣPo
mg kg−1% of TP% of Po
P1Oe0–1473.0161.14134.153.482.916.396.975.8312.80
Oa114–3434.3765.2499.612.835.368.193.476.5910.06
Oa234–6229.3643.6473.002.914.327.233.875.769.63
Oa362–7028.8960.3489.242.645.508.144.248.8513.08
Oa470–8350.70106.00156.715.6411.7817.428.6818.1526.84
P2M10–1097.1927.25124.443.330.934.267.342.069.40
M210–25123.91145.01268.924.094.798.889.0010.5319.54
M325–42123.4488.09211.534.102.927.029.376.6916.06
Oa42–55134.1519.07153.224.270.614.8811.071.5712.64
P3Oa10–1513.8357.1771.001.054.365.411.345.546.88
Oa215–2711.39142.31153.700.8310.3611.191.0913.6214.71
Oa327–377.60216.28223.880.6618.7919.450.8724.6925.55
Oa437–4951.06161.66212.724.9715.7420.716.8521.7028.56
Ogy49–792.7444.1046.841.1919.1420.331.9932.0234.01
P4Oe0–542.6391.52134.151.863.995.845.0810.9015.98
Oa15–25105.53104.39209.924.474.428.908.098.0016.09
Oa225–339.48117.01126.480.8210.1010.911.2815.8217.10
P5M10–10122.36126.57248.929.229.5318.7517.0917.6834.77
M210–23355.82120.39476.2018.926.4025.3234.3511.6245.98
M323–39107.85443.40551.2511.0745.5156.5819.4479.9399.37
* Symbols: Po_FA—Po in fulvic acids; Po_HA—Po in humic acids; ΣPo—Po in humic substances (Po_HA + FA).
Table 4. Spearman correlation coefficients for P forms and C fractions and P connected to humic and fulvic acids depending on the pH conditions (statistical significance at P < 0.05) *.
VariablePo_FAPo_HA
pH < 5pH > 5pH < 5pH > 5
Pt -0.88 - -
Po -0.78 - -
PM3 -0.83 - -
POX -0.9 - -
PCaCl2 -0.71 - -
PW -0.75 - -
Po (%) -−0.83 - -
TOC - - - -
TN -−0.72 - -
Ac - - - -
CEC -0.78 - -
BS - - - -
pH0.680.76 - -
C:N−0.70−0.73 - -
C:P−0.75−0.78 - -
N:P−0.75−0.85 - -
* Symbols: Pt—total P; Po—organic P; Pox—oxalate P; PM3—available P; PCaCl2—P soluble in CaCl2; PW—water-soluble P; Po_FA—Po retention in fulvic acids; Po_HA—Po retention in humic acids; pH—reaction measured in H2O; TOC—total organic carbon; TN—total nitrogen; Ac—ash content; CEC—cationic exchangeable capacity; BS—base saturation; C:N, C:P, N:P—macronutrients ratios; “-“ not significant correlation coefficients.
Disclaimer/Publisher’s Note: The statements, opinions and data contained in all publications are solely those of the individual author(s) and contributor(s) and not of MDPI and/or the editor(s). MDPI and/or the editor(s) disclaim responsibility for any injury to people or property resulting from any ideas, methods, instructions or products referred to in the content.

