Article

Evaluation of the Improvement Effect of Chemical Fertilizer Combined with Different Additives on Newly Built Paddy Soil

1
College of Water Resources and Architectural Engineering, Northwest A&F University, Xianyang 712100, China
2
College of Soil and Water Conservation Science and Engineering, Northwest A&F University, Xianyang 712100, China
3
College of Natural Resources and Environment, Northwest A&F University, Xianyang 712100, China
4
Ankang Agriculture and Rural Bureau, Ankang 725000, China
*
Author to whom correspondence should be addressed.
Agronomy 2024, 14(8), 1706; https://doi.org/10.3390/agronomy14081706
Submission received: 9 July 2024 / Revised: 24 July 2024 / Accepted: 1 August 2024 / Published: 2 August 2024
(This article belongs to the Special Issue Tillage Systems and Fertilizer Application on Soil Health)

Abstract

:
Exploring the effects of different additives on the improvement of newly cultivated farmland in mountainous areas can provide rational soil fertilization plans for regions lacking means of production. We conducted a paddy planting experiment in Ankang City, Shaanxi Province. Six treatments were set up, including sole chemical fertilizer (CK); fertilizer + bacteria agent (NB); chemical fertilizer + alginate bio-organic fertilizer (NO); fertilizer + fulvic acid biomass nutrient solution (NF); chemical fertilizer + acid soil conditioner (NC); fertilizer + silicon–calcium–magnesium–potassium fertilizer (NSi). We collected topsoil samples after paddy harvest, analyzed their physical, chemical, and biological properties, and selected indicators to construct a Total Data Set (TDS) and a Minimum Data Set (MDS). The Soil Quality Index (SQI) was used to evaluate the soil improvement effects after different fertilization regimes. The SQI calculated by the TDS and the MDS showed that the SQI after NF treatment was higher than that under other treatments. The SQI based on the TDS (SQITDS) and the SQI based on the MDS (SQIMDS) were significantly positively correlated with yield. The SQI calculated based on both the TDS and the MDS can objectively reflect the soil fertility quality. The paddy yield and total dry matter accumulation were the highest under the NF treatment, and the SQI was the largest. Thus, the effect of chemical fertilizer combined with fulvic acid biomass nutrient solution on soil fertility was the most significant.

1. Introduction

Soil constitutes an integral component of the Earth’s biosphere, serving as a crucial resource for human survival and forming the cornerstone of agriculture and natural ecosystems [1]. Soil quality is defined as the ability of soil to maintain animal and plant production, maintain or improve climate quality, and support human health and habitat in natural and managed ecosystems. It plays an important role in maintaining sustainable soil productivity and the safety and health of the soil-plant-animal-human food chain [2,3]. As conflicts between population, resources, and the environment escalate, soil degradation issues such as erosion, declining fertility, salinization, marshification, desertification, acidification, and environmental pollution have become increasingly prominent. These challenges significantly impede the progress of human society, prompting widespread attention from various scholars to soil quality concerns [4,5]. The infertile soil and scarcity of production resources in newly cultivated farmland in mountainous regions underscore the crucial need for a scientific evaluation of the effects of various fertilization methods on soil quality. Proposing more practical fertilization strategies holds paramount significance for the establishment of high-standard agricultural fields in the mountainous area.
Domestic and international research consistently demonstrates that fertilizers can rapidly supply plants with vital nutrients for growth. However, the improper application of fertilizers can result in soil compaction, diminished organic matter content, reduced fertilizer efficiency, suboptimal yield improvements, and environmental hazards such as heavy metal contamination, water pollution, and atmospheric pollution [6]. Certain additives can effectively enhance the physical and chemical properties of soil, along with its nutrient status, while also exerting a positive influence on soil microorganisms, thus boosting the productivity of infertile soil. Combining chemical fertilizer with these additives not only helps reduce fertilizer usage but also aids in minimizing land pollution, thereby improving the quality of cultivated soil [6,7,8,9]. Currently, several scholars have proposed various methods to assess soil quality, such as the Dynamic Soil Quality Model [2], Soil Quality Assessment Card Method [10], Geostatistical Approach [11], and Soil Quality Index Method [12], among others. Among them, the Soil Quality Index Method combines physical and biochemical indicators into a single index, making it easy to implement and quantitatively flexible. It has shown good results in assessing soil quality in agricultural, grassland, and forest ecosystems and is commonly used for monitoring and evaluating soil quality under different land use management practices [13,14,15,16].
By reading a large number of references on soil improvement, we found that some soil additives have a very good effect on improving the quality of cultivated land. We collected five kinds of additives and assumed that these additives also had good improvement effects in newly built paddy fields in mountainous areas [17,18,19,20,21]. A one-year field experiment was conducted to study the effect of chemical fertilizer combined with different soil additives on the quality improvement of newly built cultivated land in mountainous areas and the growth and yield increase in rice. By calculating the SQI for various treatments, we quantitatively assess the improvement of soil quality in paddy fields following the application of different combinations of fertilizers and additives. This research aims to provide a reference for evaluating the quality of newly cultivated farmland and enhancing soil fertility in mountainous areas.

2. Materials and Methods

2.1. Overview of the Study Area

The experimental site is located in Shenba Town, Hanbin District, Ankang City, Shaanxi Province (108°65′ E, 32°94′ N). The average elevation of the area is 700 m, characterized by a subtropical monsoon climate with concentrated rainfall in summer and relatively dry winters. The average annual temperature is 15 °C, with a frost-free period of around 220 days per year and an average annual precipitation of 800 mm. The main crops grown in this area include corn, paddy, rapeseed, and soybeans. The soil under study is classified as high-standard farmland under construction in the past two years, with a sandy loam soil type. It exhibits vigorous metabolism, high evaporation rates, low organic matter content, poor water and nutrient retention capabilities, and a tendency to lose fertility in the later stages. The basic physical and chemical properties of the soil at the experimental site are shown in Table 1.

2.2. Experimental Design

This experiment began in June 2023, with single-season paddy cultivation in experimental plots. Six different treatments were set up: normal fertilization (CK); normal fertilization + bacteria agent (NB); normal fertilization + alginate bio-organic fertilizer (NO); normal fertilization + fulvic acid biomass nutrient solution (NF); normal fertilization + acid soil conditioner (NC); normal fertilization + silicon-calcium-magnesium-potassium fertilizer (NSi). Each treatment was replicated three times, totaling 18 plots, with each plot covering an area of 30 m2 (5 m × 6 m). A buffer zone of 3 m and a border strip of 1 m were maintained around each plot. The experiment was arranged using a randomized complete block design to select the most suitable soil amendments for this area. Paddy was planted on 8 June 2023, and the harvest was scheduled for 7 October 2023. The main components and effects of different soil additives are outlined in Table 2.
For normal fertilization, we adhered to the local high-standard farmland construction fertilization guidelines. Other soil additives were applied as recommended. The specific usage and dosage are shown in Table 3.

2.3. Determination Items and Methods

During the paddy maturation stage, a representative 1 m2 area of healthy rice plants, indicative of overall growth conditions, was collected from each plot. These samples were then dried in a 105 °C oven to measure yield and dry matter accumulation and distribution. In each plot, 0–20 cm topsoil was collected with soil drills to determine various physical, chemical, and biological indicators. Bulk density (BD) and soil porosity (SP) were measured by the ring knife method. Total nitrogen (TN) was determined by concentrated sulfuric acid digestion–Kjeldahl method. Alkali-hydrolyzable nitrogen (AN) was determined by alkali solution diffusion method. Available phosphorus (AP) was determined by NaHCO3 extraction-molybdenum antimony colorimetric method. Available potassium (AK) was determined by NH4OAc extraction–flame photometer method. Organic matter (SOM) was determined by potassium dichromate volumetric method (external heating method). The pH was determined by potentiometric method (soil:water = 1:2.5); the cation exchange capacity (CEC) was determined by ammonium acetate exchange method. Urease activity (UE) was determined by phenol sodium–sodium hypochlorite colorimetric method. Acid phosphatase activity (ACP) was determined by disodium phenyl phosphate colorimetric method. Catalase activity (CAT) was determined by potassium permanganate titration. Sucrase activity (SA) was measured by 3,5-dinitrosalicylic acid colorimetric method [22,23,24,25,26,27,28,29].

2.4. Evaluation of Soil Quality

2.4.1. Construction of TDS and MDS

All data were analyzed by Shapiro–Wilk text. If p > 0.05, the data conformed to the hypothesis of normal distribution at 95% confidence level [30]. In this study, BD (p = 0.484), SP (p = 0.483), pH (p = 0.129), CEC (p = 0.263), TN (p = 0.052), AN (p = 0.120), AP (p = 0.051), AK (p = 0.484), SOM (p = 0.051), C/N (p = 0.524), UE (p = 0.091), ACP (p = 0.513). CAT (p = 0.248) and SA (p = 0.076) all conformed to a normal distribution. Commonly used correlation analyses in statistics include Pearson correlation, Spearman correlation, and Kendallta correlation. The Kendallta correlation is mainly used to measure the ordinal correlation of ordered categorical data. The efficiency of Spearman correlation analysis is not as high as that of Pearson correlation analysis, so we choose Pearson correlation analysis. In 1996, Evans proposed the following classification based on the absolute value of the correlation coefficient: 0.00—0.19 “very weak” 0.20—0.39 “weak”, 0.40—0.59 “moderate”, 0.60—0.79 “strong”, 0.80–1.00 “very strong” [31]. To avoid including indicators that are extremely unrelated to the yield in the dataset, Pearson correlation analysis was performed on all indicators and yield. Correlations greater than 0.20 were determined as fertility evaluation indices for the TDS. Principal component analysis was performed on the indicators with significant differences in the TDS, and the absolute value of the factor load under each principal component was selected. The high-weight variables within the range of 10% of the maximum factor load value, and then analyze the correlation between the high-weight index and the maximum load value index. If the correlation is less than 0.6, the correlation coefficient and the maximum index are selected into the MDS [32].

2.4.2. Calculate the Index Score

The indicators within the MDS are transformed into dimensionless values through corresponding membership functions to standardize them, thus mitigating the impact of different measurement units on factor loadings. Membership functions represent the mathematical expressions of the relationship between evaluation indicators and crop growth response curves, facilitating the standardization of each evaluation indicator into dimensionless values (membership) ranging from 0 to 1. Soil indicator standardization typically employs three types of standard scoring equations: “more is better,” utilizing positive S-shaped function; “less is better,” utilizing reverse S-shaped function; and “optimal range,” utilizing parabolic function. Drawing from extensive production practices and expert assessments, SOM, AP, AK, CEC, and TN are evaluated using sigmoidal functions for determining membership values. Conversely, BD and pH employ parabolic functions to determine their membership values [32,33,34,35,36].
Formula for positive S-type calculation:
f   ( x ) = 0 . 1   x   L 0 . 1 + 0 . 9 ( x L ) / ( U L )       L < x   < U 1 . 0   x   U
In the formula: x is the monitoring value of the indicator; f(x) is the score of the indicator ranging between 0.1 and 1.0; and L and U are the lower and the upper threshold values of the indicator, respectively.
Formula for parabola type calculation:
f   ( x ) = 0 . 1 x   L   x   U 0 . 1 + 0 . 9 ( x L ) / ( O 1 L )   L   <   X   O 1 1 . 0 O 1   <   X   <   O 2 1 . 0 0 . 9 ( x O 2 ) / ( U O 2 ) O 2   <   X L
In the formula x is the monitoring value of the indicator; f(x) is the score of the indicator ranging between 0.1 and 1.0; and L and U are the lower and the upper threshold values of the indicator, respectively. O1 and O2 represent the lower and the upper critical values of the optimal value, respectively.
For soil AN, SP, and C/N, biological indicators, the simple linear scoring method was used. According to the principle of “the higher the better”, the highest measured value of the index was regarded as its membership degree 1, and the ratio of other measured values to the highest value was their respective membership values. The calculation formula is as follows [1,35]:
f   ( x ) = x x max
In the formula: f(x) is the membership value, x is the measured value of the index, and xmax is the highest measured value of the index.

2.4.3. Determine the Index Weight

Once the evaluation indicators are determined, assigning weights to these indicators is also crucial. Common methods for assigning indicator weights include entropy method, regression analysis, grey relational analysis, principal component analysis, and factor analysis. In this study, principal component analysis (PCA) is used to determine indicator weights. PCA can reduce numerous interrelated indicators to a few comprehensive factors, known as principal components. By appropriately adjusting the coefficients of linear functions, PCA ensures that the principal components are mutually independent, eliminating redundant information while reducing dimensionality.

2.4.4. Calculation of SQI

After obtaining the standardized scores and weights of the indicators as described above, the SQI is calculated using a weighted sum method. A higher SQI value indicates higher soil quality. The formula is as follows:
SQI = i = 1 n q i w i
In the formula: qi is the standardized score of indicator i; wi is the weight assigned to indicator i; n is the number of indicators in MDS or TDS.

2.5. Statistical Analysis

Microsoft Excel 2016 was used to integrate and process the data. IBM SPSS 24.0 was used for one-way analysis of variance (ANOVA), LSD test, Shapiro–Wilk text, Pearson correlation analysis, etc. The final data results are shown as mean ± standard deviation. TDS and MDS were determined by correlation analysis and principal component analysis. R was used to draw the correlation heat map. Origin 2021 software was used for mapping.

3. Results

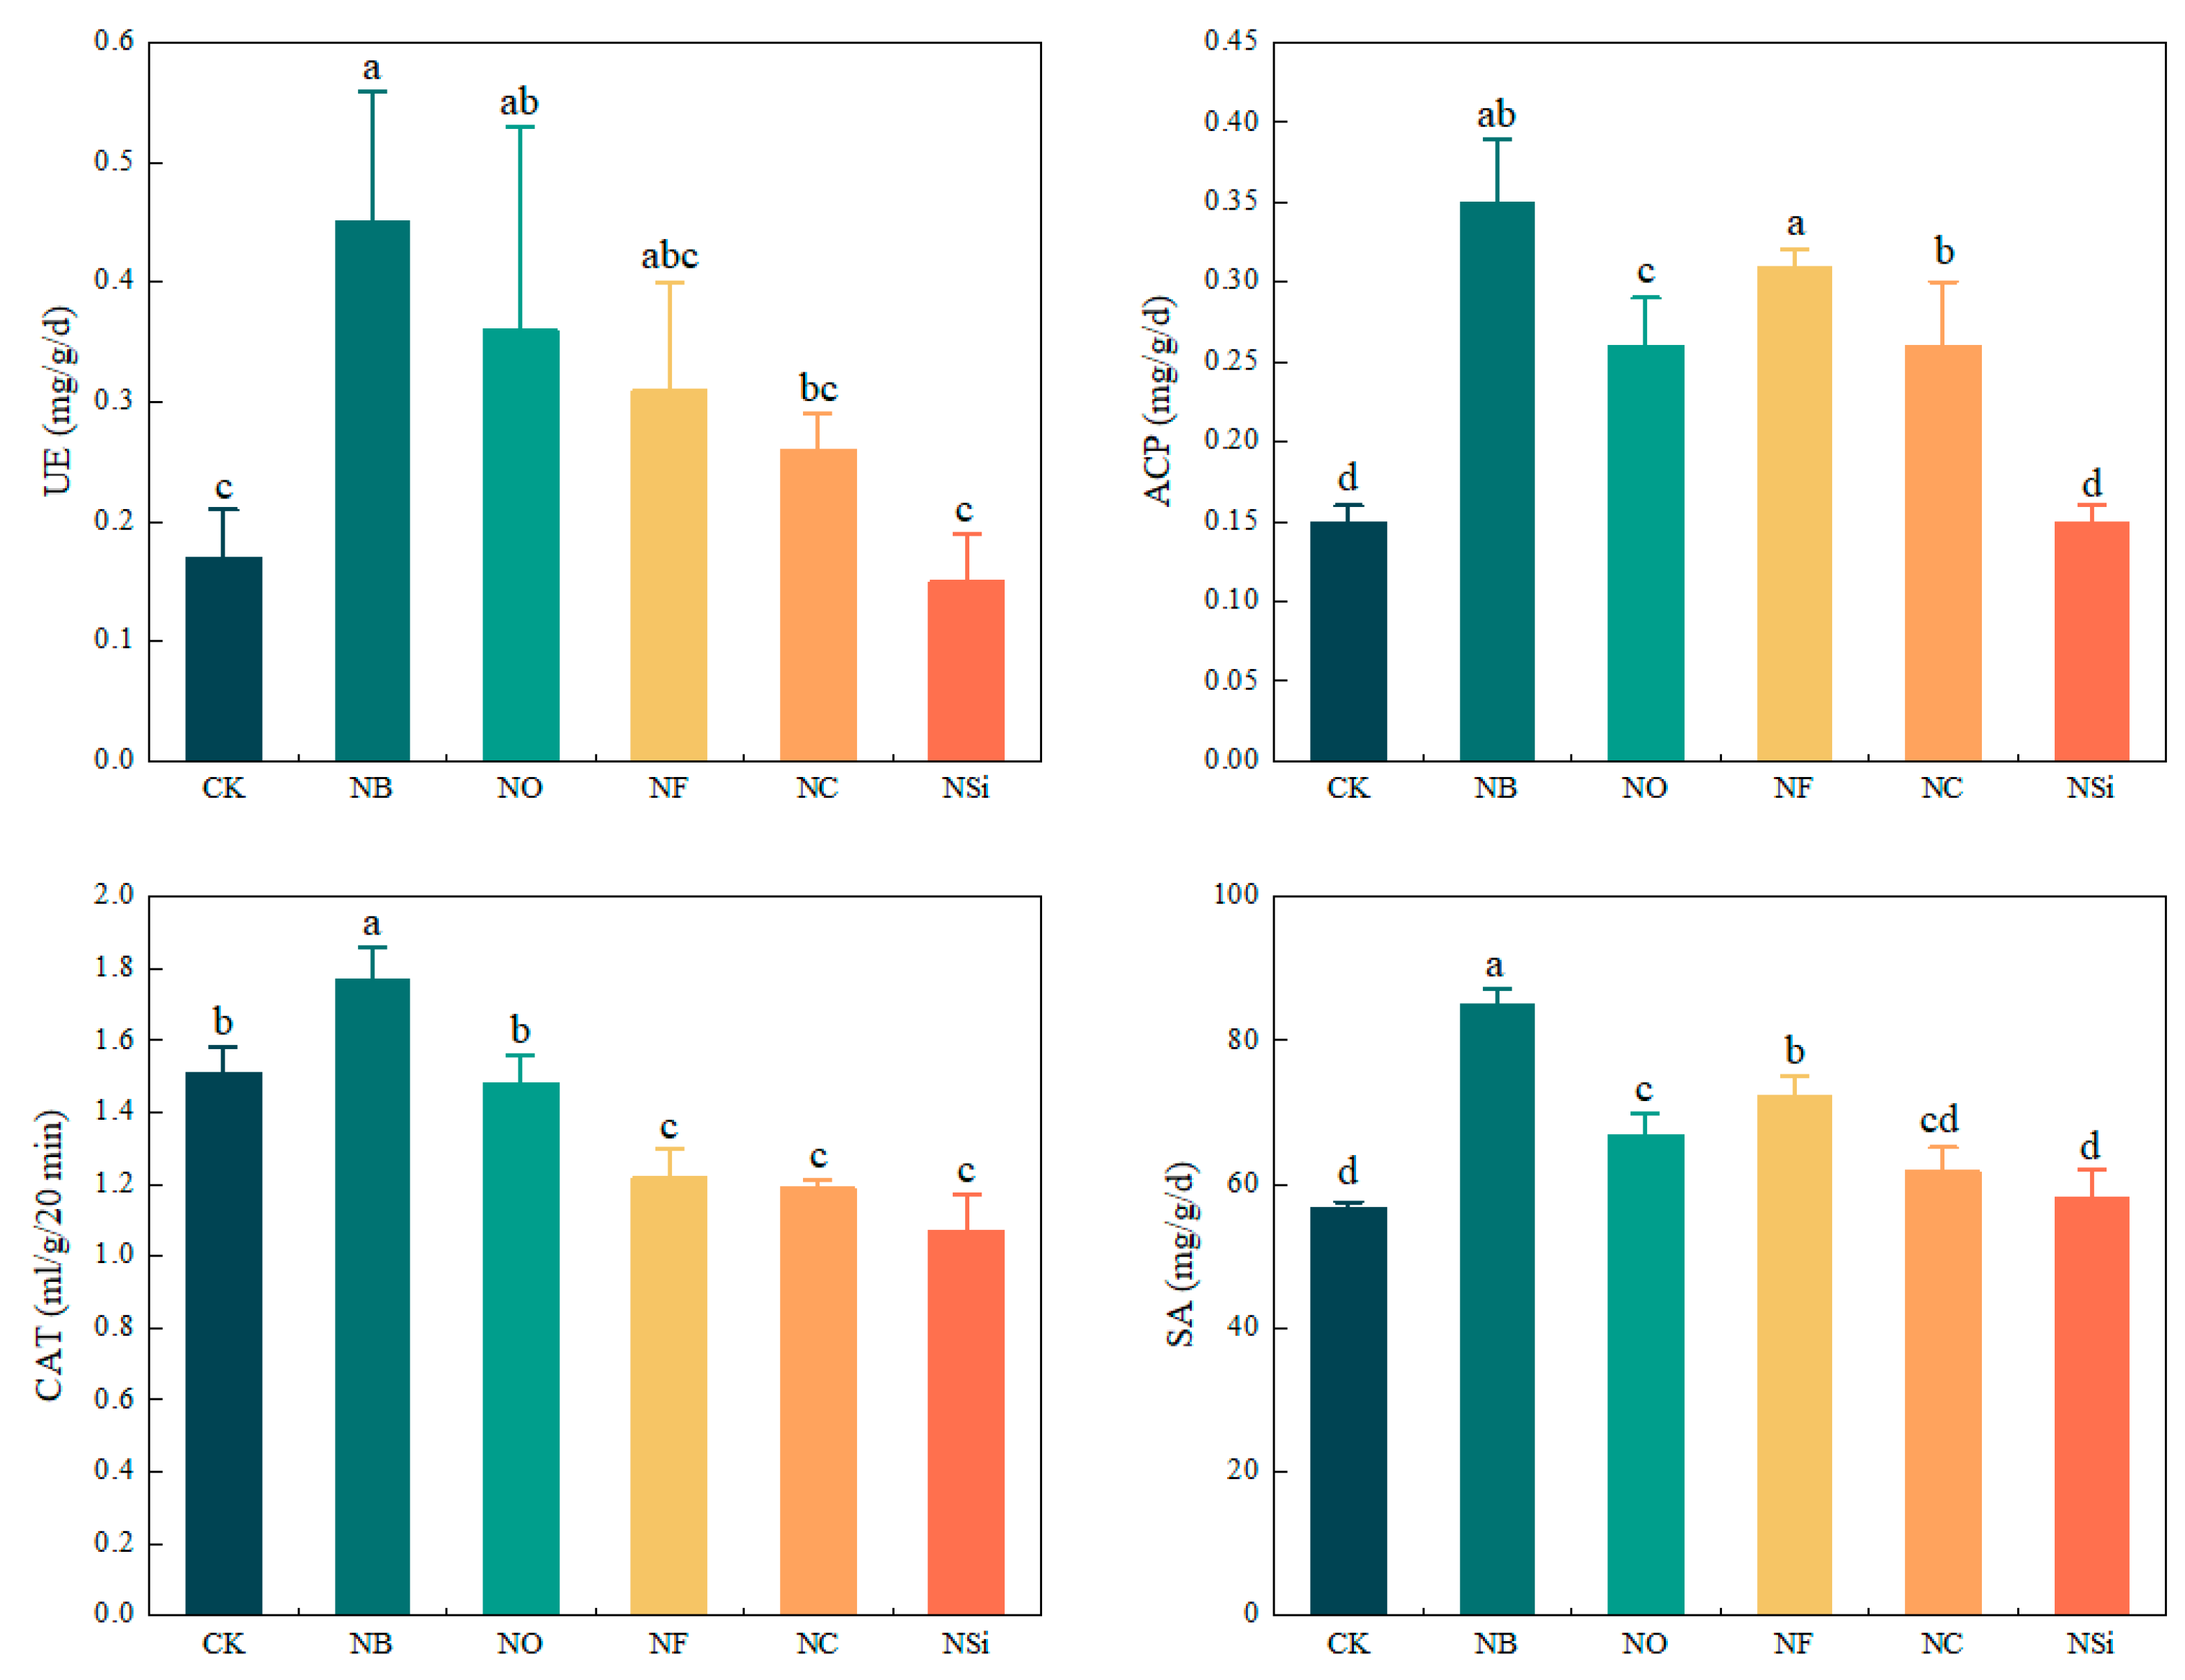
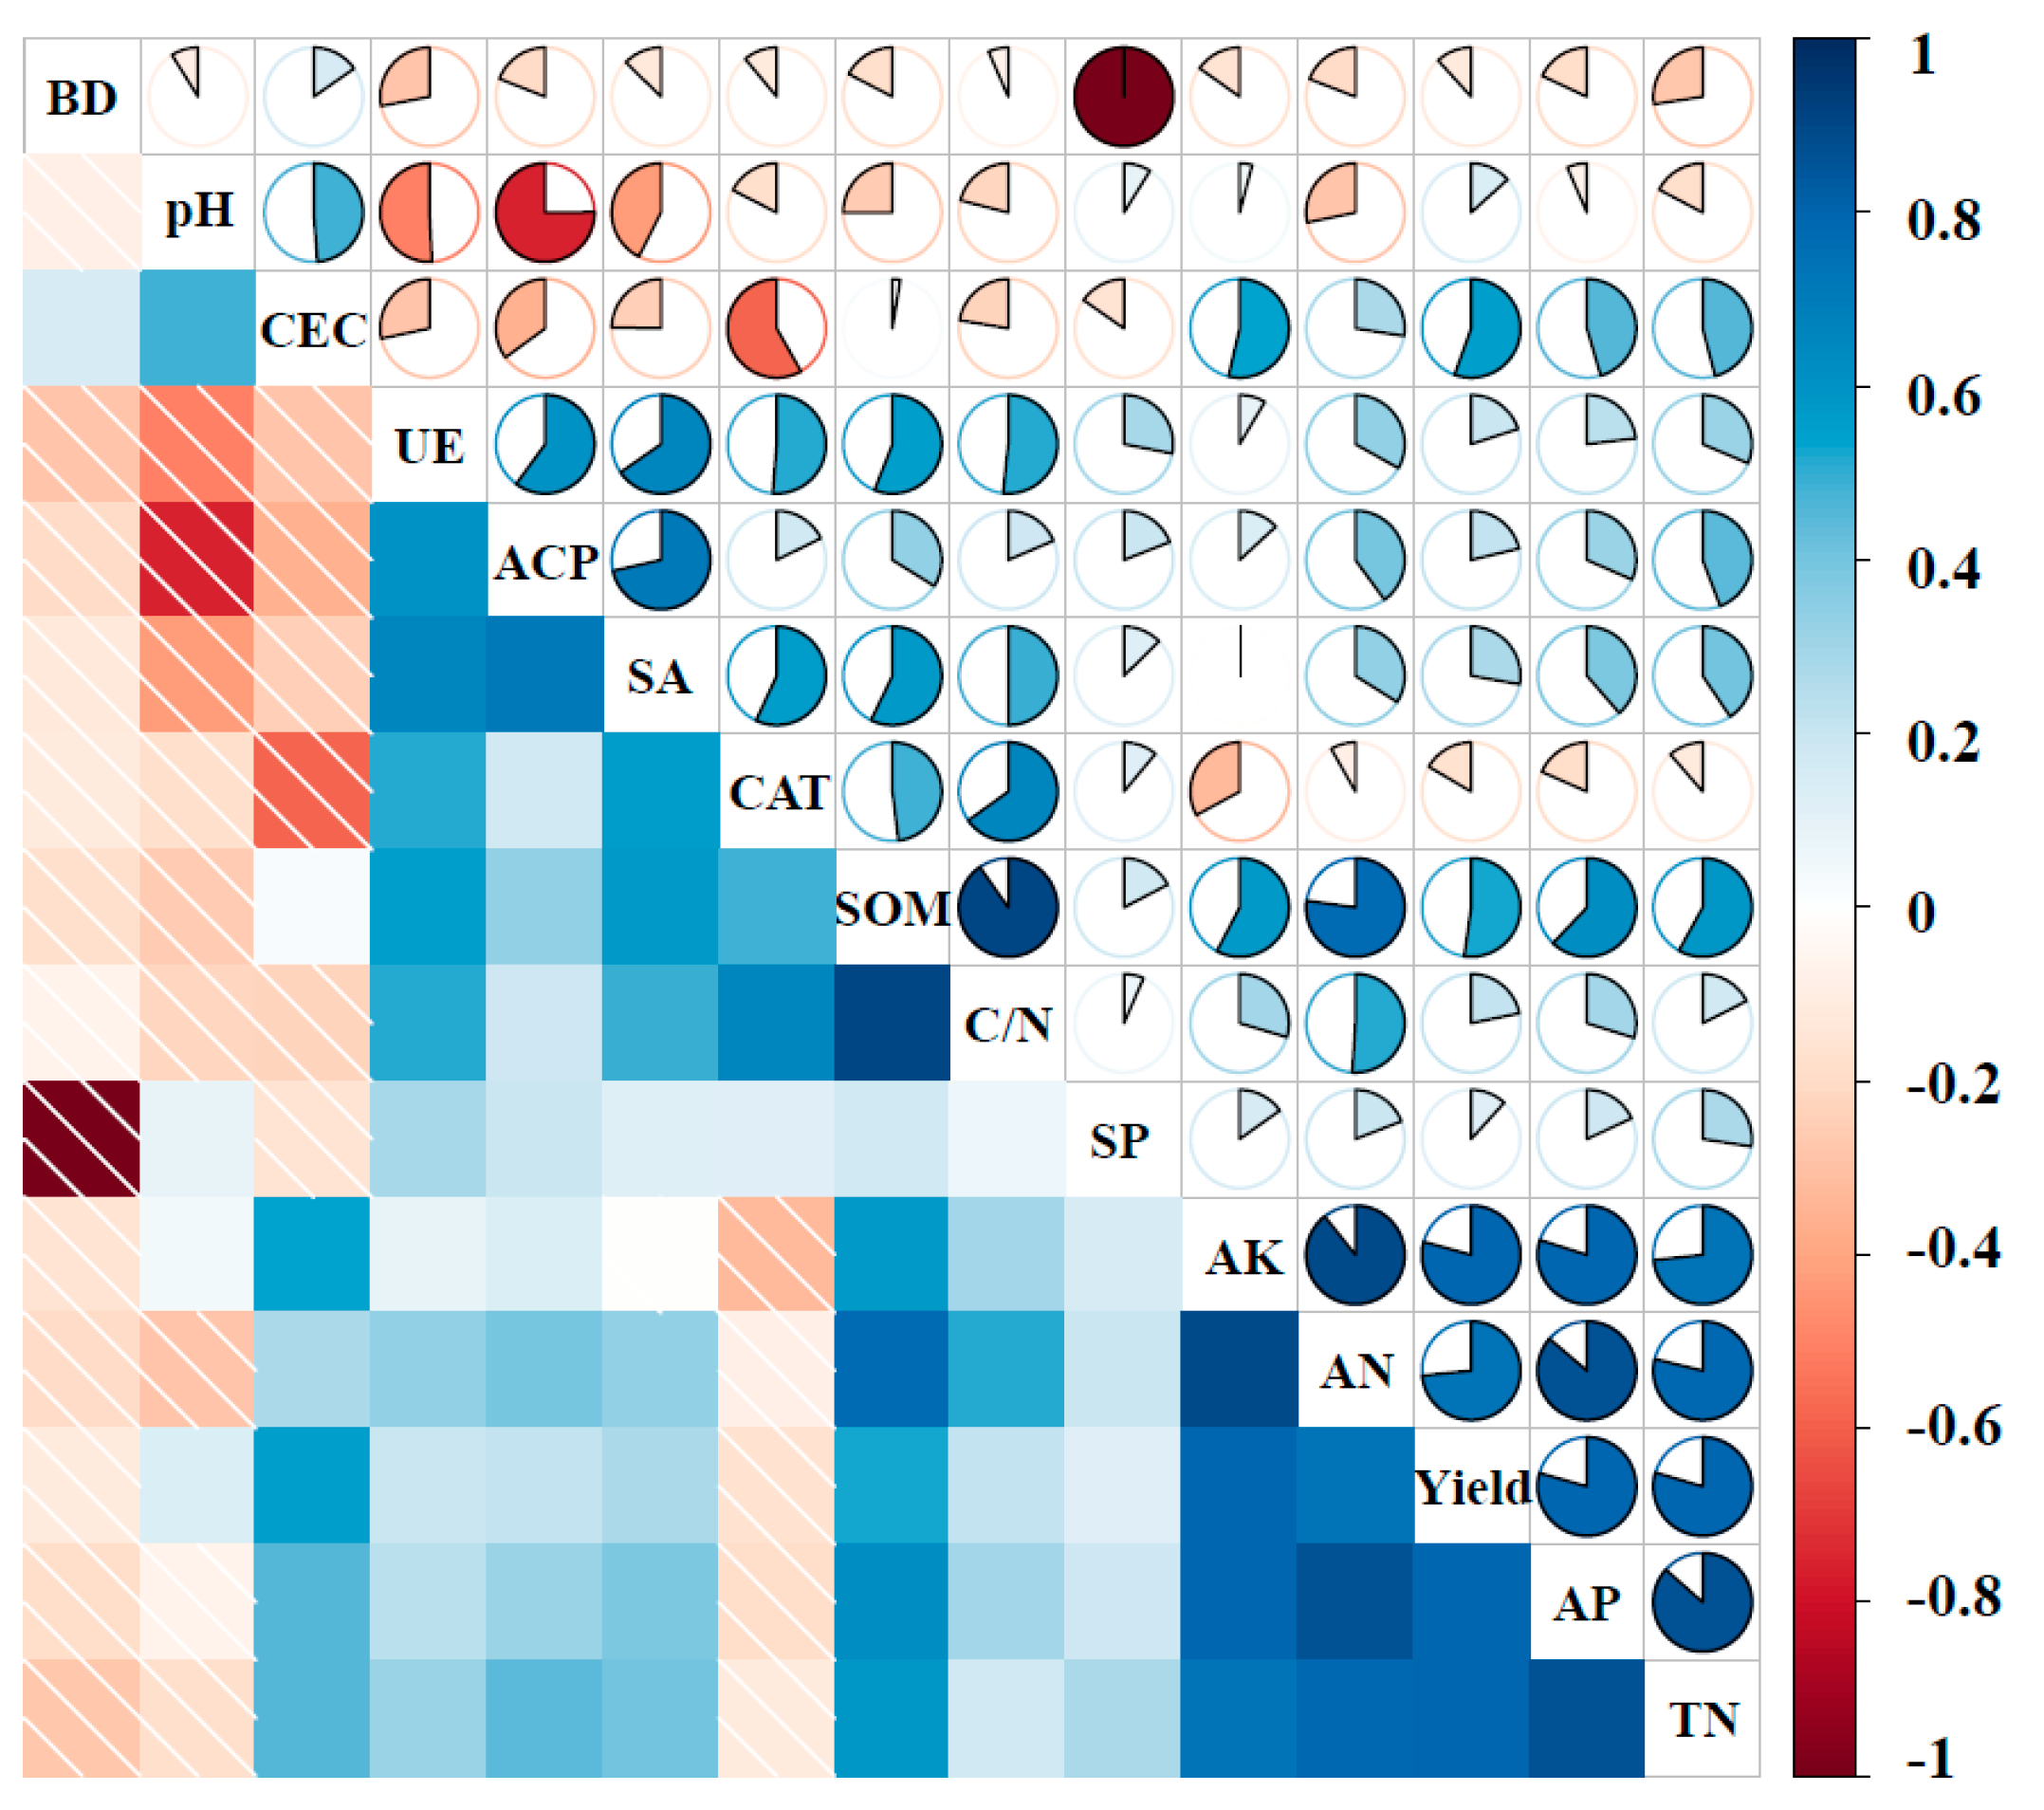
3.1. Effects of Different Treatments on Physical and Chemical Properties of Topsoil and Soil Enzyme Activity

The analysis results of soil physical and chemical properties in the experimental field (Table 4) showed that there was no significant difference in the two indexes of soil bulk density and porosity at the harvest stage under different treatments. The range of soil bulk density was 1.16–1.22 g/cm3, and the range of porosity was 54.02–56.17%. The average bulk density of the high-yield paddy field was 1.25 ± 0.12 g/cm3, and the average porosity was 52.6 ± 5.1%. Therefore, the physical properties of the experimental field were generally suitable for paddy growth.
It can be seen from Table 4 that, except for NSi treatment, the other four treatments significantly reduced the soil pH value compared with CK treatment, among which NC treatment had the most significant effect, followed by NF treatment, which may be due to the large amount of acidic substances in the acid soil conditioner applied by NC treatment and the large amount of fulvic acid in the fulvic acid biomass nutrient solution applied by NF treatment. In terms of soil CEC content, the improvement effect of NSi treatment was more significant, followed by NO treatment. The effects of different treatments on soil available nutrients and organic matter content were also great. Compared with CK, the other five treatments increased the contents of total nitrogen, available nitrogen, available phosphorus, and available potassium in the soil, among which the improvement effect of NF treatment and NO treatment was the most obvious. NF treatment was slightly better than NO treatment in improving soil total nitrogen and available phosphorus content, while NO treatment was slightly better than NO treatment in improving soil available nitrogen and available potassium content. And NO treatment significantly increased the content of soil organic matter, different treatments in the improvement of soil organic matter content showed: NO > NB > NF > NSi > CK > NC.
The enzyme activity of topsoil at the harvest stage under different treatments is shown in Figure 1. NB treatment had a significant effect on improving soil enzyme activity. This treatment significantly increased soil urease, catalase, and sucrase activities, but NF treatment was slightly better than NB treatment in enhancing acid phosphatase activity. Among several treatments, NSi treatment inhibited the activity of four enzymes, and NC treatment also inhibited catalase activity. NO treatment also has a certain effect on enhancing the activity of several enzymes, but the effect is not as good as NB treatment.
We conducted a descriptive analysis of soil indicators, presented in Table 5. According to the principle that a coefficient of variation (CV) of less than 10% indicates weak variability, 10% to 100% indicates medium variability and greater than 100% indicates strong variability, we combined this with the data in Table 5. It was determined that SP, BD, pH, CEC, and AN exhibit weak variability. The content of these indicators in the soil is relatively stable and not easily affected by other environmental factors. The coefficient of variation for the remaining indicators ranges from 10% to 100%, placing them in the medium variability category. Notably, UE, ACP, and SOM have the highest coefficients of variation, indicating a significant response to different fertilization treatments.

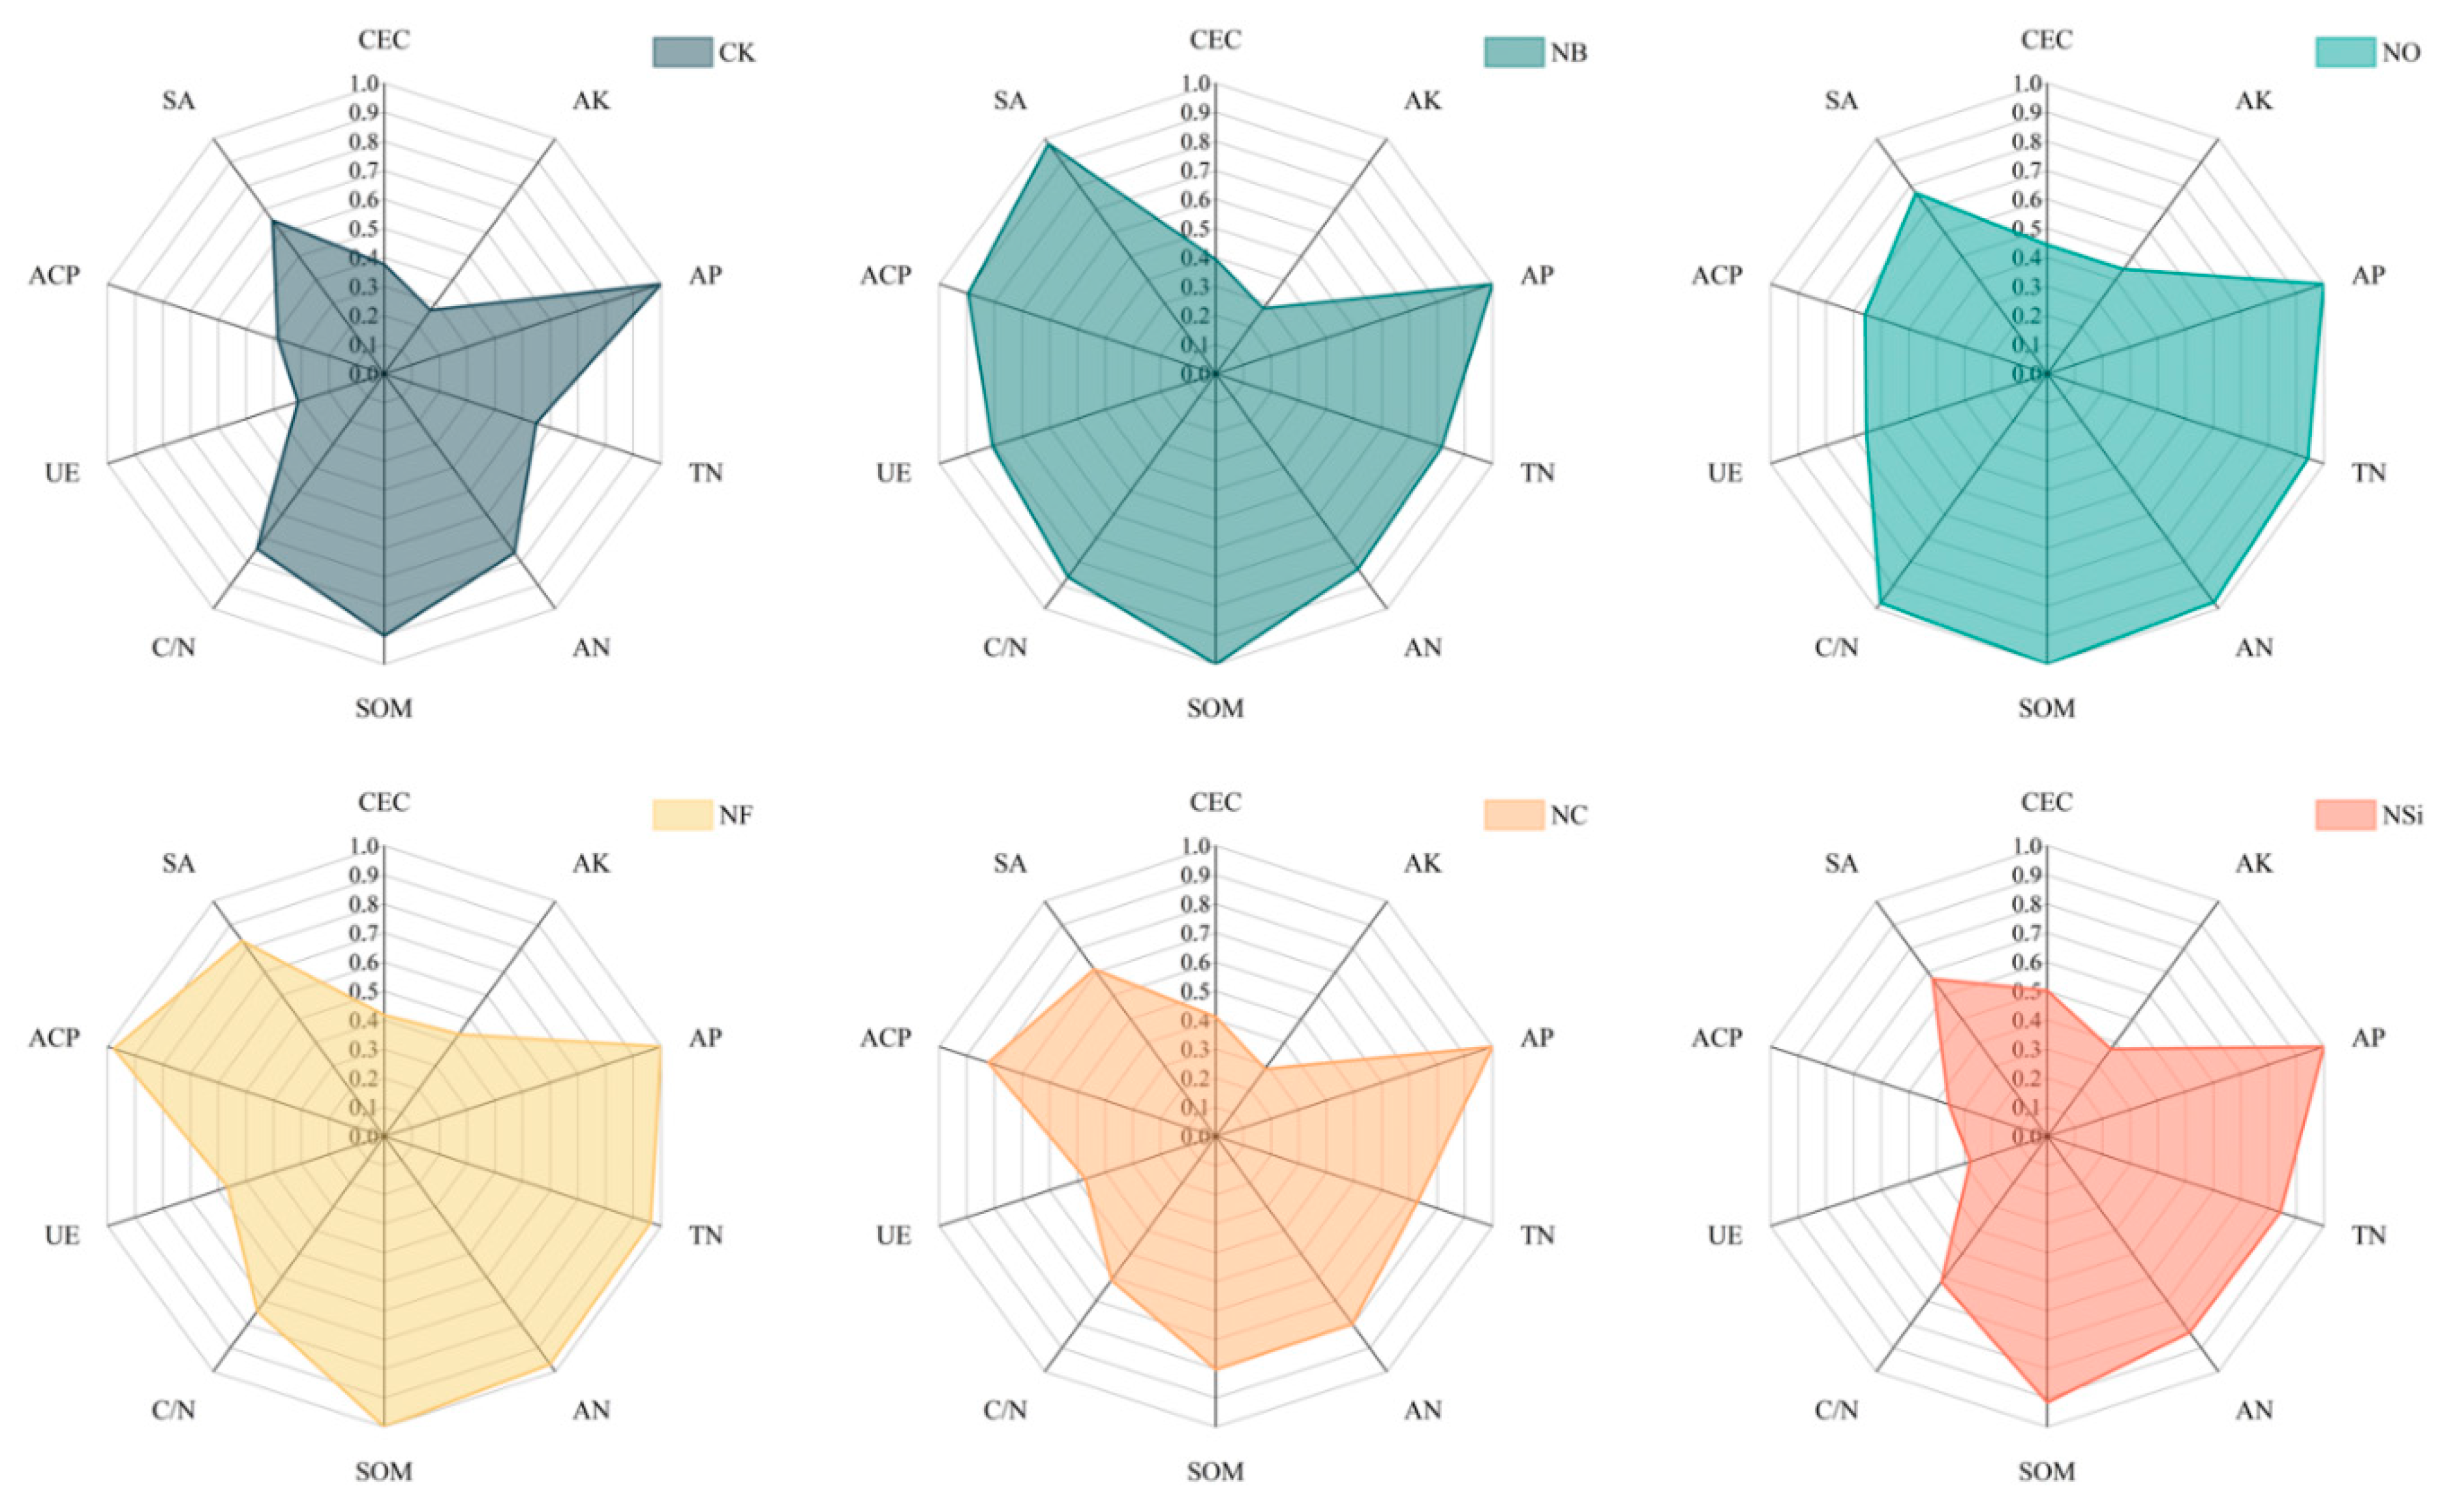
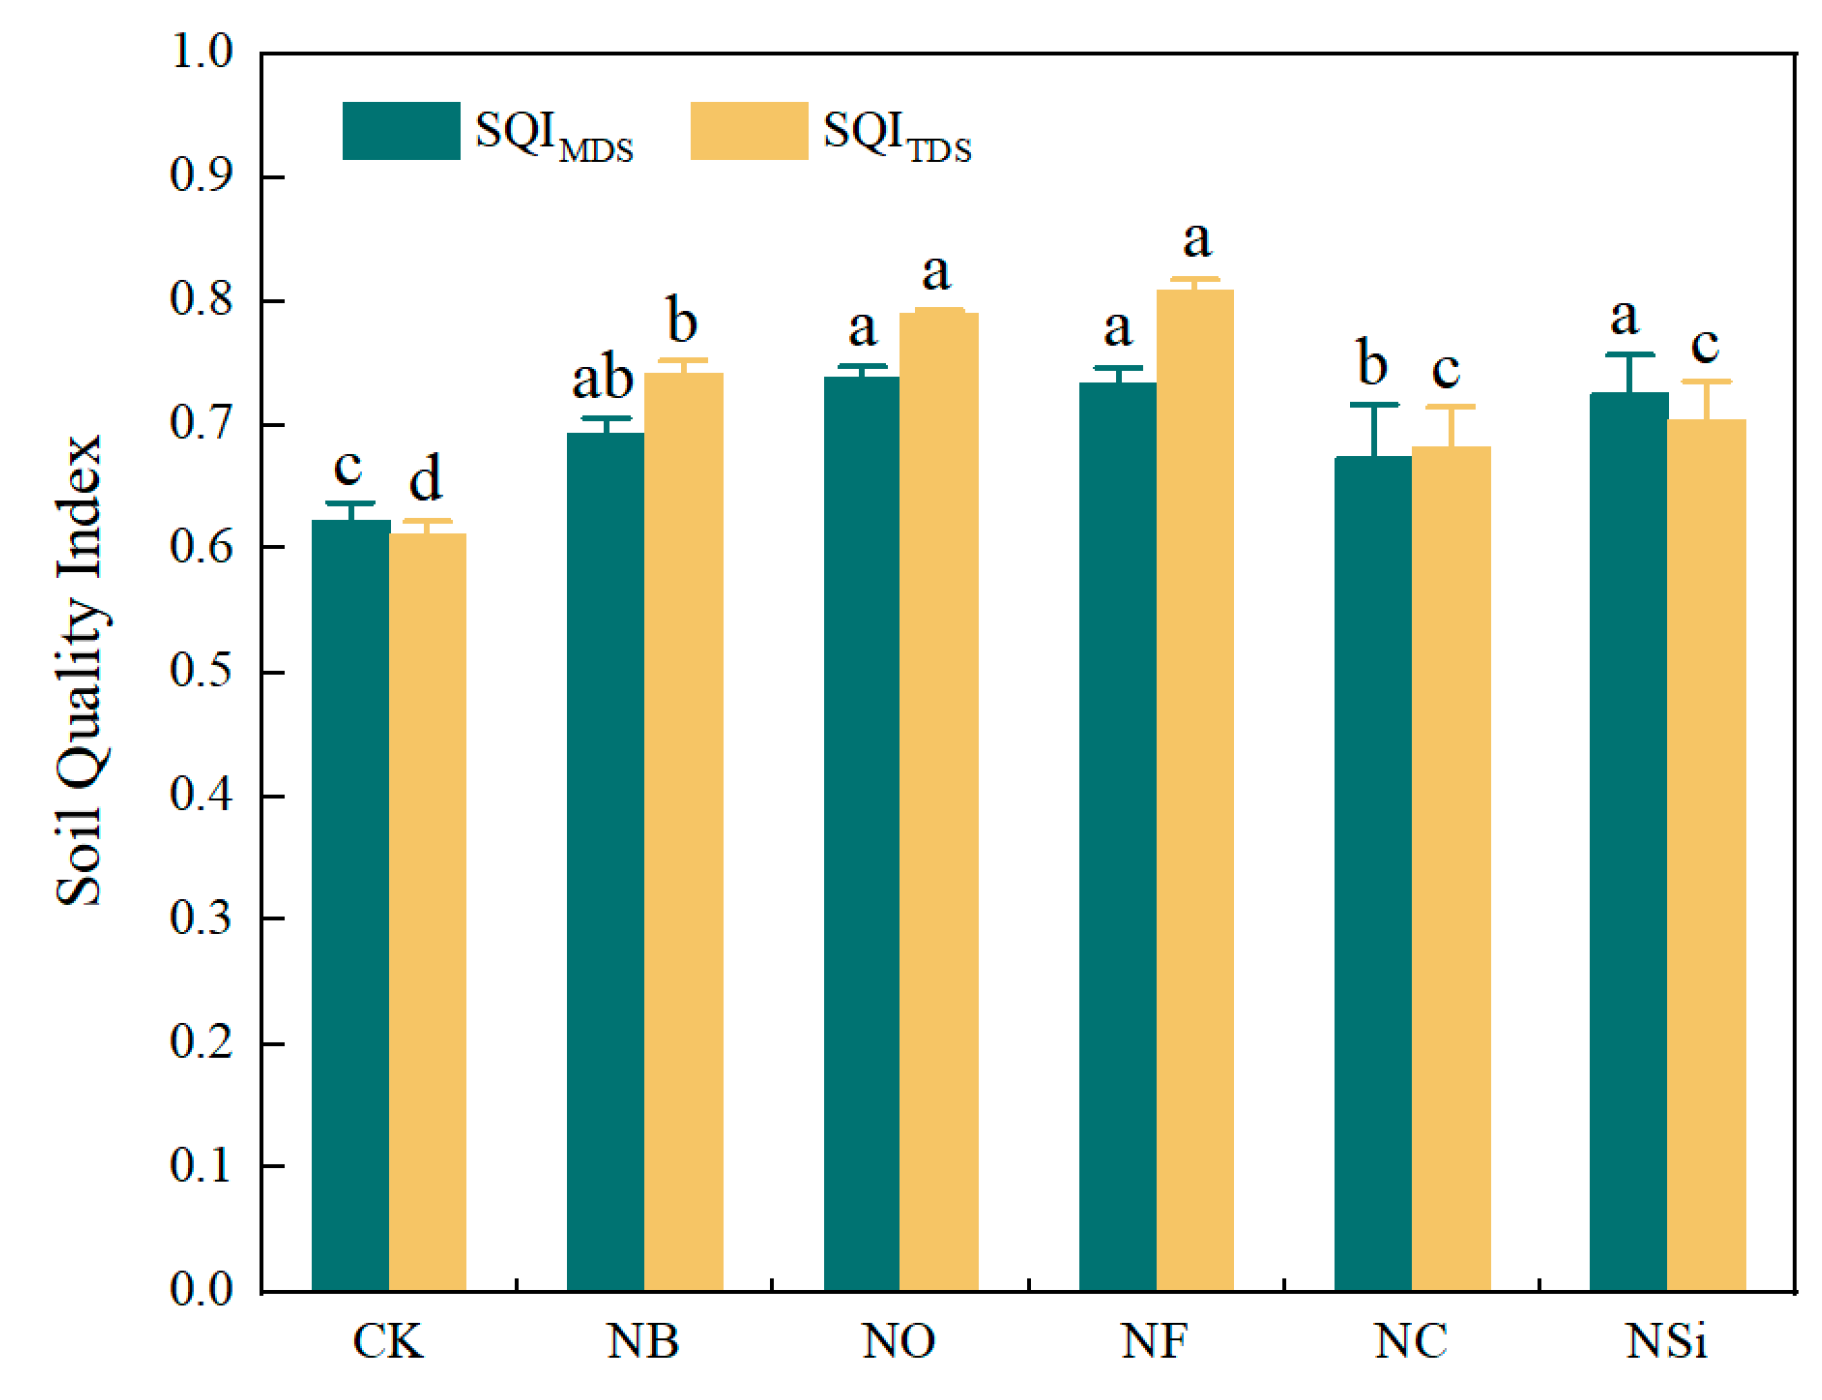
3.2. Effects of Different Treatments on SQI

Pearson correlation analysis was carried out between all indicators and yield. The indicators with correlation > 0.2 were CEC, AP, AK, TN, AN, SOM, C/N, UE, ACP and SA (Figure 2). These 10 indicators were used as TDS. Principal component analysis was performed on these 10 indicators (KMO = 0.634 > 0.6, the selected indicators are suitable for principal component analysis), and the common factor variance and weight value of each indicator were obtained (Table 6). Because these 10 indicators are significantly different under different treatments, the principal component analysis results of the TDS can be used to determine the MDS. It can be seen from Table 6 that the cumulative contribution rate of the first three principal components with eigenvalues greater than 1 to the total variance reached 87.2%, and the common factor variance of each index exceeded 30%, indicating that the first three principal components can better reflect the soil indicators and overall information, combined with Table 7 to determine the final MDS.
Under each principal component, the indicators with factor loadings within the top 10% range are considered as high-weight variables. For the first principal component, all indicators have positive loadings, with high-weight variables including AP, TN, AN, and SOM. Among these, AN has the highest loading value and is selected for inclusion in the MDS. Since the correlation coefficient between CEC and AN is 0.275 < 0.6, and between C/N and AN is 0.51 < 0.6, both CEC and C/N are included in the MDS. The correlation coefficients of the other variables with AN are all above 0.6, with AP having the highest correlation coefficient. Thus, AP is also included in the MDS. For the second and third principal components, the variables with the highest loading values are CEC and C/N, respectively, both of which have already been included in the MDS. As the loadings of the other variables are relatively small, the final selected indicators for the MDS are AN, CEC, C/N, and AP.
The index of the above TDS is calculated according to the relevant formula to calculate its membership value and made into a radar plot (Figure 3). The closer the point distance 1 on the radar map coordinates is, the better its membership degree is proved. On the contrary, the closer to the center, the farther away from the ideal value, the worse its attribute state. The polygon area composed of each point can also reflect the overall level of the evaluation object. The larger the area is, the more ideal the overall soil fertility is [29]. It can be seen from Figure 3 that the soil fertility level under NB, NO, and NF treatments was higher than that of the other three treatments. On the whole, the two indexes of AK and CEC are the closest to the center point under different treatments. The membership values of AK are less than 0.45, and the membership values of CEC are less than 0.51, which are the most obvious constraints on the polygon area, indicating that these two indexes are the most serious fertility constraints of the tested soil.
According to the above calculation formula, the TDS and the MDS were used to calculate the SQI and the calculation results are shown in Figure 4. The results of the two calculations showed that compared with CK treatment, the other five treatments significantly increased the SQI. Under the TDS, the SQI of NO treatment and NF treatment was significantly higher than that of other treatments, while under the MDS, the SQI of NO, NF, and NSi treatment was higher than that of other treatments. The results obtained by the MDS and the TDS are basically the same, with only slight differences.

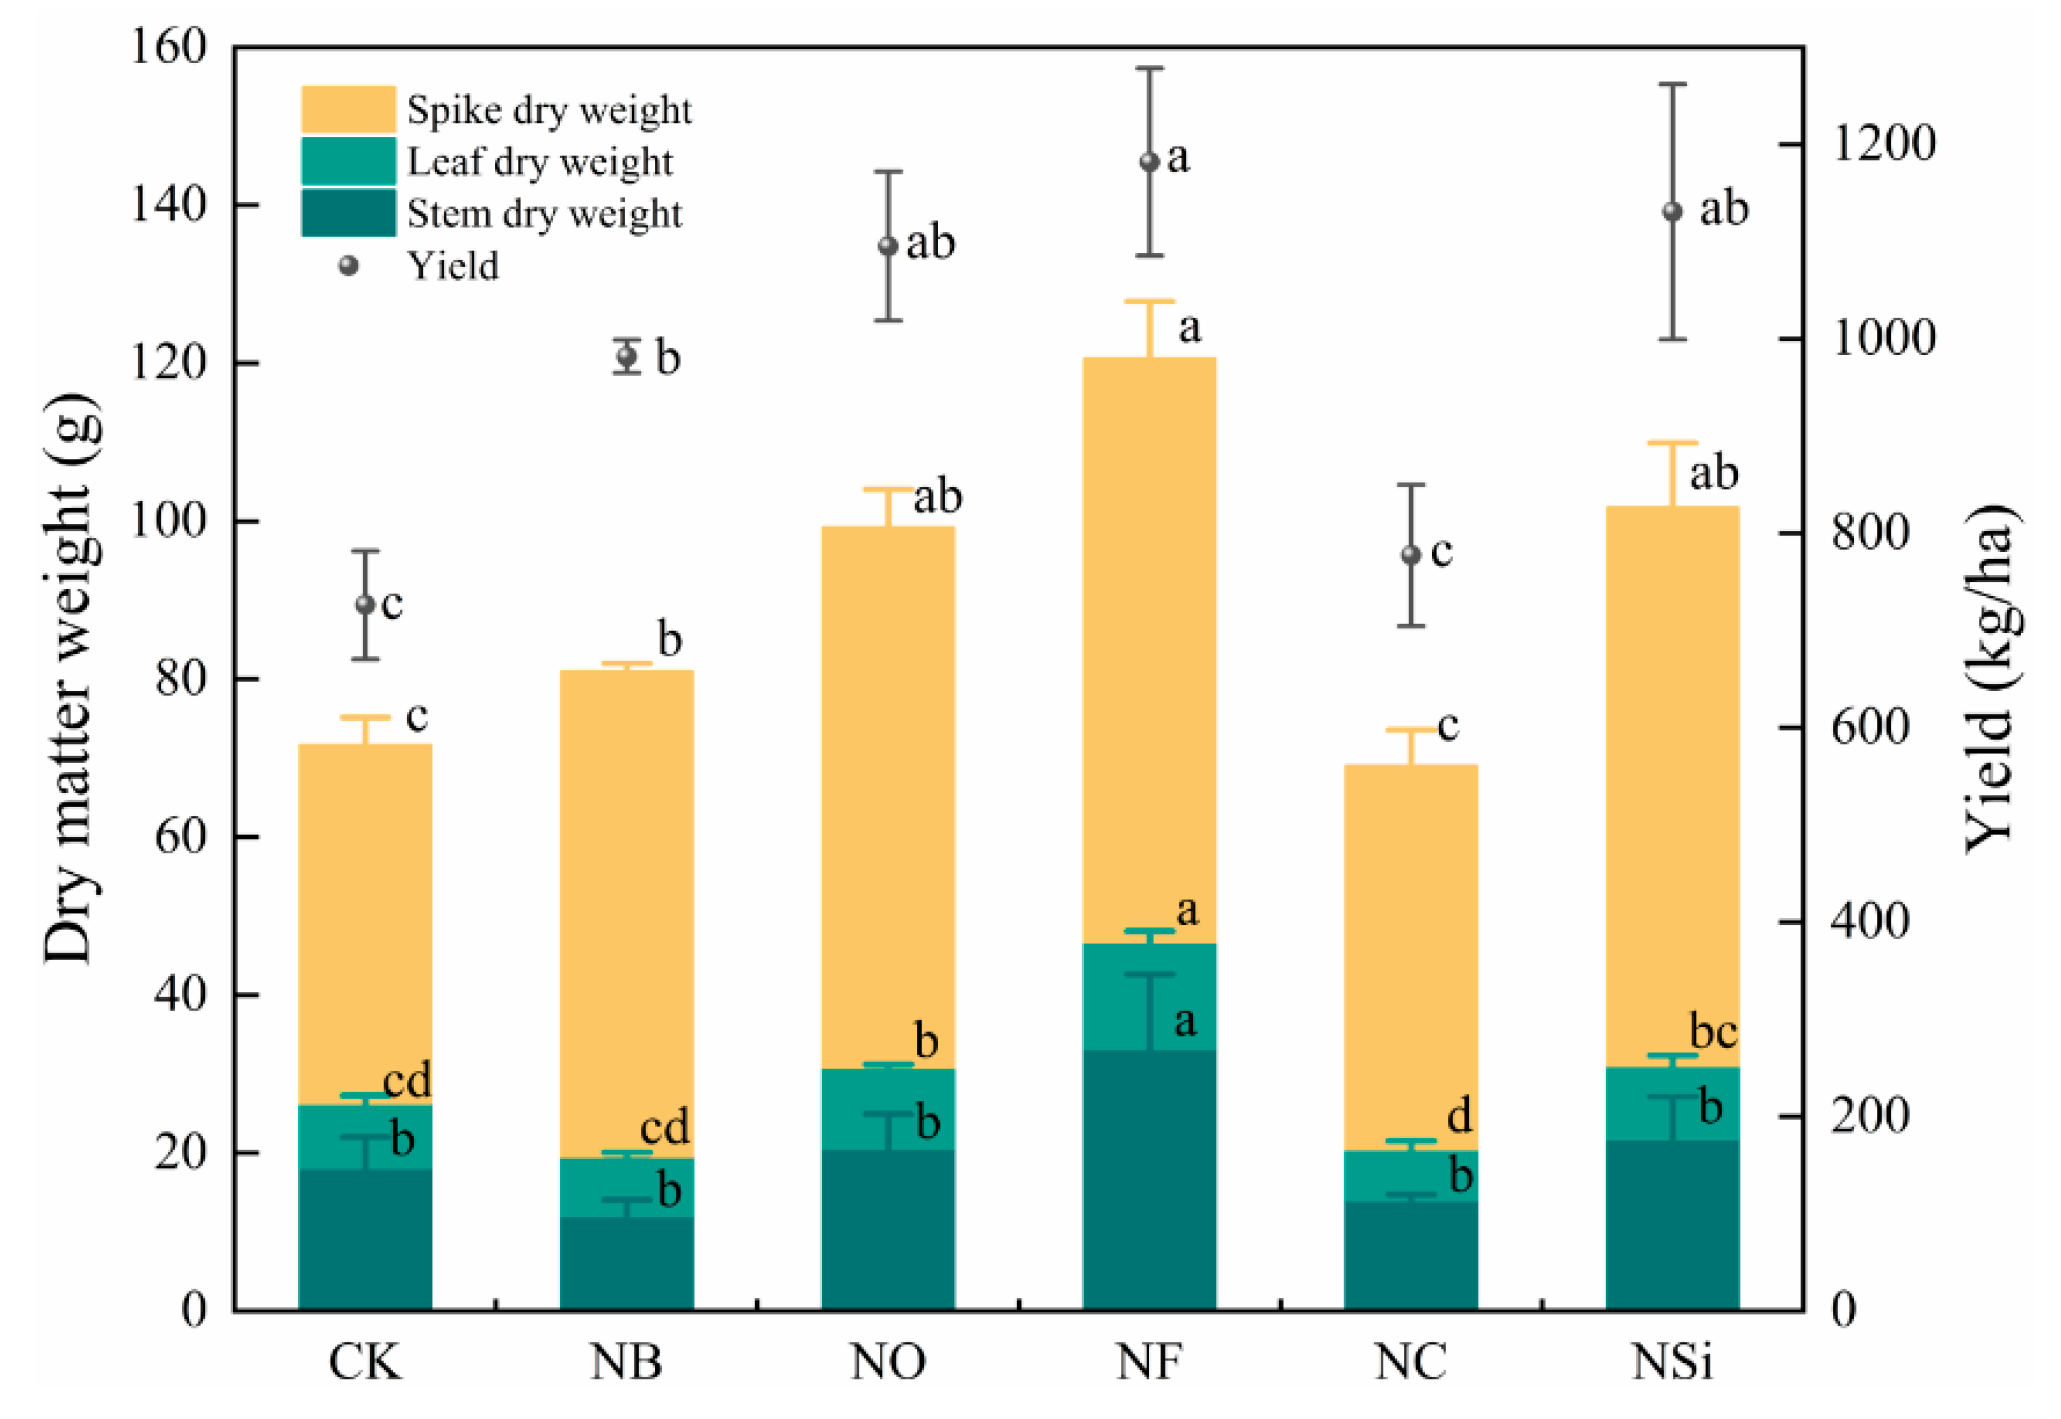
3.3. Effects of Different Treatments on Paddy Yield

The yield and dry matter accumulation and distribution of each rice plant under different treatments are shown in Figure 5. It can be seen from the Figure that except for NC treatment, all treatments can significantly increase the paddy yield and the total dry matter of each part of the paddy compared with CK. In particular, NF treatment was significantly different from other treatments in increasing yield and dry matter accumulation.
It can be seen from Table 8 that the SQI of the MDS and the SQI of the TDS were significantly positively correlated with the yield (p < 0.01). The correlation coefficient between SQIMDS and yield is closer to 1. It can be seen that the indicators selected in the MDS can better reflect the difference in the impact of different treatments on yield, and the MDS can better characterize soil fertility.

4. Discussion

4.1. Effects of Chemical Fertilizer Combined with Different Soil Additives on Soil Properties of Plough Layer

Soil fertility signifies the richness of the soil and embodies a comprehensive depiction of its physical, chemical, and biological attributes. It serves as the cornerstone for grain production and yield enhancement. In this study, a total of 14 soil indicators were measured to evaluate the effects of chemical fertilizers combined with different soil additives on soil fertility and soil improvement. Numerous studies have demonstrated that long-term reliance solely on chemical fertilizers not only decreases soil organic matter content and fertilizer efficiency but also leads to soil ecological pollution. Combining chemical fertilizers with soil amendments not only improves soil properties but also enhances soil productivity and crop yields. Compared to treatments with only chemical fertilizers, all treatments with soil additives significantly alter most soil indicators, directing them toward higher membership values. However, some treatments may exhibit adverse effects on certain soil indicators. It is worth mentioning that the treatment of chemical fertilizer combined with silicon-calcium-magnesium-potassium fertilizer increased the soil pH value compared with the CK treatment. The reason lies in the high solubility of silicates, which, upon entering the soil, hydrolyze to produce OH, effectively neutralizing soil H+ and raising the soil pH [36]. In addition, silicate also has strong mobility, which can carry base ions from the surface layer to the subsurface layer under a large amount of application and increase the content of base ions and soil pH in the subsurface layer. The treatment of silicon-calcium-magnesium-potassium fertilizer also inhibited four measured soil enzyme activities, which was consistent with the results of Shi et al. [37]. While silicon-calcium-magnesium-potassium fertilizer is not suitable for the improvement of some soil indicators, it significantly increases the yield of paddy compared with CK treatment. This can be attributed to the fact that paddy is a typical silicon-loving crop. Silicon fertilizer can significantly improve the aerenchyma in paddy plants, enhance the oxidation ability of roots, eliminate or reduce the toxicity of reducing substances in the field to paddy roots, and enhance the activity of nitrogen, phosphorus, and other nutrients in paddy [19,37]. On the whole, the bulk density and porosity of the tested soil are generally suitable for paddy growth, but the contents of total nitrogen, alkali-hydrolyzable nitrogen, and sucrase in the soil are all up to the standard of high-quality paddy fields, and the pH value is higher than the optimum range of paddy growth. These indicators need to be improved in the future.

4.2. Effects of Chemical Fertilizer Combined with Different Soil Additives on Soil Quality Evaluation

Among various evaluation methods of soil quality, the most commonly used is the comprehensive index method, followed by the improved Nemero index method, but the latter is mostly used to evaluate the soil environmental quality, and the comprehensive index method is used to evaluate the soil fertility quality, that is, the method used in this paper. For the evaluation of soil fertility quality, it is very important to select appropriate indicators to construct data sets [33,38]. The selected indicators should not only comprehensively summarize soil information, but also not be too redundant [35]. Soil fertility quality is a comprehensive reflection of soil’s physical properties, chemical properties, and biological properties, and the selected indicators must be representative. When used to evaluate the effect of agronomic measures on soil quality in the short term, it is not appropriate to use more stable and long-term indicators, such as soil texture, slope, etc. In this paper, referring to the previous research methods, the indexes with yield correlation coefficient greater than 0.2 are selected into the TDS, and the principal component analysis method is used to screen the MDS and determine the weight, so as to select the most representative indexes. In this study, the SQI obtained from the TDS and the MDS was basically the same. Compared with the single application of chemical fertilizer, the combination of chemical fertilizer and soil amendment could significantly improve most soil fertility indexes and Soil Quality Indexes, which was basically consistent with the previous research results [30,37,39,40]. It has been proposed in the relevant literature that the MDS can replace the TDS to analyze the SQI, and it is economical and time-saving. The trend of SQITDS and SQIMDS calculated in this study is basically the same. The correlation coefficient between SQITDS and SQIMDS is as high as 0.880 (p < 0.01), and the correlation coefficient between SQIMDS and yield is higher than that between SQITDS and yield. The correlation coefficient again shows that the MDS can replace the TDS for soil fertility quality evaluation, and the construction of the MDS for SQI calculation is a simple and reliable soil fertility evaluation method. The radar map of soil indicator membership values (Figure 3) shows that AK and CEC are close to the center, indicating these two indicators are far from their ideal values, which limits soil fertility improvement. Compared with single applications of chemical fertilizer, all treatments except NB significantly increased available potassium, improving these indicators.

5. Conclusions

Compared with a single application of chemical fertilizer, chemical fertilizer combined with soil additives could significantly improve the soil fertility index after harvest, among which chemical fertilizer combined with fulvic acid biomass nutrient solution had the best effect. Both the SQI based on the TDS (SQITDS) and the one based on the Minimal Data Set (SQIMDS) effectively reflect soil fertility quality. They exhibit a significant correlation, with SQIMDS showing a higher correlation with yield. Thus, SQIMDS can be utilized to assess soil quality in the area.
It should be noted that this study was conducted for only one year, indicating that there may be many aspects that need further improvement. Therefore, the findings of this study are only intended to provide a reference for the rational soil fertilization methods for newly cultivated land in mountainous areas lacking production materials. Subsequent to this, we will continue to refine the experimental design and proceed with further research.

Author Contributions

Conceptualization, T.Z., S.W. and N.W.; methodology, T.Z., S.W. and N.W.; investigation, H.S. and X.Z.; data curation, N.W.; writing—original draft preparation, N.W.; writing-review and editing, N.W. and T.Z.; visualization, N.W.; supervision, T.Z.; project administration, S.W. and H.L. All authors have read and agreed to the published version of the manuscript.

Funding

This research was funded by the National Key R&D Program of China (2023YFD2001400); the Key R&D Program of Shaanxi (2023-ZDLNY-53); and the Innovation Capability Support Program of Shaanxi (2022PT-23).

Data Availability Statement

The data presented in this study are available on request from the corresponding author. The data are not publicly available due to ethical restrictions.

Conflicts of Interest

The authors declare no conflicts of interest.

References

  1. Li, X.; Zhang, W.; Wu, L.; Ren, Y.; Zhang, J.; Xu, M. Advance in indicator screening and methodologies of soil quality evaluation. Sci. Agric. Sin. 2021, 54, 3043–3056. [Google Scholar] [CrossRef]
  2. Smith, E.G.; Lerohl, M.; Messele, T.; Janzen, H.H. Soil Quality Attribute Time Paths: Optimal Levels and Values. J. Agric. Resour. Econ. 2000, 25, 307–324. [Google Scholar] [CrossRef]
  3. Kirschbaum, S.E.K.; Baeumner, A.J. A review of electrochemiluminescence (ECL) in and for microfluidic analytical devices. Anal. Bioanal. Chem. 2015, 407, 3911–3926. [Google Scholar] [CrossRef] [PubMed]
  4. Lal, R. Restoring Soil Quality to Mitigate Soil Degradation. Sustainability 2015, 7, 5875–5895. [Google Scholar] [CrossRef]
  5. Smith, P.; House, J.I.; Bustamante, M.; Harper, J.S.R.; Pan, G.; West, P.C.; Clark, J.M.; Adhya, T.; Rumpel, C.; Paustian, K.; et al. Global change pressures on soils from land use and management. Glob. Change Biol. 2016, 22, 1008–1028. [Google Scholar] [CrossRef] [PubMed]
  6. Piscitelli, L.; Mezzapesa, G.N.; Mondelli, D.; Miano, T. Mediterranean soil fertility management for economically feasible and environmentally sustainable production of organic tomatoes. Agrochimica 2020, 64, 107–120. [Google Scholar] [CrossRef]
  7. Meng, F.; Qiao, Y.; Wu, W.; Smith, P.; Scott, S. Environmental impacts and production performances of organic agriculture in China: A monetary valuation. J. Environ. Manag. 2017, 188, 49–57. [Google Scholar] [CrossRef]
  8. Tao, C.; Li, R.; Xiong, W.; Shen, Z.; Liu, S.; Wang, B.; Ruan, Y.; Geisen, S.; Shen, Q.; Kowalchuk, G.A. Bio-organic fertilizers stimulate indigenous soil Pseudomonas populations to enhance plant disease suppression. Microbiome 2020, 8, 137. [Google Scholar] [CrossRef] [PubMed]
  9. Kuila, D.; Ghosh, S. Aspects, problems and utilization of Arbuscular Mycorrhizal (AM) application as bio-fertilizer in sustainable agriculture. Curr. Res. Microb. Sci. 2022, 3, 100107. [Google Scholar] [CrossRef]
  10. Ditzler, C.A.; Tugel, A.J. Soil Quality Field Tools. Agron. J. 2002, 94, 33–38. [Google Scholar] [CrossRef]
  11. Zahedifar, M. Assessing alteration of soil quality, degradation, and resistance indices under different land uses through network and factor analysis. Catena 2023, 222, 106807. [Google Scholar] [CrossRef]
  12. Andrews, S.S.; Karlen, D.L.; Mitchell, J.P. A comparison of SQIing methods for vegetable production systems in Northern California. Agric. Ecosyst. Environ. 2002, 90, 25–45. [Google Scholar] [CrossRef]
  13. Zhang, G.; Bai, J.; Xi, M.; Zhao, Q.; Lu, Q.; Jia, J. Soil quality assessment of coastal wetlands in the Yellow River Delta of China Based on the Minimum Data Set. Ecol. Indic. 2016, 66, 458–466. [Google Scholar] [CrossRef]
  14. Nabiollahi, K.; Golmohamadi, F.; Taghizadeh-Mehrjardi, R.; Kerry, R.; Davari, M. Assessing the effects of slope gradient and land use change on soil quality degradation through digital mapping of soil quality indices and soil loss rate. Geoderma 2018, 318, 16–28. [Google Scholar] [CrossRef]
  15. Qiao, Y.; Zhong, X.; Miao, S.; Li, Q.; Lu, X. Evaluation Indicators of Soil Quality in plough layer of aeolian sandy land in northeast china based on Minimum Data Set. Res. Soil Water Conserv. 2019, 26, 132–138. [Google Scholar] [CrossRef]
  16. Guo, J.; Zhao, G.; Jia, S.; Dong, J.; Chen, L.; Wang, S. Comprehensive evaluation of effects of fertilization on grassland quality index and soil properties in alpine steppe. Acta Pratac. Sin. 2020, 29, 85–93. [Google Scholar] [CrossRef]
  17. Gong, H.; Li, J.; Ma, J.; Li, F.; Ouyang, Z.; Gu, C. Effects of tillage practices and microbial agent applications on dry matter accumulation, yield and the soil microbial index of winter wheat in North China. Soil Tillage Res. 2018, 184, 235–242. [Google Scholar] [CrossRef]
  18. Li, Z.; Wei, X.; Zhu, Z.; Fang, Y.; Yuan, H.; Li, Y.; Zhu, Q.; Guo, X.; Wu, J.; Kuzyakov, Y.; et al. Organic fertilizers incorporation increased microbial necromass accumulation more than mineral fertilization in paddy soil via altering microbial traits. Appl. Soil. Ecol. 2024, 193, 105137. [Google Scholar] [CrossRef]
  19. Wang, L.; Ashraf, U.; Chang, C.; Abrar, M.; Cheng, X. Effects of Silicon and Phosphatic Fertilization on Rice Yield and Soil Fertility. J. Soil Sci. Plant Nutr. 2020, 20, 557–565. [Google Scholar] [CrossRef]
  20. Zhang, P.; Zhang, H.; Wu, G.; Chen, X.; Gruda, N.; Li, X.; Dong, J.; Duan, Z. Dose-Dependent Application of Straw-Derived Fulvic Acid on Yield and Quality of Tomato Plants Grown in a Greenhouse. Front. Plant Sci. 2021, 12, 736613. [Google Scholar] [CrossRef]
  21. Zhao, X.; Zhu, M.; Guo, X.; Wang, H.; Sui, B.; Zhao, L. Organic carbon content and humus composition after application aluminum sulfate and rice straw to soda saline-alkaline soil. Environ. Sci. Pollut. Res. 2019, 26, 13746–13754. [Google Scholar] [CrossRef] [PubMed]
  22. Jiao, P.P.; Yang, L.; Li, Z.W.; Liu, C.; Zheng, P.; Tong, D.; Chang, X.F.; Tang, C.; Xiao, H.B. Responses of microbial community composition and respiration to soil moisture in eroded soil. Appl. Soil Ecol. 2023, 181, 104662. [Google Scholar] [CrossRef]
  23. Wu, X.; Xu, H.; Liu, G.; Ma, X.; Mu, C.; Zhao, L. Bacterial communities in the upper soil layers in the permafrost regions on the Qinghai-Tibetan plateau. Appl. Soil Ecol. 2017, 120, 81–88. [Google Scholar] [CrossRef]
  24. Zhao, M.; Cong, J.; Cheng, J.; Qi, Q.; Sheng, Y.; Ning, D. Soil microbial community assembly and interactions are constrained by nitrogen and phosphorus in broadleaf forests of southern China. Forests 2020, 11, 285. [Google Scholar] [CrossRef]
  25. Yang, X.; Liu, H.L.; Huang, Y.Y.; Yang, H.Z.; Bei, M.R.; Lin, Q.H. Effect of application of organic–inorganic compound fertilizers on microbial communities and enzyme activities in tropical paddy soil. J. Plant Nutr. Fert. 2021, 27, 619–629. [Google Scholar] [CrossRef]
  26. Ge, G.F.; Li, Z.J.; Fan, F.L.; Chu, G.X.; Hou, Z.A.; Liang, Y.C. Soil biological activity and their seasonal variations in response to long-term application of organic and inorganic fertilizers. Plant Soil 2010, 326, 31–44. [Google Scholar] [CrossRef]
  27. Tabatabai, M.A.; Bremner, J.M. Assay of urease activity in soils. Soil Boil. Biochem. 1972, 4, 479–487. [Google Scholar] [CrossRef]
  28. Sharma, U.; Pal, D.; Prasad, R. Alkaline phosphatase: An overview. Indian J. Clin. Biochem. 2014, 29, 269–278. [Google Scholar] [CrossRef]
  29. Bo, H.; Li, Z.; Wang, W.; Zhang, R.; Wang, H.; Jin, D.; Xu, M.; Zhang, Q. Combining Organic and Inorganic Fertilization Enhances Soil Enzyme Activity, the Bacterial Community, and Molecular Ecological Network Complexity in Coal Mine Reclamation Areas. Agronomy 2024, 14, 1427. [Google Scholar] [CrossRef]
  30. Yap, B.W.; Sim, C.H. Comparisons of various types of normality tests. J. Stat. Comput. Simul. 2011, 81, 2141–2155. [Google Scholar] [CrossRef]
  31. Evans, J.D. Straightforward Statistics for the Behavioral Sciences; Thomson Brooks, Cole Publishing Co.: Pacific Grove, CA, USA, 1996; Available online: https://api.semanticscholar.org/CorpusID:121954573 (accessed on 31 July 2024).
  32. Ye, H.; Zhang, S.; Huang, Y.; Wang, S. Assessment of Surface Soil Fertility and Its Spatial Variability in Yanqing Basin, Beiing, China. Sci. Agric. Sin. 2013, 46, 3151–3160. [Google Scholar] [CrossRef]
  33. Qi, Y.; Darilek, J.L.; Huang, B.; Zhao, Y.; Sun, W.; Gu, Z. Evaluating soil quality indices in an agricultural region of Jiangsu Province, China. Geoderma 2009, 149, 325–334. [Google Scholar] [CrossRef]
  34. Quelal, M.O.; Yánez, Y.W.; Carrera, A.J. Bioindicators for Assessing Soil Quality in Ecuador’s Jun Jun Micro-Watershed. Agronomy 2024, 14, 1436. [Google Scholar] [CrossRef]
  35. Liebig, M.A.; Varvel, G.; Doran, J. A Simple Performance-Based Index for Assessing Multiple Agroecosystem Functions. Agron. J. 2001, 93, 313–318. [Google Scholar] [CrossRef]
  36. Rheinheimer, D.S.; Tiecher, T.; Gonzattoa, R.; Zafar, M.; Brunetto, G. Residual effect of surface-applied lime on soil acidity properties in a long-term experiment under no-till in a Southern Brazilian sandy Ultisol. Geoderma 2018, 313, 7–16. [Google Scholar] [CrossRef]
  37. Shi, L.; Zheng, W.; Lei, T.; Liu, X.; Hui, M. The Effect of Different Soil Additives on Soil Properties and on the Morphological and Physiological Characteristics of Chinese Cabbage. J. Soil Sci. Plant Nutr. 2021, 21, 1500–1510. [Google Scholar] [CrossRef]
  38. Zhang, W.; Wang, S.; Liu, Z.; Tang, X.; Xiong, L.; Xia, W.; Wang, P.; Yuan, F.; Sun, G.; Li, Z.; et al. Evaluating soil fertility improvement effects of chemical fertilizer combined with organic fertilizers in a red paddy soil using the soil fertility index. J. Plant Nutr. Fert. 2021, 27, 777–790. [Google Scholar] [CrossRef]
  39. Chen, Q.; He, A.; Wang, W.; Peng, S.; Huang, J.; Cui, K.; Nie, L. Comparisons of regeneration rate and yields performance between inbred and hybrid rice cultivars in a direct seeding rice-ratoon rice system in central China. Field Crop. Res. 2018, 223, 164–170. [Google Scholar] [CrossRef]
  40. Song, W.; Shu, A.; Liu, J.; Shi, W.; Li, M.; Zhang, W.; Li, Z.; Liu, G.; Yuan, F.; Zhang, S.; et al. Effects of long-term fertilization with different substitution ratios of organic fertilizer on paddy soil. Pedosphere 2022, 32, 637–648. [Google Scholar] [CrossRef]
Figure 1. Enzyme activities in topsoil (0–20 cm) at harvest stage under different treatments. UE—urease activity, ACP—acid phosphatase activity, CAT—catalase activity, SA—sucrose activity. CK—normal fertilization, NB—normal fertilization + bacteria agent, NO—normal fertilization + alginate bio-organic fertilizer, NF—normal fertilization + fulvic acid biomass nutrient solution, NC—normal fertilization + acid soil conditioner, NSi—normal fertilization + silicon–calcium–magnesium–potassium fertilizer. Different lowercase letters are significantly different among treatments (p < 0.05).
Agronomy 14 01706 g001
Figure 2. Correlation heat map between soil indexes and yield (BD—bulk density, SP—soil porosity, CEC—cation exchange capacity, TN—total nitrogen, AN—alkaline nitrogen, AP—available phosphorus, AK—available potassium, SOM—soil organic matter, C/N—carbon–nitrogen ratio, UE—urease activity, ACP—acid phosphatase activity, CAT—catalase activity, SA—sucrose activity, Yield—paddy yield).
Agronomy 14 01706 g002
Figure 3. Radar plots of membership values of each index under different treatments. CEC—cation exchange capacity, TN—total nitrogen, AN—alkaline nitrogen, AP—available phosphorus, AK—available potassium, SOM—soil organic matter, C/N—carbon–nitrogen ratio, UE—urease activity, ACP—acid phosphatase activity, SA—sucrose activity. CK—normal fertilization, NB—normal fertilization + bacteria agent, NO—normal fertilization + alginate bio-organic fertilizer, NF—normal fertilization + fulvic acid biomass nutrient solution, NC—normal fertilization + acid soil conditioner, NSi—normal fertilization + silicon–calcium–magnesium–potassium fertilizer.
Agronomy 14 01706 g003
Figure 4. SQI calculation value based on MDS and TDS. CK—normal fertilization, NB—normal fertilization + bacteria agent, NO—normal fertilization + alginate bio-organic fertilizer, NF—normal fertilization + fulvic acid biomass nutrient solution, NC—normal fertilization + acid soil conditioner, NSi—normal fertilization + silicon–calcium–magnesium–potassium fertilizer. Different lowercase letters are significantly different among treatments (p < 0.05).
Agronomy 14 01706 g004
Figure 5. Rice yield and dry matter accumulation per plant under different treatments. CK—normal fertilization, NB—normal fertilization + bacteria agent, NO—normal fertilization + alginate bio-organic fertilizer, NF—normal fertilization + fulvic acid biomass nutrient solution, NC—normal fertilization + acid soil conditioner, NSi—normal fertilization + silicon–calcium–magnesium–potassium fertilizer. Different lowercase letters are significantly different among treatments (p < 0.05).
Agronomy 14 01706 g005
Table 1. Basic physical and chemical properties of soil in experimental site.
Bulk Density
(g/cm3)
Porosity (%)pHCation Exchange Capacity (cmol/kg)Total Nitrogen
(g/kg)
Carbon–Nitrogen Ratio (C/N)Available Phosphorus
(mg/kg)
Available Potassium
(mg/kg)
Organic Matter
(g/kg)
1.2951.326.8412.301.2316.7116.0941.4828.81
Table 2. Components and effects of different soil additives.
AdditivesManufacturerSourceMain ComponentsKey EffectReferences
Bacteria agentZhongke Chemical Products Co., Ltd., Zhengzhou, ChinaThis product is produced using multi-layer liquid deep fermentation and modern biological preparation technology. It contains high-efficiency potassium-solubilizing gel-like Paenibacillus, disease-proof and bacteriostatic Bacillus subtilis, and antagonistic strains that are screened from common soil-borne diseases affecting pepper, cucumber, tomato, and fruit tree tea.Bacillus subtilis, bacillus amyloliquefaciens, paenibacillus mucilaginosusRepair soil biological environment[17]
Alginate bio-organic fertilizerEnbao Biotechnology Co., Ltd., ChinaThis product is extracted from wild seaweed alginate and combined with beneficial bacteria. It undergoes dual-form fermentation, both solid and liquid, and is then processed with biological fermentation after decomposing acid organic fertilizer.Alginate, organic matter, effective living bacteriaImprove soil fertility[18]
Fulvic acid biomass nutrient solutionQinheng Ecological Technology Co., Ltd., ChinaAfter pretreating crop residues and animal manure, the fulvic acid in these substances is dissolved in an alkaline solution and then acidified with sulfuric acid to obtain the final product.Fulvic acidWater and fertilizer conservation, improve soil nutrients availability[20]
Acid soil conditionerMaile Fertilizer Co., Ltd., ChinaAluminum sulfate is prepared by reacting aluminum ore with sulfuric acid, then ground into particles. Additional trace elements are incorporated to complete the product.Mineral matterRegulate soil pH[21]
Silicon-calcium-magnesium-potassium fertilizerAkang Agricultural Technology Co., Ltd., ChinaBio-extracted silicon-calcium is converted into inorganic complexed silicon-calcium through a double biochemical complexation process.Effective silicon, effective calciumImprove the resistance of crops[19]
Table 3. Dosage and usage of chemical fertilizers and additives for different treatments.
TreatmentsDosageUsage
CK154 kg/hm2 of N, 82.9 kg/hm2 of P2O5 189.2, kg/hm2 of pure K2ON (distributed as base fertilizer: tillering fertilizer: panicle fertilizer = 4:4:2), P2O5 (entirely applied as base fertilizer), K2O (base fertilizer: panicle fertilizer = 6:4)
NB154 kg/hm2 of N, 82.9 kg/hm2 of P2O5 189.2, kg/hm2 of pure K2O, 15 kg/hm2 of bacterial agentN, P2O5, K2O are used in the same way as CK. Bacterial agent (diluted 50 times before irrigation pre-planting).
NO154 kg/hm2 of N, 82.9 kg/hm2 of P2O5 189.2, kg/hm2 of pure K2O, 1200 kg/hm2 of alginate bio-organic fertilizerN, P2O5, K2O are used in the same way as CK. Alginate bio-organic fertilizer (applied pre-planting and thoroughly mixed with other base fertilizers, with an additional application of 1200 kg/hm2 during flowering and grain filling stages)
NF154 kg/hm2 of N, 82.9 kg/hm2 of P2O5 189.2, kg/hm2 of pure K2O, 750 kg/hm2 of fulvic acid biomass nutrient solutionN, P2O5, K2O are used in the same way as CK. Fulvic acid biomass nutrient solution (diluted 20 times before irrigation pre-planting)
NC154 kg/hm2 of N, 82.9 kg/hm2 of P2O5 189.2, kg/hm2 of pure K2O, 750 kg/hm2 of acid soil conditionerN, P2O5, K2O are used in the same way as CK. Acid soil conditioner (applied pre-planting and mixed uniformly with other base fertilizers)
NSi154 kg/hm2 of N, 82.9 kg/hm2 of P2O5 189.2, kg/hm2 of pure K2O, 1200 kg/hm2 of silicon-calcium-magnesium-potassium fertilizerN, P2O5, K2O are used in the same way as CK. Silicon-calcium-magnesium-potassium fertilizer (applied pre-planting and mixed evenly with other base fertilizers, with an additional application of 1200 kg/hm2 during flowering and grain filling stages).
Note: CK—normal fertilization, NB—normal fertilization + bacteria agent, NO—normal fertilization + alginate bio-organic fertilizer, NF—normal fertilization + fulvic acid biomass nutrient solution, NC—normal fertilization + acid soil conditioner, NSi—normal fertilization + silicon–calcium–magnesium–potassium fertilizer.
Table 4. Physicochemical indexes of topsoil.
TreatmentCKNBNONFNCNSi
BD (g/cm3)1.21 ± 0.07 a1.18 ± 0.15 a1.18 ± 0.01 a1.16 ± 0.06 a1.22 ± 0.07 a1.20 ±0.07 a
SP (%)54.46 ± 0.02 a55.40 ± 0.06 a55.56 ± 0.01 a56.17 ± 0.02 a54.02 ± 0.03 a54.75 ± 0.03 a
pH6.40 ± 0.24 b5.96 ± 0.18 c5.97 ± 0.19 c5.87 ± 0.28 cd5.60 ± 0.10 d6.80 ± 0.06 a
CEC (cmol/kg)9.61 ± 0.31 d9.90 ± 0.36 cd10.74 ± 0.19 b10.30 ± 0.08 bc10.19 ± 0.48 c11.70 ± 0.09 a
TN (g/kg)1.12 ± 0.04 c1.35 ± 0.06 ab1.45 ± 0.02 a1.47 ± 0.04 a1.27 ± 0.13 b1.37 ± 0.11 ab
AN (mg/kg)133.86 ± 2.64 c146.06 ± 3.73 b170.97 ± 4.56 a170.20 ± 2.72 a140.17 ± 5.75 bc146.44 ± 3.08 b
AP (mg/kg)17.61 ± 1.38 d23.06 ± 2.71 bc26.69 ± 0.41 ab28.25 ± 0.78 a19.53 ± 0.97 cd24.68 ± 3.83 ab
AK (mg/kg)52.72 ± 3.81 c53.70 ± 0.51 c76.06 ±3.03 a74.68 ± 4.00 a54.93 ± 2.31 c66.25 ± 2.21 b
SOM (g/kg)27.82 ± 0.56 cd38.70 ± 1.50 b47.13 ± 0.59 a36.36 ± 1.31 b25.60 ± 1.46 d28.12 ± 1.97 c
C/N14.37 ± 0.73 c16.69 ± 1.18 b18.84 ± 0.50 a14.34 ± 0.39 c11.79 ± 1.89 d11.92 ± 0.24 d
Note: After the same column of data, different lowercase letters indicate significant differences between treatments (p < 0.05). BD—bulk density, SP—soil porosity, CEC—cation exchange capacity, TN—total nitrogen, AN—alkaline nitrogen, AP—available phosphorus, AK—available potassium, SOM—soil organic matter, C/N—carbon–nitrogen ratio. CK—normal fertilization, NB—normal fertilization + bacteria agent, NO—normal fertilization + alginate bio-organic fertilizer, NF—normal fertilization + fulvic acid biomass nutrient solution, NC—normal fertilization + acid soil conditioner, NSi—normal fertilization + silicon–calcium–magnesium–potassium fertilizer.
Table 5. Descriptive statistics of soil properties.
VariableMaximumMinimumRangeMean ValueStandard DeviationThe Coefficient of Variation (%)
SP61.85%51.31%10.54%55.06%0.034.89
BD1.291.010.281.190.075.99
pH6.855.541.316.100.437.10
CEC11.809.262.5410.400.747.07
AP29.0916.6712.4223.304.2418.18
AK79.3449.1230.2263.0610.3616.43
TN1.511.090.421.140.1410.23
AN175.67131.5744.10151.2815.069.95
SOM47.4823.9823.5033.957.8723.17
C/N19.3010.049.2614.662.7018.45
UE0.550.110.440.280.1346.64
ACP0.400.140.260.270.1037.19
CAT1.841.010.831.370.2518.48
SA86.8654.1832.6866.8110.2315.31
Note: SP—soil porosity, BD—bulk density, CEC—cation exchange capacity, AP—available phosphorus, AK—available potassium, TN—total nitrogen, AN—alkaline nitrogen, SOM—soil organic matter, C/N—carbon–nitrogen ratio, UE—urease activity, ACP—acid phosphatase activity, CAT—catalase activity, SA—sucrose activity.
Table 6. Principal component analysis of fertility index.
ItemPrincipal Component (PC)CommunalityWeight (%)
123
Eigenvalues5.0662.5191.136
Variance (%)50.66025.18611.357
Cumulative contribution (%)50.66075.84687.203
Factor loading
CEC0.1970.8400.0720.75011.88
AP0.8570.3730.1430.89417.12
AK0.7480.571−0.0990.89515.91
TN0.8360.3200.3340.91417.59
AN0.9200.243−0.0650.91015.30
SOM0.883−0.170−0.4110.9788.20
C/N0.628−0.391−0.6620.9850.56
UE0.572−0.6090.0670.7032.51
ACP0.550−0.5200.5630.8916.50
SA0.619−0.6020.2370.8024.43
Note: The bold number represents the high weight index. CEC—cation exchange capacity, AP—available phosphorus, AK—available potassium, TN—total nitrogen, AN—alkaline nitrogen, SOM—soil organic matter, C/N—carbon–nitrogen ratio. UE—urease activity, ACP—acid phosphatase activity, SA—sucrose activity.
Table 7. Correlation coefficients and correlation sums for highly weighted variables in the principal components (PC) with multiple high factor loadings.
PC1 VariablesCECAPTNANSOMC/N
CEC10.4550.4590.2750.0260.224
AP0.45510.8650.8620.6210.298
TN0.4590.86510.7880.5800.176
AN0.2750.8620.78810.7720.510
SOM0.0200.6210.5800.77210.903
C/N0.2240.2980.1760.5100.9031
Correlation sum2.4334.1013.8684.2073.9023.111
Note: CEC—cation exchange capacity, TN—total nitrogen, AN—alkaline nitrogen, AP—available phosphorus, SOM—soil organic matter, C/N—carbon–nitrogen ratio.
Table 8. Pearson correlation coefficient between paddy yield and fertility index.
Correlation CoefficientYieldSQIMDSSQITDS
yield1.000
SQIMDS0.826 **1.000
SQITDS0.789 **0.880 **1.000
Note: **: represents a significant difference at the p < 0.01 level.
Disclaimer/Publisher’s Note: The statements, opinions and data contained in all publications are solely those of the individual author(s) and contributor(s) and not of MDPI and/or the editor(s). MDPI and/or the editor(s) disclaim responsibility for any injury to people or property resulting from any ideas, methods, instructions or products referred to in the content.

