Abstract
Climate change increases the risk of coffee yield due to the genotype-dependent effects of water deficit on coffee physiology. The goal of this research was to evaluate how water deficit altered the physiological and growth characteristics of arabica coffee (Coffea arabica L.). Water status, photosynthetic response to CO2 intercellular concentration (A/Ci curves) and growth parameters were evaluated in seedlings of four genotypes (Catimor ECU 02, Cavimor ECU, red Caturra and Sarchimor 4260). Most of the physiological traits evaluated differed significantly among genotypes. Between control and water deficit plants, significant variations occurred in the A/Ci parameters, showing a wide range of values for net photosynthetic rate, stomatal conductance, and water use efficiency, with decreases ranging from 4 to 74%. Maximum electron transport rate through photosystem II, highest rate of RuBisCO carboxylation, and triose phosphate utilization rate were all strongly decreased by water deficit 61% (red Caturra and Sarchimor 4260), followed by Cavimor ECU (35%) and Catimor ECU 02 (24%). Differences in response to water deficit among genotypes suggest possible genotypic differences in tolerance. The results indicated that Catimor ECU 02 and Cavimor ECU were less sensitive to water deficit, while red Caturra and Sarchimor 4260 were the most susceptible.
1. Introduction
Native to northern Ethiopia, arabica coffee (Coffea arabica L., Rubiaceae) is a tropical woody crop with great genetic value that is one of the most traded crops worldwide [1,2]. Twenty-five million agricultural households, mostly smallholders, grow coffee in 80 tropical countries for the consumption of one-third of the world’s population [3,4].
Coffee is the second most valuable commodity in the world after oil, with sales estimated to be worth US$102 billion globally [5]. World coffee production was between 158 and 178 million 60 kg bags per year for the years 2023–2024 [6]. In Ecuador, coffee is a product of great social, economic and environmental importance [7] and its production during 2019–2020 was 559,000 and 500,000 bags, respectively, with a percentage of change of −10.5% [5].
In Brazil, coffee has been extensively investigated eco-physiologically [4,8,9,10,11,12,13], while in Ecuador such studies are scant [14]. Ecuador’s genetic improvement programs lack physiological information, particularly on the physiological response to water deficit (WD), despite knowledge of production, pests, and diseases tolerance in various coffee genotypes [7,14,15]. In order to choose coffee genotypes with improved physiological performance in WD conditions in Ecuador’s various agroecological zones, it is necessary to understand the potential traits.
Due to global climate change, projections for Ecuador in 2050 indicate that temperatures could rise by up to 2.5 °C, along with less rainfall and longer, more unpredictable droughts [16]. These temperature changes, coupled with increased climate variability, are anticipated to pose a danger to global agricultural productivity and sustainability, having a significant impact on the quantity and quality of crops, such as coffee [17,18,19]; these situations emphasize how important it is to comprehend how tropical crops respond physiologically to WD [3,20].
The Coffea species is very sensitive to climate change, according to modeling studies based on predictions of rising temperatures and shifting patterns of precipitation [3]. Changes in microclimatic factors, particularly those associated with WD, have a significant impact on coffee output and bean quality [20,21].
Decreases in coffee in leaf water content and water potential due to a reduction in soil water content have been reported [14]. The WD affected morphological and physiological traits. Changed water relations, decreased leaf area, gas exchanges, stomatal closure, and osmotic adjustment, among other factors, may more directly contribute to decreased crop yield. The physiological responses of plants to WD are intricate due to the disruption of numerous metabolic systems. Reduced growth and yield are caused by a drop in net photosynthetic rate (A) resulting from either impaired metabolic processes or reduced CO2 diffusion to carboxylation sites [22]. A wide range of plant responses to drought can be attributed to the physiological, biochemical, morphological, and molecular mechanisms involved; they include dynamic soil water depletion and failure to meet the water demands of growing coffee plants at different phenological states [20].
Low water availability reduces coffee production by interfering with the roots’ ability to extract moisture, the roots’ distribution in space, the size of the canopy, and the growth of their fruit [9]. A key factor in the genotypes of arabica coffee’s variable tolerance to low water availability could be its attribution to physiological and morphological features that influence water uptake and loss, such as A, stomatal conductance (gs), water use efficiency (WUE) and root depth, which should be recommended as traits for the potential selection of coffee genotypes with higher yields subjected to WD [9,23,24]. Understanding how WD affects arabica coffee’s physiology and metabolism is crucial for developing drought resistant varieties [20,25].
We assessed the impact of WD on leaf and soil water status, leaf gas exchange, and morphological traits of four Coffea arabica genotypes: Sarchimor 4260, Red Caturra, Catimor ECU 02, and Cavimor ECU. The aim of this study was to identify prospective traits for selecting coffee genotypes with enhanced physiological performance in low-water conditions. This information can offer understandings into whether differences in genetic variability among C. arabica genotypes explain photosynthetic differences, and if the physiological response to WD is different among genotypes. We hypothesized that, under WD, coffee genotypes would: (1) respond to variations in physiological performance differently from one another; and (2) potentially have different effects on WUE.
2. Materials and Methods
2.1. Study Area and Site Conditions
The investigation was carried out in 2017 at 20 m above sea level at the Mutile Experimental Station, Universidad Técnica Luis Vargas Torres, in the Esmeralda Province of Ecuador (0°53′40″ N; 79°37′23″ W). The research area’s parameters include mean air temperature (Ta) of 24 °C, relative humidity (RH) of 85%, heliophany of 1200 h of sunlight per year, and mean annual precipitation of 1030 mm [26]. The type of soil is vertisol deep soil, usually black in color, with a concentration of organic matter over 3% and a loam texture of 37% sand, 38% silt, and 25% clay. One-year-all arabica coffee seedlings were raised in a 400-m2 shed shielded with a neutral polythene sheet, hereafter referred to as shade house. Utilizing a light meter (LI-250l, LI-COR, Lincoln, NE, USA), the photosynthetic photon flux density (PPFD) was determined. Values for the leaf-to-air vapor pressure deficit (ΔW) were obtained using Ta and RH data, following Jones’ [27] equation. Table 1 displays the values of the shade house’s microclimatic parameters. Shading reduced PPFD incident at noon on the roof to 20%.

Table 1.
Variations in the daily values of the following microclimatic parameters, which were measured inside the shade house on ten separate sample days: ambient CO2 concentration (Ca), photosynthetic photon flux density (PPFD), air temperature (Ta), relative humidity (RH) and air vapor pressure deficit (∆W). Values are mean ± SE (n = 10 days).
2.2. Plant Material
The Coffea arabica genotypes Sarchimor 4260, Red Caturra, Catimor ECU 02, and Cavimor ECU, which are commonly used in Ecuador, were chosen for this study due to their high production and resistance to coffee rust (Table 2). Seeds were gathered in the most important coffee-producing region, Esmeraldas Province, Ecuador. This study’s foundation is the lack of alternative germ-plasmic material for orchard renovation, with plants that exhibit traits like pest and disease resistance, environmental tolerance, and high productivity indices. Consequently, it is critical to conduct research and validate technological alternatives that enable the industry to diversify its use of currently available coffee materials in Ecuador [15]. Ten-month-old seedlings were cultivated, under semi-controlled conditions in the shade house, in bags with 10 kg of sandy loam soil (pH = 6.0; organic matter = 2%; total N = 0.1%; total P = 21 mg kg−1; total K = 1.4 cmol kg−1) and watered every two days. In order to ensure seedling growth and establishment, we fertilized plants once a month (10 g month−1) with N:P:K 12:11:18, a dose that has been shown to yield the greatest outcomes [15].
Table 2.
In Esmeraldas, Ecuador assessed the genotypes of C. arabica, including their names, attributes, genetic origins, and responses to coffee rust.
2.3. Experimental Design
A complete random block design was utilized with four genotypes, each with 20 plants and three repeats, for a total of 60 plants per genotype and 240 plants in total. In the shade house, three blocks totaling 121 m2 were set up, with 20 plants of each genotype spaced one meter apart in each block. Every block was separated by two meters. To prevent potential block and edge effects, plants were shifted weekly within and across blocks within each treatment. During seven months (February to August 2017), all physiological parameters were measured on seedlings that were ten months old. For each genotype (n = 5), a sample was taken from the central region of a fully opened, healthy leaf, which was the third leaf from the top.
Table 3 shows the evaluated physiological parameters together with their units and abbreviations.
Table 3.
Assessed physiological parameters, their units, and their acronyms.
2.4. Water Deficit Experiment
Irrigation in 10 seedlings of each genotype per block (total of 30 plants) was completely ceased for 29 days and corresponded to the water deficit treatment (WD). The remaining 30 plants were maintained as well-watered and corresponded to the control. We measured water status as soil and leaf water contents, gas exchange variables, and performed A/Ci curves on days 0 (the first without irrigation) and on the following days: 8, 15, 22, and 29. On day 29, we started irrigation again and, on the following day (day 30), we took measurements of the same set of physiological variables.
2.5. Water Status
To determine the soil water content (SWC), relative water content (RWC), and leaf water content (LWC), samples of soil and leaves were collected. After soil samples were taken at a depth of 15 cm, their fresh weight (FW) was calculated, they were dried for 48 h at 70 °C to achieve a constant mass, and then they were weighed to obtain their dry weight (DW). Soil water content was calculated as ((FW − DW)/FW) × 100. Ten leaves (n = 10) were collected between 7:00 and 8:00 h, and the leaf water content (LWC) was calculated as (FW − DW)/DW. To calculate the turgid weight (TW), ten leaves (n = 10) were gathered at 07:00 h and floated on distilled water at 4 °C for one hour. Leaf relative water content was then calculated as RWC = (FW − DW)/(TW − DW). The specific leaf area (SLA), which is the ratio of leaf area to DW, was determined by measuring the fresh area and DW of leaves taken from six individuals per genotype.
2.6. Gas Exchange
A portable infrared gas analyzer (CIRAS-II, PP Systems Inc., Amesbury, MA, USA) in open mode linked to a PLC (B) leaf chamber was used to measure the gas exchange variables (A, gs, and E) in intact leaves in five individuals of each genotype (n = 5 per genotype). With PPFD of 1200 ± 10 μmol m−2 s−1 delivered by an LED Based Light Unit from PP systems Inc., measurements were conducted at a CO2 concentration of 410 ± 10 μmol mol−1, a leaf temperature of 30.0 ± 0.5 °C, and a ΔW of 1.8–2.2 kPa. The WUE was calculated as the ration between A and E. Every genotype that was randomly sampled had measurements taken throughout the course of three days, from 8:00 to 12:00.
2.7. A/Ci Curves
We performed A/Ci curves (n = 4) by gradually raising Ca to 1.800 μmol mol−1 after first lowering Ca to zero. The A/Ci measurements were conducted in a leaf chamber with the following parameters: ΔW of 1.8 ± 0.02 kPa, PPFD of 1.200 ± 10 μmol m−2 s−1, and leaf temperature of 30.0 ± 0.5 °C. An empirical equation was used to fit curves [28], which yields the carboxylation efficiency (CE), as the slope of the initial part of the curve. Using the equations in [29,30], the values of the relative stomatal limitation (Ls) and mesophyll limitation (Lm) were determined. Finally, the model in [31] was used to compute the maximum rate of electron transport through photosystem II (Jmax), the maximum rate of carboxylation by RuBisCO (Vcmax), and the triose phosphates’ utilization rate (TPU).
2.8. Growth
By weighing paper copies of the leaves and one square centimeter of paper, as well as by figuring out the link between paper mass and area, leaf area was measured allometrically. After oven drying at 70 °C to a constant mass, these leaves were weighed with an analytical weighing balance (Model HR200, Tokyo, Japan). Throughout the course of the experiment, non-destructive allometric growth measurements were performed every two weeks for six months on five plants (n = 5) per treatment. The following measurements were taken: plant total height, measured from ground level to the apical shoot; stem diameter at 10 cm from ground level; crown diameter at the lower part of each plant, on the longest lower branch of the plant—branch length of the intermediate branch of the plant is considered and measured from the insertion of the branch in the central stem to the terminal bud; number of branches present on the stem of the plant; flowering. For flowering, an arbitrary scale from 0 to 3, where 0 = no flowering, 1 = low, 2 = medium and 3 = high intensity of flowering, was used.
2.9. Statistical Analysis
The data displayed in tables and figures are expressed as means (5 ≤ n ≤ 10) ± standard error (SE). Statistical package, STATISTICA v10 (StatSoft Inc., Tulsa, OK, USA) was used to perform one and two-way analysis of variance (ANOVA) and Tukey’s post hoc test at the 5% level of significance. Water status, gas exchange, and A/Ci traits were compared across four genotypes and between control and WD within each genotype using ANOVAs. Using Statistica (v10), principal component analysis (PCA) was performed to test for coordination between multiple physiological and morphological traits assessed (24 variables in total) using all the data, and for each treatment (control and WD). SigmaPlot 11 (Systat Software, San Jose, CA, USA) was used for all regressions, whether they were linear or curvilinear, and significance was assessed at p < 0.05.
3. Results
3.1. Genotype Physiological Characterization
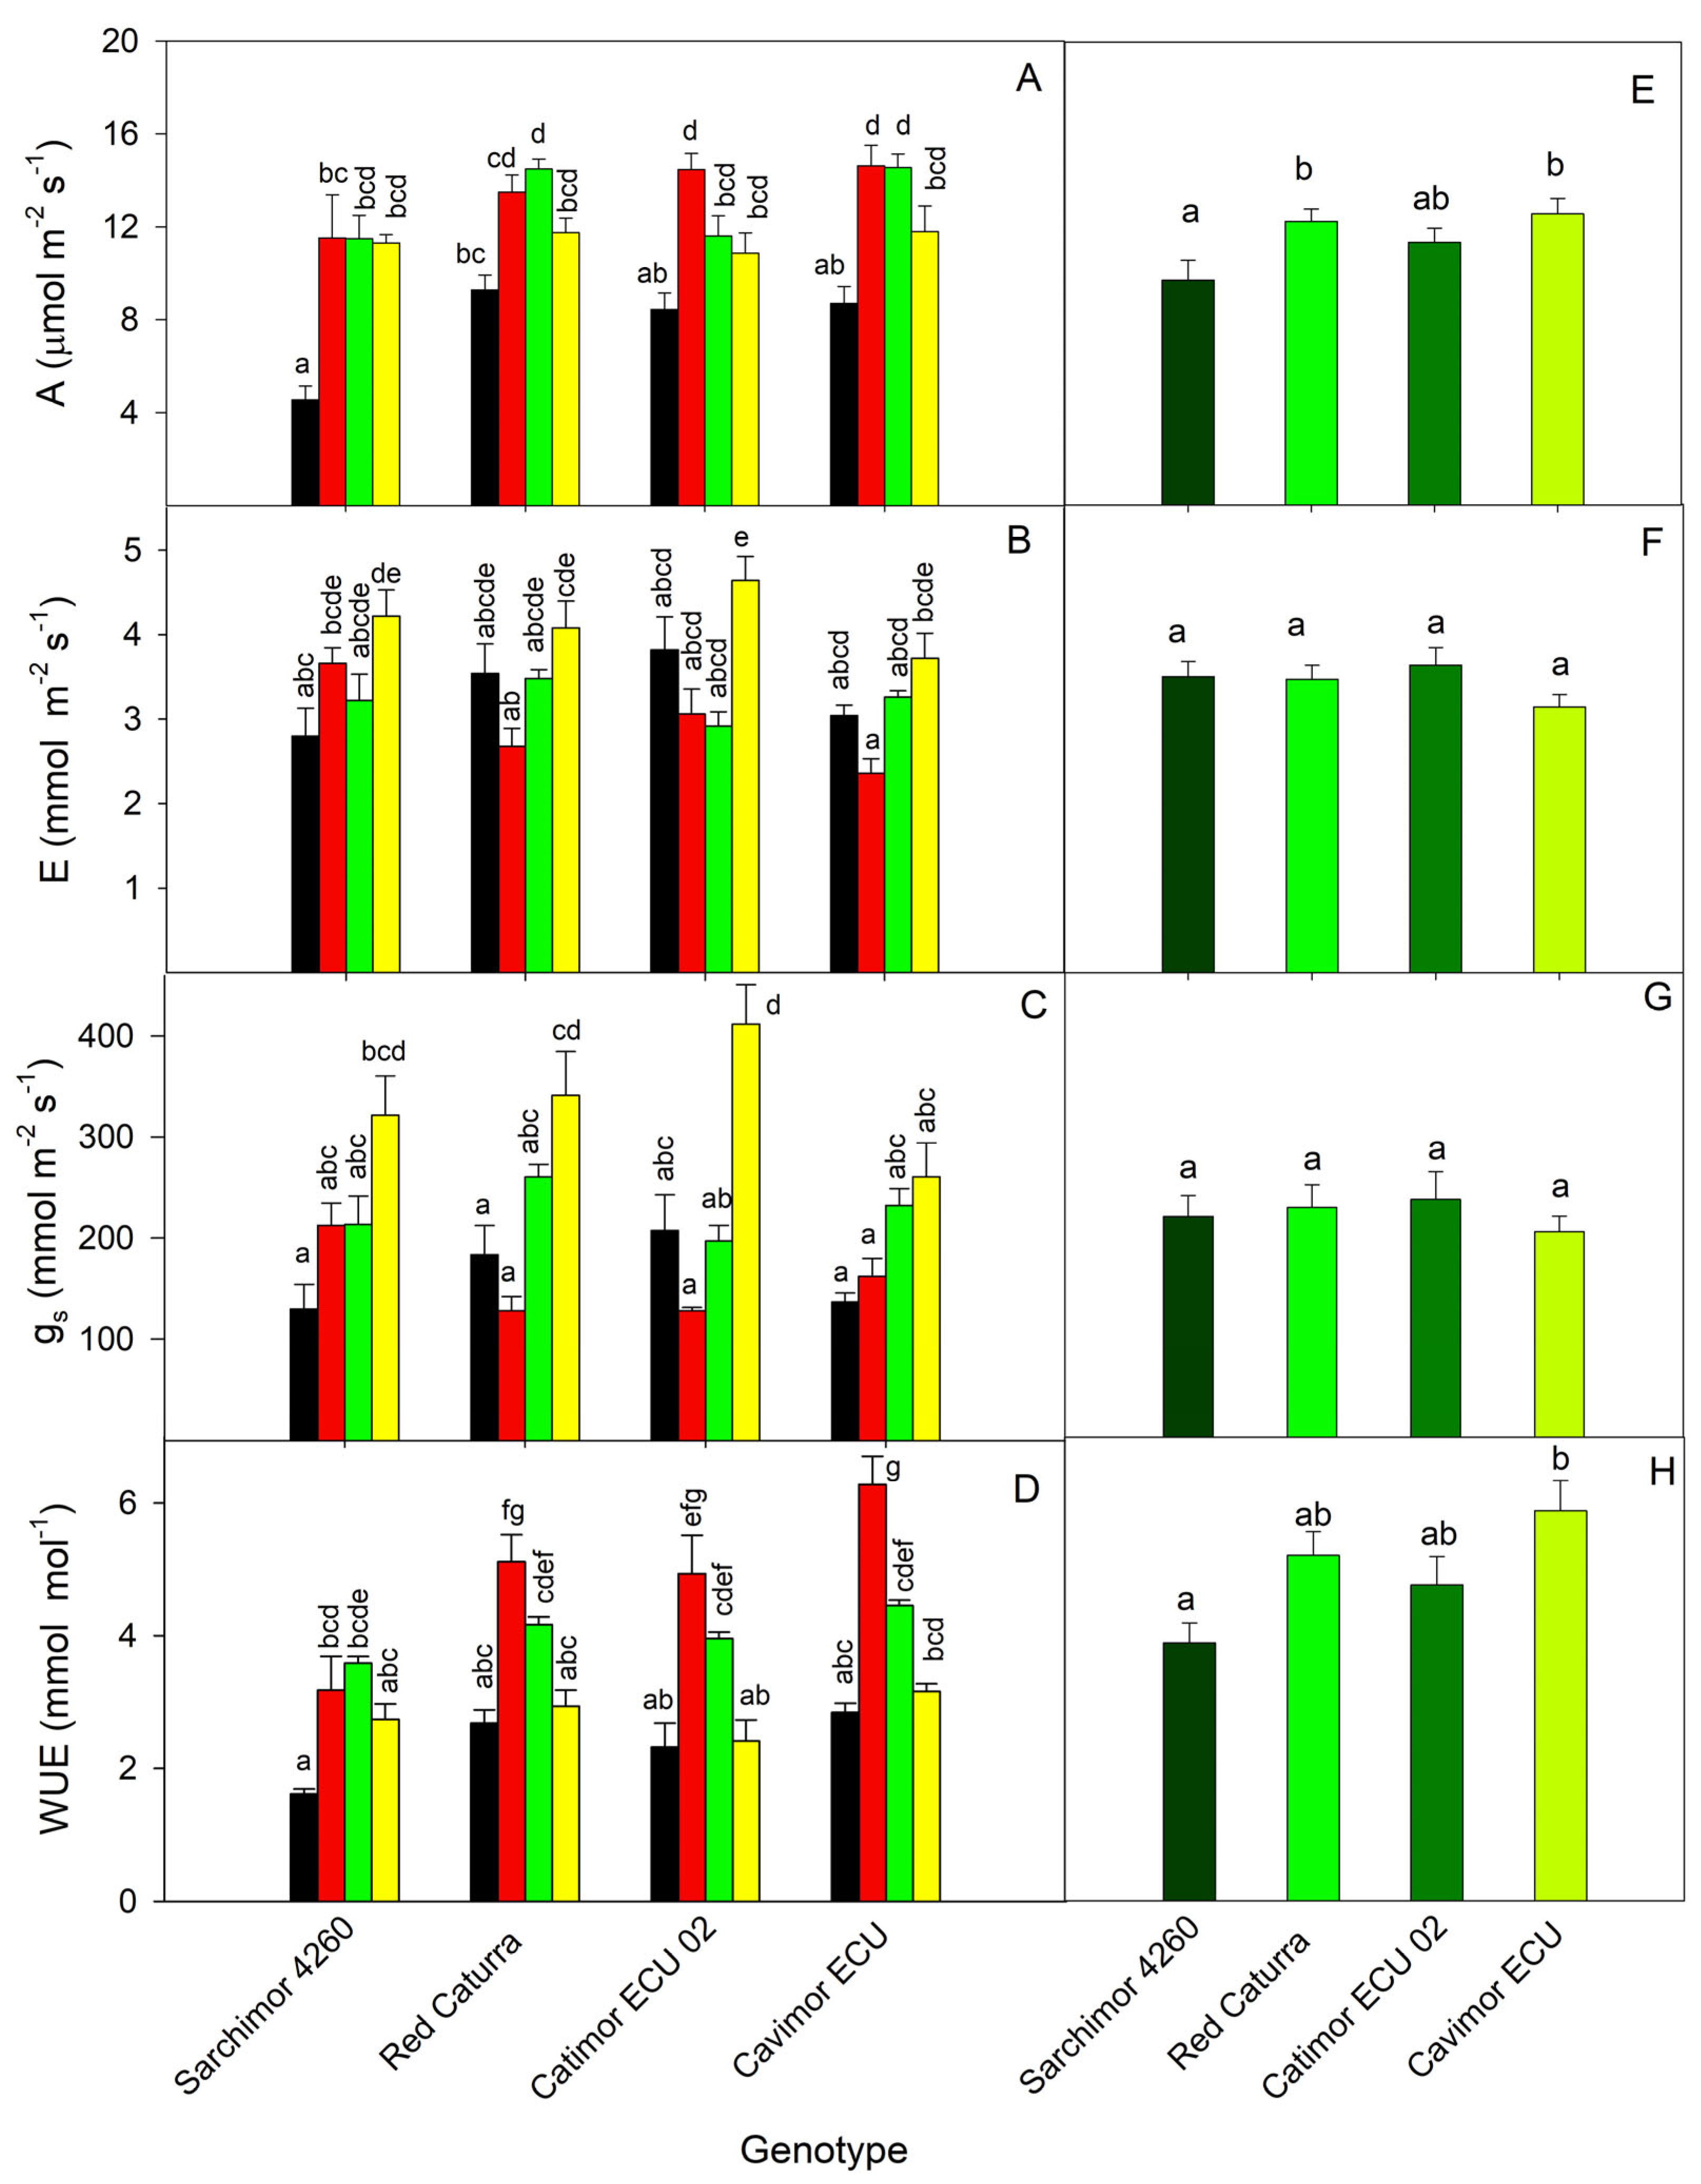
Time course of changes under WD for the four genotypes are shown in Figure 1. The A values ranged from 5 μmol m−2 s−1 in Sarchimor 4260 to 15 μmol m−2 s−1 in Cavimor ECU and Catimor ECU 02. There were notable variations among genotypes (p = 0.02), with Sarchimor 4260 showing the smallest A, and Cavimor ECU and Catimor ECU 02 the biggest. The genotype Cavimor ECU had the lowest average E value, whereas Catimor ECU 02 had the greatest E value. When compared to the other genotypes, Cavimor ECU had the lowest gs. The lowest WUE was found in Sarchimor, whereas high WUE was found in Cavimor ECU genotypes (p = 0.004).
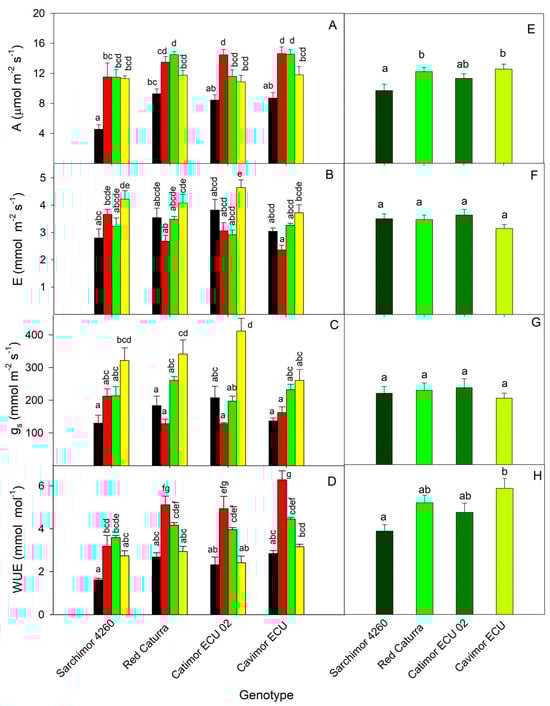
Figure 1.
Gas exchange parameters of four arabica coffee genotypes. In the left column the graphs (A–D) show the mean values for each genotype per month, February (black), March (red), April (green) and May (yellow) 2017. In the right column the graphs (E–H) show the means of all sampling time points per genotype. Bars represent the mean of five plants ± SE. Distinct letters indicate significant variations in genotypes and/or sampling time (p < 0.05). (A,E) Net photosynthetic rate; (B,F) transpiration rate; (C,G) stomatal conductance; (D,H) water use efficiency.
3.2. Water Deficit Experiment
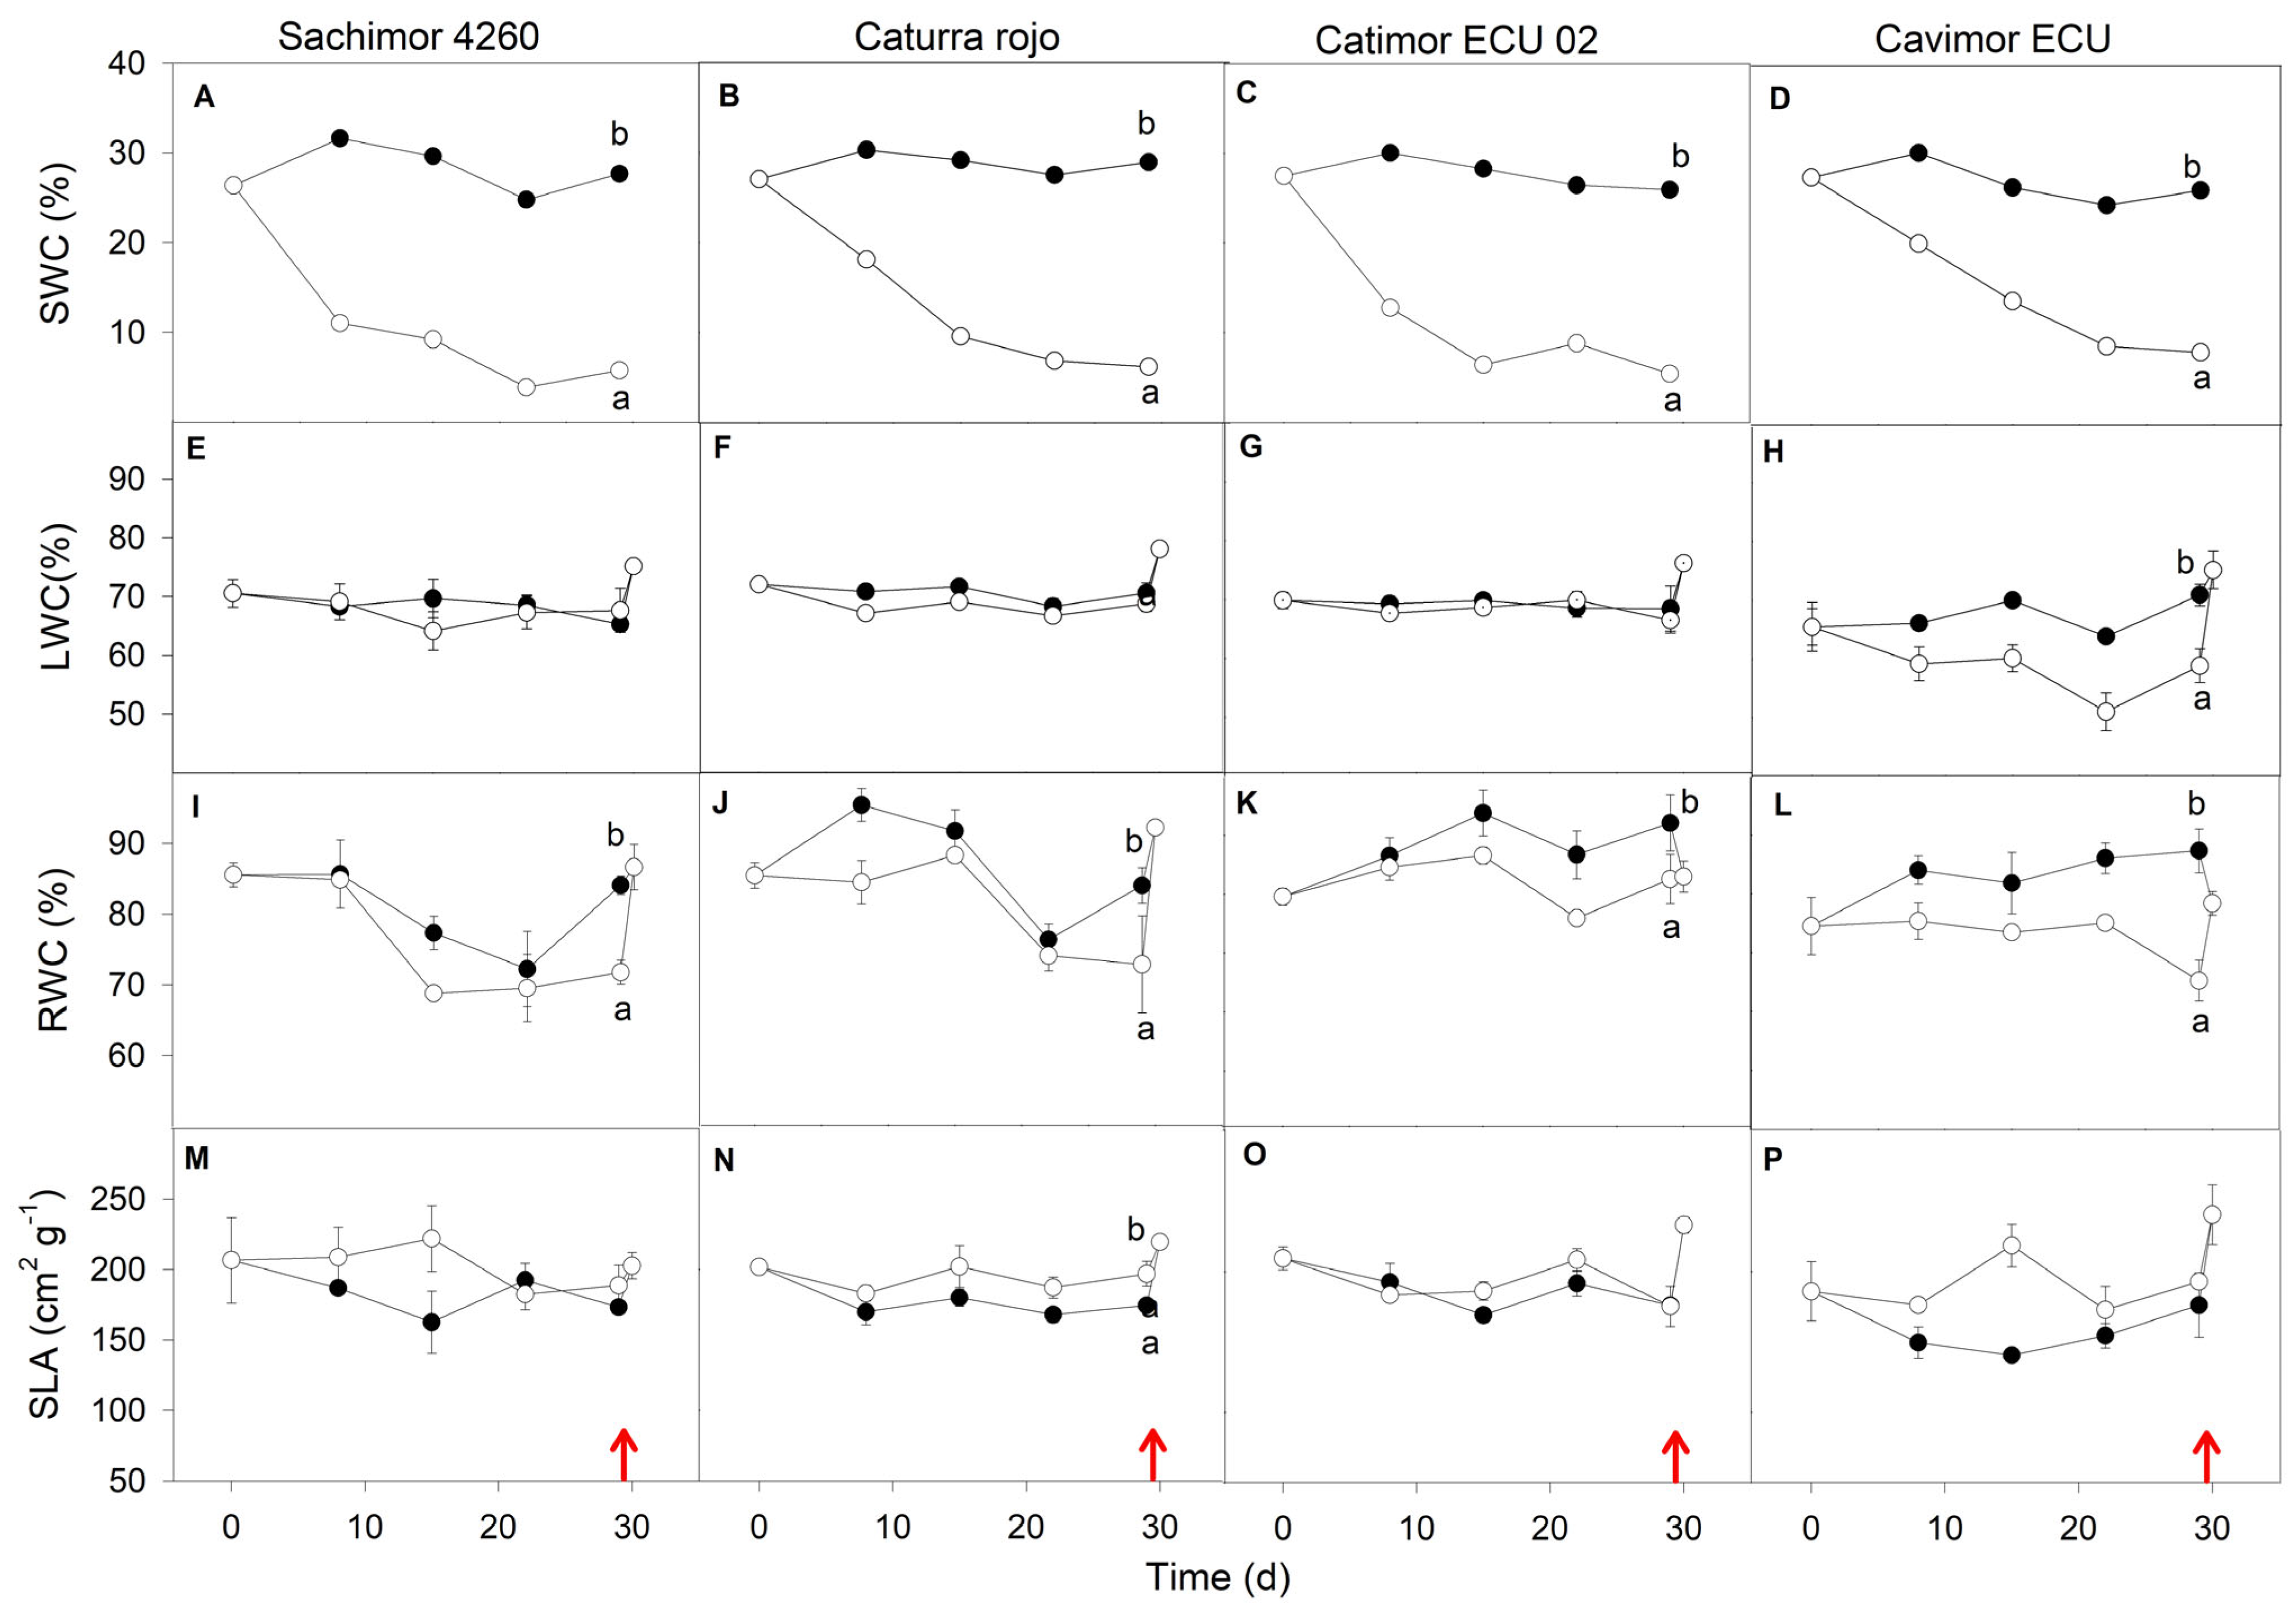
Water deficit negatively affected SWC, LWC and RWC among the four genotypes (Figure 2). A decline of 70% (Cavimor ECU), 77% (red Caturra), and 80% (Sarchimor 4260 and Catimor ECU 02) was noted in SWC after 29 days under WD. The reduction in SWC induced a 17% decrease in LWC in Cavimor ECU, whereas in Sarchimor 4260, red Caturra and Catimor ECU 02, the decrease was lower, at only 3%. After 29 days of WD, RWC was substantially lower in all coffee genotypes by 10–25%. The SLA ranged between 161.4 ± 8.5 cm2 g−1 (Cavimor ECU) and 200.6 ± 9.1 cm2 g−1 (Sarchimor 4260); a small increase of 8–10% in red Caturra and Sarchimor 4260 and 18% in Cavimor ECU due to WD was observed. This could mean that leaves that are thinner would be less resistant to CO2 diffusing to the carboxylation sites. In Catimor ECU 02, SLA was unchanged by WD.
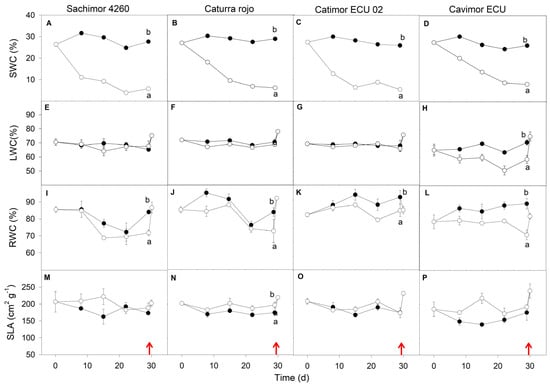
Figure 2.
Effects of water deficit duration on four coffee genotype plants’ leaves: (A–D), soil water content (SWC); (B–H), leaf water content (LWC); (I–L), relative water content (RWC); and (M–P), specific leaf area (SLA), in both WD (open circles) and control (closed circles) plants. Genotype name is shown above the uppermost panels. The data represent means (6 ≤ n ≤ 10) ± SE. For each parameter at p < 0.05, distinct letters denote significant variations between WD and control seedlings. Measurements taken a day after re-irrigation are indicated by red arrows.
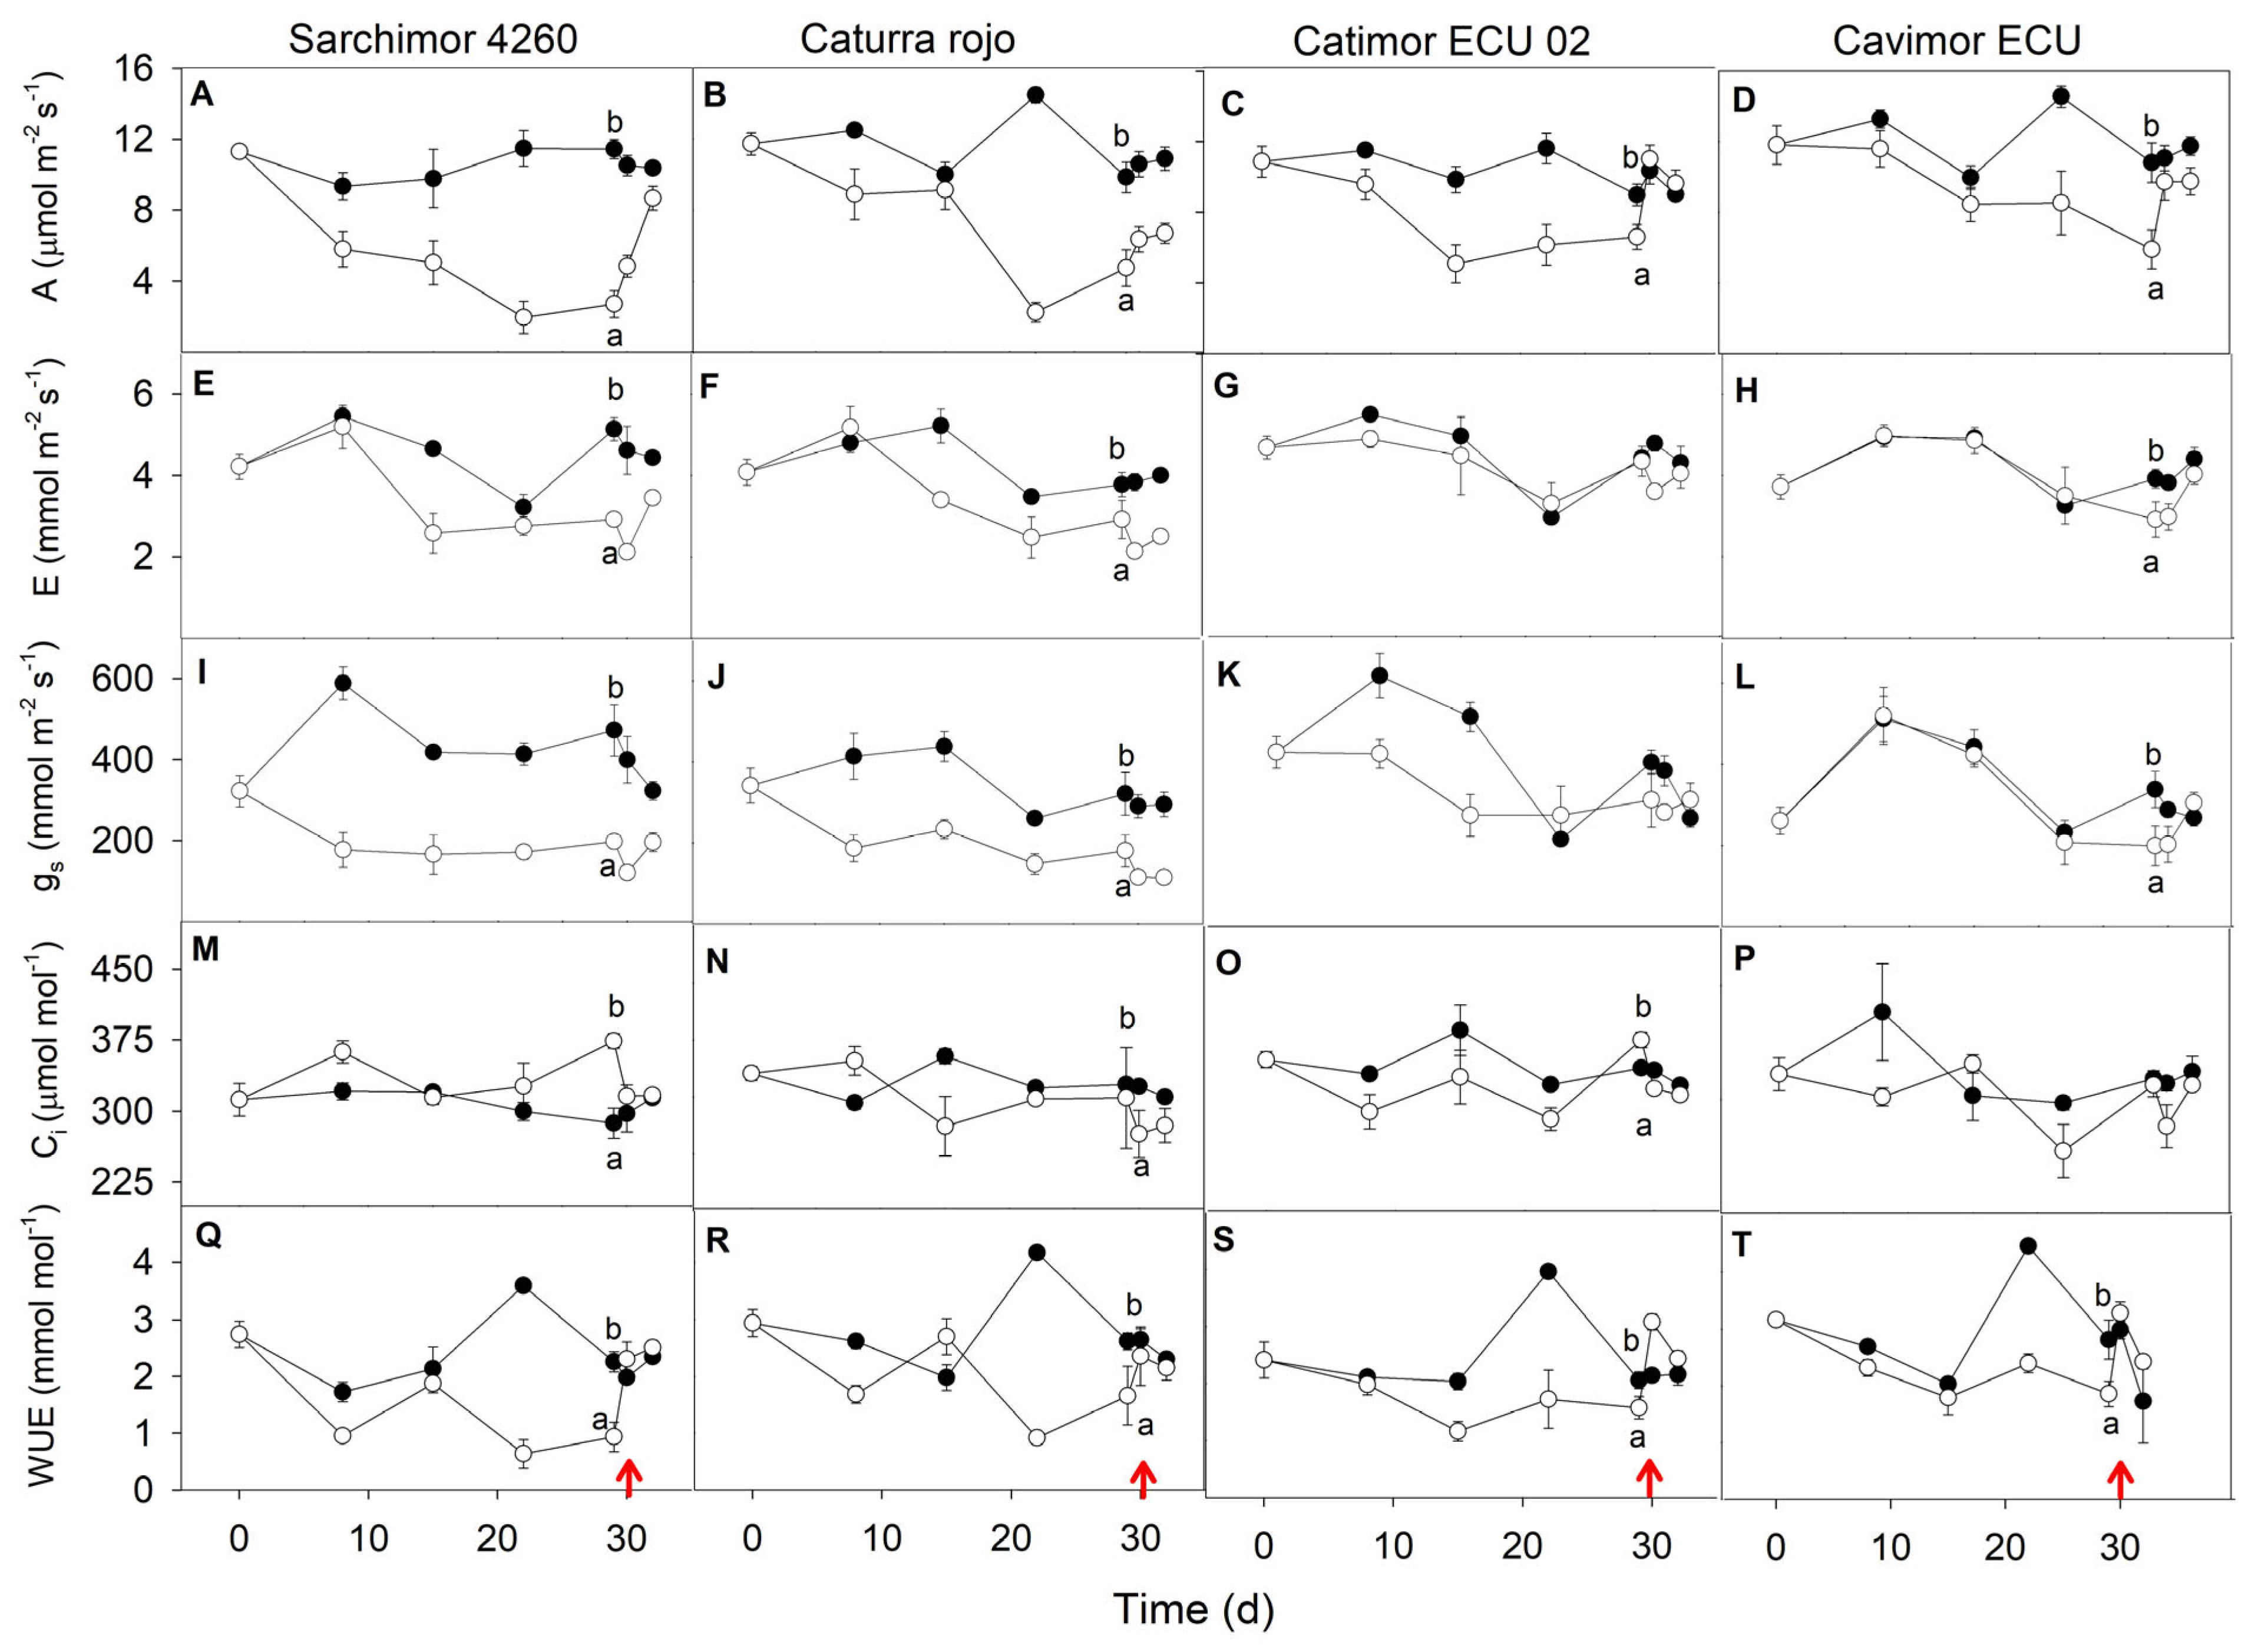
After 29 d of WD, most of the leaf gas exchange variables decreased relative to day 0 of treatment (Figure 3). Values of A diminished by 74, 59, 50 and 36%, and gs by 53, 48, 41 and 24% in Sarchimor 4260, red Caturra, Cavimor ECU and Catimor, respectively, whereas E decreased by 30–36% in Sarchimor 4260, red Caturra and Cavimor ECU, and 4% in Catimor. The WUE was significantly reduced by 61% in Sarchimor 4260, 42% in red Caturra and 34% in both Cavimor ECU and Catimor ECU 02. In Sarchimor 4260, Ci increased in plants summited to WD, whereas in the other genotypes Ci was unchanged. After one day of re-irrigation, all leaf gas exchange variables in the Cavimor ECU and Catimor ECU 02 genotypes promptly recovered, but not in the Sarchimor 4260 and red Caturra.
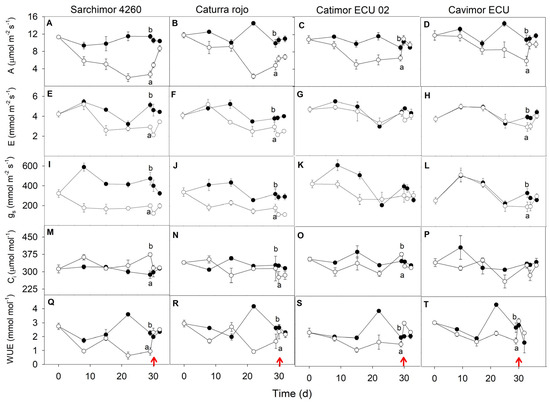
Figure 3.
Effects of water deficit duration on four coffee genotype plants’ leaves: control (closed circles) and WD (open circles) plants. Net photosynthetic rate (A–D), transpiration rate (E–H), stomatal conductance (I–L), intercellular CO2 concentration (M–P), and water use efficiency (Q–T). Genotype name shown in the uppermost panels. The data are means (n = 5) ± SE. For each parameter at p < 0.05, distinct letters denote significant variations between WD and control seedlings. Measurements taken a day after re-irrigation are indicated by red arrows.
With gs accounting for 48.8% of the variation in A, the correlation between gs and A was curved, and the regression did not cross the zero (Figure 4). It is very informative that some cultivars were capable of presenting values of A not significantly different from those in control plants albeit at much lower gs. That would reflect their higher WUE.
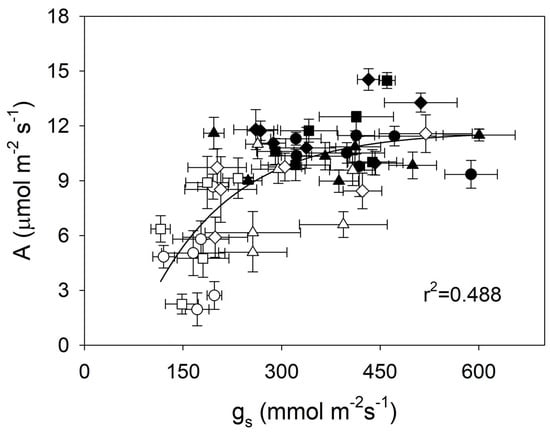
Figure 4.
The net photosynthetic rate (A) and stomata conductance (gs) of four genotypes of arabica coffee in the leaves of plants experiencing a water deficit (open circles) and control plants (closed circles) are correlated. The genotypes examined were Sarchimor 4260 (●), Red Caturra (■), Catimor ECU 02 (▲) and Cavimor ECU (♦). The data are means (n = 5) ± SE. The regression was significant at p < 0.0001.
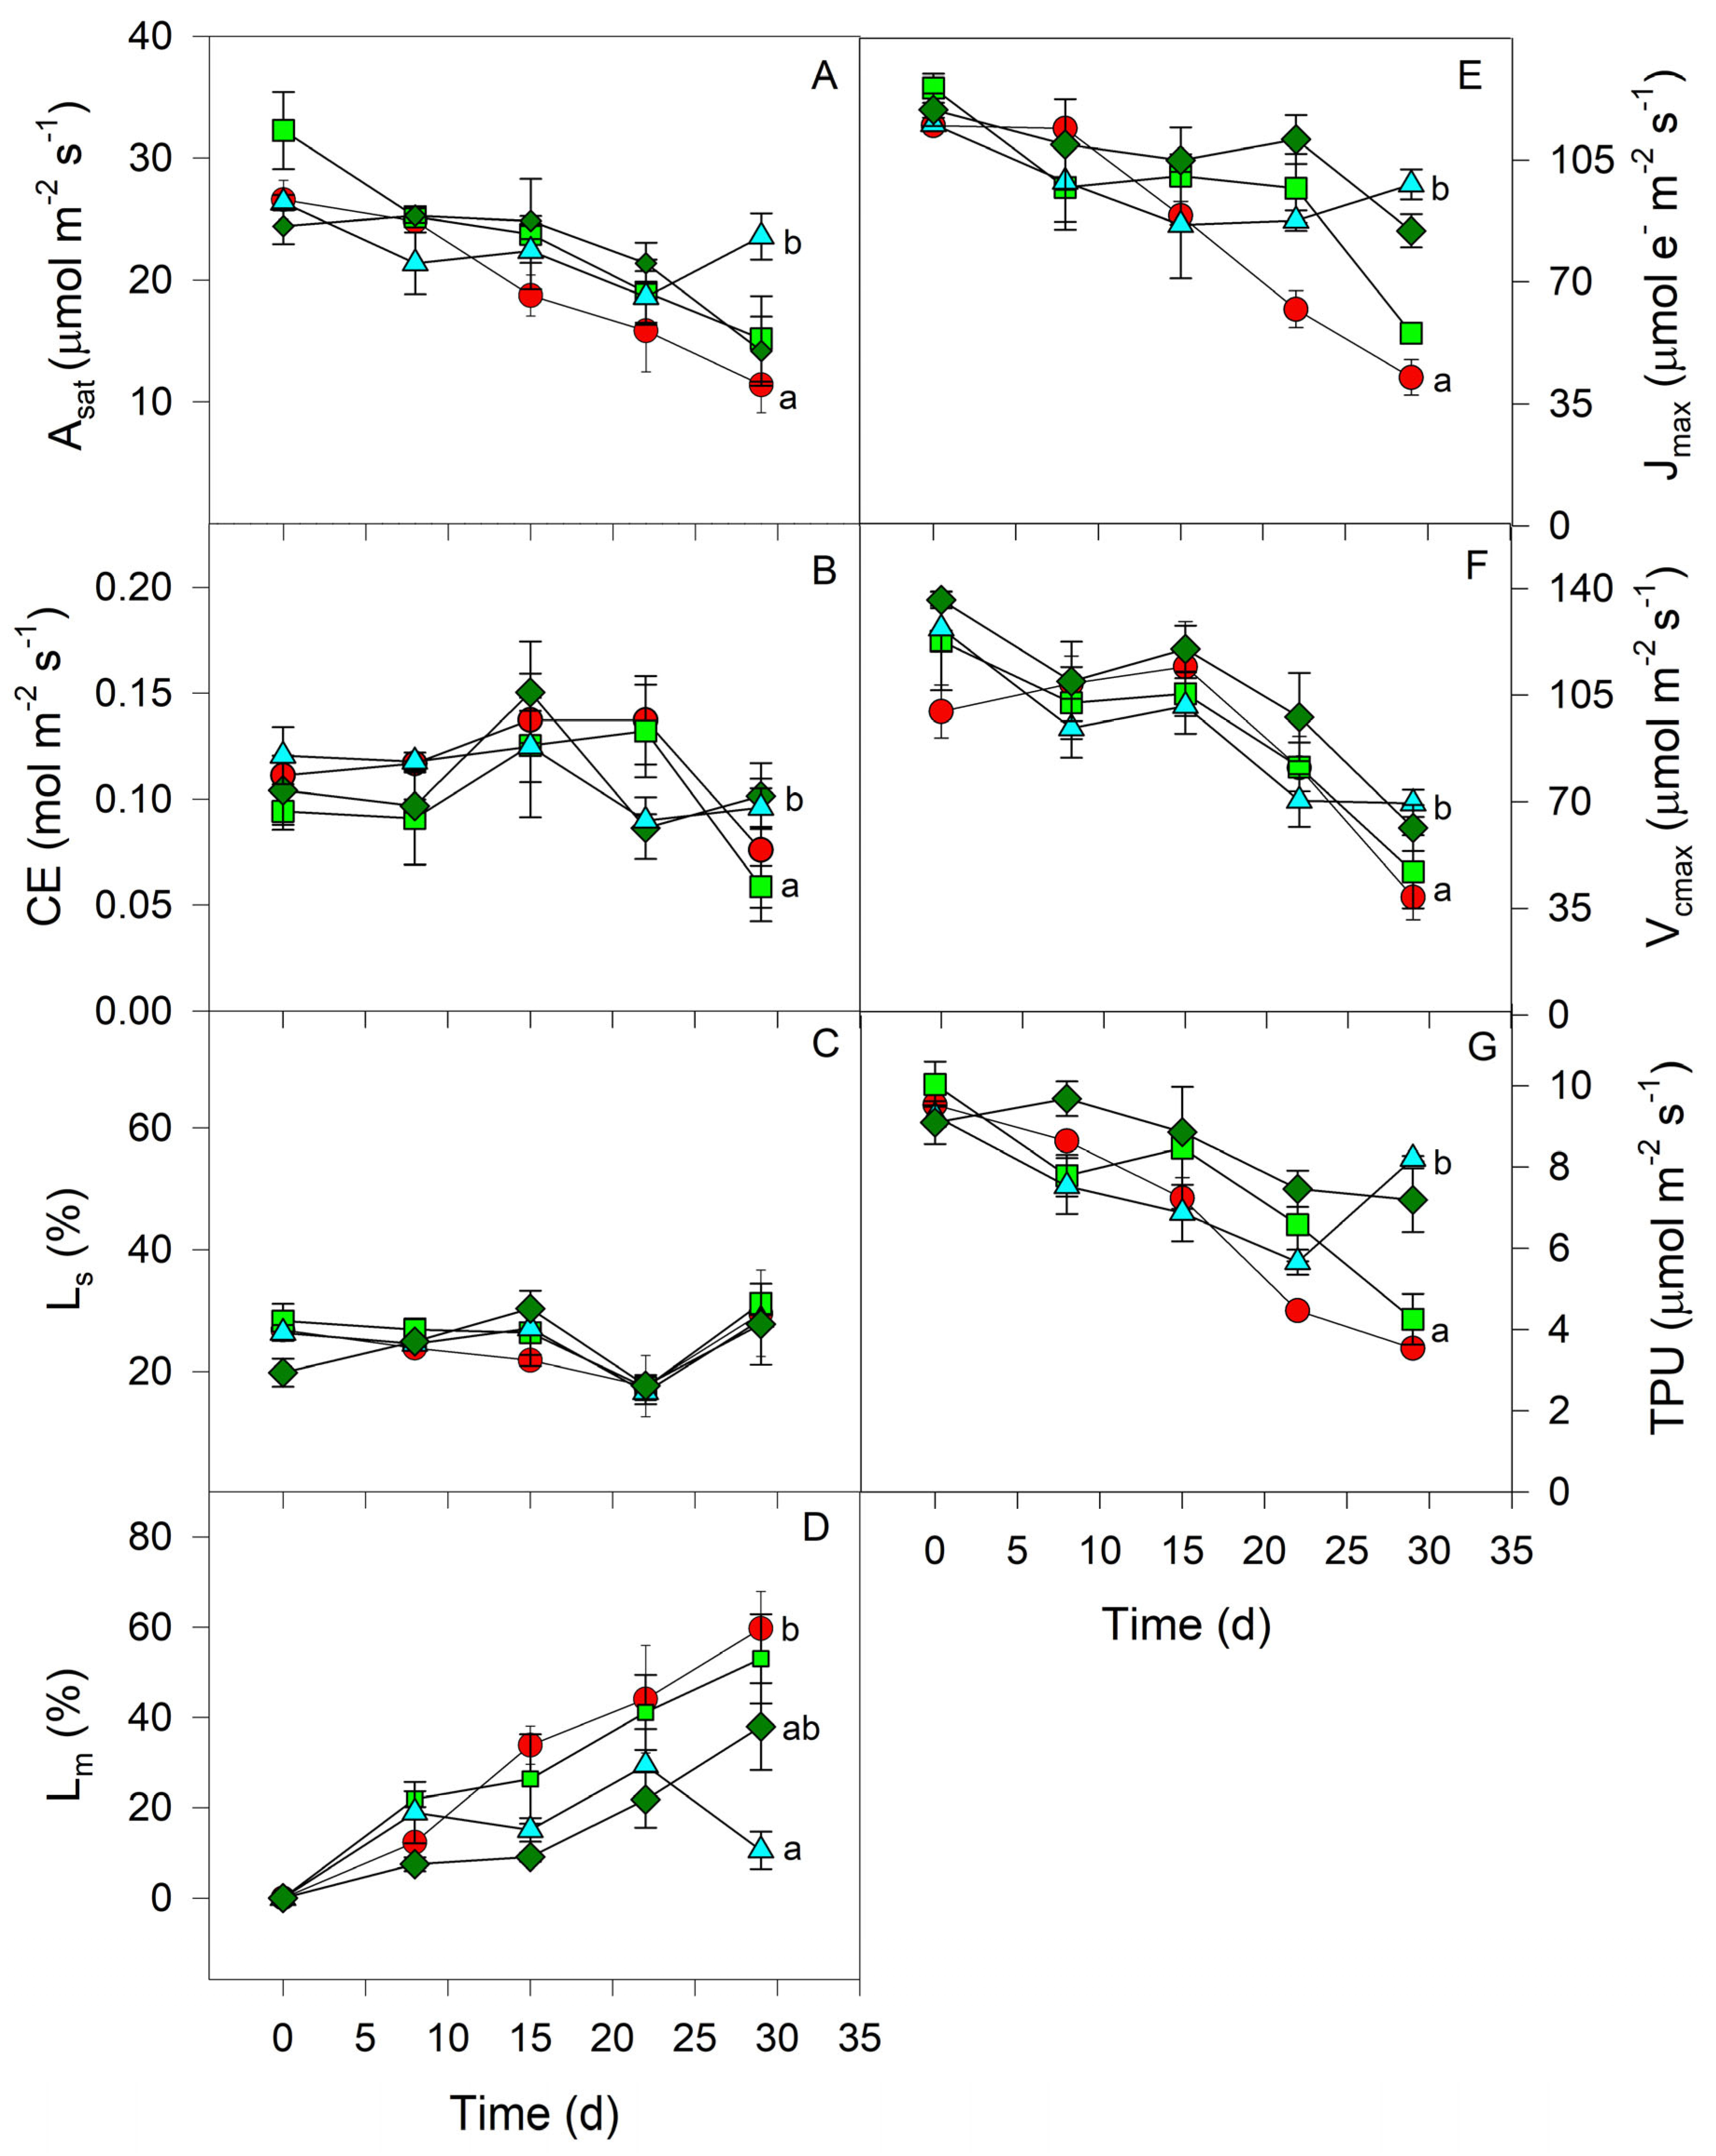
The A/Ci curves and their parameters did not exhibit any statistically significant differences between the control seedlings of the four genotypes under investigation (Figure 5). The greatest A at saturating intercellular [CO2] (Asat) and CE occurred in the order Sarchimor 4260 > red Caturra > Catimor ECU 02 > Cavimor ECU. Values were differentially affected by WD in the four genotypes. Values of Asat and CE declined by 57, 53, 42 and 11%, and 32, 38, 20 and 3% in Sarchimor 4260, red Caturra, Cavimor ECU and Catimor ECU 02, respectively. The Ls was unchanged after 29 days of WD in all genotypes, whereas Lm increased by 60, 53, 38 and 11% in Sarchimor 4260, red Caturra, Cavimor ECU and Catimor ECU 02 genotypes, respectively.
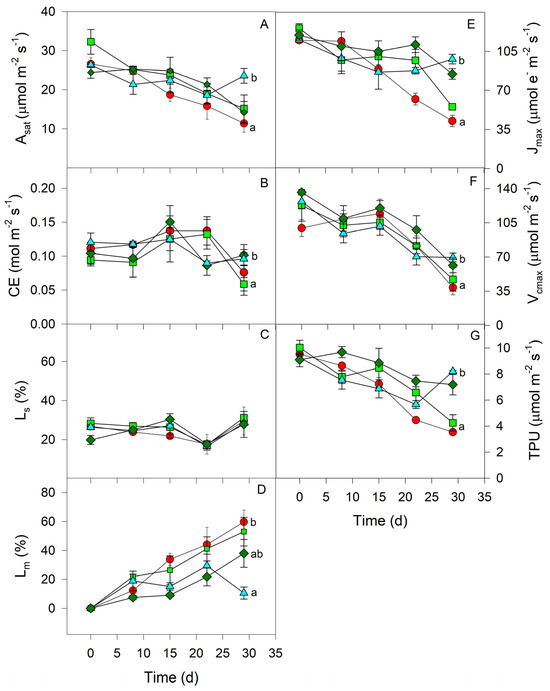
Figure 5.
Effects of water deficit duration in parameters calculated from A/Ci curves on four coffee genotype plants’ leaves: (A), Ci-saturated photosynthetic rate; (B), carboxylation efficiency; (C), relative stomatal limitation; (D), relative mesophyll limitation; (E), maximum rate of electron transport through PSII; (F), maximum rate of RuBisCO carboxylation and (G), triose phosphates utilization rate. The genotypes examined were Sarchimor 4260 (●), Red Caturra (■), Catimor ECU 02 (▲) and Cavimor ECU (♦). When a value exceeds the symbol size, standard errors are presented. The data are means (n = 4) ± SE.
The biochemical parameters determined from the A/Ci curves (Figure 5) showed that due to water deficit Jmax was reduced up to 56–69% in red Caturra and Sarchimor 4260 genotypes, respectively, and 15–29% in Cavimor ECU and Catimor ECU 02 genotypes, respectively; Vcmax was reduced in all coffee genotypes by 45–61% and TPU by 63–61% in red Caturra, Sarchimor 4260 and 21–11% Cavimor ECU and Catimor ECU 02 (Figure 5E–G). A positive linear association occurred during WD between Asat and Jmax (Asat = 0.204 × Jmax −2.17; r2 = 0.78) and between CE and Vcmax (CE = 0.0005 × Vcmax − 0.065; r2 = 0.30). Only 30% of the variation in CE was explained by the Vcmax, compared to 78% by the Jmax in Asat.
3.3. Growth
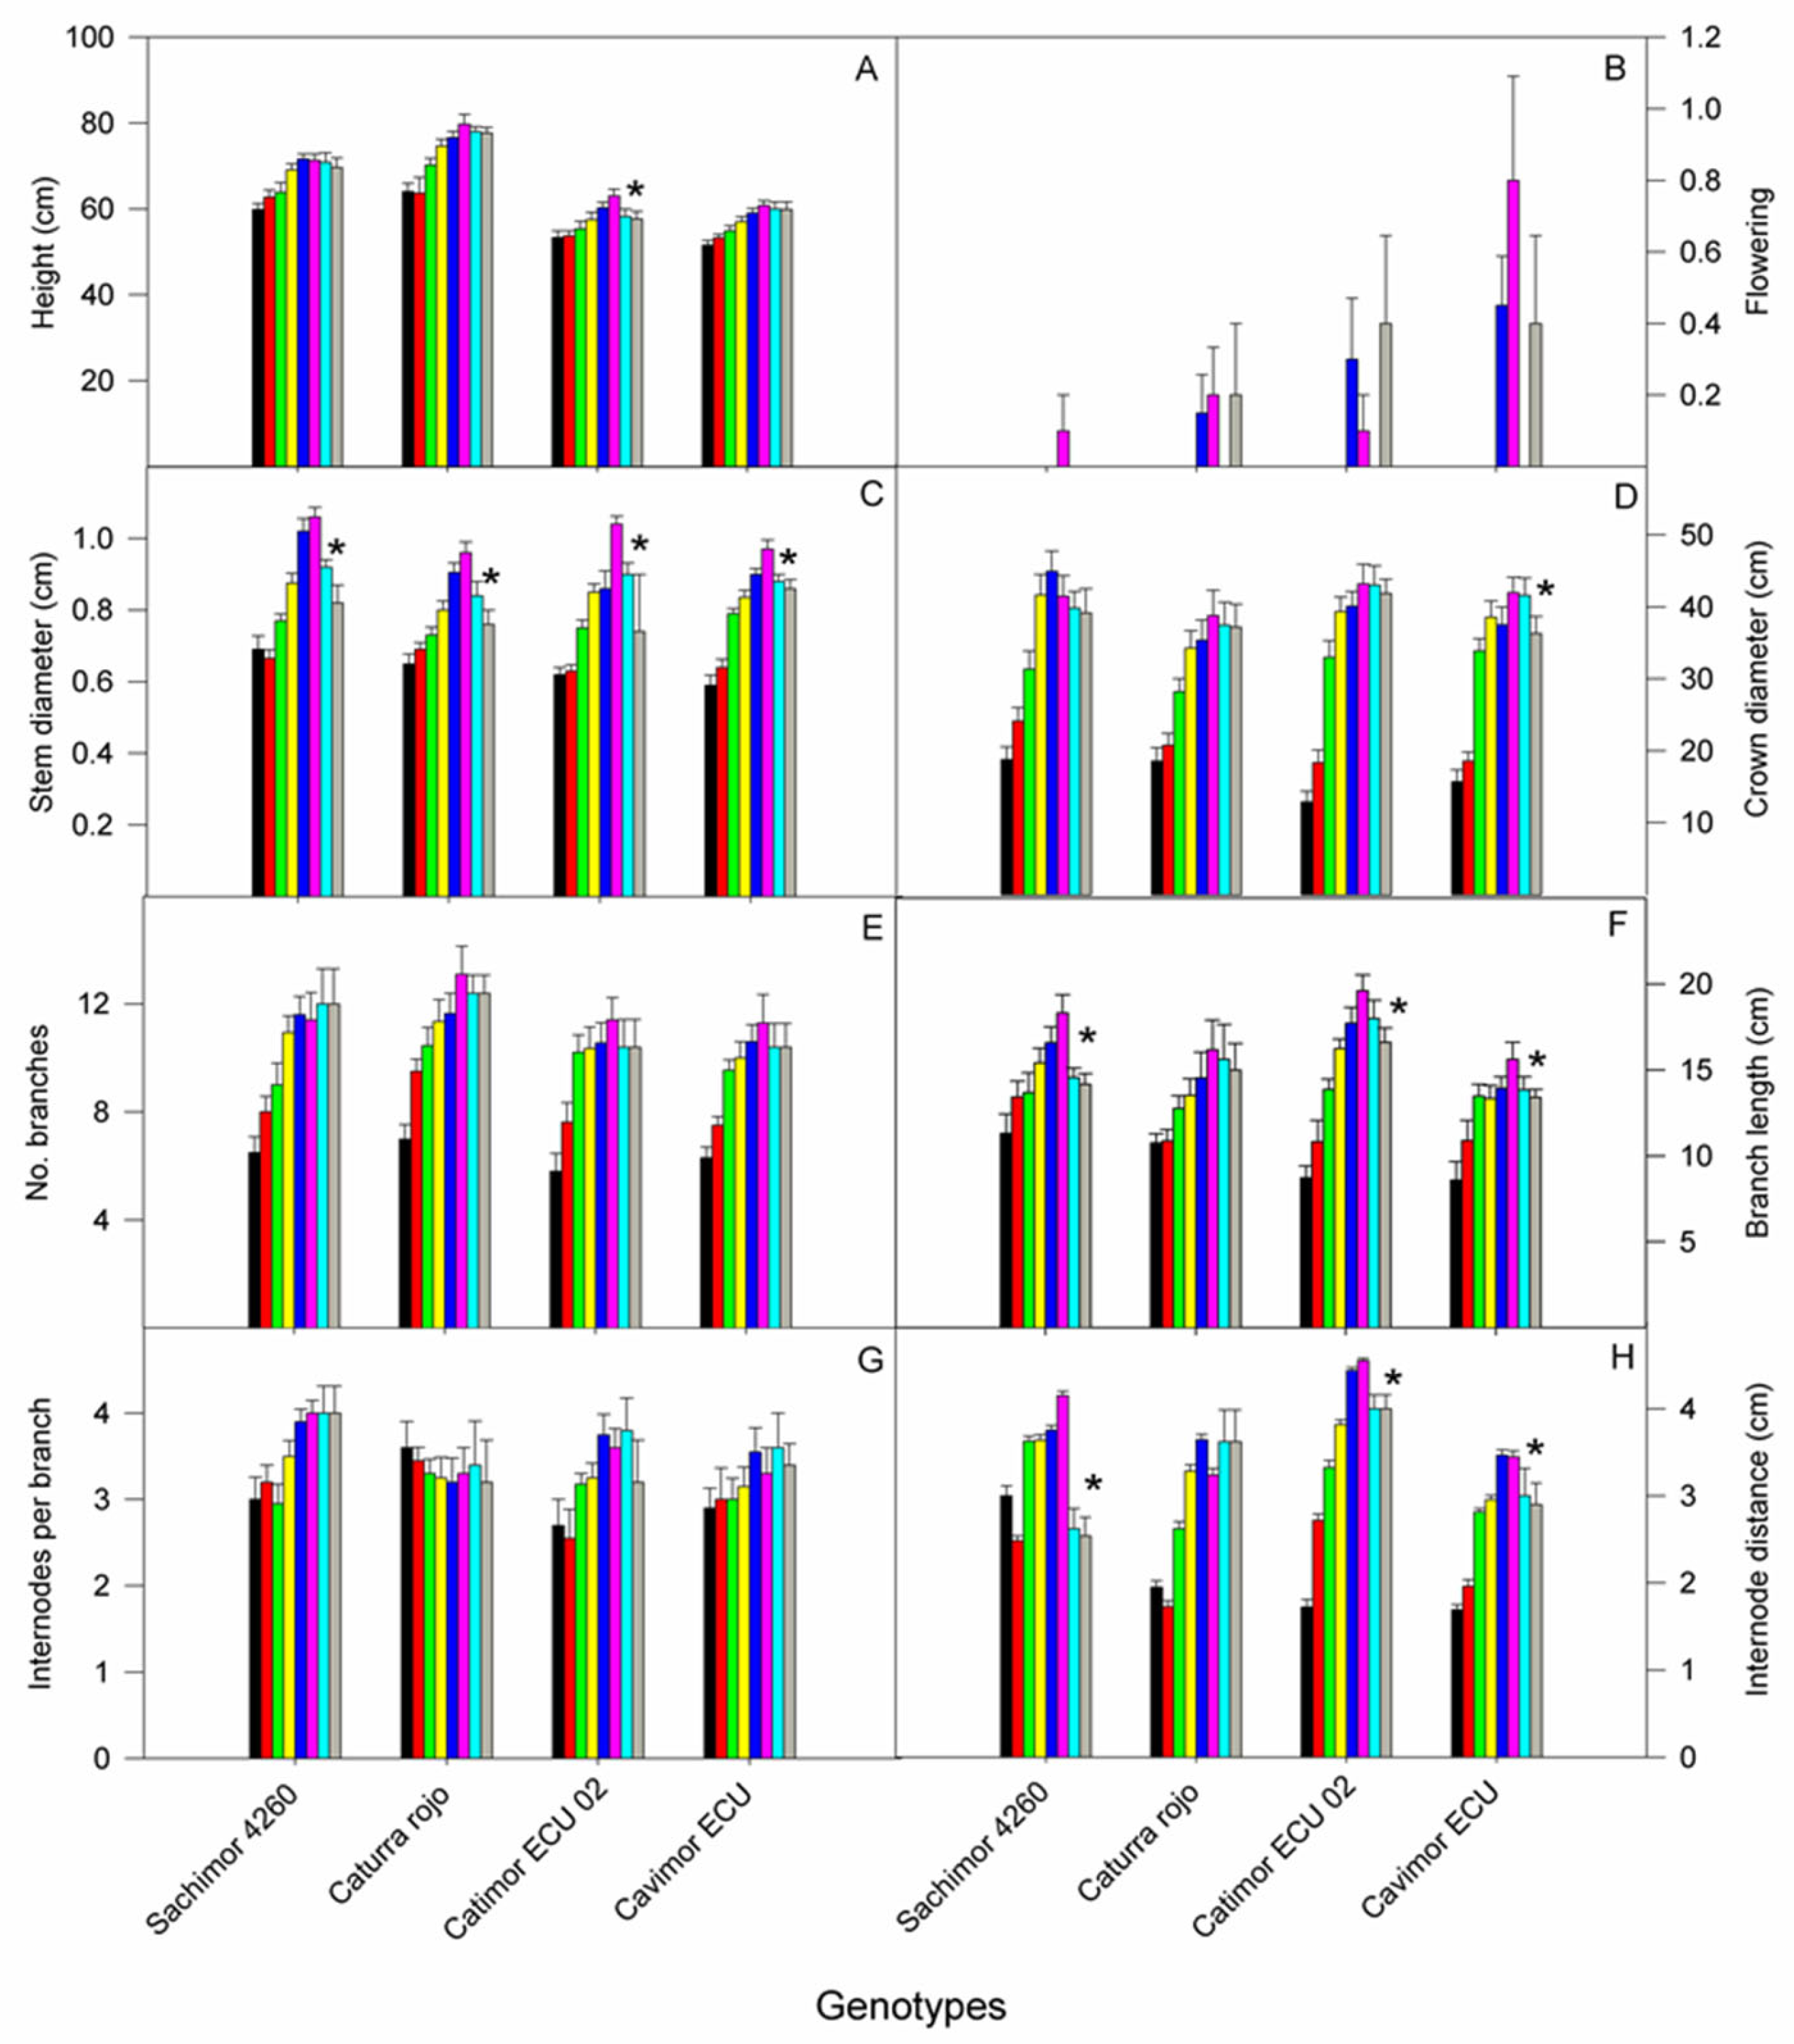
In all four genotypes, there was a gradual increase over time in all growth variables evaluated (Figure 6). From February to July, an increase in height was observed in Catimor ECU 02 and Cavimor ECU of 18–19% and 20–24% in Sarchimor 4260 and red Caturra; plants of the first two genotypes were the shortest, WD significantly decreasing height by 8.5% in Catimor ECU 02. All genotypes flowered at six months after the start of the experiment, Cavimor ECU showing the highest flowering index, and Sarchimor 4260 the lowest; WD had a positive effect on flowering in all genotypes except for Sarchimor.
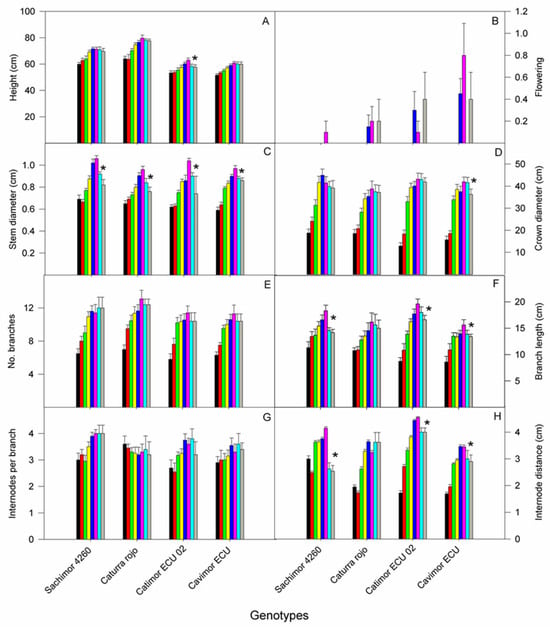
Figure 6.
Changes over time of growth variables in plants of four arabica coffee genotypes in: (A) height; (B) flowering index; (C) stem diameter; (D) crown diameter; (E) number of branches; (F) branch length; (G) total number of nodes per branch, and (H) distance between internodes. Control plants measured in February (black bars), March (red bars), April (green bars), May (yellow bars), June (blue bars) and July (pink bars); plants under water deficit for 15 d (turquoise) and 29 d (grey). Cultivar names are indicated on the abscissa. An asterisk indicates significant differences between control plants in July and those subjected to water deficit (p < 0.05).
A significant increase in stem diameter was found from 47 to 67% in all genotypes; WD caused a significant decreased of 29% (Catimor), 23% (Sarchimor), 21% (red Caturra) and 11% (Cavimor ECU). Similarly, an increase in crown diameter of 2.2–2.1 times in Sarchimor 4260 and red Caturra and 2.7–3.3 in Cavimor ECU and Catimor ECU 02 took place. The number and length of branches increased over time by 84 and 68% in the four genotypes; WD caused a significant reduction in branch length of 14–23%, this variable remaining unaffected in red Caturra. The number of internodes per branch and internode distance increased over time by 16 and 84%, respectively. The WD reduced internode distance by 12–39% in three of the genotypes.
3.4. Multivariate Analysis
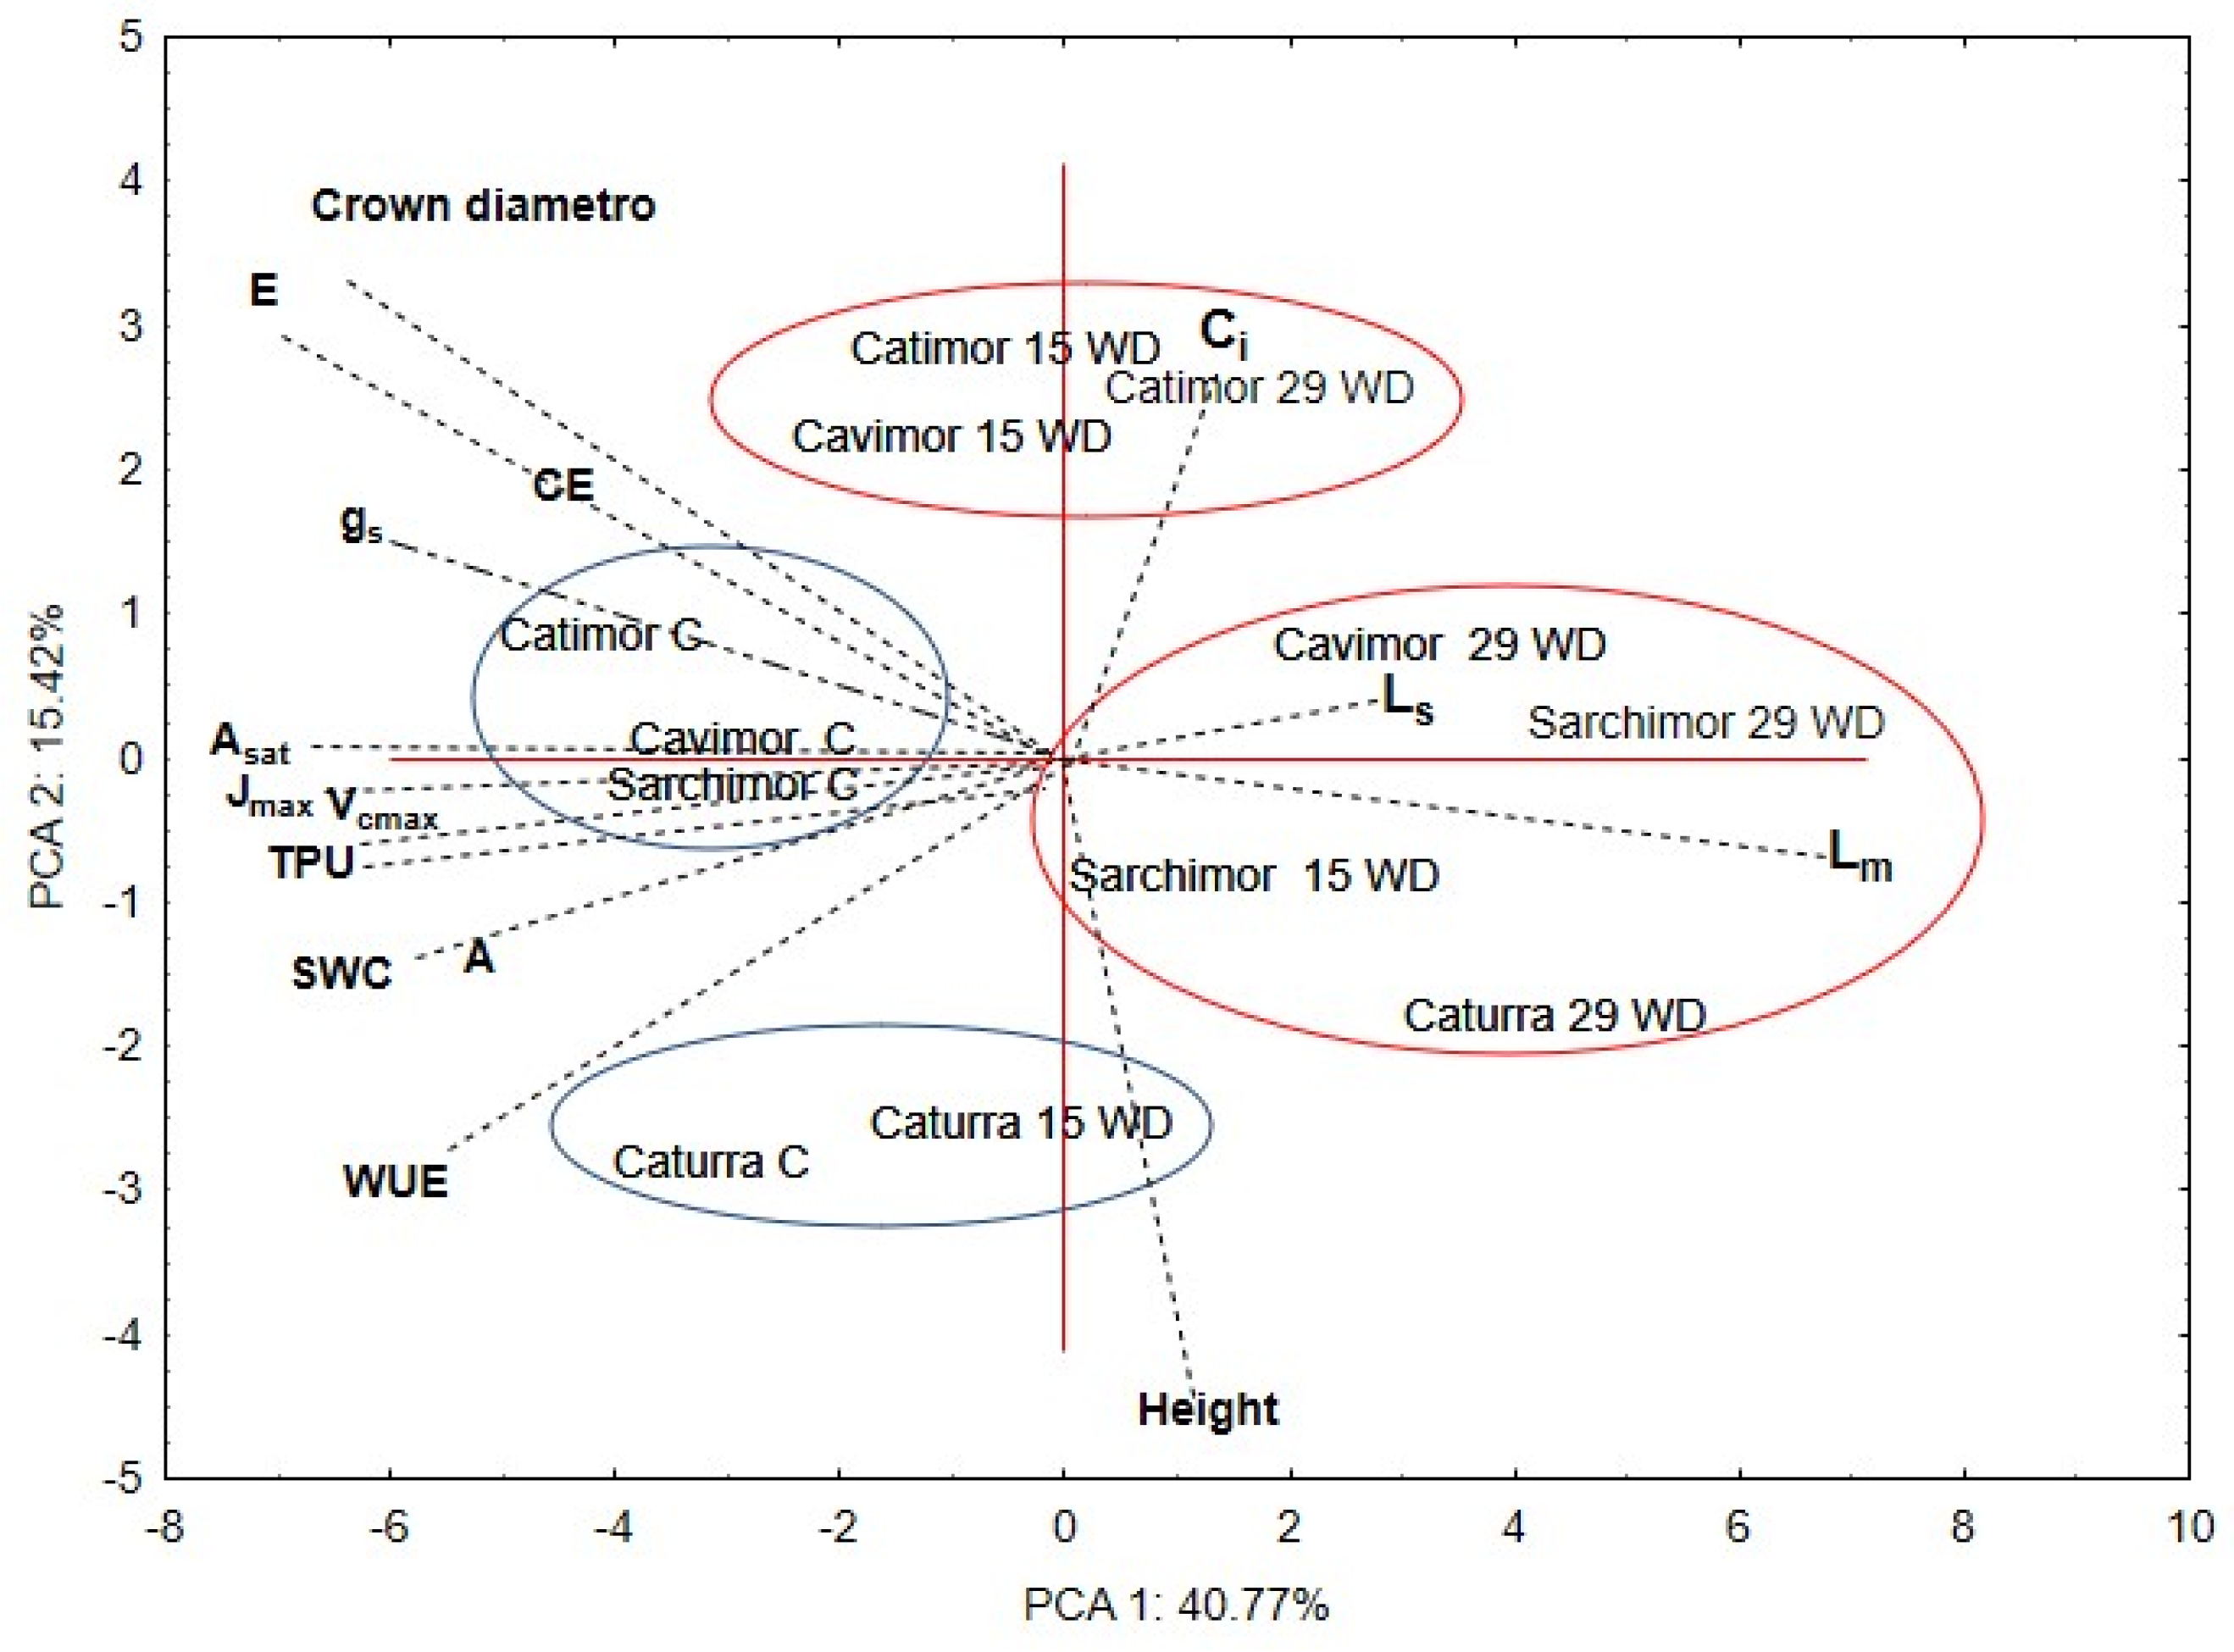
The PCA on the average values of 24 physiological and morphological traits of the four genotypes of arabica coffee evaluated on well-irrigated plants subjected to water deficit, showed that the main axis explained 40.77% of the variation of the data, while the second axis explained 15.42%, i.e., the first two PCAs explained 56.19% in total (Figure 7). The PCA 1 was positively associated with Lm, Ls and negatively associated with Asat, Jmax, Vcmax, TPU, SWC, E, gs, A and stem diameter. The PCA 2 was positively associated with crown diameter, Ci, E, and negatively associated with height and branch numbers and WUE. The four coffee genotypes under study were separated by this PCA, which formed the following groups: Sarchimor, Cavimor ECU and Catimor ECU 02 well-irrigated (control), a second group with red Caturra (control and 15 days WD), a third group with Sarchimor 15 days WD, red Caturra, Sarchimor and Cavimor ECU (29 days WD) and the fourth group consisting of Catimor ECU 02 and Cavimor ECU 15 and Catimor ECU 02 at 29 days WD.
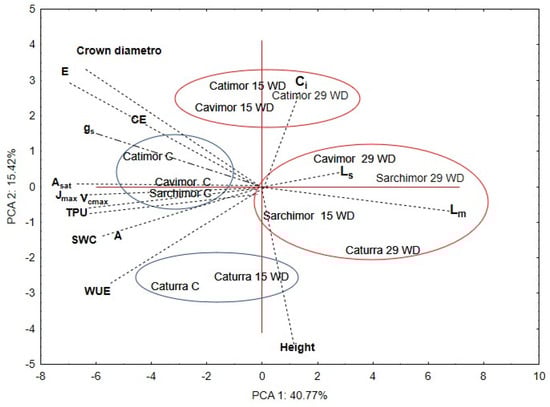
Figure 7.
Principal component analysis for the 24 physiological and morphological characteristics evaluated in the 4 genotypes of arabica coffee. The ellipses represent the coffee genotypes grouped in the different groups, in blue control plants (C) and red in plants water deficit (WD). Longer broken lines indicate more weight in each component, and also indicate the variables that are significant in each of the main components.
4. Discussion
The findings validated our hypothesis 1 by demonstrating differences in gas exchange and growth characteristics among four genotypes of healthy, well-irrigated arabica coffee plants. Under irrigated conditions, the genotypes Cavimor ECU and Catimor ECU 02 exhibited the greatest physiological achievement, i.e., great A and WUE. Since 15 to 29 days without irrigation resulted in a significant drop in soil and leaf water status, photosynthetic variables, and growth parameters, all four genotypes were susceptible to WD. We noticed variations in genotype response to WD, indicating variations in drought tolerance. The results indicated that Catimor ECU 02 and Cavimor ECU were more resistant to WD, while red Caturra and Sarchimor 4260 were the most susceptible. The results are consistent with our hypothesis 2, which states that different arabica coffee genotypes would experience different effects on WUE due to physiological plasticity. Specifically, WUE was more reduced during WD in the Sarchimor 4260 and red Caturra genotypes than in the Cavimor ECU and Catimor ECU 02 genotypes; however, after re-irrigation for one day, WUE values rapidly regained in the Cavimor ECU and Catimor ECU 02 genotypes, but not in the Sarchimor 4260 and red Caturra genotypes.
Significant difference in water status and gas exchange performance of plantlet of the four genotypes develop under in semi-controlled conditions suggested physiological adaptability amidst genotypes. The research showed values of A and gs that are greater than those observed in 31 varieties of C. arabica and C. canephora clones evaluated in Ecuador [14,32] and comparable to those found in C. arabica in Brazil, Colombia, and Ethiopia [4,25,33]. For arabica and conilon coffee, mean values of A of 8 μmol m−2 s−1 and gs of 148 mmol m−2 s−1 have been observed in Brazil [34].
The study’s gs values, which ranged from 277 to 400 mmol m−2 s−1 [14], were higher than those found in prior studies on arabica and conilon coffee (which had gs values of 108 and 148 mmol m−2 s−1, respectively [34]). The WUE observed in the study was comparable to that reported for clones of robusta and arabica coffee (2.8 and 3.8 mmol mol−1, respectively), assessed in the field and in greenhouses [14,25,33]. As SWC decreased under WD, a reduction in LWC and RWC in all four genotypes studied suggested that these were susceptible to water shortage. Coffee does not tolerate dehydration, but nevertheless maintains a relatively high RWC in dry conditions, making it a species that conserves water [35].
The four C. arabica genotypes under evaluation showed varied responses to WD in terms of leaf gas exchange (A, gs, E, and WUE). Similar results have been reported in arabica coffee [25,33]. In contrast, in two C. canephora clones, gas exchange was unaffected by WD, although their water status was negatively affected by WD [23]. In Ecuador, it was found that in 21 C. arabica cultivars under WD in field conditions A, gs and WUE differed significantly among cultivars [14]. Cultivar Cavimor ECU had the highest A and WUE, maintained the values of these parameters up to 22 days of WD and showed full recovery with irrigation, suggesting that this cultivar could be selected for growth in areas subject to WD; however, further research under natural conditions is urgently required.
Results of WUE were significantly higher in Cavimor ECU and Catimor ECU 02, while the lowest were found in red Caturra. We conclude that A and WUE could be indicators of the tolerance of coffee cultivars to WD. In Sarchimor 4260 and red Caturra genotypes (sensitive to WD), A and gs were significantly reduced by water deficit more than in Catimor ECU 02 and Cavimor ECU, making the latter two more tolerant to WD. These results suggest that, during the seedling stage, arabica coffee has physiological adaptability to WD. Previous reports have shown comparable outcomes with WD for arabica coffee genotypes—the sensitive Ca754 and CaJ-19 genotypes, as well as the Castillo variety, and the comparatively tolerant Ca74110 and Ca74112 [25,32]. The gas exchange of 21 genotypes of C. arabica that were assessed in field conditions decreased due to drought [14].
Gas exchange and related variables showed bimodal responses to WD. At first, as RWC decreased, A and gs declined as well, but Ci remained constant, indicating that stomata were not significantly limiting A under WD. Nevertheless, Ci under WD remained constant with an average Ci/Ca ratio of 0.77, suggesting that metabolic limitation of A became increasingly significant, even if the relationship between A and gs in this study was curvilinear. This interpretation of the data is supported by the observation that, after one day of re-irrigation, A was fully restored in Cavimor ECU and Catimor ECU 02 but not in Sarchimor 4260 and red Caturra. In contrast, genotypes of C. arabica from Brazil and Ecuador have previously shown significant linear relationship between A and gs [14,34], but not in conilon [34] or in robusta, indicating that in C. canephora cv. robusta coffee clones A was independent of gs [32].
Reduces in RWC, A, and gs without alterations in WUE in Catimor ECU 02 and Cavimor ECU after 29 days of WD were a general pattern that indicated coffee genotypes optimizing water use. Similarly, WUE did not change in arabica coffee in response to drought [14]. Water limitation may result in a decrease in A due of stomatal limitation, because of reductions in gs-related stomatal closure and decreases in Ci and/or through damage of metabolic process [22]. With the exception of Cavimor ECU, the majority of all four genotypes closed their stomata in response to WD, resulting in a drop in gs and a consequent avoidance of excessive water loss and reductions in A. Since WD had no effect on Ci, we do not completely rule out the possibility that metabolic variables were crucial in the regulation of A [22]. With the exception of Cavimor ECU and Catimor ECU 02, where colimitation of A by stomatal and metabolic factors occurred, values of Ls remained constant during the 29 days of WD, while Lm increased gradually in all four cultivars. This suggests that, as WD increased, biochemical and photochemical regulation of A became more important than decline in gs (stomatal closure). This implies that the regulation of A by photochemical and biochemistry became increasingly significant as WD rose, rather than stomatal closure (i.e., the reduction of gs).
All four genotypes had comparable photosynthetic capacities, which were influenced by WD in distinct ways as seen by the A/Ci curves. Control plants showed the maximum photosynthetic capacity, determined under saturating PPFD (Asat) of 24–32 μmol m−2 s−1, similar to reported values up to 30 μmol m−2 s−1 [36,37]. In Sarchimor 4260, red Caturra and Cavimor ECU, the noted declines in Asat and CE with decreasing A discernible decrease in Vcmax and Jmax, respectively, suggests that WD had a significant impact on the activity and/or quantity of RubisCO and the availability of RuBP. In contrast, only a small reduction of CE and Asat was found in Catimor ECU 02, which suggested that no metabolic process was impaired. Our estimations of biochemical parameters in the four C. arabica cultivars studied support data reported before in red Catuai and arabica coffee by [38,39] and the values of Vcmax, Jmax and TPU were higher than the results reported in Catimor [2].
Both the Catimor ECU 02 and Cavimor ECU genotypes, which partially tolerant to WD, displayed a significantly rapid and better recovery from the negative effects of WD following a single day of re-irrigation. The four arabica coffee genotypes showed notable variations in the A/Ci curve parameters; Catimor ECU 02 and Cavimor ECU showed less variation than Sarchimor 4260 and red Caturra. In addition to affecting Asat, Jmax, CE, and Vcmax, water deficit also increased Lm by 56% on average in two genotypes that were sensitive, indicating that both stomatal closure (to a lesser extent) and metabolic, photochemical, and/or biochemical limitations during WD were responsible for the reduction of A. In contrast, Ls accounted for 40% of the constraints in red Catuai grown in both full sun and shade, whereas Lm made up 30% of the constraints in the same radiation conditions [39].
Water deficit caused a reduction in some growth variables, this effect being stronger in Sarchimor 4260 and red Caturra than in Catimor ECU 02 and Cavimor ECU. Similar results, except for stem height, shoot fresh mass and dry biomass, were reported in tolerant and sensitive arabica coffee genotypes under drought [25], supporting the observation that WD reduces crop yields by affecting the plant’s vegetative growth [9]. The PCA on the average values of 24 physiological and morphological traits of the 4 genotypes of arabica coffee showed that the first two principal components explained 56.19% of the variation of the variables evaluated. Importantly, similar behavior in Cavimor ECU and Catimor ECU 02 in response to WD indicate that they may be functionally similar to stress, i.e., both genotypes shown water deficit tolerance potential, as further supported by the PCA. In addition, the fact that the most important variable associated with PCA1 was Lm indicated an important weight in the response of coffee to WD in this study.
5. Conclusions
Our findings show that Coffea arabica genotypes differ in their physiological performance, growth traits, and response to water deficit. The photosynthetic capacity of all four genotypes of arabica coffee was high. Bigger values of net photosynthetic rate and water use efficiency were found in Cavimor ECU and Catimor ECU 02 compared to the Sarchimor 4260 and red Caturra genotypes, indicating that situations where water availability is a major constraint may be more favorable for the former genotypes. The evidence suggests that there may be significant differences in tolerance among different genotypes in coffee. In plants of arabica coffee genotypes submitted to water deficit the stress not only affected photosynthetic capacity but also increased metabolic limitations, while stomatal limitations remained constant in the two sensitive genotypes and the resistant Cavimor ECU, indicating that both causes are responsible for the decrease in net photosynthetic rate: to a lesser degree stomatal closure and in major degree biochemical or metabolic damage during water deficit. In contrast, in Catimor ECU 02, carboxylation efficiency, maximum rate of carboxylation of Rubisco, maximum electron transport rate and net photosynthetic rate at saturating intercellular [CO2] were less strongly affected, suggesting that metabolic processes were not impaired and colimitation of net photosynthetic rate by stomatal and non-stomatal factors occurred. Nevertheless, neither type of factor’s regulation of photosynthesis was an effective enough mechanism to preserve water use efficiency, which decreased.
Although the genotypes of Cavimor ECU and Catimor ECU 02 seedlings did not fully optimize their use of water, water deficit had less of an impact on their growth and physiological performance than it did on Sarchimor 4260 and red Caturra. The former two genotypes with water deficit tolerance potential could be beneficial for coffee programs for developing plants in drier habitats. Further studies on physiology are required to assess photosynthetic capacity in arabica coffee seedlings and plants in Ecuador, aiming to select drought-tolerant genotypes for efficient cultivation.
Supplementary Materials
The following supporting information can be downloaded at: https://www.mdpi.com/article/10.3390/agronomy14081713/s1, Figure S1: Seedlings of four 10-month-old arabica coffee genotypes used in the greenhouse experiments. Victor Reynel. Figure S2: Five-year-old adult trees of the 4 Arabica coffee genotypes grown in the field, photos courtesy of Dr. Luis Duicela.
Author Contributions
Conceptualization, Methodology, Data Acquisition, formal analysis, Writing, Reviewing and Editing, Funding Acquisition, W.T.; Methodology, Data Acquisition, Writing and Editing, D.W.L.; Methodology, Data Acquisition, supervision, V.H.R.C.; Conceptualization, Writing-Reviewing and Editing, A.H. All authors have read and agreed to the published version of the manuscript.
Funding
This research was funded by the Prometeo Project of the Ministry of Higher Education, Science, Technology and Innovation (SENESCYT) of the Republic of Ecuador via their sponsorship and funding in this work, specifically the fellowship program for W.T., and the UTLVTE research department.
Data Availability Statement
The original contributions presented in the study are included in the article/supplementary material; further inquiries can be directed to the corresponding author/s.
Acknowledgments
We thank E. Avila-Lovera for critically reading the manuscript. The authors are grateful to the Prometeo Project SENESCYT of the Republic of Ecuador for its sponsorship and funding in this work.
Conflicts of Interest
The authors declare no conflicts of interest.
References
- Caporaso, N.; Whitworth, M.B.; Grebby, S.; Fisk, I.D. Non-destructive analysis of sucrose, caffeine and trigonelline on single green coffee beans by hyperspectral imaging. Food Res. Int. 2018, 106, 193–203. [Google Scholar] [CrossRef] [PubMed]
- Xiao, Z.; Ma, G.; Bai, X.; Li, J.; Zhao, M.; Su, L.; Zhou, H. The influence of leaf anatomical traits on photosynthesis in Catimor type Arabica coffee. Bever. Plant Res. 2024, 4, e002. [Google Scholar] [CrossRef]
- DaMatta, F.M.; Rahn, E.; Läderach, P.; Ghini, R.; Ramalho, J.C. Why could the coffee crop endure climate change and global warming to a greater extent than previously estimated? Clim. Chang. 2019, 152, 167–178. [Google Scholar] [CrossRef]
- Semedo, J.N.; Rodrigues, A.P.; Lidon, F.C.; Pais, I.P.; Marques, I.; Gouveia, D.; Armengaud, J.; Silva, M.J.; Martins, S.; Semedo, M.C.; et al. Intrinsic non-stomatal resilience to drought of the photosynthetic apparatus in Coffea spp. is strengthened by elevated air [CO2]. Tree Physiol. 2021, 41, 708–727. [Google Scholar] [CrossRef] [PubMed]
- ICO (International Coffee Organization). 2021. Available online: https://icocoffee.org/ (accessed on 12 December 2021).
- ICO (International Coffee Organization). 2024. Available online: https://icocoffee.org/ (accessed on 1 March 2024).
- Duicela, L. Café robusta: Producción y poscosecha. In Humus ESPAM MFL; Calceta-Manabí-Ecuador: Calceta, Ecuador, 2017; p. 292. ISBN 9789942859587. (In Spanish) [Google Scholar]
- Cavatte, P.C.; Rodríguez-López, N.F.; Martins, S.C.V.; Mattos, M.S.; Sanglard, L.M.; DaMatta, F.M. Functional analysis of the relative growth rate, chemical composition, construction and maintenance costs, and the payback time of Coffea arabica L. leaves in response to light and water availability. J. Exp. Bot. 2012, 63, 3071–3082. [Google Scholar] [CrossRef] [PubMed]
- DaMatta, F.M. Exploring drought tolerance in coffee: A physiological approach with some insights for plant breeding. Braz. J. Plant Physiol. 2004, 16, 1–6. [Google Scholar] [CrossRef]
- DaMatta, F.M.; Ramalho, J.D. Impacts of drought and temperature stress on coffee physiology and production: A review. Braz. J. Plant Physiol. 2006, 18, 55–81. [Google Scholar] [CrossRef]
- DaMatta, F.M.; Godoy, A.G.; Menezes-Silva, P.E.; Martins, S.C.V.; Sanglard, L.M.V.; Morais, L.E.; Torre-Neto, A.; Ghini, R. Sustained enhancement of photosynthesis in coffee trees grown under free-air CO2 enrichment conditions: Disentangling the contributions of stomatal, mesophyll, and biochemical limitations. J. Exp. Bot. 2016, 167, 341–352. [Google Scholar] [CrossRef]
- Martins, M.Q.; Rodrigues, W.P.; Fortunato, A.S.; Leitão, A.E.; Rodrigues, A.P.; Pais, I.P.; Martins, L.D.; Silva, M.J.; Rebodero, F.M.; Partelli, F.L.; et al. Protective response mechanisms to heat stress in interaction with high [CO2] Conditions in Coffea spp. Front. Plant Sci. 2016, 7, 947. [Google Scholar] [CrossRef]
- Rodríguez-López, N.F.; Martins, S.C.V.; Cavatte, P.C.; Silva, P.E.M.; Morais, L.E.; Pereira, L.F.; Reis, J.V.; Ávila, R.T.; Godoy, A.G.; Lavinski, A.O.; et al. Morphological and physiological acclimations of coffee seedlings to growth over a range of fixed or changing light supplies. Environ. Exp. Bot. 2014, 102, 1–10. [Google Scholar] [CrossRef]
- Tezara, W.; Duicela, G.L.A.; Reynel Chila, V.H.; Nazareno Ortiz, R.; Bolaños Ortega, M.J. Seasonal changes in gas exchange and yield of 21 genotypes of Coffea arabica. Bot. Sci. 2022, 100, 1000–1013. [Google Scholar] [CrossRef]
- Duicela, L. Productividad y Estabilidad Ambiental de Clones de Café Robusta en Distintas Localidades Cafetaleras del Ecuador. Ph.D. Thesis, Universidad del Zulia, Maracaibo, Venezuela, 2021. (In Spanish) [Google Scholar] [CrossRef]
- Gornall, J.; Betts, R.; Burke, E.; Clark, R.; Camp, J.; Willet, K.; Wiltshire, A. Implications of climate change for agricultural productivity in the early twenty–first century. Philos. Trans. R. Soc. 2010, 365, 2973–2989. [Google Scholar] [CrossRef] [PubMed]
- DaMatta, F.M.; Grandis, A.; Arenque, B.C.; Buckeridge, M.S. Impacts of climate changes on crop physiology and food quality. Food Res. Int. 2010, 43, 1814–1823. [Google Scholar] [CrossRef]
- Semedo, J.N.; Rodrigues, W.P.; Dubberstein, D.; Martins, M.Q.; Martins, L.D.; Pais, I.P.; Rodrigues, A.P.; Leitão, A.E.; Partelli, F.L.; Campostrini, E.; et al. Coffee responses to drought, warming and high [CO2] in a context of future climate change scenarios. In Theory and Practice of Climate Adaptation. Climate Change Management; Alves, F., Leal Filho, W., Azeiteiro, U., Eds.; Climate Change Management; Springer: Cham, Switzerland, 2018; pp. 465–477. [Google Scholar] [CrossRef]
- Rodrigues, A.P.; Pais, I.P.; Leitão, A.E.; Dubberstein, D.; Lidon, F.C.; Marques, I.; Semedo, J.N.; Rakocevic, M.; Scotti-Campos, P.; Campostrini, E.; et al. Uncovering the wide protective responses in Coffea spp. leaves to single and superimposed exposure of warming and severe water deficit. Front. Plant Sci. 2024, 14, 1320552. [Google Scholar] [CrossRef] [PubMed]
- Merga, D.; Beksisa, L. Mechanisms of drought tolerance in coffee (Coffea arabica L.): Implication for genetic improvement program: Review. Am. J. BioSci. 2023, 11, 63–70. [Google Scholar] [CrossRef]
- Läderach, P.; Ramirez-Villegas, J.; Navarro-Racines, C.; Zelaya, C.; Martinez-Valle, A.; Jarvis, A. Climate change adaptation of coffee production in space and time. Clim. Chang. 2017, 141, 47–62. [Google Scholar] [CrossRef]
- Lawlor, D.W.; Tezara, W. Causes of decreased photosynthetic rate and metabolic capacity in water-deficient leaf cells: A critical evaluation and integration of mechanisms and processes. Ann. Bot. 2009, 103, 561–579. [Google Scholar] [CrossRef] [PubMed]
- DaMatta, F.M.; Chaves, A.R.M.; Pinheiro, H.A.; Ducatti, C.; Loureiro, M.E. Drought tolerance of two field-grown clones of Coffea canephora. Plant Sci. 2003, 164, 111–117. [Google Scholar] [CrossRef]
- Pinheiro, H.A. Physiological and Morphological Adaptations as associated with Drought Tolerance in Robusta Coffee (Coffea canephora Pierre var. kouillou). Ph.D. Thesis, Universidade Federal de Viçosa, Viçosa, Brazil, 2004. [Google Scholar]
- Chekol, H.; Warkineh, B.; Shimber, T.; Mierek-Adamska, A.; Dabrowska, G.B.; Degu, A. Drought stress responses in arabica coffee genotypes: Physiological and metabolic insights. Plants 2024, 13, 828. [Google Scholar] [CrossRef]
- INAMHI. Red de Estaciones Automáticas Hidrometeorológicas. 2016. Available online: https://www.inamhi.gob.ec/informacion-en-linea/ (accessed on 1 May 2021).
- Jones, H.G. Plants and Microclimate. A Quantitative Approach to Environmental Plant Physiology; Cambridge University Press: Cambridge, UK, 1992; p. 465. [Google Scholar]
- Tezara, W.; Torres-Domínguez, T.S.; Loyaga, D.W.; Nazareno-Ortiz, R.; Reynel-Chila, V.H.; Bolaños Ortega, M.J. Photosynthetic activity of oil palm (Elaeis guineensis) and interspecific hybrid genotypes (Elaeis oleifera × Elaeis guineensis), and response of hybrids to water déficit. Sci. Hortic. 2021, 287, 110263. [Google Scholar] [CrossRef]
- Farquhar, G.D.; Sharkey, T.D. Stomatal conductance and photosynthesis. Annu. Rev. Plant Physiol. 1982, 33, 317–345. [Google Scholar] [CrossRef]
- Jacob, J.; Lawlor, D.W. Stomatal and mesophyll limitations of photosynthesis in phosphate deficient sunflower, maize and wheat plants. J. Exp. Bot. 1991, 42, 1003–1011. [Google Scholar] [CrossRef]
- Sharkey, T.D. What gas exchange data can tell us about photosynthesis? Plant Cell Environ. 2015, 39, 1161–1163. [Google Scholar] [CrossRef] [PubMed]
- Tezara Fernández, W.; Mendoza Cortez, P.J.; Loyaga Guerrero, W.D.; Reynel Chila, V.H.; Bolaños Ortega, M.J. Capacidad fotosintética de 15 clones de café robusta (Coffea canephora) en Esmeraldas, Ecuador. Rev. Espamciencia 2020, 11, 19–27. [Google Scholar] [CrossRef]
- Reyes-Herrera, D.F.; Sánchez-Reinoso, A.D.; Lombardini, L.; Restrepo-Díaz, H. Physiological responses of coffee (Coffea arabica L.) plants to biochar application under water deficit conditions. Not. Bot. Horti Agrobot. 2023, 51, 12873. [Google Scholar] [CrossRef]
- DaMatta, F.M.; Ronchi, C.P.; Maestri, M.; Barros, R.S. Ecophysiology of coffee growth and production. Braz. J. Plant Physiol. 2007, 19, 485–510. [Google Scholar] [CrossRef]
- DaMatta, F.M.; Maestri, M.; Barros, R.S.; Regazzi, A.J. Water relations of coffee leaves (Coffea arabica and C. canephora) in response to drought. J. Horticult. Sci. 1993, 68, 741–746. [Google Scholar] [CrossRef]
- Campostrini, E.; Maestri, M. Photosynthetic potential of five genotypes of Coffea canephora Pierre. Rev. Bras. Fisiol. Veg. 1998, 10, 13–18. [Google Scholar]
- DaMatta, F.M.; Loos, R.A.; Rodrigues, R.; Barros, R.S. Actual and potential photosynthetic rates of tropical crop species. Braz. J. Plant. Physiol. 2001, 13, 24–32. [Google Scholar] [CrossRef]
- Martins, S.C.V.; Galmés, J.G.; Molins, A.; DaMatta, F.M. Improving the estimation of mesophyll conductance: On the role of electron transport rate correction and respiration. J. Exp. Bot. 2013, 64, 3285–3298. [Google Scholar] [CrossRef]
- Martins, S.C.V.; Galmés, J.; Cavatte, P.C.; Pereira, L.F.; Ventrella, M.C.; DaMatta, F.M. Understanding the low photosynthetic rates of sun and shade coffee leaves: Bridging the gap on the relative roles of hydraulic, diffusive and biochemical constraints to photosynthesis. PLoS ONE 2014, 9, e95571. [Google Scholar] [CrossRef] [PubMed]

Disclaimer/Publisher’s Note: The statements, opinions and data contained in all publications are solely those of the individual author(s) and contributor(s) and not of MDPI and/or the editor(s). MDPI and/or the editor(s) disclaim responsibility for any injury to people or property resulting from any ideas, methods, instructions or products referred to in the content. |
© 2024 by the authors. Licensee MDPI, Basel, Switzerland. This article is an open access article distributed under the terms and conditions of the Creative Commons Attribution (CC BY) license (https://creativecommons.org/licenses/by/4.0/).