Article

Characterization of Improved Barley Germplasm under Desert Environments Using Agro-Morphological and SSR Markers

by
Abdelhalim I. Ghazy
1,
Mohamed A. Ali
1,
Eid I. Ibrahim
1,
Mohammed Sallam
1,
Talal K. Al Ateeq
1,
Ibrahim Al-Ashkar
1,
Mohamed I. Motawei
2,
Hussein Abdel-Haleem
3,* and
Abdullah A. Al-Doss
1
1
Plant Production Department, College of Food and Agricultural Sciences, King Saud University, Riyadh 11362, Saudi Arabia
2
Crop Science Department, Faculty of Agriculture, University of Alexandria, Alexandria 21526, Egypt
3
US Arid Land Agricultural Research Center, USDA-Agricultural Research Services, Maricopa, AZ 85138, USA
*
Author to whom correspondence should be addressed.
Agronomy 2024, 14(8), 1716; https://doi.org/10.3390/agronomy14081716
Submission received: 17 June 2024 / Revised: 22 July 2024 / Accepted: 1 August 2024 / Published: 4 August 2024
(This article belongs to the Section Crop Breeding and Genetics)

Abstract

:
Barley is indeed a versatile cereal crop, valued for its uses in food, animal feed, and increasingly in biofuel production. As interest grows in developing new barley genotypes that are better adapted to diverse environmental conditions and production systems, integrating agro-morphological evaluations with molecular marker analyses in barley breeding programs is essential for developing new genotypes. It is necessary to explore the genetic diversity of those germplasm to predicate their responses to targeted environments and regions. The current study explored the phenotypic and genotypic relations among Saudi advanced germplasm to facilitate the development of superior barley cultivars suitable for desert environments. Molecular microsatellites (SSR) markers revealed considerable wide genetic variation among Saudi germplasm and checks. Population structure analyses revealed four main groups. Those groups were validated using similarity analyses and coefficients. As well, principal components analysis (PCA) and heat map analyses separated the studied genotypes into four main groups. The improved Saudi germplasm, selected from the barley breeding program, revealed considerably wide genetic and phenotypic diversities, indicating the feasibility of selection to improve for semi-arid conditions. The improved line KSU-BR-C/G-2 had the highest grain yield and harvest index in the first season. Rihana/Lignee was followed by the KSU-BR-C/G-2 genotype, with a grain yield averaging 6734.07 (kg ha−1), in the first season. KSU-BR-88-29-10 yielded 20,000 kg ha−1 for biomass yield. In the second year, KSU-BR-30-7 had the highest biomass yield, with 27,037.04 kg ha−1.

1. Introduction

Barley (Hordeum vulgare L. 2n = 14) is a widely cultivated cool season crop for food, feed, and biofuel. Barley is ranked fourth in terms of global production after maize, rice, and wheat [1,2]. It is a crop that is often preferred by limited-resources farms due to its ease of cultivation, adaptability to harsh environments, and low requirements. Modern crop varieties are mainly developed for certain traits such as high yield potential under favorable production conditions, making them unsuitable for low-income farmers in marginal production environments who face highly variable stress conditions [3]. Breeding for a specific trait reduces the genetic diversity of those crops. It is essential to preserve the biodiversity of plant species including diversity within and between species and ecosystems. Different genetic backgrounds lead to distinct responses to environmental conditions, a phenomenon known as genotype–environment interaction. This poses a significant challenge in breeding, as predicting how these genotypes will react to diverse environmental conditions is challenging [4]. Using exotic and diverse germplasm is a useful tool to increase genetic diversity [5,6,7,8]. Therefore, to improve barley tolerance to biotic and abiotic stresses or increase yield, it is important to understand the genetic diversity among its genotypes. This can be achieved by crossing genetically diverse parents with desirable traits [9]. In any crop-breeding program, assessing genetic diversity is invaluable as it aids in identifying diverse parental combinations to create segregating progenies with maximum genetic variability [3,9]. It also facilitates the introgression of desirable genes from diverse germplasm into the existing genetic base [5,6,9]. Evaluating genetic variability in barley is essential for breeding programs and genetic resource conservation [5,6,9]. Barley is an important source of animal feed in various regions of Saudi Arabia, where farmers commonly used old barley landraces. However, limited information is available on complete characterization of these landraces. The genetic diversity in Saudi barley landraces was studied for traits related to productivity and abiotic stress such as salt tolerance [10,11,12]. Several research programs have recently begun developing new cultivars with high levels of salt and drought tolerance to replace traditional landraces [12]. Hybrid ideotypes can be developed in crops [13,14,15,16]. Studies by Roy et al. [17] emphasized the importance of selecting ideotypes adapted to diverse agroecological zones, emphasizing traits associated with yield stability, resistance to biotic and abiotic stresses, water, and nutrient use efficiency. This study aims to build upon advancements in barley breeding by conducting a comprehensive analysis of genetic and phenotypic diversity in a set of newly developed Saudi barley genotypes and related check genotypes. By integrating agro-morphological evaluations with molecular marker analyses, we elucidate the genetic basis of key traits and facilitate the development of superior barley cultivars suitable for Saudi agricultural systems. In this context, our study aims to build upon the advancements made in barley breeding by conducting a comprehensive analysis of genetic and phenotypic diversity in a set of newly developed Saudi barley genotypes and related check genotypes. By integrating agro-morphological evaluations with molecular marker analyses, we elucidated the genetic basis of key traits and facilitate the development of superior barley cultivars suitable for Saudi agricultural systems. Characterizing germplasm under desert conditions in Saudi Arabia involves studying and evaluating different barley genotypes to determine their adaptability, performance, and resilience in the arid and semi-arid environments prevalent in this country. The Saudi barley breeding program aims to develop barley ideotypes that excel in key agronomic, morphological, and quality traits suited for the Saudi semi-arid environment, as well as compatibility with modern agricultural practices. A clear set of traits and descriptors of this ideotype provides a guiding framework and strategy for selecting and breeding barley genotypes that meet the specific needs and challenges of Saudi agricultural systems. The flag leaf area, flag leaf length, tillering grain-filling duration harvest index, and chlorophyll content are among the morpho-physiological traits that the Saudi barley breeding program aims to improve beside the seed and protein yields. Developing a crop ideotype is an ongoing process that should be carried out under adverse conditions. This approach can improve crop yield, quality, and resilience to environmental challenges such as climate change.
Advances in genomics and biotechnology have made it possible to identify and manipulate the genes responsible for these desirable traits, enabling more targeted and efficient ideotype breeding. Molecular markers provide a reliable estimate of genetic similarity that cannot be obtained through morphological data alone [18]. The calculation of polymorphic information content (PIC) values has become a standard practice in assessing the informativeness of molecular markers employed in barley breeding programs [19,20]. Furthermore, a genetic distance matrix was utilized to provide valuable information for estimating population structure with a smaller set of microsatellites [21,22,23,24]. Barley genetic diversity studies have extensively used different types of molecular markers, such as Simple Sequence Repeats (SSRs), and next generation sequencing technology, including Diversity Arrays Technology (DArT) and Single-Nucleotide Polymorphisms (SNPs). DNA molecule markers have a wide range of applications in the genetic identification of parents, assessment of genetic variation, identification of genetic linkage groups, and improvement of plants’ genetic structure. SSR primer pairs are considered the most capable marker for plant genetics and breeding programs, because of their co-dominant, multi-allelic nature and because they are relatively abundant with an excellent genome coverage [25,26,27,28,29,30,31].
Assessing genetic variability in barley is essential for breeding programs and genetic resource conservation. In this context, our study aims to build upon the advancements made in barley breeding by conducting a comprehensive analysis of genetic and phenotypic diversity in a set of newly developed Saudi barley genotypes and related check genotypes. By integrating agro-morphological evaluations with molecular marker analyses, we elucidated the genetic basis of key traits and facilitate the development of superior barley cultivars suitable for Saudi agricultural systems. The specific aim of the current study was to analyze the genetic and phenotypic diversities in a set of newly developed Saudi barley genotypes and related check genotypes, and to assess the genetic variability in barley germplasm using agro-morphological traits and molecular markers.

2. Materials and Methods

2.1. Plant Material

This experiment including 32 diverse barley genotypes consists of 14 new Saudi breeding lines (six-rowed barley) and check lines including four local landraces (two-rowed barley), seven cultivars from ICARDA (two- and six-rowed barley), five Egyptian cultivars (six-rowed barley), one American cultivar (six-rowed barley), and one Australian cultivar (two-rowed barley) (Table 1). These check barley lines showed a stable performance for traits such as grain yield when tested under Saudi agricultural practice and the 32 genotypes were planted at the Dirab Research Station, King Saud University, Riyadh, Saudi Arabia, during two winter seasons (2020/2021 and 2021/2022). Dirab is located approximately 50 km west of Riyadh, between latitudes 24°20′35″ and 24°20′51″ N and longitudes 46°31′41″ and 46°45′34″ E. This study utilized a randomized complete block design (RCBD) with three replications each year. Each experimental plot comprised five rows, with each 4 m long and 20 cm wide. The plots were fertilized with urea, muriate of potash (MOP), and triple superphosphate (TSP) at rates of 160 kg N/ha, 80 kg P2O5/ha, and 60 kg K2O/ha, applied at 5, 25, and 55 days after planting, respectively. Weather data for both seasons are shown in Figure 1. During these seasons, full irrigation was implemented, with watering to 100% field capacity whenever cumulative evaporation reached 50 mm.

2.2. Data Collection and Phenotyping

At physiological maturity, 10 single plants from each plot were used to measure the studied traits as the plot mean. Those 10 plants were used to collect the heading date (HD, days), as the number of days after planting to >50% flowering; plant height (PH, cm); flag leaf death (FLD, cm2); grain-filling duration (GFD), as the number of days after flowering; chlorophyll content using the SPAD value; pike length (SL, in cm); and grain number (GN) pre-spike. The 1000 kernel weight (TKW, g); biological yield (BY, kg ha−1), as the total plant biomass; and grain yield (GY, kg ha−1) were estimated. The harvest index (HI, %) was estimated as GY/BY*100. The nitrogen content of the grain and flour protein contents samples were measured using Kjeldahl’s method, as described in the American Association of Cereal Chemists (AACC) [32]. The protein percentage was calculated by multiplying the percentage of nitrogen by a factor of 5.7, in accordance with the standard method described in the literature. The protein content was reported in accordance with the standard method, both on a dry basis and with 14% moisture.

2.3. Genotyping Using SSR Markers

Leaf samples from 20-day-old seedlings of each genotype were collected, immediately frozen in liquid nitrogen, and ground with a pestle and mortar. Genomic DNA was extracted using the cetyltrimethyl ammonium bromide (CTAB) method, following the procedure described by Saghai-Maroof et al. [33]. The DNA’s quantity and quality were assessed with 0.8% agarose gels and a NanoDrop spectrophotometer (ND-8000, Thermo Scientific, Waltham, MA, USA). The DNA samples were then diluted to a concentration of 20 ng/μL using double-distilled water (ddH2O) and stored at −20 °C for SSR fingerprinting.
DNA genotyping of the 32 genotypes was conducted using 29 SSR primers (Table S1), selected from published genetic maps based on their specific positions [34]. The markers were chosen for their polymorphism, reproducibility, and diversity, ensuring comprehensive coverage of the seven barley chromosomes and effective performance with the studied barley genotypes. Each PCR reaction included 50 ng of genomic DNA, 0.5 µM of each primer, and 10 µL of 2× GoTaq Green Master Mix (Promega, Madison, WI, USA) in a total volume of 20 µL. PCR was carried out using a Biosystem cycler (Thermo Fisher Scientific, Waltham, MA, USA) with the following program: an initial denaturation at 95 °C for 5 min, followed by 35 cycles of denaturation at 94 °C for 1 min, annealing (temperature depending on the primer) for 1 min, and extension at 72 °C for 5 min. A final extension was performed at 72 °C for 5 min. The PCR products were then separated on a 3% agarose gel in 1× Tris borate EDTA (TBE) buffer at 75 V for 65 min, stained with ethidium bromide, and visualized and scored using a UV transilluminator (Thermo Fisher Scientific, Waltham, MA, USA.

2.4. Statistical Analysis

2.4.1. Morphological Diversity Analysis

The statistical significance of differences among barley genotypes was assessed using one-way analysis of variance (ANOVA) in STATISTICA [35]. The correlation between agro-morphological traits was determined using the correlation coefficient in Windows Excel 2019. To reduce data dimensionality while preserving essential information, principal component analysis (PCA) was employed. A scatter plot was created using PAST software version 1.62 [36] to visualize the multi-dimensional data of the barley genotypes through PCA. A dendrogram was constructed to illustrate genetic relationships between barley genotypes using the unweighted pair group method with arithmetic average (UPGMA) implemented in NTSYS-pc version 2.2 software [37]. A heat map, generated with R-Studio, was used to categorize the various agro-morphological traits and illustrate differences among barley genotypes. Additionally, a genetic and phenotypic correlation study was conducted to examine correlation patterns for each trait at both the genotypic and phenotypic levels. This analysis reflects the inheritance patterns and associations between traits and was performed using Multi-Environment Trial Analysis with R for Windows (META-R Version 6.03—CIMMYT) [37].

2.4.2. Molecular Analyses

The SSR data were scored as present (1), absent (0), or missing (9), with each band corresponding to a locus. To illustrate the genetic relationships among barley genotypes, a dendrogram was constructed using the unweighted pair group method with arithmetic average (UPGMA) in NTSYS-pc version 2.2 software [37]. The population structure was analyzed based on the SSR data. The optimal number of subpopulations was determined using STRUCTURE V2.3.4 software [38], which employs an admixture model-based clustering method. The analysis included a burn-in period of 50,000 iterations followed by 50,000 MCMC replications. The number of subpopulations (K) was tested for values ranging from 1 to 10, with three iterations for each value, as outlined in previous studies [39,40]. To identify the optimal number of subpopulations, STRUCTURE Harvester version 0.6.94 was utilized [41].

3. Results

3.1. Agro-Morphological Diversity and Characterization

In the current study, 11 morphological traits data were collected and used to investigate the genetic diversity among 32 barley genotypes. Variance analysis revealed highly significant differences between barley genotypes for all studied traits (Table S2). Their corresponding mean values measured for all barley genotypes (supplemental Tables S3 and S4) showed a wide significant variation for all traits.
In fact, our data demonstrated that the early genotypes were KSU-BR-G/G-3, Saudi landraces: Jazan-1 and Jazan-2 (64, 67, 62, and 62 days after planting, respectively), while Assala-04 and Rihane-03 were the late-flowering genotypes (78.67 and 78.67 days after planting, respectively) (Tables S3 and S4). The shortest new inbred line, KSU-BR-G/G-3, measured 65.5 cm in height, while the tallest was Rihana/Lignee. Giza124 from Egypt and Wl2291 from Australia had the longest grain-filling periods across both seasons. Giza124 also recorded the highest number of grains per spike at 52.80 g, whereas Jazan-1 had the lowest at 11.40 g. Barley genotypes showed significant variations in biological and grain yields, which are detailed in supplemental Tables S3 and S4. In the first season, the ICARDA check genotype (Rihana/Lignee) demonstrated superiority over other genotypes (21,851.85 and 6817.78 kg ha-1 for biological and grain yields, respectively) (Tables S3 and S4).
In the second season, the improved line KSU-BR-G121/L-4 and the Egyptian check genotype Giza126-1 both exhibited the highest grain yield and harvest index (Table S3). In the first season, the improved line KSU-BR-C/G-2 showed the highest grain yield and harvest index.
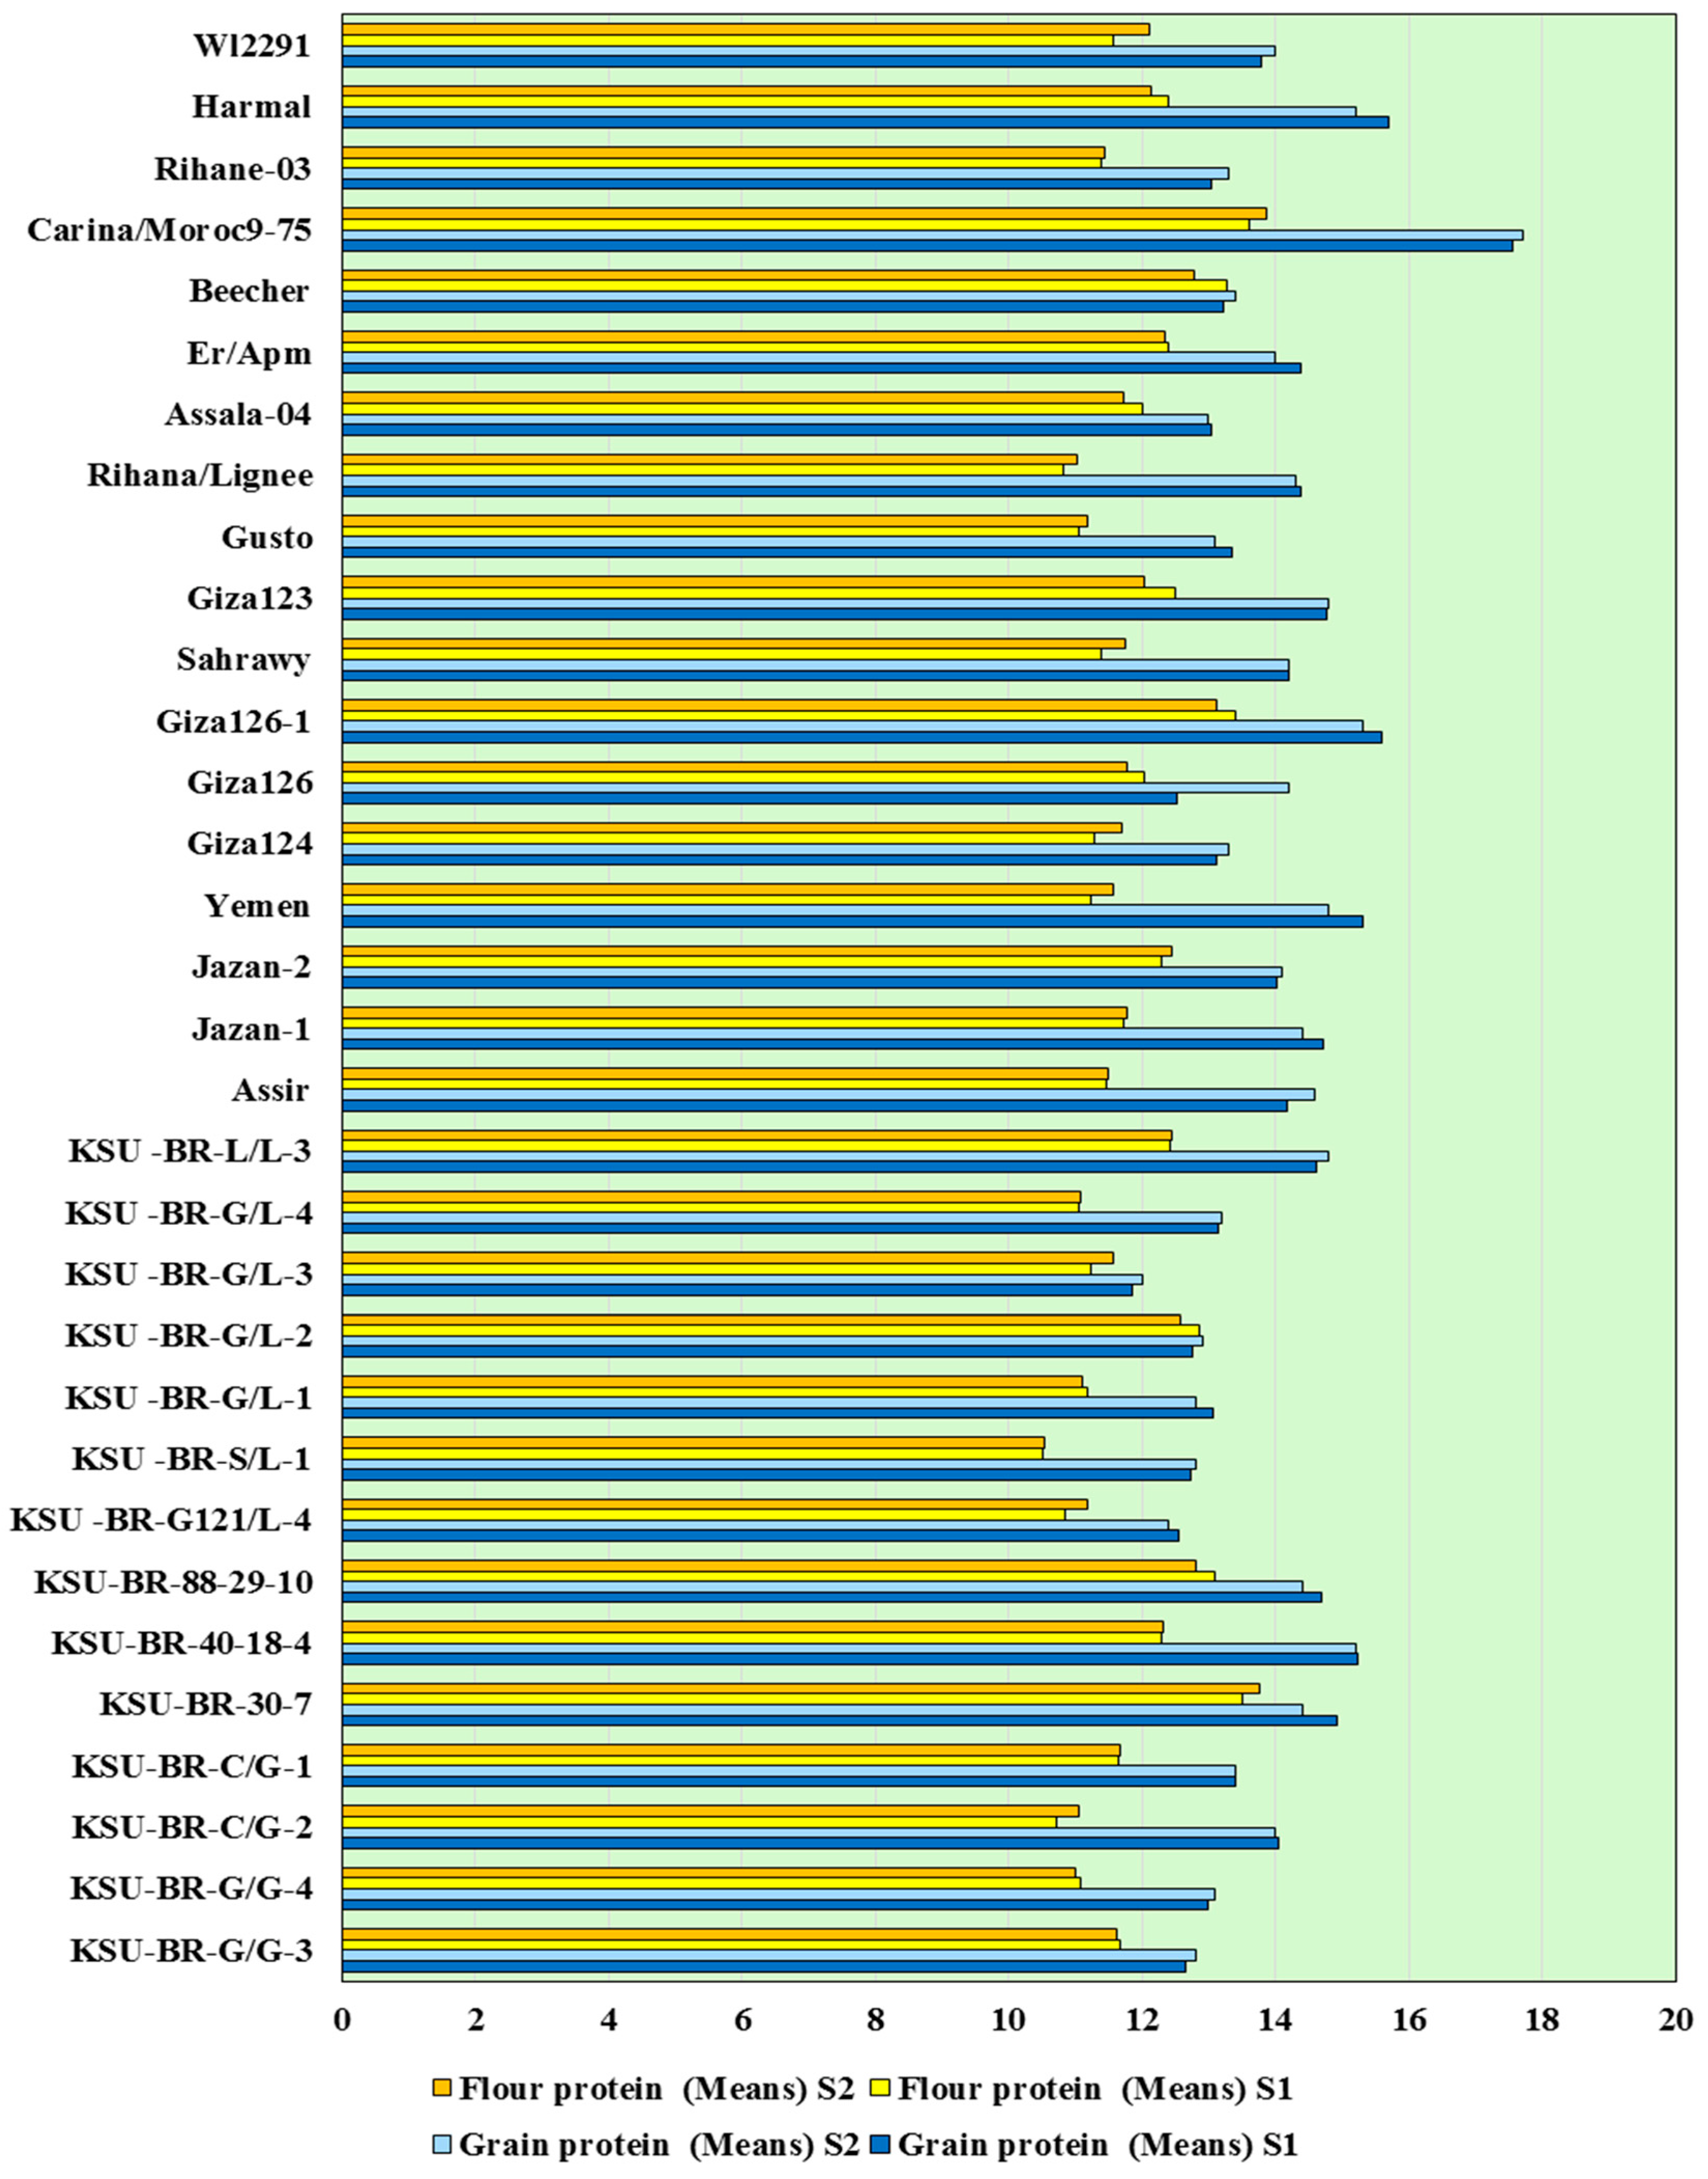
Rihana/Lignee followed by the KSU-BR-C/G-2 genotype with grain yield averaged 6734.07 (kg ha−1) in the first season. KSU-BR-88-29-10 yielded 20,000 kg ha−1 for biomass yield. In the second year, KSU-BR-30-7 was the highest in biomass yield, with 27,037.04 kg ha−1. The biological yield, including the biomass production, is an important trait for bioenergy dual purposes for the bioeconomy that considers barley as one of the bioenergy crops. As a result, these genotypes are promising parents for bioenergy applications. Significant variability was observed in chlorophyll content (Tables S2 and S3). The Gusto genotype had the highest chlorophyll content in both seasons. Additionally, the inbred Saudi line (KSU-BR-G/G-2) exhibited higher chlorophyll content compared to the studied improved lines. Among the barley genotypes studied, the inbred Saudi line (KSU-BR-40-18-4) had the longest spike. In general, the data revealed variation for agro-morphological traits in both seasons, indicating the environmental influences on these traits. Figure 2 shows the variation in grain and flour protein among the studied barley lines. The inbred Saudi line (KSU-BR-40-18-4) had the highest grain protein content, with 15.24%, compared to the six-rowed barley types. Among the two-rowed types, the ICARDA genotype (Carina/Moroc9-75) revealed the highest grain and flour protein content, with 17.63% and 13.74%, respectively. During the 2021 and 2023 seasons, the inbred line KSU-BR-30-7 showed the highest flour content at 13.51% and 13.76%, respectively, compared to the six-rowed inbreeds and checks.

3.2. Correlation between Phenotypic Traits

The correlation coefficients (r) among the studied traits were highly significant (p < 0.001), with values ranging from 0.06 to 0.64 (Table 2). The strongest positive correlations were observed between heading date (HD) and flag leaf duration (FLD) (r = 0.64), FLD and grain-filling duration (GFD) (r = 0.62), and biomass yield (BY) and grain yield (GY) (r = 0.51). Notably, a high biomass yield is indicative of a high grain yield (see Table 2). Significant positive correlations were also found between SPAD readings and HD, FLD, and grain number (GN). Conversely, there was a significant negative correlation between GN and the weight of 1000 grains (TKW), with a coefficient of −0.45. This suggests that the number of grains per spike is inversely related to TKW. Specifically, two-rowed types tend to have fewer grains per spike compared to six-rowed types but produce grains with greater weight and size, thereby affecting the TKW.

3.3. Clustering Based on Phenotypic Traits

Principal component analysis (PCA) (Figure 3) showed that the genetic background of the barley genotypes had a significant impact on the 13 traits. PCA had two components, with PC1 accounting for 37.6% and PC2 accounting for 18.6% of the total variance. The PCA biplot indicated that the most distinguishing traits among the studied barley genotypes were grain yield, heading date, grain number, flag leaf length, and grain-filling duration.
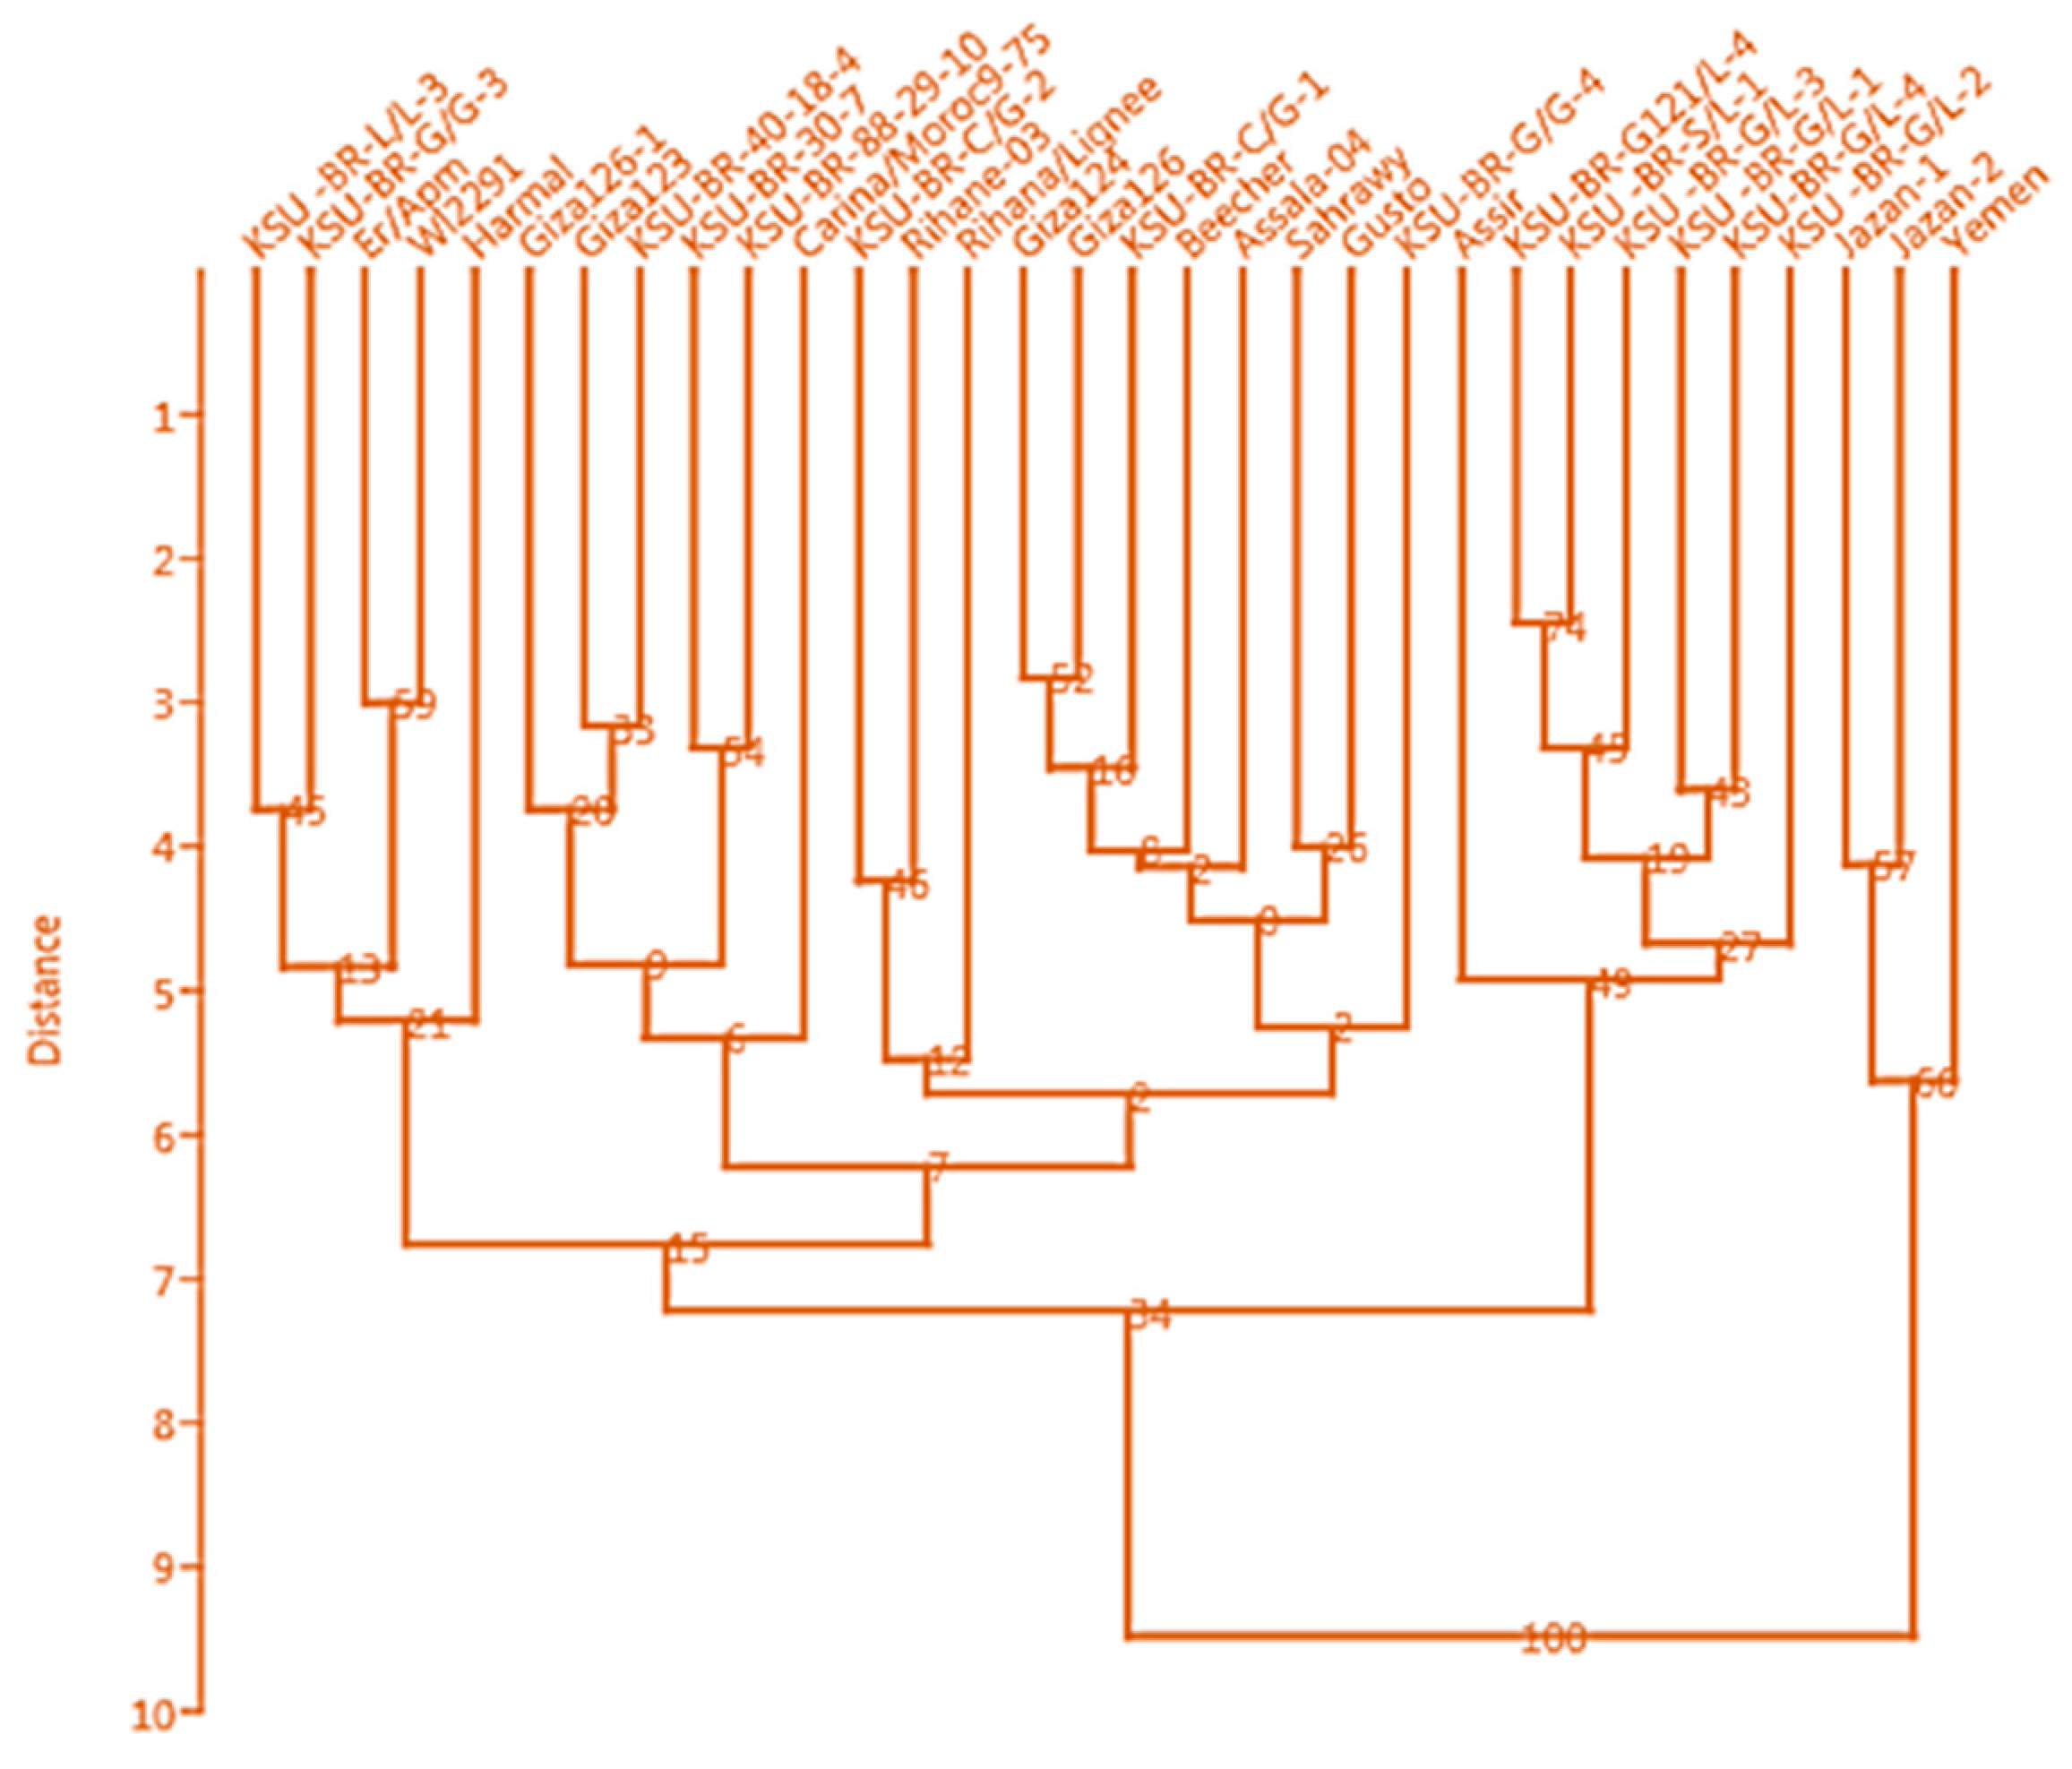
Using the agglomerative hierarchical clustering (AHC) method, the barley genotypes were grouped into four clusters (Figure 4). The first and second cluster comprised three and seven genotypes, respectively, and included Yemen landraces (Jazan-1, Jazan-2), Saudi inbred lines (KSU-BR-G/L-2, KSU-BR-G/L-4, KSU-BR-G/L-1, KSU-BR-G/L-3, KSU-BR-S/L-1, and KSU-BR-G121/L-4), and the landrace genotype Assir. The third cluster included 17 genotypes. The fourth cluster contained five genotypes. Within a given cluster, genotypes are aggregated into small groups based on their grain yield, agronomic performance, and morphological traits.

3.4. Heat Map Analysis of the Whole Data

A heat map was constructed to visually assess the effects of experimental factors on the 32 barley genotypes based on the results of a comprehensive analysis of the 13 agro-morphological and quality traits (Figure 5). The analysis yielded four primary clusters of genotypes based on their trait associations, as illustrated in the heat map and dendrogram (Figure 5). Group I contains four genotypes with average-to-high SL, GP, and FP (three inbred lines and one ICARDA Selection). Further, Group II contains nine genotypes with average-to-high biological yields (BY) and 1000 kernel weight (TKW) (five landraces and four cultivars) and Group III contains seven (improved inbreed lines) genotypes with average-to-high grain protein and flour protein. Finally, Group IV contains 12 genotypes with average-to-high plant height (PH) and low-biological yield (four improved inbreed lines, four ICARDA genotypes, three Australian genotypes, and one American genotype.

3.5. Molecular Characterization Using SSR Markers

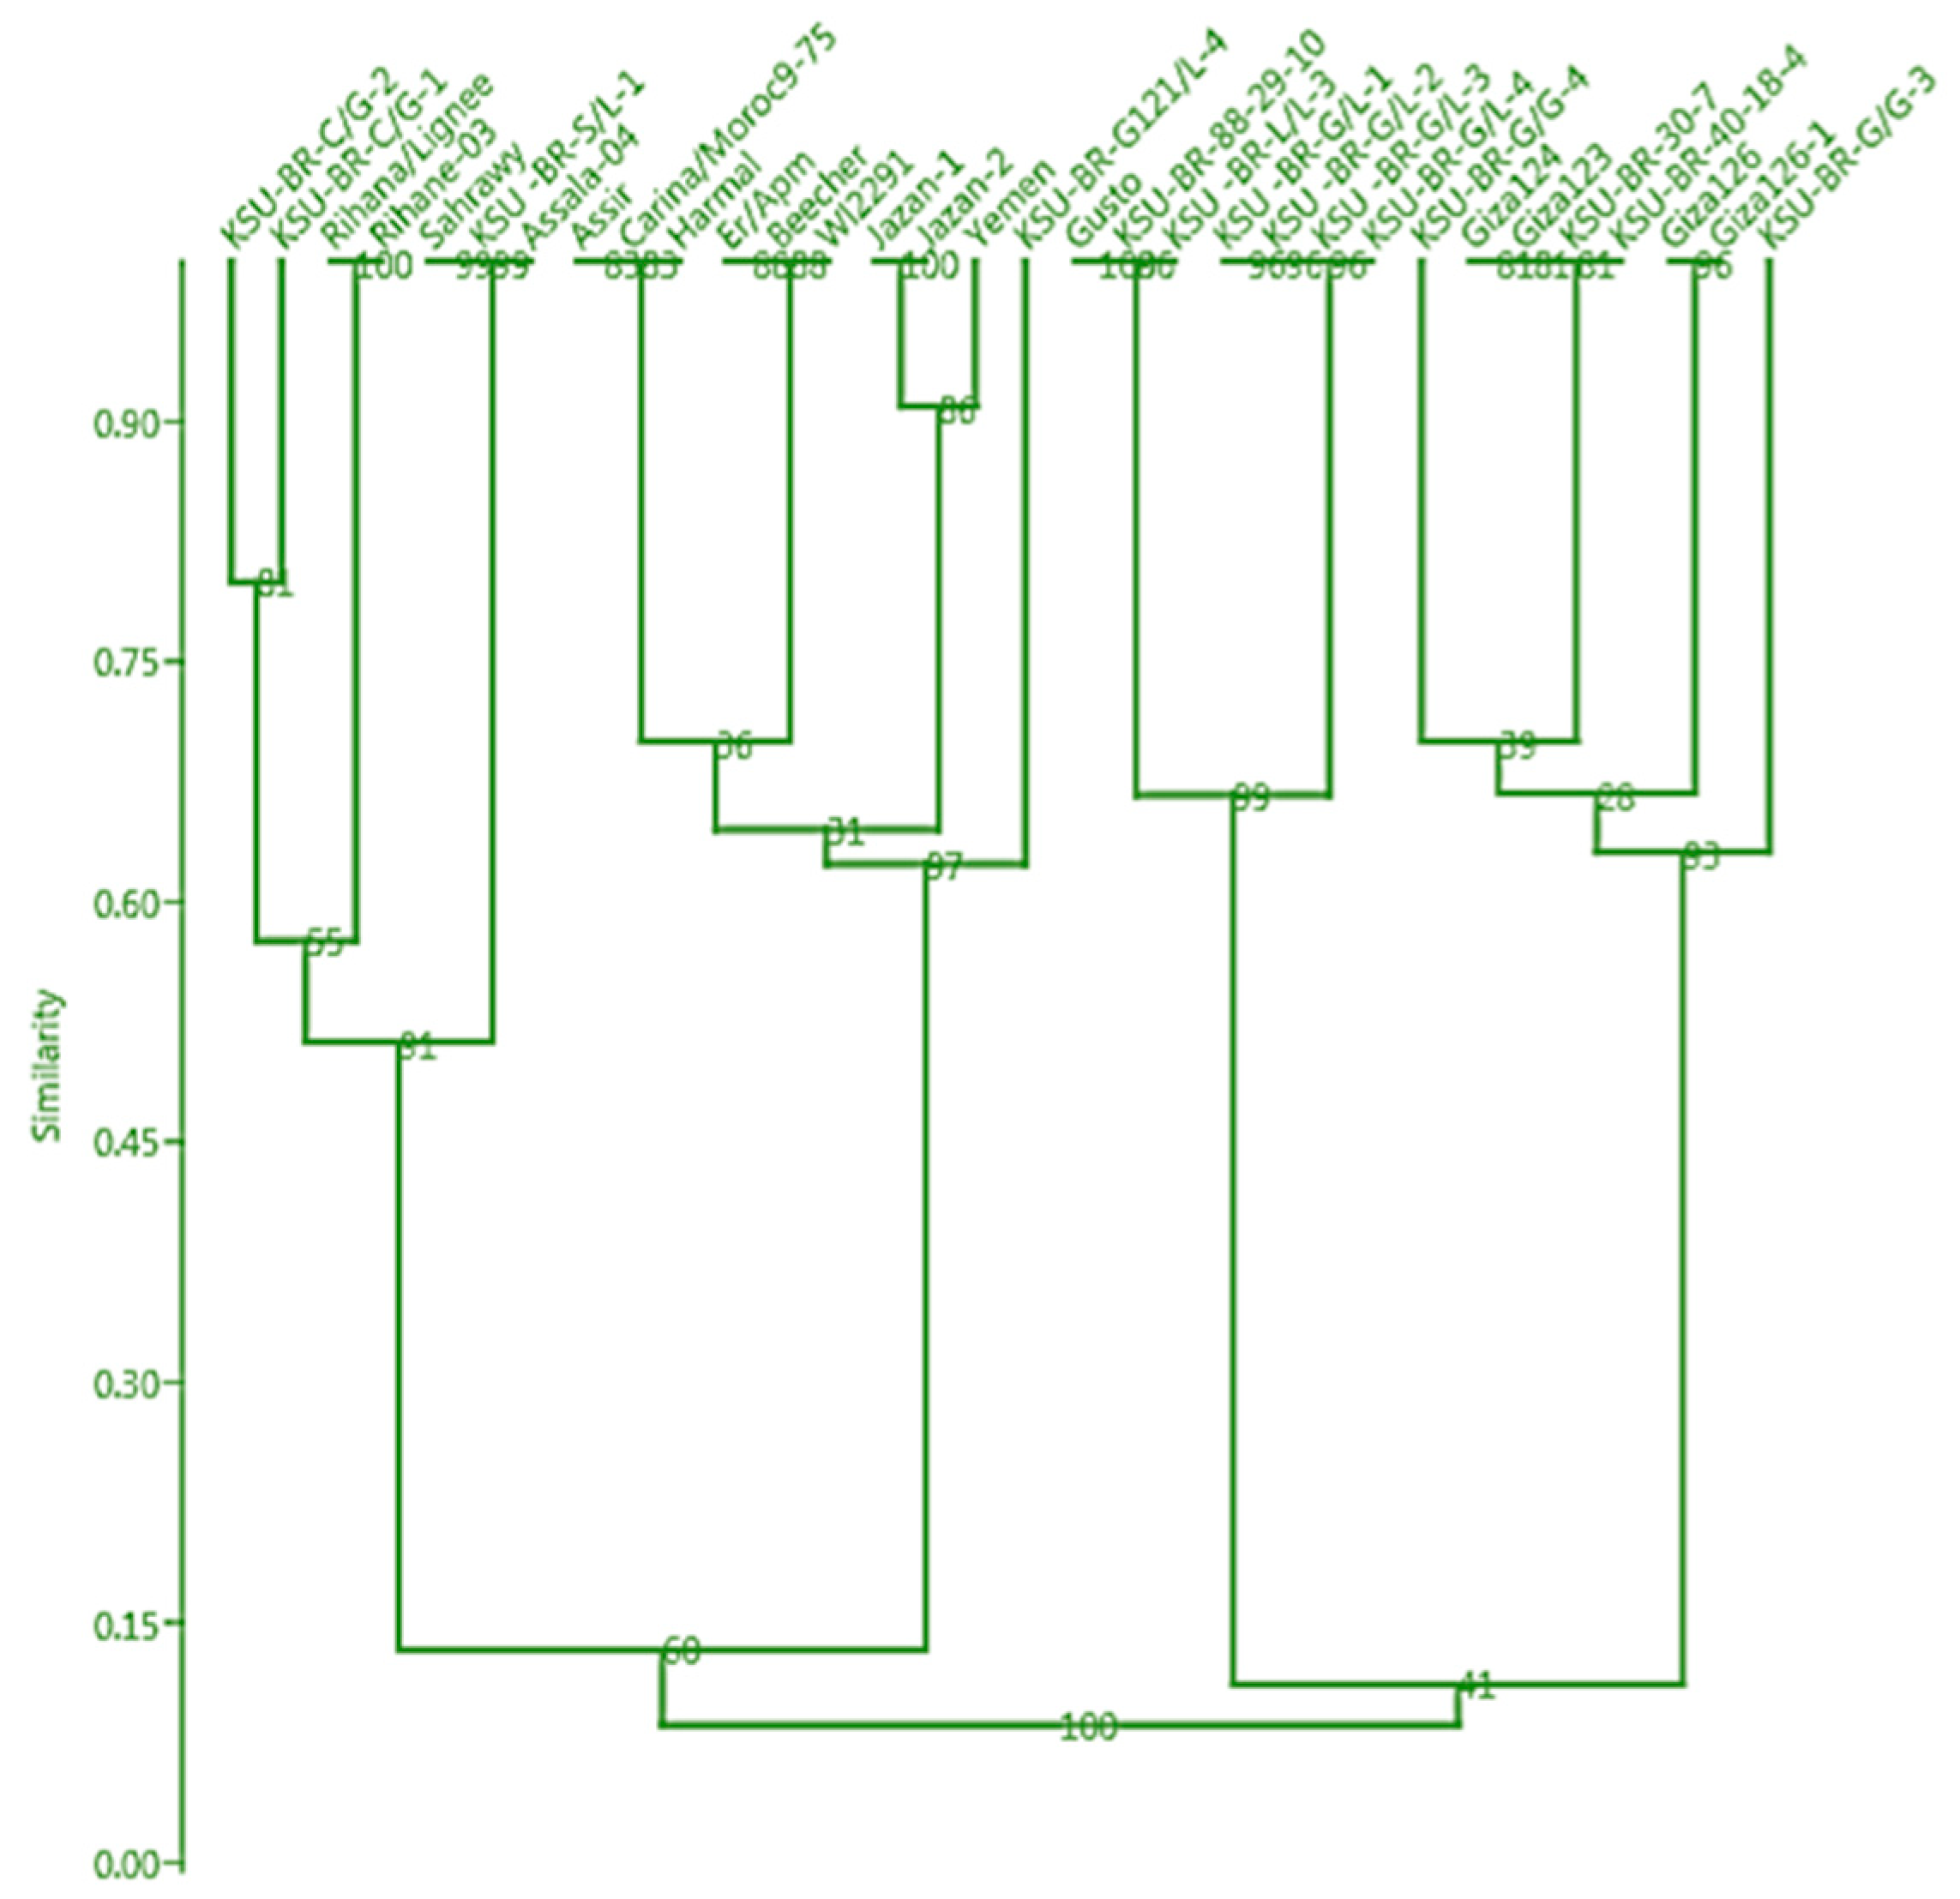
A fundamental objective in the field of genetics is to characterize and understand the genetic diversity and population structure of a species. This knowledge is essential for the development of effective conservation strategies and genetic improvement programs. The current study analyzed 32 individual barley genotypes using 29 SSR primers (Table S1) that exhibited polymorphic amplification during the screening process, yielding a total of 478 alleles. Using the UPGMA program (Figure 6), the genotypes were classified into four main groups based on their similarity coefficients, ranging from 0.30 to 0.85. The first group consisted of nine genotypes that were clustered into three subgroups. Notably, genotype KSU-BR-G/G-3 appeared to be separated within the first subgroup. The second group consisted of seven genotypes, which were further divided into two subgroups. Four improved Saudi inbred lines were part of this group. Four Saudi inbred lines (KSU-BR-G/G-1, KSU-BR-G/G-2, KSU-BR-G/G-3, and KSU-BR-G/G-4) were clustered in the first subgroup and three Saudi inbred lines were clustered in the second subgroup (KSU-BR-L/L-3, KSU-BR-88-29-10, and Gusto). The third group was the largest, with ten genotypes divided into four subgroups. The first subgroup included the inbred line (KSU-BR-G121/L-4). Three two-rowed landraces (Jazan-1, Jazan-2, and Yamen) appeared to be separated within the second subgroup. Subgroup three contained two ICARDA genotypes (Er/Apm, Bacheer) and W12292 (South Australia). The fourth subgroup included the two-rowed barley genotypes (Harmal, Carina/Moroc9-75, and Assir). The fourth group consisted of nine genotypes, which were divided into three subgroups. The first subgroup included KSU-BR-S/L-1 (inbred lines), Assala-40 (ICARDA landraces), and the Egyptian cultivar (Sahrawy). The second subgroup contained Rihana/Lignee and Rihane-03 (ICARDA landraces). The third subgroup included Saudi inbred lines KSU-BR-C/G-2 and KSU-BR-C/G-1.

3.6. Population Structure Analysis

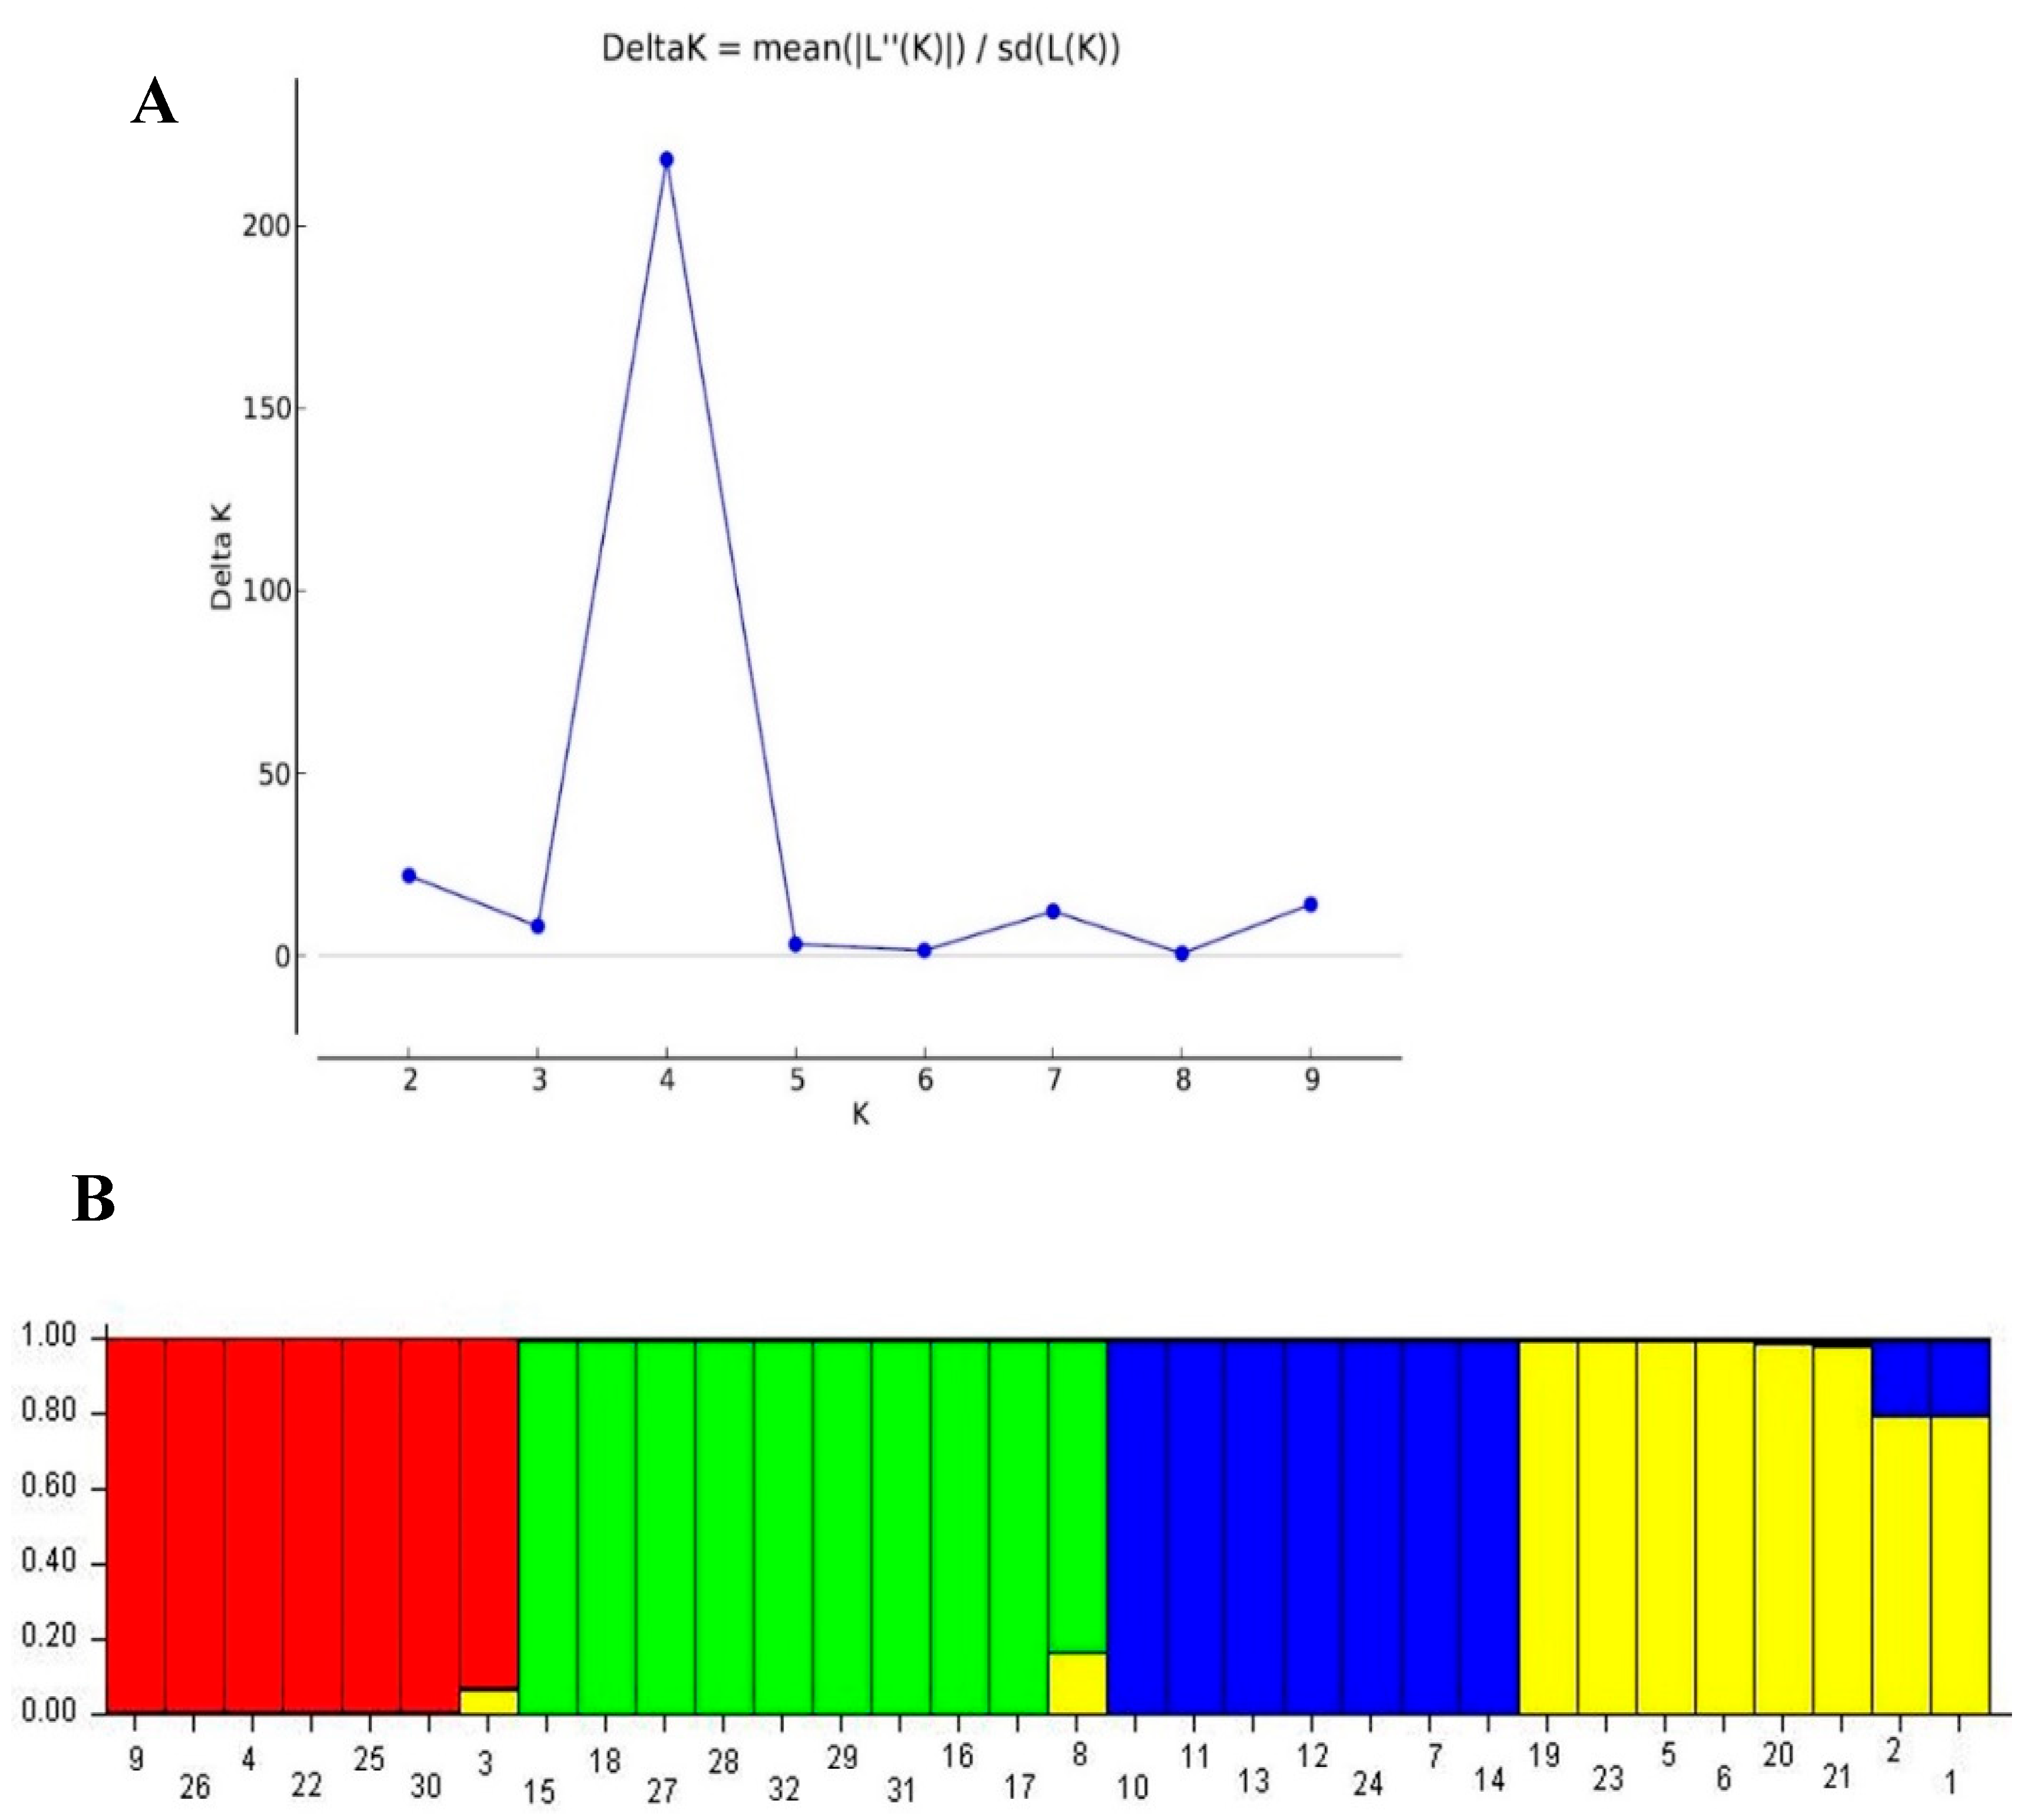
Figure 7 summarizes the analysis of the population structure of the 32 barley genotypes using SSR markers. The analysis revealed that the peak of delta K was observed at K = 4, suggesting the presence of four main subpopulations (Figure 7A). Subpopulation one included seven genotypes, the second subpopulation included ten genotypes, the third subpopulation included seven genotypes, and the fourth subpopulation included eight genotypes (Figure 7B).

4. Discussion

Identifying genetically diverse genotypes with desirable traits is crucial in plant breeding [42,43,44,45]. Traditionally, morphological characteristics have been used to estimate genetic diversity and relationships among barley genotypes. However, it is important to note that these characteristics can be heavily influenced by environmental factors. To estimate genetic diversity and relationships among barley genotypes, it is recommended to use combined molecular and conventional approaches [46]. The estimation of population structure and genetic diversity is significantly influenced by two key factors: population size and the choice of molecular marker. SSR (simple sequence repeat) markers are particularly valuable for determining relationships and assessing genetic diversity due to their polymorphic nature, high reproducibility, and co-dominant inheritance, high reproducibility, co-dominant inheritance, and they are abundant in plant genomes [47,48]. The objective of the present study was to characterize the genetic and phenotypic diversities of novel inbred barley lines and varieties cultivated under semi-arid conditions, employing a combination of morphological and molecular markers. Moreover, a correlation was established between genetic similarities based on molecular markers and agronomic traits of improved Saudi germplasm. The studied barley genotypes demonstrated significant genetic variability, with a wide range of genetic and phenotypic differences. This study showed that there is significant morphological diversity among barley landraces, which affects the variation in various traits. The research suggests that quantitative characters can detect this variation. Several reports have estimated the phenotypic diversity in barley genotypes [49,50]. The 32 barley genotypes included in this study were subjected to an evaluation process encompassing a range of characteristics, including morphological traits, grain yield, yield components, and physiological traits. These evaluations facilitate the enhancement of genetic variability and the efficiency of selection in barley breeding programs [51]. Based on our data, different genotypes of barley characterized by their flowering times in Saudi Arabia are discussed. Here is a breakdown of the data mentioned, where early-flowering genotypes are KSU-BR-G/G-3 (64 days), Saudi landrace Jazan-1 (67 days), and Saudi landrace Jazan-2 (62 days), while late-flowering genotypes are Assala-04 (78.67 days) and Rihane-03 (78.67 days). This data is crucial for agricultural planning and management, especially in arid and semi-arid regions like Saudi Arabia, where the timing of flowering can significantly impact crop yield and quality due to the harsh climatic conditions. Early-flowering genotypes might be favored in regions where there is a shorter growing season or to avoid high temperatures and drought stress during the hottest part of the year. Conversely, late-flowering genotypes might be advantageous in areas with a longer growing season or where cooler temperatures prevail later into the year. Understanding the flowering times of different genotypes helps in selecting the most appropriate varieties for local conditions, optimizing crop production, and ensuring food security in challenging environments (Tables S2 and S3). Based on the data obtained, here is a summary of the characteristics and performances of various barley genotypes, including the height trait, where the shortest newly developed inbred line, designated KSU-BR-G/G-3, exhibited a height of 65.5 cm. The Rihana/Lignee genotype exhibited the greatest height, reaching 105.07 cm. With regard to the flag leaf area trait, the Egyptian barley (check genotype) and Sahrawy (check genotype) exhibited the largest flag leaf area at 121 cm², while the Saudi landraces (Jazan-1 and Jazan-2) had the smallest flag leaf area. Giza124 recorded the highest number of grains per spike at 52.80 g; on the other hand, Jazan-1 had the lowest number of grains per spike at 11.40 g. Barley genotypes showed significant variations in both biological and grain yields, which are detailed in supplemental Tables S2 and S3. The genotypes exhibited a variation of yields in the first season; the ICARDA check genotype Rihana/Lignee demonstrated a superiority in biological yield (BY) (21,851.85 kg/ha) and grain yield (GY) (6817.78 kg/ha). This detailed information highlights the diverse characteristics and performances of different barley genotypes under the specific conditions of this study. It underscores the importance of selecting appropriate genotypes based on traits such as height, leaf area, grain-filling period, number of grains per spike, and overall yield potential to optimize barley production in varying environmental conditions. The findings of this study indicate that barley genotypes, including landraces, improved lines, and check cultivars exhibit a broad diversity, offering valuable insights into the distribution of grain protein content and other related traits. The results mentioned that Saudi improved inbred lines have demonstrated positive and beneficial outcomes when grown under the specific conditions found in Saudi Arabia. The inbred lines have shown an ability to adapt well to the local environmental conditions of Saudi Arabia, which typically include high temperatures, low precipitation, and sandy soil. These inbred lines likely exhibit good agronomic performance, such as high yield potential, and efficient use of water and nutrients available in the region.
It is notable that a significant positive correlation was observed between grain yield and biological yield, suggesting that increased grain filling during photosynthesis results in enhanced grain yield [47]. However, the correlation between grain number (GN) and grain yield was non-significant in this study, which is likely due to the combined analysis of two-rowed and six-rowed barley genotypes.
In the current study, clustering based on the studied agronomic traits did not reveal any distinct regional patterns. Genotypes from the same or adjacent regions appeared in different clusters. However, Jazan 1, Jazan 2, and Yemen were included in the same cluster, and Giza124 and Giza126 (Egyptian genotypes) were included in one cluster. The improved breeding lines, namely, KSU-BR-G/L-2, KSU-BR-G/L-4, KSU-BR-G/L-1, KSU-BR-G/L-3, KSU-BR-S/L-1, and KSU-BR-G121/L-4, were grouped together. In addition, heat map analysis revealed that the 32 barley genotypes were clustered into four main groups based on agronomic and quality traits. The information relating to agro-morphological and quality evaluations are important factors to understand the relationship among germplasm, such as breeding material to help breeders select parental material for the next breeding cycle [9,52]. The heat map cluster analysis has been used successfully in understanding the information and classification of the barley genotypes [9,52].
This study aims to leverage advancements in barley breeding by conducting a thorough analysis of genetic and phenotypic diversity among newly developed Saudi barley genotypes and related check genotypes. Here is an assessment of the objectives and potential outcomes of such a study. Assessing genetic variability is crucial as it provides insights into the diversity of traits among barley genotypes. This information is foundational for breeding programs aiming to develop cultivars with improved traits such as yield, drought tolerance, disease resistance, and quality [18,19]. Evaluating agro-morphological traits (such as height, yield components, and disease resistance) alongside genetic analyses helps in understanding how genetic variations manifest in observable traits. This integrated approach aids in identifying promising genotypes that exhibit desirable phenotypic characteristics under Saudi Arabian agricultural conditions. Molecular markers are essential tools for studying genetic diversity at the DNA level. Techniques such as SSRs (Simple Sequence Repeats) markers can reveal genetic relationships, population structure, and linkage disequilibrium among the studied genotypes. These markers also facilitate marker-assisted selection (MAS) in breeding programs, where specific DNA markers linked to desired traits can be used to accelerate the breeding process. By elucidating the genetic basis of key traits through both phenotypic and molecular analyses, this study aims to contribute to the development of superior barley cultivars tailored to Saudi agricultural systems. These cultivars can potentially enhance productivity, resilience to environmental stresses, and overall crop quality. Understanding genetic diversity also supports the conservation of barley genetic resources. It ensures that diverse genetic materials are preserved and utilized in breeding programs, thereby safeguarding against genetic erosion and enhancing long-term agricultural sustainability [18,19,20,31,53,54]. The genetic information can also be used to select genotypes with desirable traits for breeding programs [55]. The current studies showed that SSR markers can be used to estimate the genetic diversity of Saudi barley genotypes. The gained information could be valuable in a marker-assisted selection procedure to improve barley productivity under Saudi agricultural conditions [48]. The current study reports, for the first time, the variability of Saudi barley genotypes based on SSR markers. Based on genetic distances and similarity coefficients among the 32 barley genotypes, the Saudi genotypes showed they have wide diversity bases. The SSR markers can reveal a considerable level of genetic diversity, which has been found to be useful for barley germplasm and its more efficient use in barley selection [56]. This study revealed significant genetic diversity, as measured by allelic richness and polymorphic information content (PIC). Muller et al. [57] classified markers into highly and moderately informative based on their PIC values. They found that 47% of the markers used in their study were moderately (0.44–0.7) and highly informative (above 0.7), with Bmag0007 (0.80) and Bmag0211 (0.72) the most informative SSR markers. Malysheva-Otto et al. [58,59] reported that the Bmac0040 marker was found to be the most diverse marker in their study.

5. Conclusions

The current study examined the genetic diversity and population structure of a set of barley genotypes using microsatellite markers. Population structure analysis revealed four subpopulations. It was also observed that the structure analysis revealed, to some extent, a classification pattern of most of the barley genotypes according to their genetic and geographical backgrounds and productivity. For example, a subpopulation included KSU-BR-C/G-2, KSU-BR-C/G-, and KSU-BR-S/L-1 (breeding genotypes derived from KSU-BR-C/G-2, KSU-BR-C/G-1, and Sahrawy/Local-SL 1, respectively), Sahraw (relation genetic) and Rihana/Lignee, and Assala-04 and Rihane-03 (ICARDA) (geographical region). This can probably be attributed to the rapid seed dissemination by gene flow and seed exchanges between farmers or migration by human intervention to different regions from a cultivation point of view [60]. Additionally, the polymorphic loci amplified by SSR markers may not be linked to the scored agro-morphological traits, leading to a different basis of classification [61]. Using a higher number of SSR markers may help reduce the observed disparity and increase similarity. Overall, the newly developed Saudi barley lines demonstrated superior performance compared to both landraces and check cultivars across several of the traits examined. The improved line KSU-BR-C/G-2 had the highest grain yield and harvest index in the first season. Rihana/Lignee, followed by the KSU-BR-C/G-2 genotype, had an average grain yield of 6734.07 (kg ha−1) in the first season. KSU-BR-88-29-10 yielded 20,000 kg ha−1 for biomass yield. In the second year, KSU-BR-30-7 was the highest in biomass yield, with 27,037.04 kg ha−1. Therefore, these lines are promising candidates to be used for multi-purposes, feed, food, and bioenergy. Utilizing phenotypic data and molecular markers could enable adopting precise and effective strategies to conserve genetic resources and enhance barley breeding programs. The positive findings regarding the Saudi improved inbred lines underline their importance in enhancing agricultural productivity and resilience in Saudi Arabia, aligning with local environmental conditions and agricultural needs. The integration of genetic and phenotypic analyses in this study aims to advance barley breeding efforts in Saudi Arabia. By elucidating genetic variability and understanding its phenotypic expression, this study seeks to pave the way for the development of improved barley cultivars that meet the specific challenges and opportunities of Saudi agricultural systems.

Supplementary Materials

The following supporting information can be downloaded at https://www.mdpi.com/article/10.3390/agronomy14081716/s1: Table S1: List of SSR primers used for molecular screening with repeat motifs; Table S2: Analyses of variances (ANOVA) of eleven morphological and physiological traits of 32 barley genotypes(V) growing under Saudi agricultural conditions for two years (Y) (2018 and 2019); Table S3: Characteristics of thirty-two studied barely genotypes growing under Saudi agricultural conditions for eleven morphological and physiological traits during 2018 (first year of the study);Table S4: Characteristics of thirty-two studied barely genotypes growing under Saudi agricultural conditions for eleven morphological and physiological traits during 2019 (second year of the study).

Author Contributions

Conceptualization, A.I.G.; data curation, M.A.A., E.I.I., M.S., I.A.-A. and T.K.A.A.; experiments, M.A.A., E.I.I., M.S., I.A.-A. and T.K.A.A.; methodology, M.A.A., E.I.I., M.S., I.A.-A. and T.K.A.A.; project administration, A.A.A.-D.; supervision, A.A.A.-D.; validation, A.I.G. and M.I.M.; visualization, A.I.G.; writing—original draft preparation, A.I.G. and M.I.M.; writing—review and editing, H.A.-H. and A.A.A.-D. All authors have read and agreed to the published version of the manuscript.

Funding

This research was funded by project number RSPD2024-R954, King Saud University, Riyadh, Saudi Arabia.

Data Availability Statement

The raw data supporting the conclusions of this article will be made available by the authors on request.

Acknowledgments

The authors extend their appreciation to the Researchers Supporting Project number RSPD2024R954, King Saud University, Riyadh, Saudi Arabia.

Conflicts of Interest

The authors declare no conflicts of interest.

References

  1. Purugganan, M.D.; Fuller, D.Q. The nature of selection during plant domestication. Nature 2009, 457, 843–848. [Google Scholar] [CrossRef]
  2. Faostat, F. Food and Agriculture Organization of the United Nations-Statistic Division. 2019. Available online: https://www.fao.org/faostat/en/#data (accessed on 1 August 2024).
  3. Bhandari, H.; Bhanu, A.N.; Srivastava, K.; Singh, M.; Shreya, H.A. Assessment of genetic diversity in crop plants-an overview. Adv. Plants Agric. Res. 2017, 7, 279–286. [Google Scholar]
  4. Shakhatreh, Y.; Kafawin, O.; Ceccarelli, S.; Saoub, H.; Science, C. Selection of barley lines for drought tolerance in low-rainfall areas. J. Agron. 2001, 186, 119–127. [Google Scholar] [CrossRef]
  5. Renard, D.; Tilman, D. National food production stabilized by crop diversity. Nature 2019, 571, 257–260. [Google Scholar] [CrossRef] [PubMed]
  6. Sirami, C.; Gross, N.; Baillod, A.B.; Bertrand, C.; Carrié, R.; Hass, A.; Henckel, L.; Miguet, P.; Vuillot, C.; Alignier, A. Increasing crop heterogeneity enhances multitrophic diversity across agricultural regions. Proc. Natl. Acad. Sci. USA 2019, 116, 16442–16447. [Google Scholar] [CrossRef] [PubMed]
  7. Egli, L.; Schröter, M.; Scherber, C.; Tscharntke, T.; Seppelt, R. Crop asynchrony stabilizes food production. Nature 2020, 588, E7–E12. [Google Scholar] [CrossRef]
  8. Alghamdi, S.S.; Alfifi, S.A.; Migdadi, H.M.; Al-Rowaily, S.L.; El-Harty, E.H.; Muhammad Farooq, M.F. Morphological and Genetic Diversity of Cereal Genotypes in Kingdom of Saudi Arabia. Int. J. Agric. Biol. 2017, 19, 601–609. [Google Scholar] [CrossRef]
  9. Mariey, S.; Mohamed, E.N.; Ghareeb, Z.E.; Engy, S.; Abo Zaher, R. Genetic diversity of Egyptian barley using agro–physiological traits, grain quality and molecular markers. Curr. Sci. Int. 2021, 10, 58–71. [Google Scholar]
  10. Hussein, M.H.; Saker, M.; Moghaieb, R.; Hussein, H. Molecular characterization of salt tolerance in the genomes of some Egyptian and Saudi Arabian barely genotypes. Arab J. Biotechnol. 2005, 8, 241–252. [Google Scholar]
  11. El-Shazly, H.H.; El-Mutairi, Z. Genetic Relationships of Some Barley Cultivars, Based on Morphological Criteria and Rapd Fingerprinting. Int. J. Bot. 2006, 2, 252–260. [Google Scholar] [CrossRef]
  12. El-Awady, M.A.H.M.; El-Tarras, A.A.E.-S.; El-Assal, S.E.-D. Genetic diversity of some Saudi barley (Hordeum vulgare L.) landraces based on two types of molecular markers. Am. J. Appl. Sci. 2012, 9, 752. [Google Scholar]
  13. Peng, S.; Khush, G.S.; Virk, P.; Tang, Q.; Zou, Y. Progress in ideotype breeding to increase rice yield potential. Field Crops Res. 2008, 108, 32–38. [Google Scholar] [CrossRef]
  14. Donald, C.T. The breeding of crop ideotypes. Euphytica 1968, 17, 385–403. [Google Scholar] [CrossRef]
  15. Rasmusson, D. A plant breeder’s experience with ideotype breeding. Field Crops Res. 1991, 26, 191–200. [Google Scholar] [CrossRef]
  16. Carbajal-Friedrich, A.A.J.; Burgess, A.J. The role of the ideotype in future agricultural production. Front. Plant Physiol. 2024, 2, 1341617. [Google Scholar] [CrossRef]
  17. Roy, S.J.; Tucker, E.J.; Tester, M. Genetic analysis of abiotic stress tolerance in crops. Curr. Opin. Plant Biol. 2011, 14, 232–239. [Google Scholar] [CrossRef] [PubMed]
  18. Bahieldin, A.; Ramadan, A.; Gadalla, N.; Alzohairy, A.; Edris, S.; Ahmed, I.; Shokry, A.; Hassan, S.; Saleh, O.; Baeshen, M.N. Molecular markers for salt tolerant wild barley Hordeum spontaneum. Life Sci. J. 2012, 9, 5838–5847. [Google Scholar]
  19. Mohammadi, S.A.; Abdollahi Sisi, N.; Sadeghzadeh, B. The influence of breeding history, origin and growth type on population structure of barley as revealed by SSR markers. Sci. Rep. 2020, 10, 19165. [Google Scholar] [CrossRef]
  20. Bouhlal, O.; Visioni, A.; Verma, R.P.S.; Kandil, M.; Gyawali, S.; Capettini, F.; Sanchez-Garcia, M. CGIAR Barley Breeding Toolbox: A diversity panel to facilitate breeding and genomic research in the developing world. Front. Plant Sci. 2022, 13. [Google Scholar] [CrossRef]
  21. Serrote, C.M.L.; Reiniger, L.R.S.; Silva, K.B.; dos Santos Rabaiolli, S.M.; Stefanel, C.M. Determining the polymorphism information content of a molecular marker. Gene 2020, 726, 144175. [Google Scholar] [CrossRef]
  22. Waits, L.P.; Luikart, G.; Taberlet, P. Estimating the probability of identity among genotypes in natural populations: Cautions and guidelines. Mol. Ecol. 2001, 10, 249–256. [Google Scholar] [CrossRef] [PubMed]
  23. Zhivotovsky, L.A.; Feldman, M.W. Microsatellite variability and genetic distances. Proc. Natl. Acad. Sci. USA 1995, 92, 11549–11552. [Google Scholar] [CrossRef] [PubMed]
  24. Nei, M. Analysis of gene diversity in subdivided populations. Proc. Natl. Acad. Sci. USA 1973, 70, 3321–3323. [Google Scholar] [CrossRef] [PubMed]
  25. Rafalski, A. Applications of single nucleotide polymorphisms in crop genetics. Curr. Opin. Plant Biol. 2002, 5, 94–100. [Google Scholar] [CrossRef]
  26. Elakhdar, A.; Abd EL-Sattar, M.; Amer, K.; Rady, A.; Kumamaru, T. Population structure and marker–trait association of salt tolerance in barley (Hordeum vulgare L.). Comptes Rendus Biol. 2016, 339, 454–461. [Google Scholar] [CrossRef]
  27. Elakhdar, A.; Kumamaru, T.; Qualset, C.O.; Brueggeman, R.S.; Amer, K.; Capo-chichi, L.; Evolution, C. Assessment of genetic diversity in Egyptian barley (Hordeum vulgare L.) genotypes using SSR and SNP markers. Genet. Resour. 2018, 65, 1937–1951. [Google Scholar] [CrossRef]
  28. Capo-Chichi, L.J.A.; Eldridge, S.; Elakhdar, A.; Kubo, T.; Brueggeman, R.; Anyia, A.O. QTL Mapping and Phenotypic Variation for Seedling Vigour Traits in Barley (Hordeum vulgare L.). Plants 2021, 10, 1149. [Google Scholar] [CrossRef] [PubMed]
  29. Capo-Chichi, L.J.A.; Elakhdar, A.; Kubo, T.; Nyachiro, J.; Juskiw, P.; Capettini, F.; Slaski, J.J.; Ramirez, G.H.; Beattie, A.D. Genetic diversity and population structure assessment of Western Canadian barley cooperative trials. Front. Plant Sci. 2022, 13, 1006719. [Google Scholar] [CrossRef]
  30. Yirgu, M.; Kebede, M.; Feyissa, T.; Lakew, B.; Woldeyohannes, A.B.; Fikere, M. Single nucleotide polymorphism (SNP) markers for genetic diversity and population structure study in Ethiopian barley (Hordeum vulgare L.) germplasm. BMC Genom. Data 2023, 24, 7. [Google Scholar] [CrossRef]
  31. Maanju, S.; Jasrotia, P.; Yadav, S.S.; Sharma, P.; Kashyap, P.L.; Kumar, S.; Jat, M.K.; Singh, G.P. Genetic diversity and population structure analyses in barley (Hordeum vulgare) against corn-leaf aphid, Rhopalosiphum maidis (Fitch). Front. Plant Sci. 2023, 14, 1188627. [Google Scholar] [CrossRef]
  32. American Association of Cereal Chemists; Approved Methods Committee. Approved Methods of the American Association of Cereal Chemists; American Association of Cereal Chemists: Eagan, MN, USA, 2000. [Google Scholar]
  33. Saghai-Maroof, M.A.; Soliman, K.M.; Jorgensen, R.A.; Allard, R.W. Ribosomal DNA spacer-length polymorphisms in barley: Mendelian inheritance, chromosomal location, and population dynamics. Proc. Natl. Acad. Sci. USA 1984, 81, 8014–8018. [Google Scholar] [CrossRef]
  34. Varshney, R.K.; Marcel, T.C.; Ramsay, L.; Russell, J.; Roder, M.S.; Stein, N.; Waugh, R.; Langridge, P.; Niks, R.E.; Graner, A. A high density barley microsatellite consensus map with 775 SSR loci. Theor. Appl. Genet. 2007, 114, 1091–1103. [Google Scholar] [CrossRef]
  35. StatSoft, I. STATISTICA (data analysis software system), version 6. Tulsa USA 2001, 150, 91–94. [Google Scholar]
  36. Hammer, O. PAST: Paleontological statistics software package for education and data analysis. Palaeontol. Electron. 2001, 4, 9. [Google Scholar]
  37. Rohlf, F.J. NTSYS-pc: Numerical Taxonomy and Multivariate Analysis System; Exeter Publishing: Stony Brook, NY, USA, 1988. [Google Scholar]
  38. Pritchard, J.K.; Stephens, M.; Donnelly, P. Inference of population structure using multilocus genotype data. Genetics 2000, 155, 945–959. [Google Scholar] [CrossRef]
  39. Evanno, G.; Regnaut, S.; Goudet, J. Detecting the number of clusters of individuals using the software STRUCTURE: A simulation study. Mol. Ecol. 2005, 14, 2611–2620. [Google Scholar] [CrossRef]
  40. Pritchard, J.K.; Wen, X.; Falush, D. Documentation for Structure Software: Version 2.3; University of Chicago: Chicago, IL, USA, 2010; pp. 1–37. [Google Scholar]
  41. Earl, D.A.; VonHoldt, B.M. STRUCTURE HARVESTER: A website and program for visualizing STRUCTURE output and implementing the Evanno method. Conserv. Genet. Resour. 2012, 4, 359–361. [Google Scholar] [CrossRef]
  42. Dar, A.A.; Mahajan, R.; Lay, P.; Sharma, S. Genetic diversity and population structure of Cucumis sativus L. by using SSR markers. 3 Biotech 2017, 7, 307. [Google Scholar] [CrossRef] [PubMed]
  43. Vigouroux, Y.; Glaubitz, J.C.; Matsuoka, Y.; Goodman, M.M.; Sanchez, G.J.; Doebley, J. Population structure and genetic diversity of New World maize races assessed by DNA microsatellites. Am. J. Bot. 2008, 95, 1240–1253. [Google Scholar] [CrossRef]
  44. Agrama, H.; Eizenga, G.J.E. Molecular diversity and genome-wide linkage disequilibrium patterns in a worldwide collection of Oryza sativa and its wild relatives. Euphytica 2008, 160, 339–355. [Google Scholar] [CrossRef]
  45. Oliveira, M.; Sousa, L.; Reis, M.; Junior, E.S.; Cardoso, D.; Hamawaki, O.; Nogueira, A.; Research, M. Evaluation of genetic diversity among soybean (Glycine max) genotypes using univariate and multivariate analysis. Genetics 2017, 16. [Google Scholar] [CrossRef]
  46. Raja, W.H.; Yousuf, N.; Qureshi, I.; Sharma, O.C.; Singh, D.B.; Kumawat, K.L.; Nabi, S.U.; Mir, J.I.; Sheikh, M.A.; Kirmani, S.N. Morpho-molecular characterization and genetic diversity analysis across wild apple (Malus baccata) accessions using simple sequence repeat markers. S. Afr. J. Bot. 2022, 145, 378–385. [Google Scholar] [CrossRef]
  47. Keilwagen, J.; Kilian, B.; Özkan, H.; Babben, S.; Perovic, D.; Mayer, K.F.; Walther, A.; Poskar, C.H.; Ordon, F.; Eversole, K.J.S.R. Separating the wheat from the chaff–a strategy to utilize plant genetic resources from ex situ genebanks. Sci. Rep. 2014, 4, 5231. [Google Scholar] [CrossRef] [PubMed]
  48. Basnet, B.R.; Ali, M.B.; Ibrahim, A.M.; Payne, T.; Mosaad, M.G.; Science, C. Evaluation of genetic bases and diversity of Egyptian wheat cultivars released during the last 50 years using coefficient of parentage. Commun. Biometry Crop Sci. 2011, 6, 31–47. [Google Scholar]
  49. Farooqi, M.Q.U.; Moody, D.; Bai, G.; Bernardo, A.; St Amand, P.; Diggle, A.J.; Rengel, Z. Genetic characterization of root architectural traits in barley (Hordeum vulgare L.) using SNP markers. Front Plant Sci 2023, 14, 1265925. [Google Scholar] [CrossRef] [PubMed]
  50. Kebebew, F.; Tsehaye, Y.; McNeilly, T.; evolution, c. Morphological and farmers cognitive diversity of barley (Hordeum vulgare L. [Poaceae]) at Bale and North Shewa of Ethiopia. Genet. Resour. 2001, 48, 467–481. [Google Scholar]
  51. Marzougui, S.; Kharrat, M.; ben Younes, M. Assessment of genetic diversity and population structure of Tunisian barley accessions (Hordeum vulgare L.) using SSR markers. Acta Agrobot. 2020, 73, 1–9. [Google Scholar] [CrossRef]
  52. Mohamed, A.H.; Omar, A.A.; Attya, A.M.; Elashtokhy, M.M.; Zayed, E.M.; Rizk, R.M. Morphological and molecular characterization of some Egyptian six-rowed barley (Hordeum vulgare L.). Plants 2021, 10, 2527. [Google Scholar] [CrossRef] [PubMed]
  53. Güngör, H.; İlhan, E.; Kasapoğlu, A.G.; Filiz, E.; POUR, A.H.; Valchev, D.; Valcheva, D.; Haliloğlu, K.; Dumlupinar, Z. Genetic Diversity and Population Structure of Barley Cultivars Released in Turkey and Bulgaria using iPBS-retrotransposon and SCoT markers. J. Agric. Sci. 2022, 14, 1188627. [Google Scholar] [CrossRef]
  54. Nam, V.T.; Hang, P.L.B.; Linh, N.N.; Ly, L.H.; Hue, H.T.T.; Ha, N.H.; Hanh, H.H. Molecular markers for analysis of plant genetic diversity. Vietnam J. Biotechnol. 2020, 18, 589–608. [Google Scholar] [CrossRef]
  55. Krishnappa, G.; Savadi, S.; Tyagi, B.S.; Singh, S.K.; Mamrutha, H.M.; Kumar, S.; Mishra, C.N.; Khan, H.; Gangadhara, K.; Uday, G.; et al. Integrated genomic selection for rapid improvement of crops. Genomics 2021, 113, 1070–1086. [Google Scholar] [CrossRef] [PubMed]
  56. Brbaklić, L.; Trkulja, D.; Mikić, S.; Mirosavljević, M.; Momčilović, V.; Dudić, B.; Procházková, L.; Aćin, V.J.A. Genetic diversity and population structure of Serbian barley (Hordeum vulgare L.) collection during a 40-year long breeding period. Agronomy 2021, 11, 118. [Google Scholar] [CrossRef]
  57. Muller, R.; Hildebrand, T.; Ruegsegger, P. Non-invasive bone biopsy: A new method to analyse and display the three-dimensional structure of trabecular bone. Phys. Med. Biol. 1994, 39, 145–164. [Google Scholar] [CrossRef] [PubMed]
  58. Malysheva-Otto, L.V.; Ganal, M.W.; Roder, M.S. Analysis of molecular diversity, population structure and linkage disequilibrium in a worldwide survey of cultivated barley germplasm (Hordeum vulgare L.). BMC Genet. 2006, 7, 6. [Google Scholar] [CrossRef] [PubMed]
  59. Malysheva-Otto, L.; Ganal, M.W.; Law, J.R.; Reeves, J.C.; Röder, M.S. Temporal trends of genetic diversity in European barley cultivars (Hordeum vulgare L.). Mol. Breed. 2007, 20, 309–322. [Google Scholar] [CrossRef]
  60. Prasad, M.; Gupta, S.; Parida, S.K.; Kumari, K.; Muthamilarasan, M. Population structure and association mapping of yield contributing agronomic traits in foxtail millet. Plant Cell Rep. 2014, 33, 881–893. [Google Scholar]
  61. Westman, A.; Kresovich, S.L.; Genetics, A. The potential for cross-taxa simple-sequence repeat (SSR) amplification between Arabidopsis thaliana L. and crop brassicas. Theor. Appl. Genet. 1998, 96, 272–281. [Google Scholar] [CrossRef]
Figure 1. Temperature and rainfall data for the experimental site during the two growing seasons.
Agronomy 14 01716 g001
Figure 2. Comparing grain and flour protein contents for the two growing seasons (S1:2018 and S2:2019). The grain and flour protein estimation were based on the protein content of whole grains and straight-grade flour samples, respectively.
Agronomy 14 01716 g002
Figure 3. Two-dimensional ordination of the qualitative and rescaled quantitative data traits in barley genotypes. Component 1 represented 37.6% and component 2 represented 18.6% of the total variance.
Agronomy 14 01716 g003
Figure 4. Agglomerative hierarchical clustering (AHC) of barley genotypes based on their morphological traits using the standardized Euclidean coefficient.
Agronomy 14 01716 g004
Figure 5. Heat map showing the clustering of the 32 barley genotypes based on morphology and quality traits. The band color indicates the differential association among traits.
Agronomy 14 01716 g005
Figure 6. UPGMA dendrogram of 32 barley genotypes based on SSR marker data (Jaccard’s coefficient, 100 replications).
Agronomy 14 01716 g006
Figure 7. Analysis of the population structure using STRUCTURE 2.3.4 software. (A) DK values for each number of subpopulations (K) for 32 barley genotypes. (B) Classification of 32 barley genotypes into four main subpopulations. The color code indicates the distribution of the genotypes to different subpopulations. Numbers on the y-axis show the subgroup membership and the x-axis shows the different genotypes. Genotype numbers are in alignment with Table 1.
Agronomy 14 01716 g007
Table 1. Description of the barley genotypes used in this study.
GenotypePedigreeRow TypeSource
1KSU-BR-G/G-3Giza121/Gusto-SL36KSU Breeding Program
2KSU-BR-G/G-4Giza123/Gusto-SL46KSU Breeding Program
3KSU-BR-C/G-2KSU-BR-C/G-26KSU Breeding Program
4KSU-BR-C/G-1KSU-BR-C/G-16KSU Breeding Program
5KSU-BR-30-7Giza123/Local-SL 30-76KSU Breeding Program
6KSU-BR-40-18-4Giza123/Local-SL 40-18-46KSU Breeding Program
7KSU-BR-88-29-10Gusto/Local-SL 88-29-106KSU Breeding Program
8KSU-BR-G121/L-4Giza121/Local-SL 46KSU Breeding Program
9KSU-BR-S/L-1Sahrawy/Local-SL 16KSU Breeding Program
10KSU-BR-G/L-1Gusto/Local-SL 16KSU Breeding Program
11KSU-BR-G/L-2Gusto/Local-SL 26KSU Breeding Program
12KSU-BR-G/L-3Gusto/Local-SL 36KSU Breeding Program
13KSU-BR-G/L-4Gusto/Local-SL 46KSU Breeding Program
14KSU-BR-L/L-3Lignee/Local-SL 36KSU Breeding Program
15AssirLocal landraces2Saudi Arabia Landrace Assir
16Jazan-1Local landraces2Saudi Arabia Landrace
17Jazan-2Local landraces2Saudi Arabia Landrace
18YemenYemen landraces2Yemen Landrace
19Giza124Giza 117/Bahteem 52// Giza 118/FAO 866Egyptian Cultivar (ARC-EGYPT)
20Giza126BaladiBahteem/SD 729 Pour 12769-BC6Egyptian Cultivar (ARC-EGYPT)
21Giza126-1Giza1266Egyptian Cultivar (ARC-EGYPT)
22SahrawyBaladi 16/Gem6Egyptian Cultivar (ARC-EGYPT)
23Giza123Giza 117/FAO 866Egyptian Cultivar (ARC-EGYPT)
24GustoGusto6American Commercial Cultivar
25Rihana/LigneeRihana/Lignee6ICARDA Selection
26Assala-04Assala-046Old Landrace–ICARDA
27Er/ApmEr/Apm2ICARDA Selection
28BeecherAtlas/Vaughan6Old Landrace–ICARDA
29Carina/Moroc9-75-2ICARDA Selection
30Rihane-03As 46//Avt/Aths6Old Landrace–ICARDA
31HarmalUnion/CI03576//Coho2Old Landrace–ICARDA
32Wl2291CI3576/Union*22Waite Institute in South Australia
Table 2. Correlation coefficients and significancy levels among morphological and physiological traits of barely genotypes.
HDPHFLDGFDSPADSLGNTKWBYGYHIGP
PH0.31 **
FLD0.64 **0.36 **
GFD0.08 **0.18 **0.62 **
SPAD0.56 **0.09 **0.56 **0.16 **
SL0.20 **0.14 **0.27 **0.07 ns0.22 **
GN0.46 **0.28 **0.55 **0.27 **0.53 **0.25 **
TKW−0.35 **0.03 ns−0.40 **−0.17 **−0.46 **−0.08 **−0.45 **
BY0.34 **0.22 **0.37 **0.08 **0.23 **0.23 **0.25 **−0.10 **
GY0.31 **0.23 **0.18 **−0.07 **0.17 **0.12 **0.19 **−0.15 **0.51 **
HI−0.06 ns0.01 ns−0.23 **−0.20 **−0.11 **−0.12 **−0.10 **0.00 ns−0.37 **0.55 **
GP−0.03 **0.18 **0.12 **0.15 **−0.15 **0.32 **−0.20 **0.37 **0.13 **0.01−0.08 **
FP−0.01 ns0.12 **0.17 **0.11 **−0.07 **0.21 **−0.04 ns0.10 **0.28 **0.11 **−0.14 **0.42
** Significant at p < 0.001, ns; non-significant. Heading date (HD), Plant height (PH), Flag leaf death (FLD), Grain-filling duration (GFD), SPAD value (SPAD), Spike length (SL), Grain number (GN), 1000 kernel weight (TKW), Biological yield (BY), Grain yield (GY), Harvest index (HI), Grain protein (GP), and Flour protein (FP).
Disclaimer/Publisher’s Note: The statements, opinions and data contained in all publications are solely those of the individual author(s) and contributor(s) and not of MDPI and/or the editor(s). MDPI and/or the editor(s) disclaim responsibility for any injury to people or property resulting from any ideas, methods, instructions or products referred to in the content.