Abstract
The Anthesis-Silking Interval (ASI) is a crucial indicator of the synchrony of reproductive development in maize, reflecting its sensitivity to adverse environmental conditions such as heat stress and drought. This paper presents an automated method for detecting the maize ASI index using a field high-throughput phenotyping platform. Initially, high temporal-resolution visible-light image sequences of maize plants from the tasseling to silking stage are collected using a field rail-based phenotyping platform. Then, the training results of different sizes of YOLOv8 models on this dataset are compared to select the most suitable base model for the task of detecting maize tassels and ear silks. The chosen model is enhanced by incorporating the SENetv2 and the dual-layer routing attention mechanism BiFormer, named SEBi-YOLOv8. The SEBi-YOLOv8 model, with these combined modules, shows improvements of 2.3% and 8.2% in mAP over the original model, reaching 0.989 and 0.886, respectively. Finally, SEBi-YOLOv8 is used for the dynamic detection of maize tassels and ear silks in maize populations. The experimental results demonstrate the method’s high detection accuracy, with a correlation coefficient (R2) of 0.987 and an RMSE of 0.316. Based on these detection results, the ASI indices of different inbred lines are calculated and compared.
1. Introduction
Maize (Zea mays L.) is one of the most widely cultivated cereal crops globally [1]. ASI stands for the Anthesis-Silking Interval, an important phenotypic indicator in the growth and development of maize and other cereal crops. It refers to the time interval from the onset of anthesis (the opening of the spikelets at the top of the tassel) to the appearance of the first silk (the silk of the ear) in maize. The ASI is a crucial metric for measuring the synchrony of reproductive development in maize. The duration of the ASI typically reflects the crop’s sensitivity to stress conditions such as heat and drought, thereby influencing maize yield and growth status [2,3]. By comparing the ASI indices of different inbred lines, it is possible to identify those with strong stress resistance and good adaptability, providing excellent germplasm resources for breeding new varieties [4,5]. Under normal growing conditions, maize exhibits high synchrony in anthesis and silking, with an ASI index closer to 0 being more favorable for silk fertilization and kernel formation. Under adverse conditions such as drought and high temperatures, the synchrony between anthesis and silking may be disrupted, leading to an increased ASI index. An increase in the ASI index signifies asynchrony between the pollen shedding of the male spike and the silking time of the female spike, leading to a decrease in the fertilization rate of the female spike, thereby affecting the seed setting rate and the yield of corn. On a small plot scale of maize cultivation, the ASI value can be obtained by subtracting the 50% anthesis date (AD) from the 50% silking date (SD) [6].
Traditional ASI index surveys rely on manual visual inspection by experts, which suffers from poor timeliness, low efficiency, and significant errors [7]. In recent years, with the rapid development of information technology and artificial intelligence, field high-throughput phenotyping platforms based on image analysis technology have emerged as tools for crop phenotypic detection. These platforms provide a continuous, non-destructive monitoring of crop growth, greatly improving the efficiency and accuracy of data collection [4]. Equipped with high-resolution cameras, they can automatically collect image data on crops throughout the growing season. Combined with artificial intelligence image-processing algorithms, they can efficiently and accurately detect the growth status of maize tassels and ears, enabling the high-throughput automated detection of ASI indices.
Accurately extracting useful phenotypic information from large amounts of field image data remains a challenge. The application of artificial intelligence technologies, such as deep learning, provides new approaches to address this issue [8,9]. In recent years, image processing technology based on deep learning has been proven to be significantly effective in extracting crop phenotypic traits [10]. Deep learning is also widely applied in maize tassel detection tasks. In a study by Song et al. [11], they developed an advanced model named SEYOLOX-tiny, based on the YOLOX network. This model integrates an attention mechanism specifically designed to enhance the extraction of key features and reduce the noise impact caused by adverse factors in complex natural environments, such as occlusion and overlapping plants. Aimed at overcoming the challenges of maize tassel detection in field environments, this model achieved an mAP50 of 95%. In the research conducted by Wang et al. [12], an improved RetinaNet model was used, which enhanced the detection accuracy for small maize tassels by optimizing the feature pyramid structure within the model. The study demonstrated significant improvements in the detection of maize tassels with the modified RetinaNet model, achieving an average precision (AP) of 0.9717, a precision of 0.9802, and a recall rate of 0.9036. Yu Z et al. [13] introduced an automated method for detecting and counting maize ears called TasselFANet, which balances variability across different layers through a cross-stage fusion strategy and utilizes multiple receptive fields to capture diverse feature expressions. This method also incorporates an innovative visual channel attention module to detect and capture features more flexibly and accurately. Deli Zhu et al. [14] based their approach on the Faster R-CNN network structure, with ResNeXt50 as the feature extraction network. They addressed issues of gradient vanishing and explosion commonly encountered in maize tassel detection by using a cyclic cross attention mechanism module combined with a dilated spatial pyramid module, achieving good results across various evaluation metrics. Recently, Guan et al. [15] introduced an improved deformable convolution and Bi-level routing attention mechanism to the YOLOv8 network, which enables the rapid detection of maize canopy organs, including leaves, ears, and silks. The results show that the detection model achieved an mAP of 89.4%.
For the detection of maize ear silking, researchers have utilized a convolutional neural network object detection system based on YOLOv3 to identify the ear–stalk junction points in videos and extract ear position and timing information from each frame [16]. Studies on ear silking detection using a single viewpoint, especially from a top-down perspective capturing visible light images, are rare. This scarcity is likely due to the high complexity of field conditions, particularly when plants are closely spaced and obscure each other. Unless a specific shooting angle is adopted, images from a single viewpoint may struggle to capture the detailed conditions of each ear silking; additionally, lighting conditions can significantly impact single viewpoint images, potentially causing shadows or reflections that affect the accuracy of silking detection.
The ASI index is one of the metrics used to evaluate maize’s resilience to stress, and it is an important trait considered in breeding and crop management. By breeding inbred lines with lower ASI indices, it is possible to effectively increase crop yield and stability, particularly under adverse growth conditions like drought. To date, there are no existing studies that acquire the maize ASI index based on image detection. This is partly because maize leaves can obstruct the view of the ears, making it challenging to detect them in images. Additionally, acquiring continuous image sequences of maize population growth necessitates a phenotyping platform with high data acquisition capabilities. This paper utilizes a field rail-based phenotyping platform to capture time-series images of maize from the tasseling to the silking stage. An improved model based on YOLOv8 is used to detect maize tassels and ear silks, and continuous monitoring is conducted on maize inbred lines. The ASI indices for these lines are calculated based on the detection results.
2. Materials and Methods
2.1. Data Collection and Processing of the Image Dataset
The plants used in this experiment were planted in 2023 in the experimental fields of the Beijing Academy of Agriculture and Forestry Sciences (39°56′ N, 116°16′ E). On 21 June 2023, 121 maize inbred lines were planted, with each line consisting of two rows, six plants per row, with a row spacing of 60 cm and a plant spacing within the row of 25 cm, forming a small planting plot. Data were collected using a field rail-based phenotyping platform during the period from the tasseling to the silking stage, when maize plant heights were approximately between 2 m and 3 m. To ensure clarity in the image collection for this experiment, the distance between the imaging equipment and the top of the maize canopy was set at 0.9 m. The platform was set to move 50 mm along the x-axis and 80 mm along the y-axis, with an image capture interval of 3 s. Since the shooting was automated, to ensure that usable data was available every day, the platform was set to collect visible light photos of the maize plants from a top view at 8:00 a.m., 2:00 p.m., and 6:00 p.m. daily. This captured the planting scenes under different lighting angles and weather conditions, enriching the dataset. This approach creates a complete sequence of visible light images of maize from the tasseling to the silking stage, with the captured image resolution being 4096 × 3000 pixels. Figure 1 displays the actual operation of the phenotyping platform in the field and examples of the images obtained.
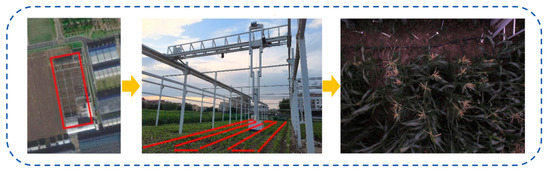
Figure 1.
Location of the experimental test field and the operating trajectory and original visible light images collected by the platform from the corn tasseling stage to the silking stage.
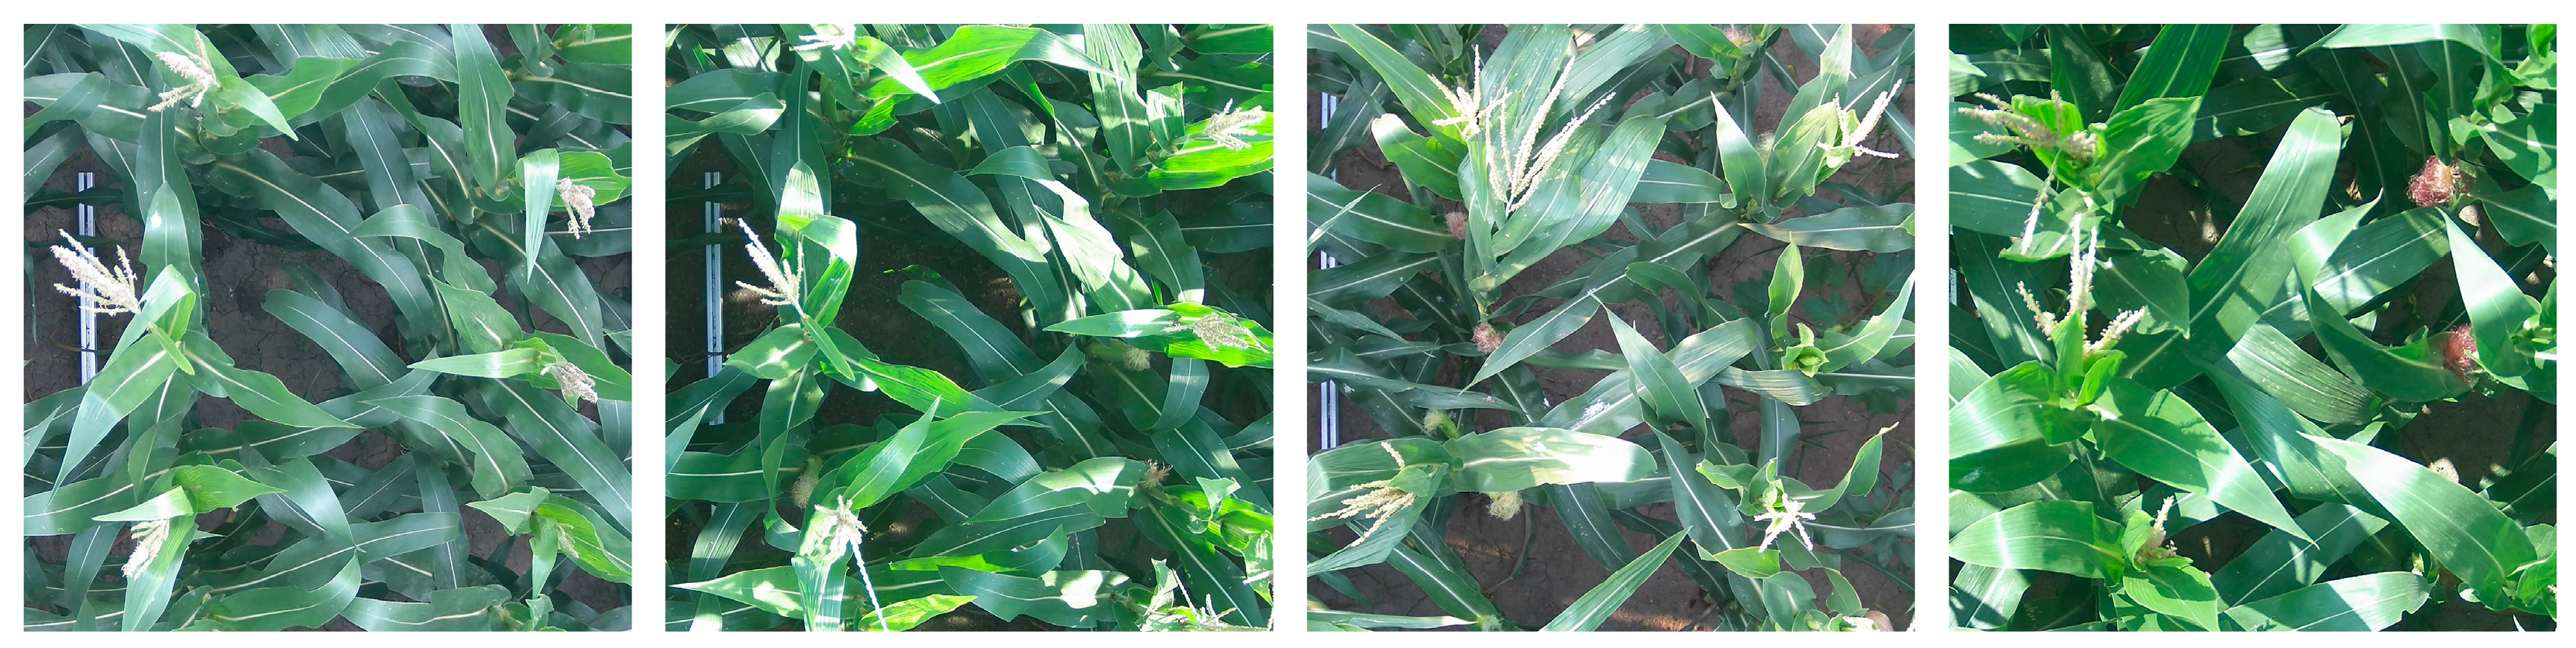
Images collected from the phenotyping platform were selected and differentiated by plot, with center cropping performed to retain only the parts of the designated plots, as shown in Figure 2. The tool LabelImg was used to annotate images, marking the tasseling (tagged as “male”) and the silking parts of the ears (tagged as “female”). A total of 600 images of planting plots were selected, with each image containing six plants. Each plant contained either zero or one tassels and zero to two ears, resulting in a total of 3435 maize tassels and 3035 ear silks annotated. To ensure that the model could learn on a sufficiently large training set while also reserving a proportion of data for validation and testing to assess the model’s generalization ability, the images of the planting plots were randomly divided in an 8:1:1 ratio to create the training set, validation set, and test set (Table 1).
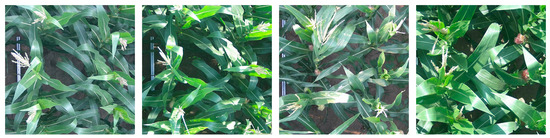
Figure 2.
Partial images of the dataset created.

Table 1.
The divided dataset includes the number of targets.
Additionally, considering that the plants in the center of the image might have their ear silks obscured by leaves, making them undetectable, side views from the top, bottom, left, and right angles of each planting plot were also directly selected and cropped during the platform’s traversal path. These images serve as supplementary images for detecting the planting plots. The ears of the maize are located in the upper middle of the plant, and the selected supplementary images have an approximate tilt angle of 30 degrees. The detection of tassel flowers and ear silks in images can be affected by the following factors: Occlusion and Individual Size Variation: Natural wind or the top leaves of the maize plant can obscure the tassels and silks, causing them to appear incomplete and changing the visual size of the individuals; Challenging Lighting Conditions for Ear Silks: The ear silks, when in shadow or under poor lighting conditions on cloudy days, may blend in with the background color, necessitating data augmentation techniques such as rotation, scaling, cropping, and brightness adjustments on the training set data. The image preprocessing workflow is illustrated in Figure 3.
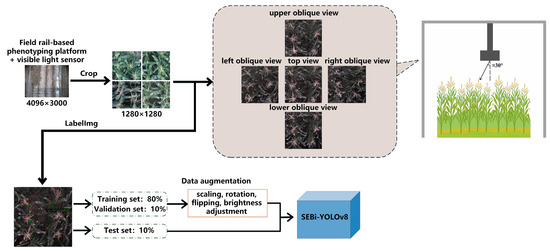
Figure 3.
Flowchart of data processing for detection of flowering and silking in maize.
2.2. Method Design
The YOLOv8 network is combined with SENetv2 and BiFormer dual-layer routing attention to form a SEBi-YOLOv8 network, utilized for detecting the tasseling and silking in maize planting plots.
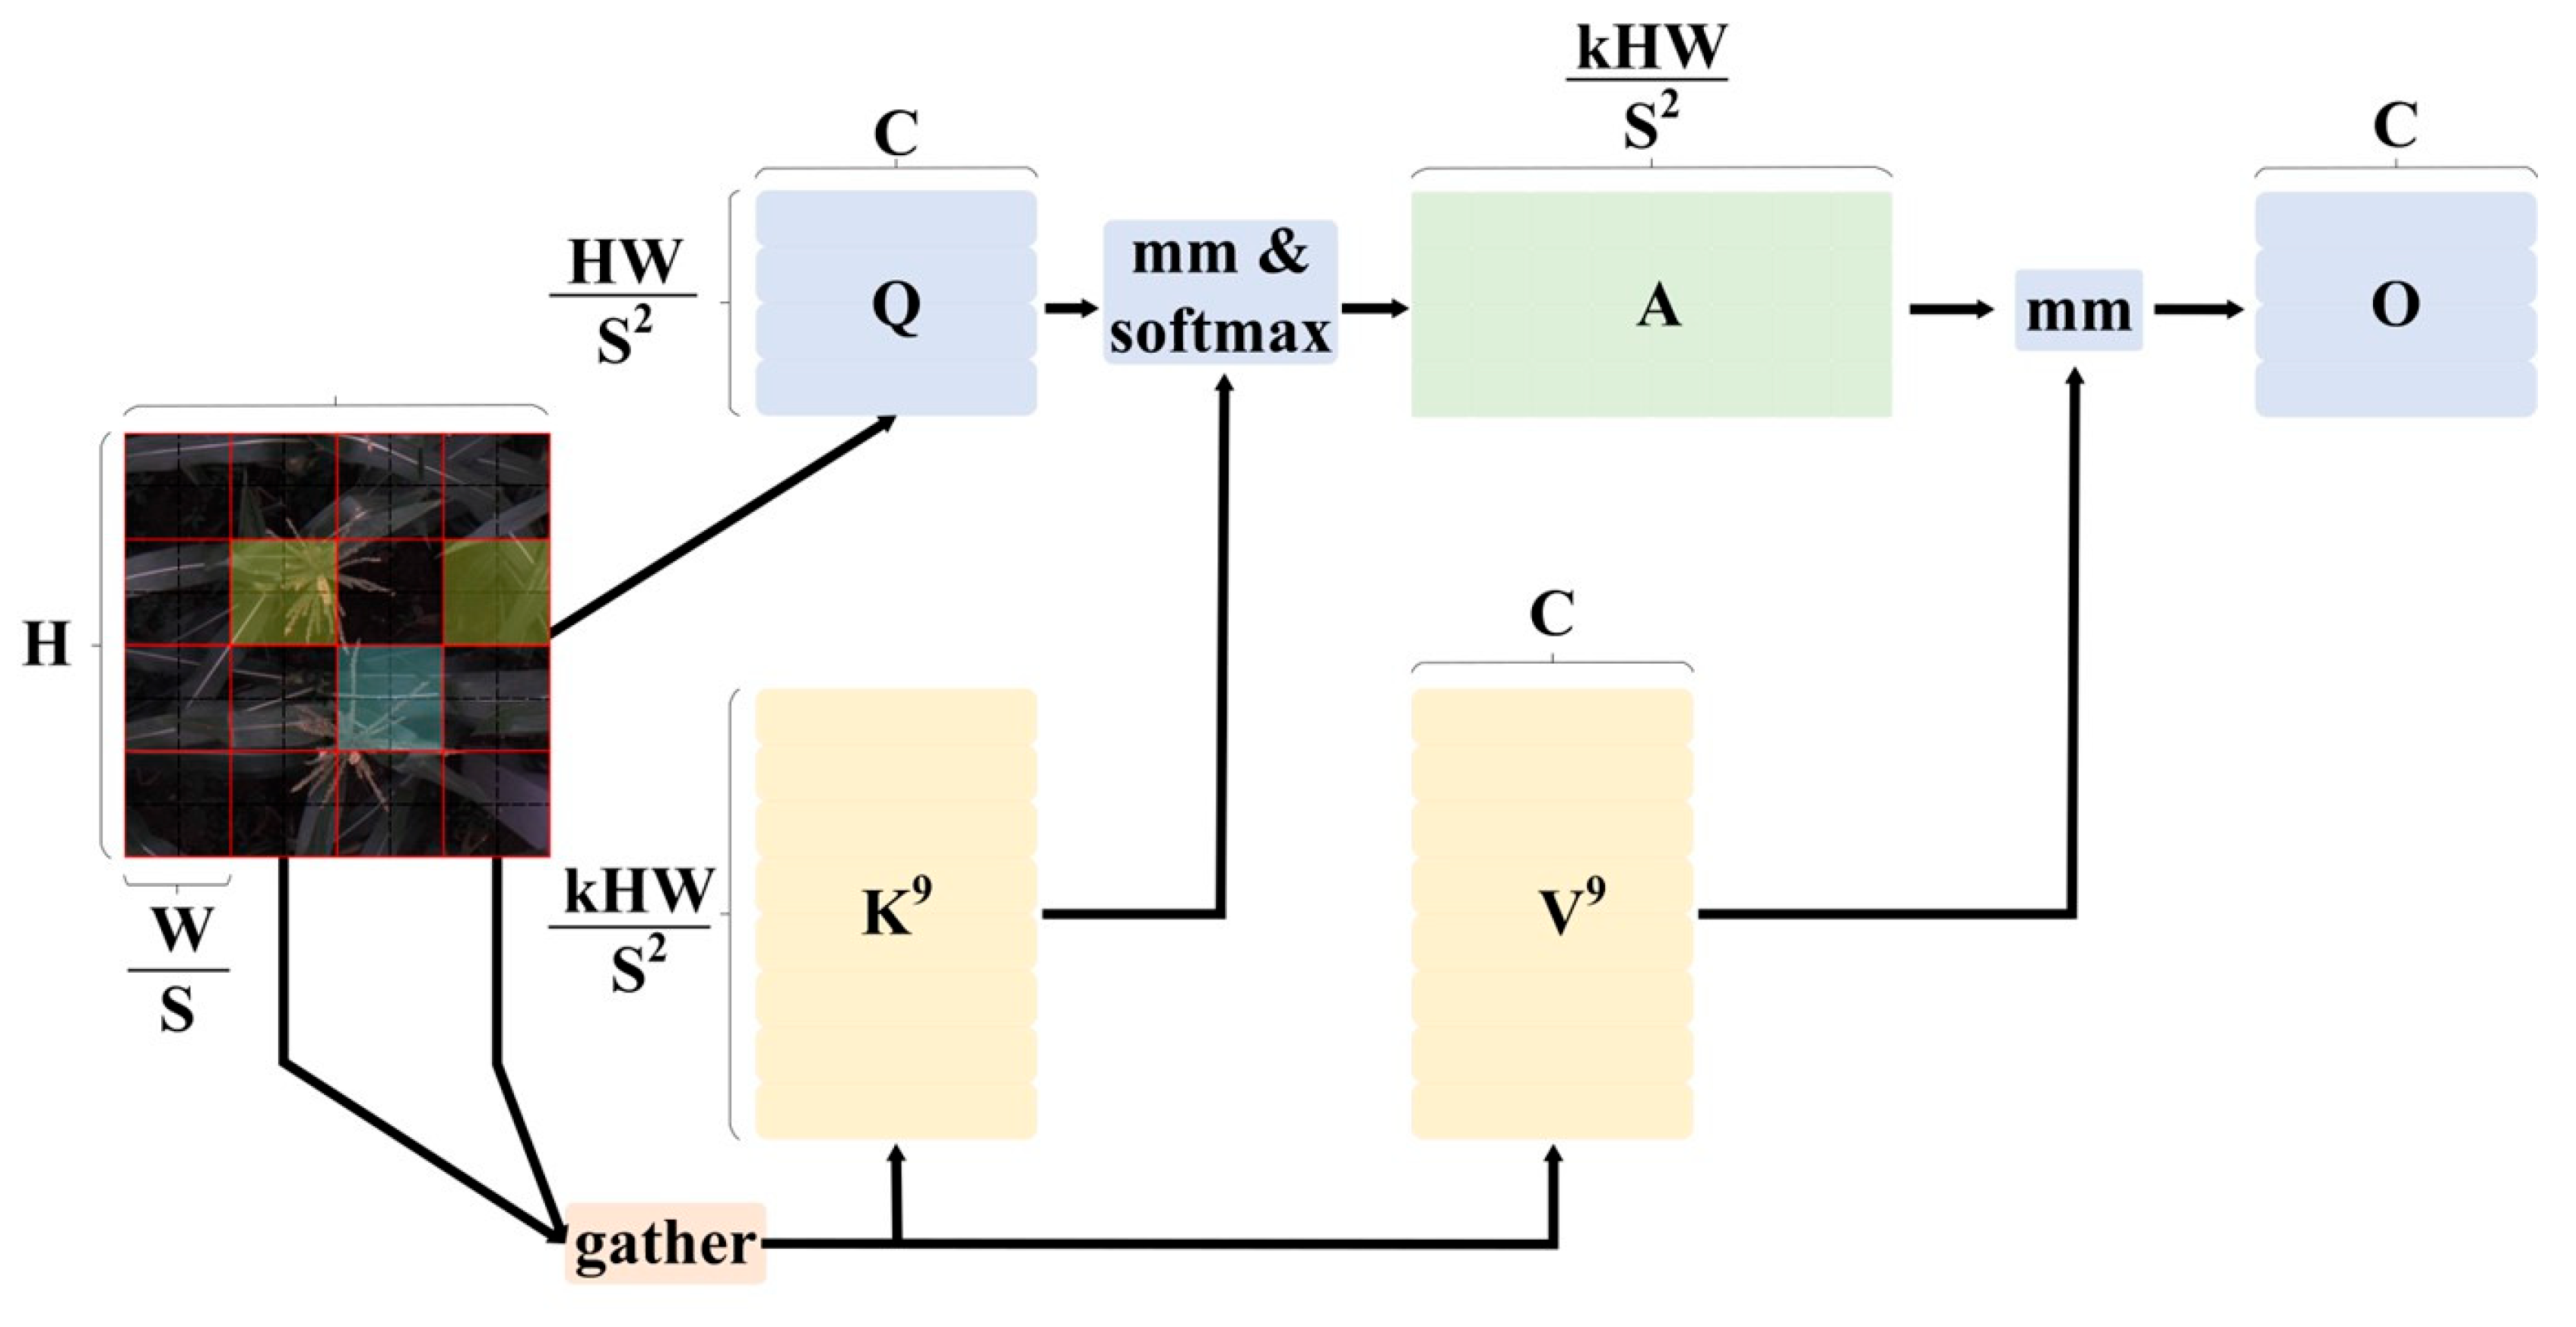
BiFormer: BiFormer [17] is a dynamic sparse attention mechanism based on a dual-layer path, introduced at CVPR 2023. It employs a pyramid-structured visual Transformer built with a Bi-level Routing Attention (BRA) module. The core concept of the BRA module involves first constructing and establishing a regional directed graph, filtering out irrelevant key-value pairs through coarse regional analysis. As shown in Figure 4, after inputting the image , it is divided into S × S different regions, each containing feature vectors. Through linear mapping, . Using the directed graph’s region-to-region routing, a regional directed graph is established, followed by employing fine-grained token-to-token attention within the routed regions to recognize the remaining few relevant key-value pairs. The formula is as follows:
where represent the projection weights for the query, key, and value, respectively. is the routing index matrix. and are the tensors obtained after the aggregation of keys and values. Additionally, represents a local context enhancement term.
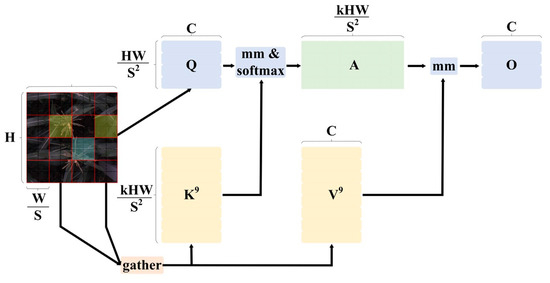
Figure 4.
BRA module.
BiFormer builds upon this foundation by stacking multiple modules. In the first stage, overlapping block embeddings are used. From the second to the fourth stages, merging modules are employed to reduce the spatial resolution of the input while increasing the number of channels. Subsequently, BiFormer modules are used sequentially for feature transformation. At the beginning of each BiFormer module, a 3 × 3 depthwise convolution is used to implicitly encode relative position information. This is followed by the use of the BRA module and a 2-layer MLP module, which are utilized for cross-layer modeling and positional embeddings, respectively.
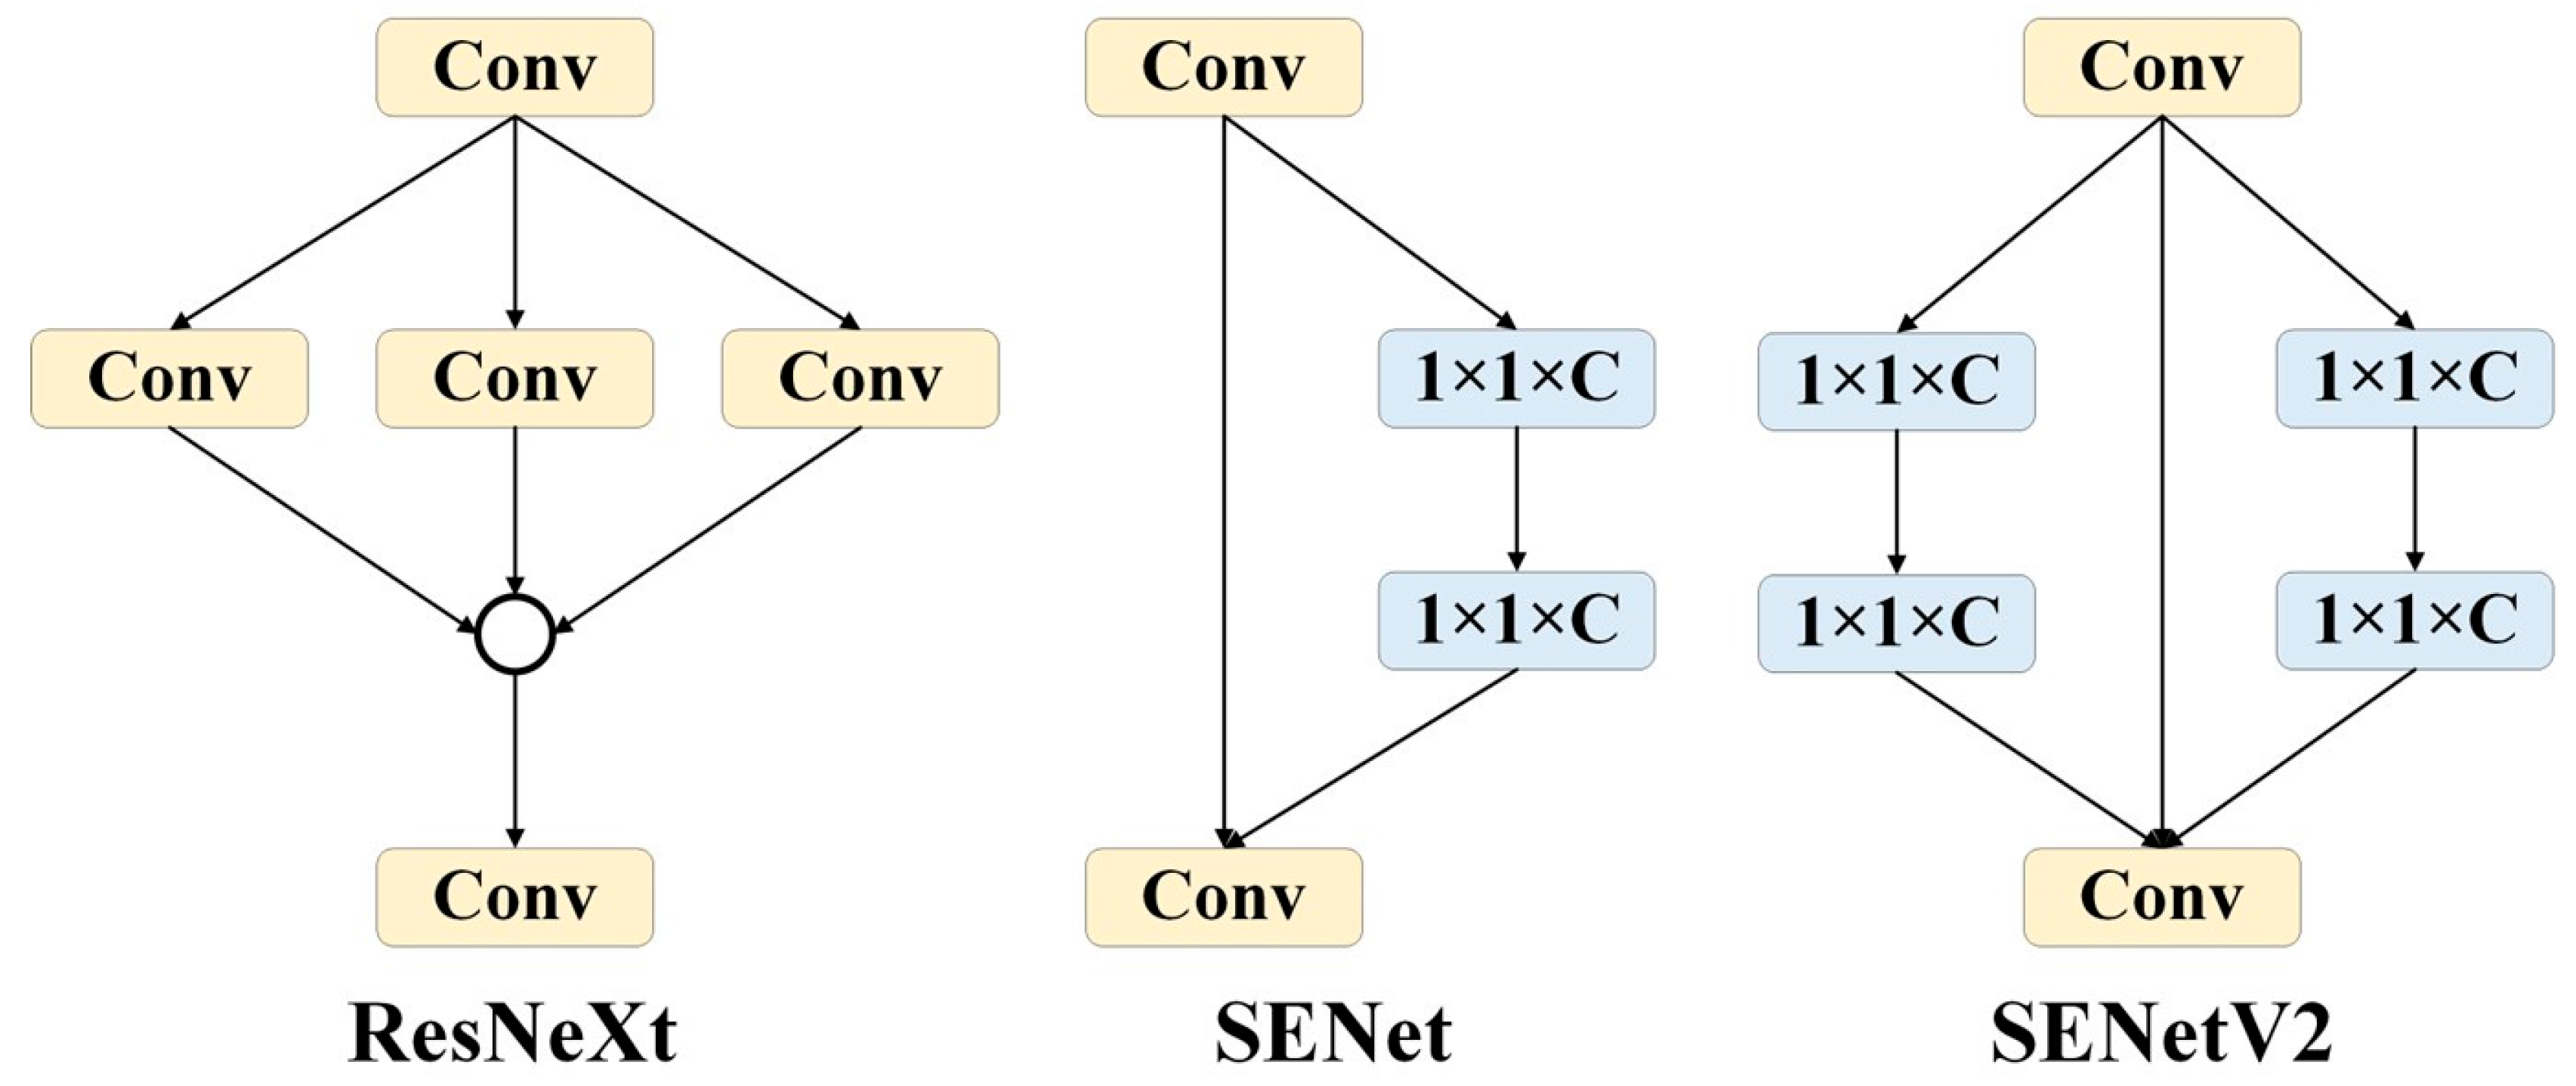
SENetV2: SENetV2 [18] is a network architecture that enhances performance by adjusting the relationships between channels in convolutional networks. It is not a standalone network model, but a module that can be combined with any existing model to act as a channel-level attention mechanism. Compared to SENetV1 [19], SENetV2 offers further optimization on a global scale. It introduces a new module called Squeeze aggregated excitation (SaE), designed to improve the network’s representational capacity. The design of the SaE module draws from the features of ResNeXt [20] and SENet. ResNeXt employs a multi-branch CNN structure where feature maps from different branches are processed through convolution operations and merged, followed by additional convolution operations. SENet compresses features by applying global average pooling after standard convolution operations, then uses two 1 × 1 fully connected layers (FC) with a Sigmoid activation function to obtain the channel weights, ultimately scaling the convolutional features. The SaE module utilizes multi-branch, fully connected layers to perform compression and excitation operations, followed by feature scaling. This approach further enhances the refinement of features and the integration of global information through its multi-branch structure (Figure 5).
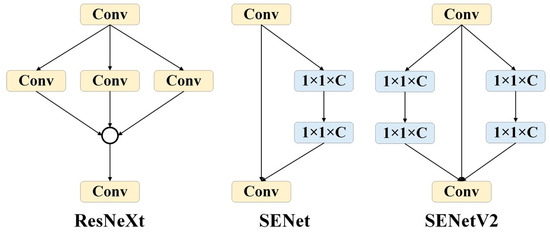
Figure 5.
Comparison of ResNeXt, SENet, and SENetV2 modules.
The structure of the SEBi-YOLOv8 model is shown in Figure 6. In the backbone of YOLOv8, BiFormer modules are introduced after the 2nd, 3rd, and 4th C2f modules in the backbone network. This integration is aimed at better extracting features from complex backgrounds, specifically for the detection of tasseling and silking in maize, while also reducing the computational load to ensure a fast detection rate.
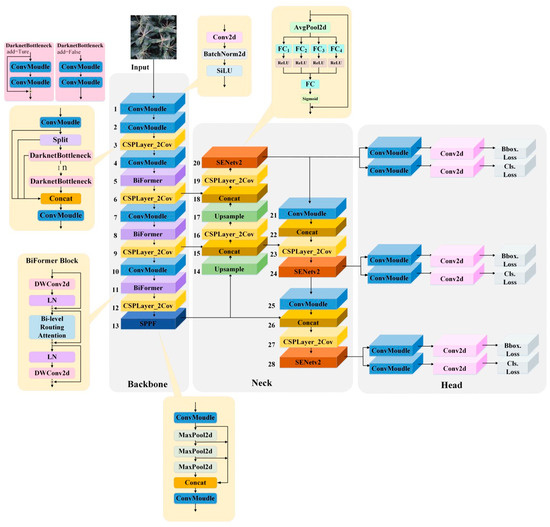
Figure 6.
Structure of the SEBi-YOLOv8 model.
Additionally, SENetV2 modules are added to the outputs of the three detection layers in the Neck section, enhancing the network’s ability to capture channel patterns and global knowledge. This improvement aids in better representing the extracted features and increases the classification accuracy for the ear silks category, which is particularly challenging due to occlusions and significant color differences.
This paper first selects the appropriate size of the original model through comparative experiments and then conducts ablation studies on the added structures to validate their effectiveness for the experiments in this section. This process establishes the model foundation necessary for subsequent calculations to obtain the ASI indices for two inbred maize lines.
2.3. Evaluation Metrics for Detection and Segmentation Models
To quantify the performance of the SEBi-YOLOv8 model in maize organ detection, we evaluated and analyzed its performance using four metrics: Precision (P), Recall (R), mAP (IoU = 0.50), and mAP (IoU = 0.50:0.95). Precision (P) and Recall (R) are defined by Formulas 6 and 7, while AP and mAP are defined by Formulas (8) and (9). IoU is defined by Formula (10). We assessed the detection results of the proposed method in practical agricultural scenarios using the correlation coefficient R2 (Formula (11)) and the root mean square error RMSE (Formula (12)).
where refers to the number of correctly identified positive instances, which in the case of this study’s target detection experiments, includes the number of maize tassel parts correctly identified as being in the maize tassels category and the number of ear silks parts correctly identified as being in the ear silks category. refers to the number of negative instances incorrectly identified as positive, such as wrongly classifying background areas as being in either the maize tassels or ear silks categories. represents the number of negative instances correctly identified as negative, which means correctly recognizing background areas as background. denotes the number of positive instances identified as negative, such as incorrectly classifying areas of maize tassels or ear silks as background. stands for precision and stands for recall (also known as sensitivity). represents the total number of label categories. The terms “” and “” refer to the predicted bounding boxes and ground truth bounding boxes, respectively. represents the true values, represents the model’s predicted values, and is the average of all the true values. n denotes the sample size. The closer R2 is to 1, the better the model’s fit.
3. Experience and Results
3.1. Experimental Configuration and Model Training Parameters
The experiment was conducted on an operating system of Ubuntu 20.04 LTS, utilizing a 12-core 12th Generation Intel® Core™ i7-12700 processor with 16 GB of memory and a GPU manufactured by NVIDIA, specifically the NVIDIA GeForce RTX 3070ti model. The input image size was set to 640 × 640 pixels. The SGD optimizer was used with a momentum coefficient of 0.9 and weight decay set at 0.0001. Mosaic augmentation was disabled during the last 10 epochs, and the batch size was set to four.
3.2. Model Selection
The YOLOv8 framework offers five different model sizes: Nano (n), Small (s), Medium (m), Large (l), and Extra Large (x). To determine which model size is most suitable for the application, this paper trained each model variant and a Faster R-CNN model on the constructed maize dataset until the performance stabilized and the loss no longer decreased. It was determined that training for 500 epochs was most appropriate. The training results were compared to identify the best-performing model size on this dataset, which will serve as the base model for subsequent optimizations. The specific comparison results are as follows:
According to Table 2, from YOLOv8-n to YOLOv8-x, there was a significant increase in the number of parameters in the models, ranging from about 3 million to over 68 million. Models with more parameters typically have higher learning capabilities, but also entail higher computational costs.
Table 2.
Training results of different sizes of YOLOv8.
In terms of performance metrics, YOLOv8-x achieved the highest mAP50-95 across all categories, indicating that it has the best average detection performance across multiple IoU thresholds.
In classification, the detection metrics for maize tassels (male) are generally higher than those for ear silks (female). This is because the maize tassels are located at the top of the plant canopy and their features are more distinct and easier to recognize, whereas the ear silks are located within the corn leaf sheath and are partially obscured by leaves, leading to greater shape variability, and thus, lower detection performance compared to maize tassels.
Among the models, YOLOv8-m and YOLOv8-x achieved the highest precision and recall rates in the maize tassels category; for the ear silks category, although the YOLOv8-x model showed higher precision, its recall was slightly lower than that of YOLOv8-m. This may indicate that YOLOv8-m performs better in avoiding missed detections (i.e., it can recall more positive samples) when detecting ear silks.
When the IoU threshold was set at 0.50, YOLOv8-m had the highest average detection accuracy for both all categories and individual categories; however, when the IoU threshold ranged from 0.50 to 0.95, the results for YOLOv8-m and YOLOv8-x were comparable, although YOLOv8-m trained faster. Considering a comprehensive comparison of various metrics and parameter levels, YOLOv8-m was selected as the base model for further optimization.
3.3. Ablation Study
To compare the detection performance of the SEBi-YOLOv8 model with the original YOLOv8-m on a maize plant dataset, ablation studies were conducted. The original YOLOv8, which lacks the SENetv2 module and the dual-layer routing attention module, was compared with the new model that includes these two modules. All models were trained using the same dataset, and the training results are shown in Table 3. The original YOLOv8-m model had an mAP (IoU = 0.50) of 0.966 and an mAP (IoU = 0.50:0.95) of 0.804, with a model size of 52.1 MB. After adding the SENetv2 module alone, the mAP increased to 0.972 and 0.810—an increase of 0.6% and 6%, respectively, with the model size differing by 0.2 MB from the original. After adding the BiFormer module alone, the mAPs were 0.98 and 0.869—increasing by 1.2% and 6.5%, respectively, with a model size increase of 3.4 MB over the original. Finally, adding both modules resulted in an mAP increase of 2.3% and 8.2%, respectively, to 0.989 and 0.886, with the model size growing by 8.4%, or an additional 4.4 MB.
Table 3.
Ablation test results.
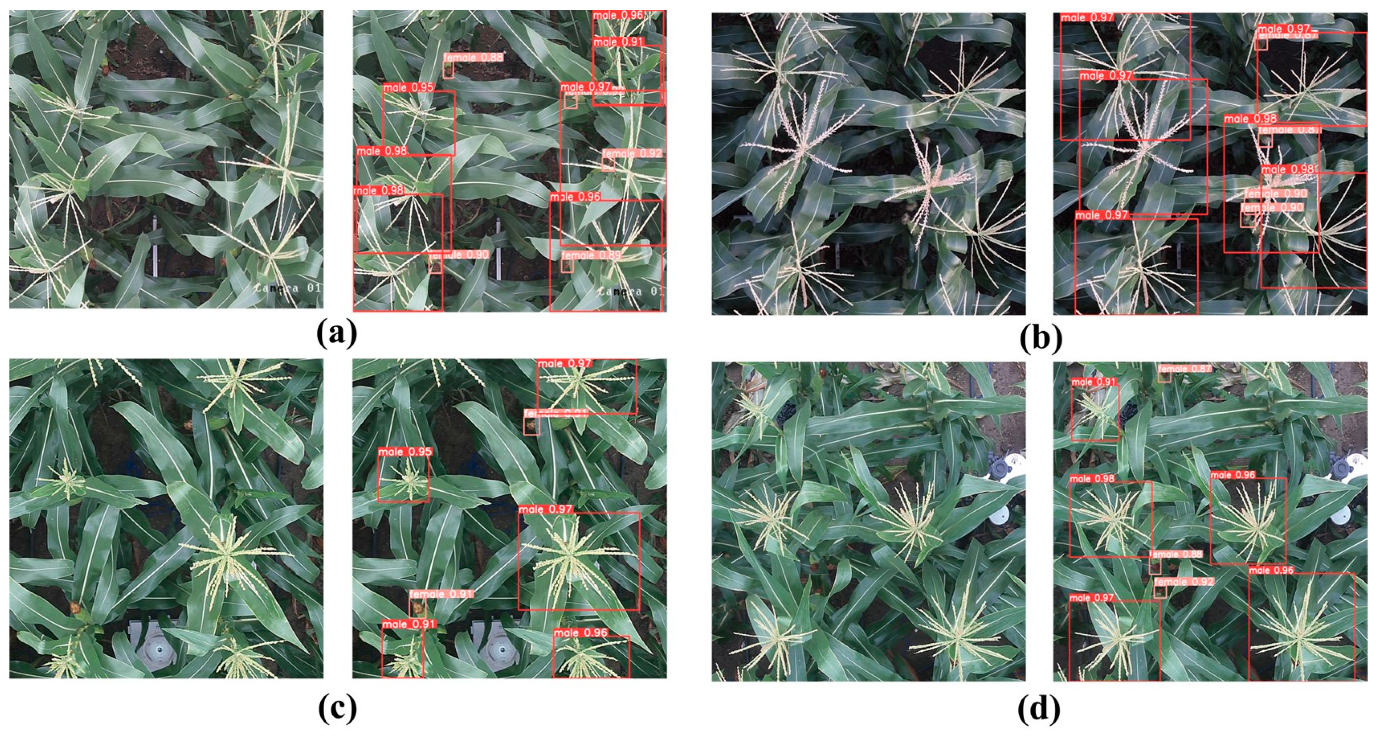
It is evident that the SEBi-YOLOv8 model with the added BiFormer and SENetv2 modules achieved the highest mAP scores, demonstrating improved detection performance. The model performed better in detecting maize tassels in field scenarios compared to the SEYOLOX-tiny [11] model’s mAP (IoU = 50), which was higher by at least 0.03, and was close to the prediction accuracy results (p = 98.02%) reported by Wang et al. [12]. The effectiveness of the SEBi-YOLOv8 model in detecting maize tassels and silks is illustrated in Figure 7.
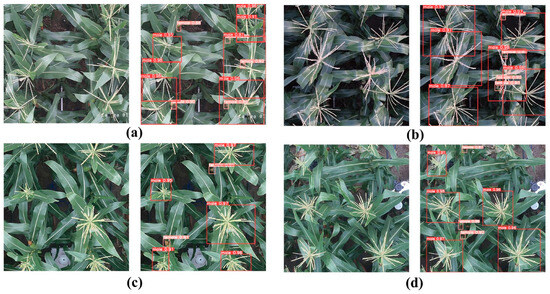
Figure 7.
SEBi-YOLOv8 model detection result images, where (a–d) are four different planting areas, with the original images on the left and the detection results on the right.
3.4. Results and Comparison of ASI Acquisition in Different Inbred Lines of Maize
In this section, based on the time-series images acquired from the field rail-based phenotyping platform, images of planting plots from two maize inbred lines, AD268 and MC670, were selected for each day from the tasseling to the silking stages. The SEBi-YOLOv8 model was used to detect features in these images, and the ASI parameters for the inbred lines were calculated based on the detection results. The experimental period spanned 15 days, from August 11 to August 26.
Each plot for a variety contained six plants; hence, there would be six tassels. As for ear silks, typically, a maize plant grows one main ear located at the mid or upper part of the stalk; in some cases, maize plants may grow additional ears, often referred to as “secondary ears” or “side ears,” caused by various factors including genotype, planting density (lower densities sometimes lead to multiple ears per plant), and growth conditions such as fertilizer and water availability.
The top-view image sequences of a variety, along with supplementary angle images, were sequentially input into the SEBi-YOLOv8 model according to the date of acquisition. The average of the detection results from different angles for each day was calculated, and the final prediction results are shown in Table 4.
Table 4.
Results of male spike flowering and female spike spathe detection of AD268 and MC670.
Where ‘M’ represents label ‘male’, ‘F’ indicates label ‘female’, and ‘GT’ stands for the ground truth observed manually. As shown in the table, most of the model’s detection results align with the actual values. However, significant deviations were noted on the 18th due to strong wind conditions that day, which caused severe deformation of the plants and extensive overlapping, affecting the model’s detection performance.
In the detection results for maize tassels, apart from the 18th, there was one instance in each of the two inbred lines across 28 detections where direct sunlight led to missed detections; there were four errors in detecting ear silks, primarily because the silks in the lower parts of the ears were shadowed, leading the model to mistakenly classify these parts as soil and fail to detect the target object.
Excluding the errors on the 18th, the overall detection accuracy for the maize tassels (category ‘M’) had a correlation coefficient R2 of 0.986 and a Root Mean Square Error (RMSE) of 0.258. For the ear silks (category ‘F’), the R2 was 0.987 with an RMSE of 0.365; and for the overall categories, the R2 was 0.987 with an RMSE of 0.316.
Furthermore, ASI indices were calculated based on the results from the model detections. The ASI is calculated as the date when 50% of plants are silking (SD) minus the date when 50% of plants begin tasseling (AD). The date when at least three tassels are detected in an image for the first time is recorded as the AD, and the date when silks appear on 50% of the plants for the first time is recorded as the SD.
According to this setting, the calculated ASI indices were ASI_AD268 = 16 − 14 = 2 and ASI_MC670 = 19 − 14 = 5. This comparison suggests that under the same planting conditions, AD268 may perform better in resisting environmental stresses such as drought because its tasseling and silking times are more synchronized, potentially offering higher pollination efficiency and consistency in seed development. On the other hand, the longer ASI for MC670 may indicate poorer synchronization of pollination under specific environmental conditions, which could lead to decreased pollination efficiency and yield losses. Therefore, based solely on the advantages of the ASI index, AD268 might be a more ideal choice for cultivation under adverse conditions.
4. Discussion
The development and application of the SEBi-YOLOv8 model have marked significant progress in the high-throughput phenotyping of maize ASI. This model integrates cutting-edge computer vision technologies with practical agricultural needs, addressing the crucial challenge of synchronizing maize reproductive development under stress conditions such as drought and high temperatures. Integrating SENetv2 and BiFormer layers into the YOLOv8 framework significantly enhanced detection accuracy, demonstrating the model’s robustness in complex natural backgrounds and varying light conditions commonly found in field environments.
(1) Comparison with Conventional Method: Traditionally, ASI assessments were manually performed, which was time-consuming and prone to human error and variability. The automated detection method presented in this study, using a field phenotyping platform for continuous, non-destructive image capture, offers substantial improvements over manual methods. The efficiency and accuracy of this method are reflected in high mAP scores, significantly reducing the time required for phenotypic data collection and allowing for real-time data analysis.
(2) Impact of Environmental Conditions: Our results indicate that the model’s performance may vary under different environmental conditions. As shown in Table 4, extreme weather conditions such as strong winds and poor lighting can negatively impact detection accuracy. These findings highlight the need for further improvements to the model to enhance its robustness to environmental changes. Future research could explore the integration of additional sensor data, such as weather information, to dynamically adjust detection parameters based on current conditions.
(3) Implications for Plant Breeding and Agricultural Practices: Accurately and efficiently measuring ASI has profound implications for maize breeding and agricultural practices. By selecting hybrids with an optimized ASI under specific environmental conditions, breeders can develop varieties that are more resistant to environmental stresses, thereby enhancing crop yield and stability. Additionally, this technology could be integrated into smart farming systems, providing farmers with precise data to make informed decisions about irrigation and pest management based on the real-time growth status of their crops.
5. Conclusions
This article introduces a method for obtaining maize ASI indices based on a field rail-based phenotyping platform. It first outlines the data acquisition and processing process, the experimental environment, and the evaluation metrics. The construction of the model is then detailed.
To more effectively extract the features of maize tassels and ear silks from complex backgrounds while reducing computational load to ensure detection speed, a BiFormer module was incorporated into the backbone network of the model, and a SENetV2 module was added to the output of the detection layers in the Neck section, improving the classification accuracy for the ear silks category under conditions with significant occlusion and color differences. Finally, the improved model was used to detect and calculate the ASI indices on time-series images of two inbred lines. The main conclusions are as follows:
(1) YOLOv8 Model Comparison: This study compared the training results of different sizes of YOLOv8 models and the mainstream object detection model Faster R-CNN on the constructed dataset. It was demonstrated that YOLOv8-m had the best performance on this specific dataset, with Precision, Recall, mAP (IoU = 0.50), and mAP (IoU = 0.50:0.95) at 0.962, 0.935, 0.966, and 0.804, respectively. These metrics are superior to those of other model sizes and the Faster R-CNN model. Additionally, its training time was faster compared to YOLOv8-x, which had similar performance metrics. Therefore, YOLOv8-m was selected as the base model for further improvements.
(2) SEBi-YOLOv8 Model: To compare the detection performance of the SEBi-YOLOv8 model with the original YOLOv8-m on a maize plant dataset and demonstrate the improvements brought by the SENetv2 module and the dual-layer routing attention module, this study conducted ablation experiments. These experiments proved that models with each module added separately showed an increase in detection accuracy. The SEBi-YOLOv8 model, which includes both modules, showed an increase in mAP by 2.3% and 8.2%, reaching 0.989 and 0.886, respectively. The model size increased by 8.4%, adding 4.4 MB compared to the original model. The highest mAP scores demonstrate that the improved model achieved better detection performance.
(3) Evaluation of ASI Detection: Using the SEBi-YOLOv8 model, continuous 15-day monitoring of maize tassels and ear silks for two maize inbred lines was conducted to evaluate the model’s effectiveness in this application. The total category correlation coefficient R2 was calculated to be 0.987 with an RMSE of 0.316, indicating high consistency with ground truth values observed manually. Finally, based on the detection results, the ASI indices for the two inbred lines were calculated and compared, with ASI_AD268 = 2 and ASI_MC670 = 5. From these ASI indices, it was concluded that under the same planting conditions, the inbred line AD268 exhibits better resilience.
The method described in this paper provides a theoretical basis and reference value for the identification and counting of maize canopy images and ASI index detection using a field rail-based phenotyping platform. In this study, to mitigate the effects of occlusion caused by a top-down shooting angle on the detection of ear silks, oblique angle images at similar angles were additionally used for detection and averaging. Furthermore, the confirmation of ground truth values was based on the experience of having high growth synchrony within the same variety, under the same planting conditions, and in the same planting batch, which can reduce the impact of occlusions on detection results to some extent. In the future, the detection method for ear silks can be further optimized by adjusting the shooting height and angle in combination with multiple sensors to obtain more comprehensive and clear data. By integrating positioning algorithms, the accurate extraction of the number of maize tassels and ear silks for each plant can be achieved, enabling precise acquisition of the ASI for maize populations.
Author Contributions
Methodology, writing—original draft preparation, L.Z.; investigation, writing—review and editing, C.W.; data curation, validation, visualization, H.H.; resources, project administration, X.G. and W.S. All authors have read and agreed to the published version of the manuscript.
Funding
This research was funded by National Key R&D Program of China, grant number 2021YFD1200700 and the Science and Technology Innovation Team of the Maize Modern Seed Industry in Hebei, grant number 21326319D.
Data Availability Statement
The original contributions presented in the study are included in the article, and further inquiries can be directed to the corresponding author.
Conflicts of Interest
The authors declare no conflicts of interest.
References
- Tan, C.; Li, C.; He, D.; Song, H. Towards real-time tracking and counting of seedlings with a one-stage detector and optical flow. Comput. Electron. Agric. 2022, 193, 106683. [Google Scholar] [CrossRef]
- Silva, P.C.; Sánchez, A.C.; Opazo, M.A.; Mardones, L.A.; Acevedo, E.A. Grain yield, anthesis-silking interval, and phenotypic plasticity in response to changing environments: Evaluation in temperate maize hybrids. Field Crops Res. 2022, 285, 108583. [Google Scholar] [CrossRef]
- Banziger, M.; Lafitte, H.R. Efficiency of secondary traits for improving maize for low-nitrogen target environments. Crop Sci. 1997, 37, 1110–1117. [Google Scholar] [CrossRef]
- Li, Y.; Wen, W.; Guo, X.; Yu, Z.; Gu, S.; Yan, H.; Zhao, C. High-throughput phenotyping analysis of maize at the seedling stage using end-to-end segmentation network. PLoS ONE 2021, 16, e0241528. [Google Scholar] [CrossRef]
- Wu, X.; Feng, H.; Wu, D.; Yan, S.; Zhang, P.; Wang, W.; Zhang, J.; Ye, J.; Dai, G.; Fan, Y.; et al. Using high-throughput multiple optical phenotyping to decipher the genetic architecture of maize drought tolerance. Genome Biol. 2021, 22, 185. [Google Scholar] [CrossRef] [PubMed]
- Zhang, F. Research Progress on the Flowering Interval Between Male and Female Spikes of Corn. J. Hebei Agric. Univ. 2002, z1, 24–25. (In Chinese) [Google Scholar]
- Fan, J.; Zhou, J.; Wang, B.; de Leon, N.; Kaeppler, S.M.; Lima, D.C.; Zhang, Z. Estimation of maize yield and flowering time using multi-temporal uav-based hyperspectral data. Remote Sens. 2022, 14, 3052. [Google Scholar] [CrossRef]
- Li, Z.; Guo, R.; Li, M.; Chen, Y.; Li, G. A review of computer vision technologies for plant phenotyping. Comput. Electron. Agric. 2020, 176, 105672. [Google Scholar] [CrossRef]
- Yang, W.; Feng, H.; Zhang, X.; Zhang, J.; Doonan, J.H.; Batchetlor, W.D.; Xiong, L.; Yaln, J. Crop phenomics and high-throughput phenotyping: Past decades, current challenges, and future perspectives. Mol. Plant 2020, 13, 187–214. [Google Scholar] [CrossRef] [PubMed]
- Omari, M.K.; Lee, J.; Faqeerzada, M.A.; Joshi, R.; Park, E.; Cho, B.K. Digital image-based plant phenotyping: A review. Korean J. Agric. Sci. 2020, 47, 119–130. [Google Scholar] [CrossRef]
- Song, C.Y.; Zhang, F.; Li, J.S.; Xie, J.Y.; Chen, Y.; Zhou, H.; Zhang, J.X. Detection of maize tassels for uav remote sensing image with an improved yolox model. J. Integr. Agric. 2023, 22, 1671–1683. [Google Scholar] [CrossRef]
- Wang, B.; Yang, G.; Yang, H.; Gu, J.; Xu, S.; Zhao, D.; Xu, B. Multiscale maize tassel identification based on improved retinanet model and uav images. Remote Sens. 2023, 15, 2530. [Google Scholar] [CrossRef]
- Yu, Z.; Ye, J.; Li, C.; Zhou, H.; Li, X. TasselLFANet: A novel lightweight multi-branch feature aggregation neural network for high-throughput image-based maize tassels detection and counting. Front. Plant. 2023, 14, 1158940. [Google Scholar] [CrossRef] [PubMed]
- Zhu, D.; Yu, M.; Liang, M. Real-time Instance Segmentation of Corn Ears Based on SwinT-YOLACT. Trans. Chin. Soc. Agric. Eng. 2023, 39, 164. [Google Scholar]
- Guan, H.; Deng, H.; Ma, X.; Zhang, T.; Zhang, Y.; Zhu, T.; Zhou, H.; Gu, Z.; Lu, Y. A corn canopy organs detection method based on improved dbi-yolov8 network. Eur. J. Agron. 2024, 154, 127076. [Google Scholar] [CrossRef]
- Wong, J.; Sha, H.; Al Hasan, M.; Mohler, G.; Becker, S.; Wiltse, C. Automated Corn Ear Height Prediction Using Video-Based Deep Learning. In Proceedings of the 2020 IEEE International Conference on Big Data (Big Data), Atlanta, GA, USA, 10–13 December 2020; pp. 2371–2374. [Google Scholar]
- Zhu, L.; Wang, X.; Ke, Z.; Zhang, W.; Lau, R.W. Biformer: Vision transformer with bi-level routing attention. In Proceedings of the IEEE/CVF Conference on Computer Vision and Pattern Recognition, Vancouver, BC, Canada, 17–24 June 2023; pp. 10323–10333. [Google Scholar]
- Narayanan, M. SENetV2: Aggregated dense layer for channelwise and global representations. arXiv 2023, arXiv:2311.10807. [Google Scholar]
- Hu, J.; Shen, L.; Albanie, S.; Sun, G.; Wu, E. Squeeze-and-excitation networks. IEEE Trans. Pattern Anal. Mach. Intell. 2020, 42, 2011–2023. [Google Scholar] [CrossRef] [PubMed]
- Xie, S.; Girshick, R.; Dollár, P.; Tu, Z.; He, K. Aggregated residual transformations for deep neural networks. In Proceedings of the IEEE Conference on Computer Vision and Pattern Recognition, Honolulu, HI, USA, 21–26 July 2017; pp. 1492–1500. [Google Scholar]


Disclaimer/Publisher’s Note: The statements, opinions and data contained in all publications are solely those of the individual author(s) and contributor(s) and not of MDPI and/or the editor(s). MDPI and/or the editor(s) disclaim responsibility for any injury to people or property resulting from any ideas, methods, instructions or products referred to in the content. |
© 2024 by the authors. Licensee MDPI, Basel, Switzerland. This article is an open access article distributed under the terms and conditions of the Creative Commons Attribution (CC BY) license (https://creativecommons.org/licenses/by/4.0/).