Abstract
Agarwood is a highly sought-after resinous wood for use in medicine, incense, and perfume production. However, the process of agarwood formation is slow. In this study, the induction of agarwood formation in three-year-old Aquilaria sinensis “Qinan” trees through treatment with ethephon, hydrogen peroxide, sodium chloride, distilled water, and wounding was investigated. The results showed that the starch content significantly decreased and that the soluble sugar content significantly increased during the process of agarwood formation, with no significant difference between the different treatment groups. The net photosynthetic rate significantly decreased. Except for the sodium chloride treatment, the total antioxidant capacity and the contents of flavonoids and phenols significantly increased during the process of agarwood formation. The essential oil yield of the ethephon and hydrogen peroxide treatment groups was significantly higher than that of the other treatment groups, with the highest essential oil yield in the ethephon treatment group. Compared to the control group, salt treatment produced the lowest essential oil yield of agarwood. The results indicate that appropriate concentrations of ethephon and hydrogen peroxide can promote the formation of agarwood in A. sinensis “Qinan”.
1. Introduction
Agarwood refers to a natural mixture of woody tissue and its secretions formed during the growth process of tree species in the genus Aquilaria of the family Thymelaeaceae [1,2]. As important raw materials such as precious essence and spices, religious supplies, traditional Chinese medicine, and daily health care products, agarwood and related products have been in short supply in the international and domestic markets for a long time [1,2]. Currently, more than 20 known species of Aquilaria can form agarwood. Aquilaria sinensis is one of the Aquilaria species that can grow and produce agarwood in China [3]. More and more people want to obtain agarwood because of its wide range of applications, with a high collector value, a high economic value, and its disease treatment in medical care. Aquilaria species have been destroyed due to people’s extensive and uncontrolled harvesting in the past. Therefore, in order to protect wild Aquilaria species from further damage, Appendix II of the Convention on International Trade in Endangered Species (CITES) included about 20 Aquilaria species in 2005, which is one of the effective measures to protect wild Aquilaria species [4].
There is a contradiction between wild Aquilaria species protection and market demand. In order to solve the contradiction, more and more farmers are artificially planting Aquilaria species to harvest agarwood resources [5,6]. In order to protect the sustainability of wild Aquilaria species resources, China is actively engaged in artificial Aquilaria species cultivation. The main ways to obtain agarwood seedlings include tissue culture, seed propagation, and grafting [7]. However, although more and more farmers are artificially planting Aquilaria species, the agarwood yield and efficiency are low. A slow rate of agarwood formation, a low amount of agarwood formation and a late time of agarwood formation are the main problems during the process of agarwood formation in artificially planted Aquilaria species, which has restricted the development of the agarwood industry.
In recent years, a type of special germplasm of A. sinensis has been selected and cultivated from the wild population. A superior clone that produces easily induced, high-quality agarwood, named A. sinensis “Qinan” [8], has recently been selected. The characteristics of agarwood formation in the grafted seedlings of A. sinensis “Qinan” are similar to their parents, and they quickly produce excellent agarwood [9]. It is possible to obtain a large number of agarwood seedlings through grafting, which is an effective measure to protect wild Aquilaria species.
The formation of agarwood from A. sinensis is a complex physiological and biochemical process; unless triggered by severe injuries or microbial infestation, a limited amount of agarwood can be produced by healthy Aquilaria trees. The production of agarwood is mainly caused by wind or lightning injuries, or by wounds from insects and fungi [10,11,12]. There is a tradeoff between growth and defense during wounding-induced agarwood formation [13,14]. The net photosynthetic rate and the contents of auxin and gibberellin decrease, the activity of antioxidant enzymes, total phenols and terpenes, chromone, and oil content increases, the starch content decreases, and the soluble sugar content increases. Moreover, there is a differential expression of flavonoid biosynthesis-related genes [15]. The expression level of the main component in A. sinensis “Qinan” 2-(2-phenylethyl) chromones synthetase gene is increased [16,17]. Research has found that the main components of agarwood are difficult-to-volatilize components such as lignans and chromones, as well as volatile components such as fatty acids, semi-blue compounds, and aromatic compounds [18]. So far, more than 150 chemical components have been identified, mainly including sesquiterpenes and chromones. Among the chromone substances, 2-(2-phenylethyl) chromones are more common, and there are over 100 reported homologues of 2-(2-phenylethyl) chromones [19]. In one of our previous studies, we found that the relative content of 2-(2-phenylethyl) chromones in the essential oil of A. sinensis “Qinan” reached 33% [15].
In order to promote agarwood formation and increase its yield, physical, chemical, and biological methods have been used in different experiments on A. sinensis. Physical methods include drilling, burning, and cutting; chemical methods include injecting methyl jasmonate, ethylene, hydrogen peroxide, and sodium chloride; and biological methods include inoculating fungi and other microbial flora found naturally [15,20,21,22]. We found that fire drilling was more likely to form agarwood than cold drilling, and adding a salt solution to fire drilling was more likely to form agarwood than fire drilling alone in A. sinensis [23]. In other tree species, previous studies found that adding gas elicitors (CO2, O2, C2H4) promoted the formation of heartwood and improved its quality [24,25,26]. In another study, we found that injection of chemical reagents (NaCl, H2O2, CH3COOH) promoted the formation of Dalbergia odorifera heartwood, increased the oil content of the heartwood, and decreased the starch content during the heartwood formation process [27], which was similar to the agarwood formation process of A. sinensis “Qinan” [15]. At present, there are few reports on whether chemical reagents can promote the formation of agarwood in A. sinensis “Qinan”. In this study, A. sinensis “Qinan” trees were selected as the experimental materials, and different chemical reagents (NaCl, ethephon, and hydrogen peroxide) were used to induce agarwood formation. Changes in structural and non-structural carbohydrates were investigated during agarwood formation. The content and composition of essential oil were studied. We aimed to determine the influence of different chemical reagents (NaCl, ethephon, and hydrogen peroxide) on the formation of agarwood, in particular, to promote the formation of agarwood in A. sinensis “Qinan”. The findings provide vital information for future research into the commercial production of agarwood in A. sinensis “Qinan”.
2. Materials and Methods
2.1. Plant Materials and Experimental Design
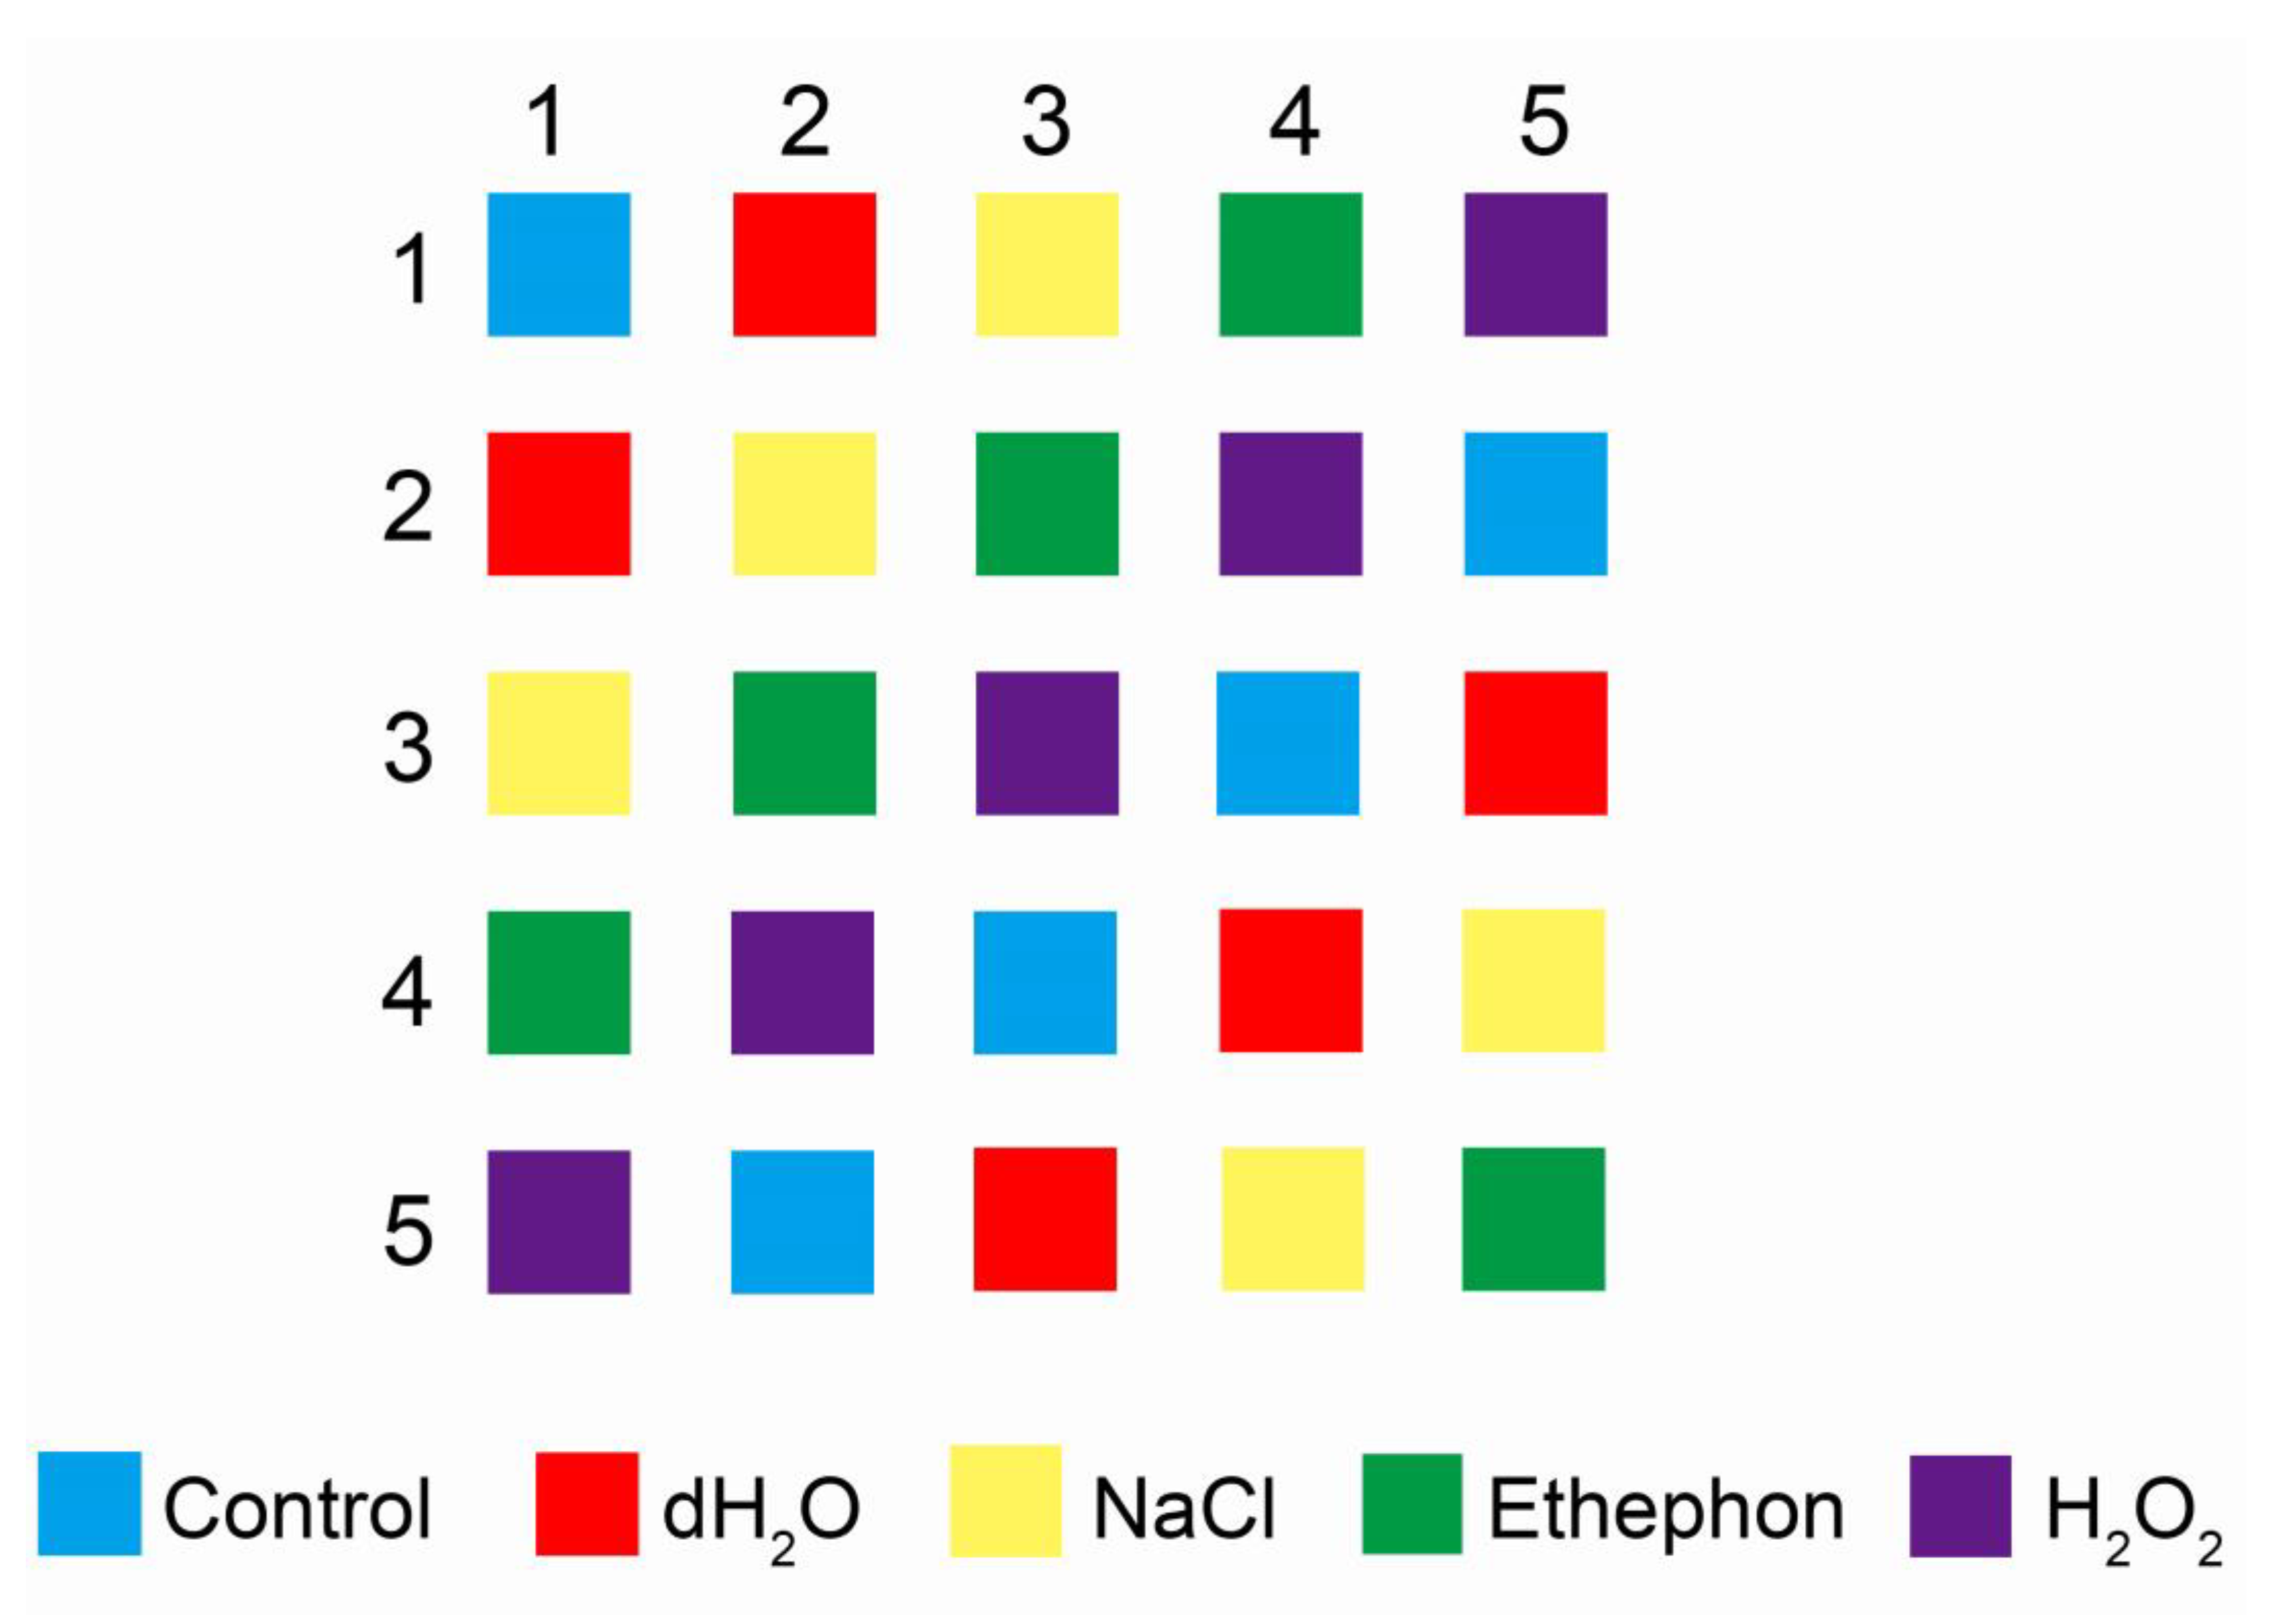
Twenty-five A. sinensis “Qinan” trees were planted in a five-by-five grid pattern in Huilai, Puning City, Guangdong Province, China (23°14′ N, 116°06′ E), and they were all grafted on A. sinensis seedling rootstocks. Three-year-old trees, with an average diameter at breast height of 3.9 ± 0.4 cm, without disease were selected for the experiment in December 2022. Holes were drilled along the middle of the tree trunk at a height of 30 cm from the ground using a rotating head with a diameter of 7 mm. The holes were spaced 15 cm apart, with 10 holes per tree. The direction of the holes was diagonally downward, at about a 45° to the tree trunk, and the depth of the holes was 3/4 of the diameter of the tree trunk. After drilling, there were five treatments: no reagents added (control); injecting distilled water (dH2O), 5% sodium chloride (NaCl), 0.05% ethephon, or 0.1% hydrogen peroxide (H2O2) into the hole; and 5 mL of solution was added to each hole. The treatments were assigned to individual trees following the design illustrated in Figure 1. The untreated plants were placed two rows apart from the treated plants.
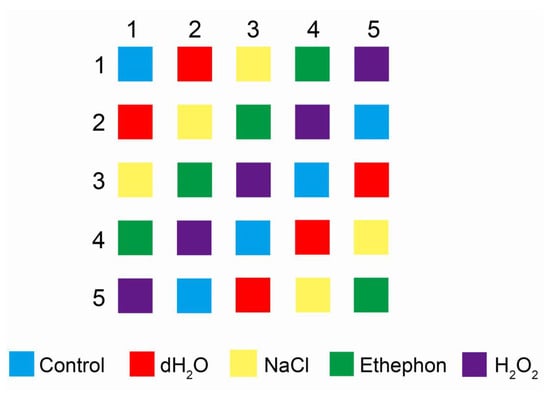
Figure 1.
Distribution of different treatments.
2.2. Determination of Non-Structural and Structural Carbohydrates
Stem samples were collected from 2 cm above the holes before treatment and after eight months of treatment. A 2-cm stem segment was cut off by saw, and it was dried and crushed after removing the phloem. The determination of the starch content was based on the enzymatic hydrolysis and anthrone colorimetric method [28]. First, 5 g of the samples was dried to a constant weight at 60 °C; then, the dry samples were ground and passed through a 60-mesh sieve to obtain the sample powder. Next, 10 mg of the powder sample was placed in a 2 mL centrifuge tube, and 0.5 mL of petroleum ether was added to the centrifuge tube. The homogenate was centrifuged at 12,000 rpm and 25 °C for 5 min, after which, it was oscillated at 50 °C for 30 min; then, the supernatant was discarded, leaving the precipitate. Then, 1 mL of 80% ethanol was added to the precipitate, and the mixture was shaken for 2 min. It was placed into a water bath at 50 °C for 20 min and centrifuged at 12,000 rpm and 25 °C for 5 min after cooling. Then, the supernatant was discarded, and 0.5 mL of DMSO was added into the final precipitate, which was shaken for 5 min. Next, it was placed in a boiling water bath until the sample was in a dispersed and dissolved state; then, 1.5 mL of anhydrous ethanol was added, and the mixture was vortexed until the sample was cooled to room temperature. The sample was centrifuged at 5000 rpm and 25 °C for 5 min; then, the supernatant was discarded. The centrifuge tube was subjected to vortex oscillation after adding 1 mL of DMSO; then, it was boiled in water for 15 min. Finally, it was centrifuged at 3000 rpm and 25 °C for 5 min until the sample was cooled to room temperature, the supernatant was diluted five times, and the starch content was measured on a multifunctional microplate reader (Enspire, PerkinElmer, Waltham, MA, USA).
The soluble sugar was determined following Liu et al. [29] and Han et al. [30]. The dry samples were ground and passed through a 60-mesh sieve. Then, 1 g of the sieved powder was placed into a 50 mL beaker. The beaker was sealed and placed into boiling water for 10 min; then, it was filtered and made up to 50 mL after cooling. The extraction solution was diluted 10 times, 1 mL was placed into a test tube (distilled water as a control), and 4 mL of anthrone reagent was added to the tube. After boiling for 10 min, the mixture was removed and cooled to room temperature. The absorbance value was measured at 620 nm on a multifunctional microplate reader (Enspire, PerkinElmer, Waltham, MA, USA), and the concentration was calculated by using different concentrations of soluble sugars as standard curves.
The cellulose, hemicellulose, and lignin contents were determined following Nazli et al. [31]. The dry samples were ground and passed through a 40-mesh sieve. Then, 0.02 g of the sieved powder was mixed with 1.5 mL of 80% ethanol. The mixture was incubated at 50 °C for 20 min and centrifuged at 12,000 rpm and 25 °C for 10 min after the sample cooled; then, the supernatant was discarded. Next, 1 mL of 80% ethanol was added to the centrifuge tube, which was then well shaken. The mixture was incubated at 50 °C for 20 min and centrifuged at 12,000 rpm and 25 °C for 10 min after the sample cooled; then, the supernatant was discarded. Next, 1 mL of the extraction solution was added, and the mixture was incubated at 90 °C for 15 min and centrifuged at 12,000 rpm and 25 °C for 10 min after the sample cooled; then, the supernatant was discarded. Next, 1 mL of acetone was added to the centrifuge tube, which was centrifuged at 12,000 rpm and 25 °C for 10 min after being well shaken. The supernatant was discarded, and the sample was incubated at 90 °C for 20 min to dry the precipitate. Then, 0.2 mL of the extraction was added to the centrifuge tube, incubated at 30 °C for 1 h, and poured into a 10 mL centrifuge tube. The centrifuge tube was rinsed with 5.6 mL of distilled water. The liquid was collected in the aforementioned 10 mL centrifuge tube, mixed well, and sealed. It was incubated at 110 °C for 1 h, then removed and cooled. Next, 1 mL of the sample solution and an equal volume of the mixture were transferred into a centrifuge tube. The sample was centrifuged at 8000 rpm and 25 °C for 5 min. The absorbance value of the supernatant was detected, and the concentrations of cellulose, hemicellulose, and lignin were calculated, according to the description of the Kit (Zike, Shenzhen, China) by using a multifunctional microplate reader (Enspire, PerkinElmer, Waltham, MA, USA).
2.3. Essential Oil Extraction and Content Determination
Stem samples were collected at eight months after treatment and naturally air-dried; the white wood was removed by using a small knife. The remaining dark resinous heartwood, agarwood, was harvested and dried at 60 °C to a constant weight. After being crushed by a grinder, the agarwood was passed through a 60-mesh sieve. Next, 2.00 g of agarwood powder was placed in a centrifuge tube. Then, 20 mL of 95% ethanol by volume was added, and the sample was sonicated in a water bath at 60 °C for 30 min. The supernatant was removed, and ethanol was added, repeating the above process. The supernatant was merged twice, with a pore size of 0.22 μm, the membrane was filtered to 50 mL. 2 mL supernatant was used for composition determination. Then 10 mL was transferred to a 40 mL sample collection cup. The sample was concentrated at 40 °C by using a rotary concentrator for removing ethanol and moisture. After the liquid had evaporated to a constant mass, the content of the alcohol soluble extract was calculated [32,33,34].
2.4. Essential Oil Composition Determination
The 2 mL supernatant of agarwood extract filtered with 0.22 μm filter membrane (described above) was used for composition determination. Gas chromatography–mass spectrometry (GC-MS) (7890B-5977A, Agilent, Santa Clara, CA, USA) was used to analyze the essential oil composition, which was extracted from agarwood with ethanol according to the method described by Howes et al. [35]. The GC-MS analysis was performed on a Finnigan TRACE GC-2000-MSTM (Washington, DC, USA) instrument equipped with a DB-5 column (Agilent, Santa Clara, CA, USA, 30 m length, 0.25 mm inner diameter, and 0.25-μm film thickness). The injection port temperature was 250 °C, and the oven initial temperature was 70 °C. The oven temperature was ramped from 70 °C at 10 °C/min to 150 °C and held for 5 min, 5 °C/min to 200 °C and held for 5 min, and 8 °C/min to 280 °C and held for 5 min. The carrier gas was helium with a flow rate of 1.0 mL/min, and no split was used. The essential oils were diluted to 10% with ethanol before analysis. The total injection volume was 1 μL, with a solvent delay of 4 min. The National Institute of Standards and Technology (NIST, Gaithersburg, MD, USA) standard mass spectra libraries (NIST2005, NIST2005s, NIST2014, and NIST2014s) were used to identify each compound in the essential oil, as well as the published data that showed retention indices and/or mass spectra [36,37,38]. The relative content of each compound was estimated according to the relative area through an area normalization method [35].
2.5. Determinations of Net Photosynthetic Rates, Flavonoids, Phenols and Total Antioxidant Capacity
The net photosynthetic rates (Pn) were measured according to Zhang et al. [39]. A portable Photosynthesis System LI-6800 (LI-COR, Lincoln, NE, USA) was used to determine the Pn values of leaves. The light intensity of the detection blade chamber was set to 1100 μmol m−2 s−1, the ratio of red to blue light was nine to one, and the CO2 concentration was 400 μmol mol−1.
The fourth leaf in the sunny position was selected and four leaf discs (7 mm in diameter) were immersed overnight in 1.5 mL of 95% methanol at 4 °C for determinations of flavonoids, phenols, and total antioxidant capacity according to Zhang et al. [39].
2.6. Statistical Analysis
SPSS Statistics 19.0 (IBM, Armonk, NY, USA) was used to analyze the data. One-way analysis of variance (ANOVA) was used to determine statistical significance followed by Duncan’s post hoc test at p < 0.05. SigmaPlot 12.5 (Systat Software Inc., Richmond, VA, USA) was used to conduct linear regression analysis and to plot the data.
3. Results
3.1. Visual Appearance of Agarwood and Essential Oils
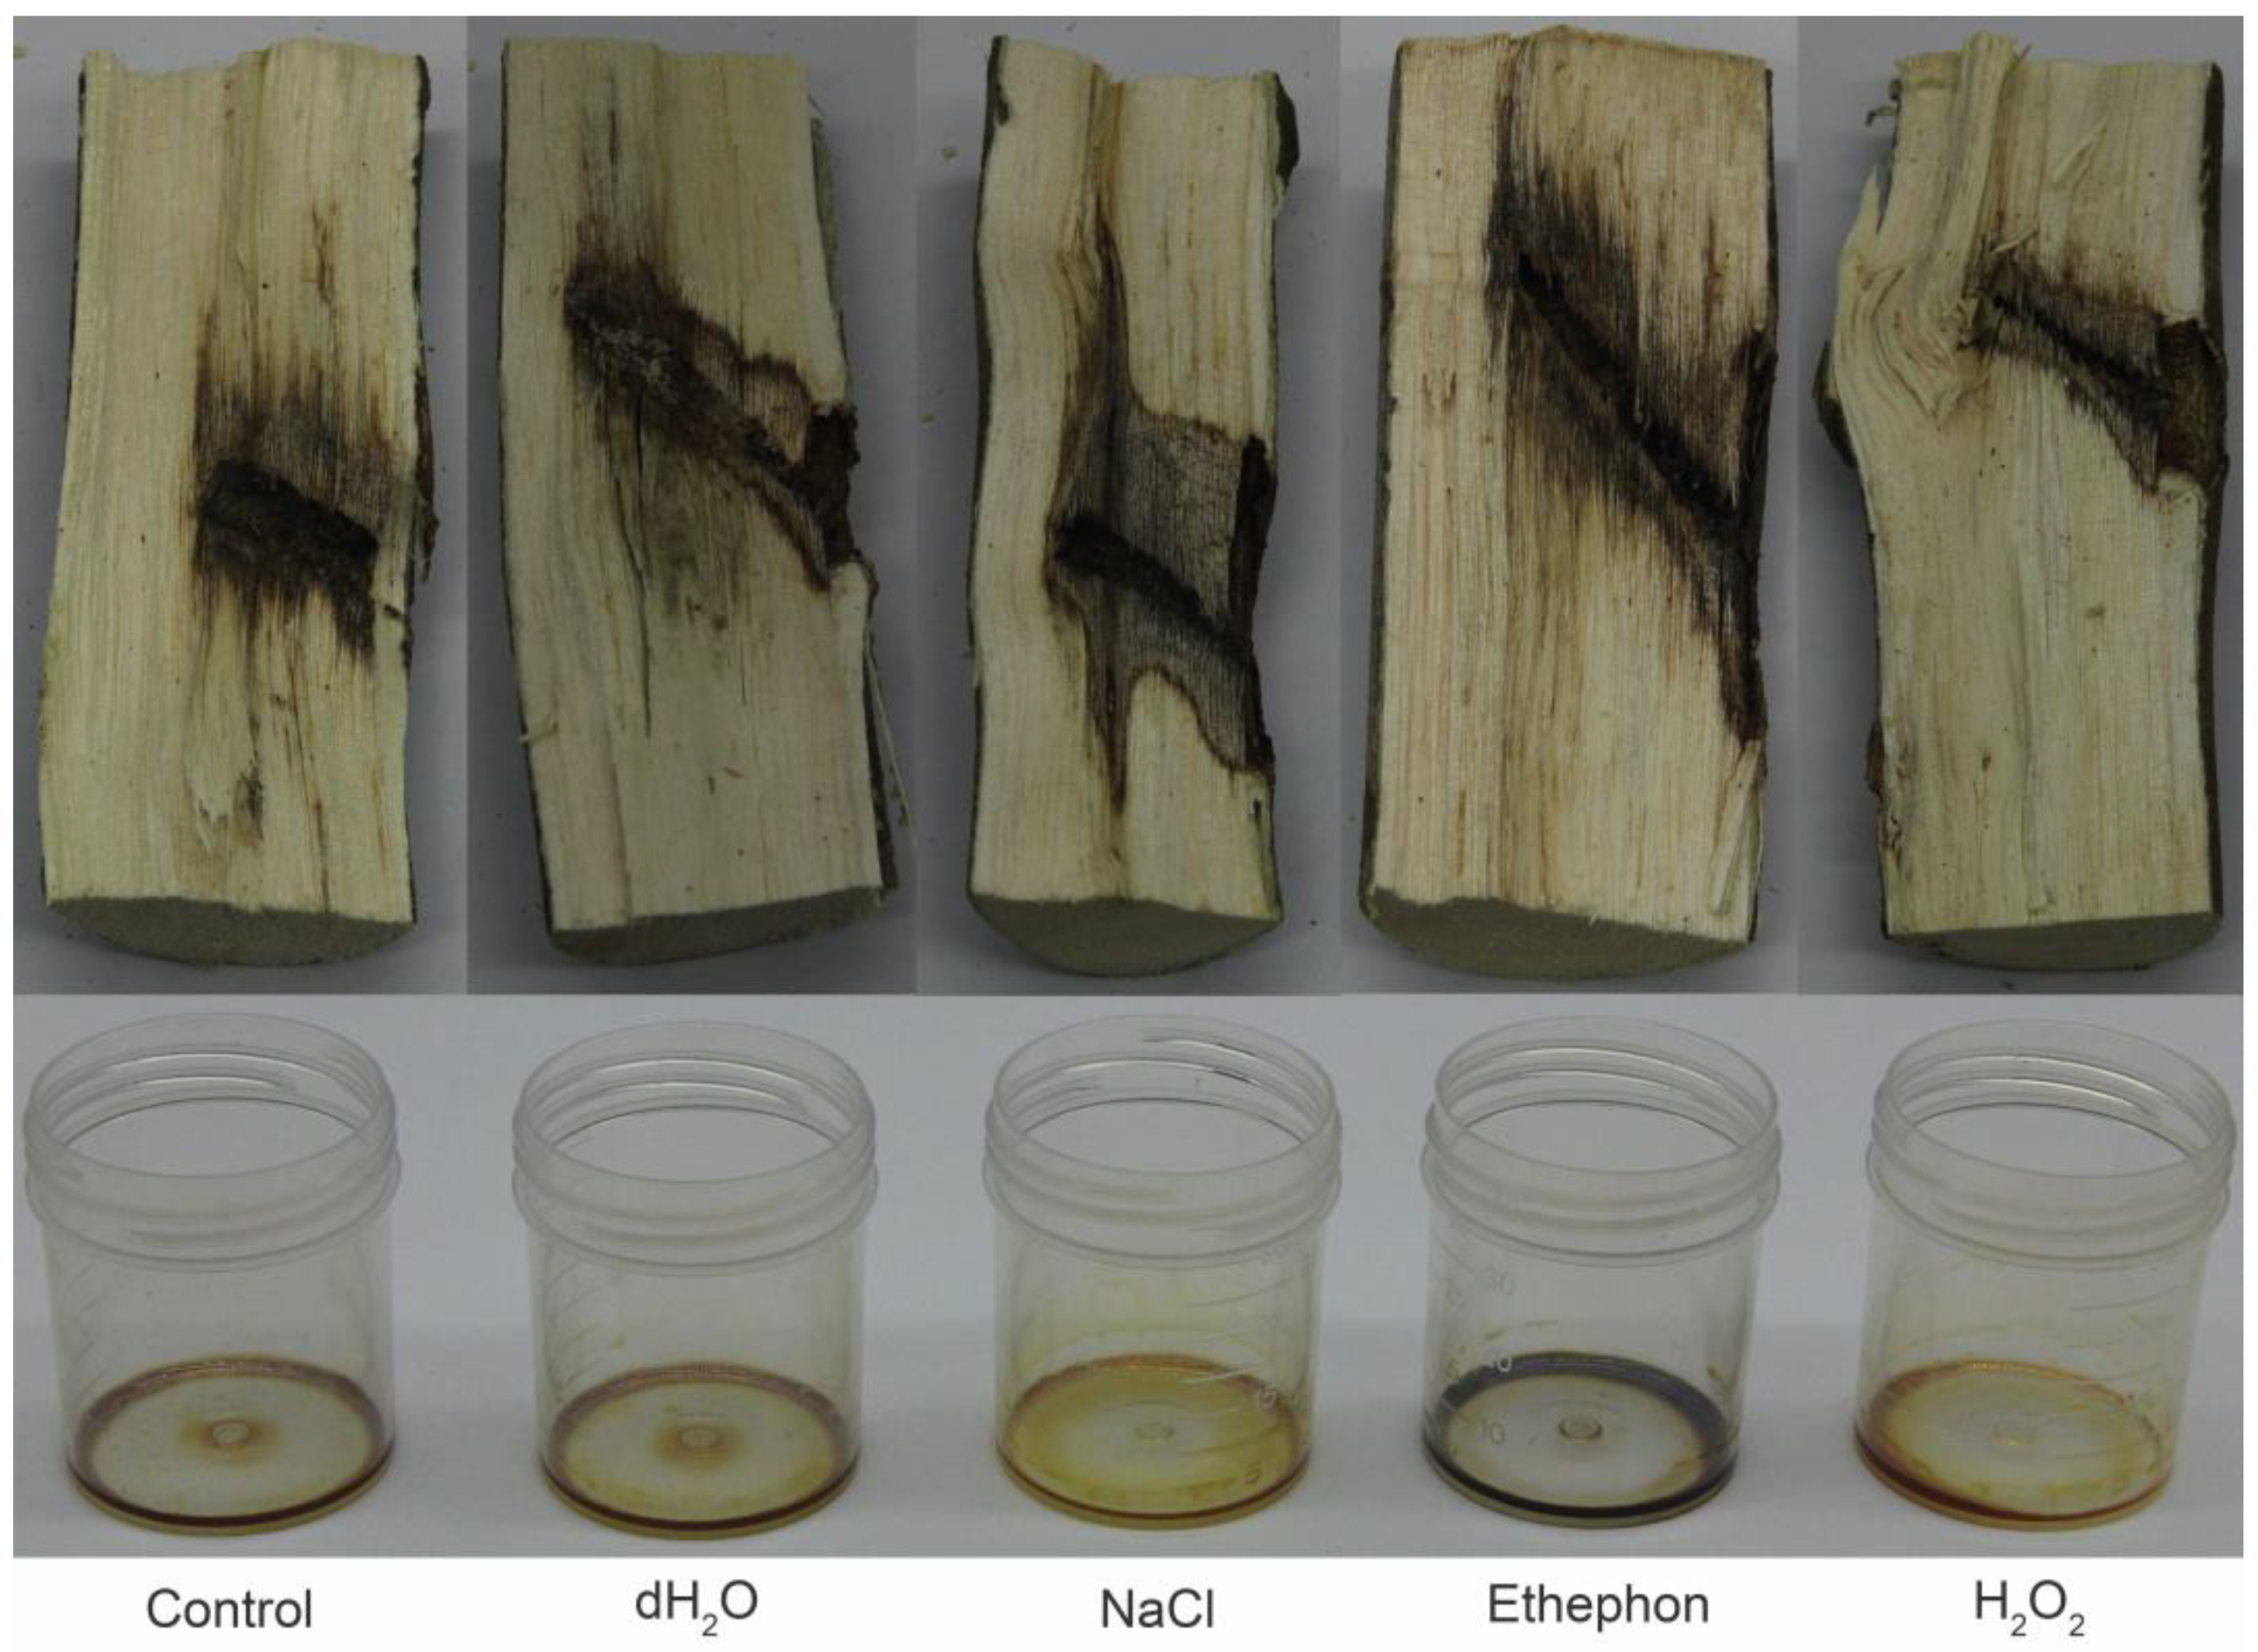
Figure 2 shows the agarwood and essential oil visual appearance. After eight months of treatment, discoloration appeared on both the top and bottom of the holes under different treatment methods. In addition, there were differences in the color change range between the different chemical reagent (NaCl, ethephon, hydrogen peroxide) treatment groups (Figure 2). The color change range of the salt treatment group was the largest. Essential oil was extracted from the discolored part on both the top and bottom of the holes using 95% ethanol, the ethanol and water were removed at 40 °C with a rotary concentrator, and photos were taken. The visual appearance of the essential oils varied between different treatments (Figure 2).
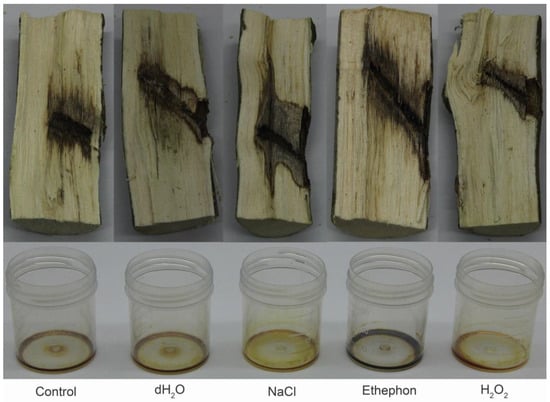
Figure 2.
Visual appearance of agarwood and essential oils. The effects of different treatments on the visual appearance of agarwood and essential oils.
3.2. Changes in the Net Photosynthetic Rates and Antioxidant Capacity
Compared with untreated plants, different treatments significantly reduced the net photosynthetic rate (Pn) of leaves. Among them, the Pn was the lowest in the salt treatment group, while the control and water treatment groups were significantly higher than the ethephon and hydrogen peroxide treatment groups. There was no significant difference between the control and water treatment groups, and no significant difference between the ethephon and hydrogen peroxide treatment groups (Figure 3A). Compared with untreated plants, except for the salt treatment group, all the other treatment groups significantly increased the phenol contents in the leaves, while the phenol contents in the salt treatment group decreased (Figure 3B). The trend of changes in flavonoids and total antioxidant capacity (TAC) was consistent with the trend of changes in phenols contents (Figure 3C,D).
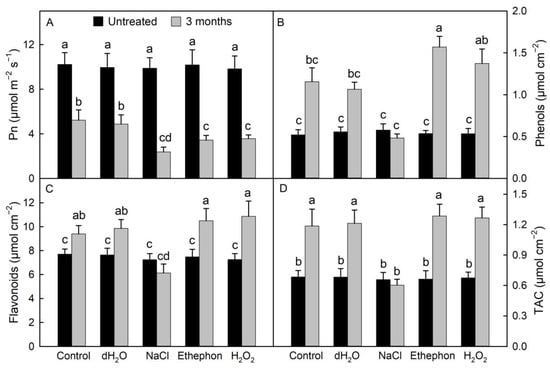
Figure 3.
The effects of different treatments on net photosynthetic rates and antioxidant capacity. Changes of net photosynthetic rates (Pn, (A)), phenols (B), flavonoids (C), and total antioxidant capacity (TAC, (D)). Data are shown as means ± standard deviation of five biological repeats (n = 5). The different lowercase letters (a–d) above bars indicate the statistical significant differences at p < 0.05 level.
3.3. Changes in the Structural and Non-Structural Carbohydrates
The trend of soluble sugars, starch, cellulose, hemicellulose, and lignin in different treatments was consistent during the agarwood formation process of A. sinensis “Qinan”. Compared with untreated plants, the soluble sugar content significantly increased at eight months (Figure 4E). Compared with untreated plants, the starch content significantly decreased at eight months (Figure 4D). There was no significant difference between different treatments after eight months. The cellulose content did not show significant changes in untreated and treated plants, and there was no significant difference between different treatments (Figure 4A). There were no significant changes in the hemicellulose content between untreated plants and after the treatment for eight months, and there was no significant difference between different treatments (Figure 4C). The lignin content did not show significant changes in untreated and treated plants, and there was no significant difference between different treatments (Figure 4B).
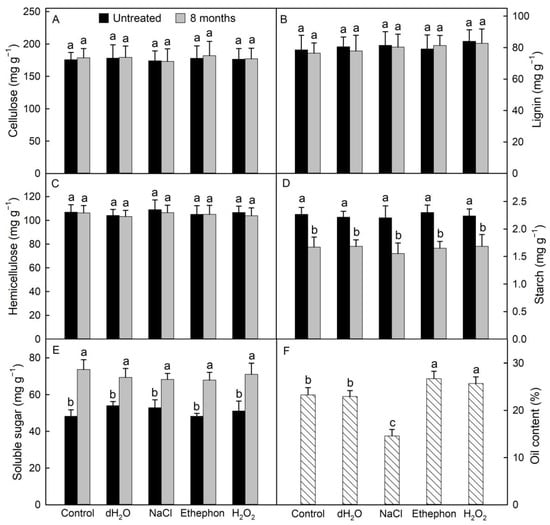
Figure 4.
The effects of different treatments on carbohydrates and oil content. Changes of cellulose (A), lignin (B), hemicellulose (C), starch (D), and soluble sugar (E) content, and the content of essential oil (F). Data are shown as means ± standard deviation of three biological repeats (n = 3). Different lowercase letters (a–c) above bars indicate statistical significant differences at p < 0.05 level.
3.4. Agarwood Essential Oil Content and Components
The results showed that there were significant differences in the oil yield of agarwood under different treatments. The essential oil content of the agarwood treated with ethephon and hydrogen peroxide was significantly higher than that of the other treatment groups, the ethephon treatment group was higher than that of the hydrogen peroxide treatment group, and there was no significant difference between the two groups. The oil content of agarwood in the control and water treatment groups was significantly higher than that in the salt treatment group, and the oil content of agarwood in the salt treatment group was the lowest (Figure 4F). The results imply that the ethephon solution and hydrogen peroxide solution promoted agarwood formation and increased the essential oil content, while the NaCl solution hindered agarwood formation and reduced the essential oil content of A. sinensis “Qinan”.
The GC-MS analysis detected 54 substances in the five treatment groups. The retention times of the essential oils in the different treatment groups was similar, which implies that the essential oil components of the same variety of A. sinensis “Qinan” were similar under different treatments. The retention time of the first peak of the essential oils from different treatment groups (control, dH2O, NaCl, ethephon and H2O2) was the same, at 14.37 min. The retention times of the two main components of agarwood essential oil for each treatment were 50.03 min (2-Phenethyl-4H-chromen-4-one) and 60.41 min (6-Methoxy-2-phenethyl-4H-chromen-4-one) (Figure 5, Table S1). The relative content of component with a retention time of 50.03 min accounted for 26.27%, 25.41%, 30.71%, 19.46%, and 23.15% in the control, dH2O, NaCl, ethephon, and H2O2 treatment groups, respectively. The relative content of component with a retention time of 60.41 min accounted for 27.25%, 26.50%, 31.98%, 23.93%, and 31.11% in the control, dH2O, NaCl, ethephon, and H2O2 treatment groups, respectively.
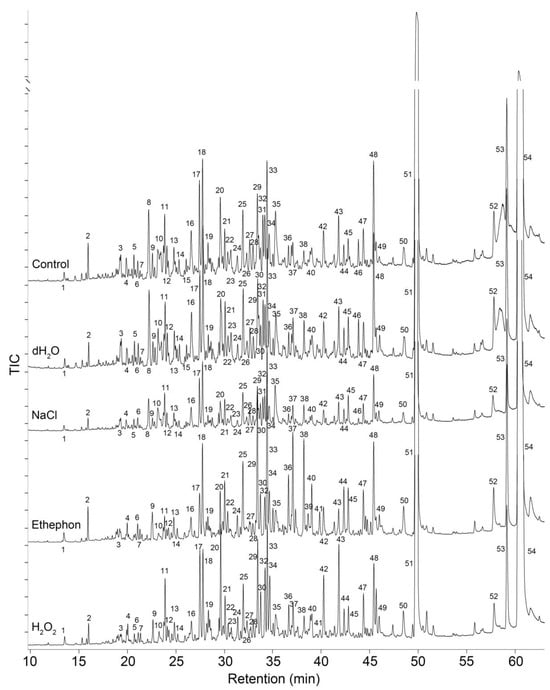
Figure 5.
GC-MS total ion chromatograms of the agarwood essential oils from different treatments. The numbers on the peak represents the peak number.
4. Discussion
During the process of agarwood formation in A. sinensis “Qinan” under different chemical reagents (NaCl, ethephon, and hydrogen peroxide) treatments, the non-structural carbohydrates’ starch content decreased, while the soluble sugar content increased. Under stressful conditions, the important substances for plant physiological adjustments, tolerance, and survival are non-structural carbohydrates [40]. The storage and distribution of non-structural carbohydrates within trees are the basis for revealing their carbon metabolism and ability to cope with environmental stress [41,42]. During the agarwood formation, the main carbon sources were provided through non-structural carbohydrates through the conversion of starch to soluble sugars [43,44,45]. The results showed that the starch content significantly decreased, and the soluble sugar content significantly increased during the fragrance process of agarwood, indicating that starch was decomposed and converted into soluble sugars, which was confirmed in our other study [15]. Cui et al. [27] also found that the content of non-structural carbohydrates gradually decreased during the formation of heartwood in Dalbergia odorifera. Previous studies have shown that during the process of agarwood formation, starch is consumed, broken down into soluble sugars, and converted into essential oil [45,46].
The net photosynthetic rate significantly decreased, while the total antioxidant capacity and the contents of flavonoids and phenols significantly increased during the process of agarwood formation. This suggests a tradeoff between growth and defense during agarwood formation in A. sinensis “Qinan” [14]. Plants encounter both biotic and abiotic stresses during their growth process, thus evolving mechanisms for balancing growth and defense [47]. Plants experience a decrease in growth rate and an increase in defense ability after being damaged [14]. The results showed a significant decrease in net photosynthetic rate compared to untreated plants, which is consistent with our previous research [15]. After being damaged, the plants synthesized secondary metabolites, including flavonoids and phenols, to enhance their defense ability. These secondary metabolites enhanced the antioxidant capacity [39]. In this study, except for the NaCl treatment, total antioxidant capacity and the contents of flavonoids and phenols significantly increased. This may be because salt treatment caused excessive damage to A. sinensis “Qinan” plants.
Ethephon and hydrogen peroxide promoted the formation of agarwood in A. sinensis “Qinan”. Agarwood is a product of the stress response of agarwood trees to physical, chemical, and biological damage. Different ways and degrees of external damage or coercion led to different levels of fragrance formation in agarwood trees [15,23]. In this study, ethephon and hydrogen peroxide treatment promoted the formation of agarwood and increased the essential oil content of agarwood. The essential oil content was significantly higher than the control group and water treatment group, while the essential oil content in the salt treatment group was the lowest. Previous research found that exogenous application of ethylene promoted the formation of heartwood and increased the essential oil content in the discolored part of the heartwood [26,48]. Studies have shown that the activity of peroxidase, phenylalanine ammonia lyase, and terpene synthase increased when using ethylene during the process of heartwood formation in trees [48]. These enzymes played a role in the biosynthesis of terpenes and polyphenols, which increased the content of phenols, terpenes, and other substances related to heartwood, ultimately leading to discoloration of the heartwood [26]. Transcriptome analysis of plant hormone signal transduction revealed that ethylene showed a close crosstalk with H2O2 [49]. In our other study, hydrogen peroxide solution accelerated the formation of D. odorifera heartwood and increased the content of heartwood extract, and the extract composition was closer to the naturally formed heartwood [27]. The superior effect of the H2O2 treatment may be related to its involvement in the wound signal, which in turn illustrates the important role of H2O2 in wound-induced heartwood formation [50]. Exogenous application of H2O2 not only accelerated the growth of young Santalum album but also promoted the formation of heartwood [50]. H2O2 enhanced the activity of sesquiterpene synthase and induced the accumulation of sesquiterpenes in A. sinensis induced by jasmonic acid and salicylic acid [51]. In addition, the hydrogen peroxide solution stimulated ethylene synthesis to enhance the activity of key enzymes, leading to the formation of heartwood [49,52].
In this study, the largest discoloration was in the salt treatment, with the lowest oil yield in the discolored part, significantly lower than other treatment groups. This is inconsistent with the results of our previous research, which found that adding salt after drilling promoted the formation of agarwood and improved the oil yield of the discolored part [23]. This may be the main difference between A. sinensis “Qinan” and ordinary A. sinensis. Aquilaria sinensis “Qinan” was more prone to agarwood formation and had a stronger stress response, while ordinary A. sinensis had a slower agarwood formation and weaker stress response [15,23]. In addition, a three-year-old A. sinensis “Qinan” tree was used, and a nine-year-old ordinary A. sinensis tree was used, which will lead to differences in the resistance to salt stress due to different tree ages [23]. Salt leads to increased water deficit and osmotic stress intensity, making the stress response of A. sinensis trees more intense. Salt caused cell senescence and death, xylem necrosis, and increased discoloration range in A. sinensis trees, while it did not increase the oil content [20]. In our previous study, 712 metabolites were detected through comprehensive metabolite profiling in A. sinensis trees under the process of agarwood formation; however, the salt treatment reduced the number of metabolites [23].
5. Conclusions
A. sinensis trees are mainly planted to harvest agarwood. The main commercial value of the A. sinensis tree lies in its agarwood formation and the essential oil extracted from its agarwood. In this study, we investigated the effects of different chemical reagents (NaCl, ethephon, and hydrogen peroxide) on the formation of agarwood in A. sinensis “Qinan”. We found that the soluble sugar content increased and that the starch content decreased during the agarwood formation process of A. sinensis “Qinan”. The net photosynthetic rate significantly decreased. Except for the NaCl treatment, the total antioxidant capacity and the contents of flavonoids and phenols significantly increased during the process of agarwood formation. Adding ethephon solution or hydrogen peroxide solution during the agarwood formation process of A. sinensis “Qinan” promoted the agarwood formation and increased the essential oil content, while adding NaCl solution hindered the agarwood formation and reduced the essential oil content of A. sinensis “Qinan”. This study implies that ethephon and hydrogen peroxide are effective regulators in the induction of agarwood formation in A. sinensis “Qinan”, which should be used as an option in promoting the process of agarwood formation in A. sinensis “Qinan”. However, the formation of agarwood is a long and complex physiological and biochemical process, is regulated by various factors, and involves multiple signal transduction pathways. In the future, it will be necessary to further explore the regulatory roles of ethephon and hydrogen peroxide in the agarwood formation process of A. sinensis “Qinan” by combining molecular methods.
Supplementary Materials
The following supporting information can be downloaded at: https://www.mdpi.com/article/10.3390/agronomy14081727/s1, Table S1: Chemical constituents in the agarwood essential oils of different treatments.
Author Contributions
Q.Z.: designed and performed the experiments; X.L. (Xiaofei Li) and X.F.: performed experiments; Q.Z. and X.L. (Xiaojin Liu): analyzed and organized the data; Q.Z.: wrote the manuscript; Y.X. and D.X.: revised the manuscript. All authors have read and agreed to the published version of the manuscript.
Funding
This study was funded by the Fundamental Research Funds for the Central Non-profit Research Institution of Chinese Academy of Forestry (CAFYBB2022SY018; CAFYBB2023MB008); the Guangzhou Basic and Applied Basic Research Foundation (2024A04J0121); Guangdong Basic and Applied Basic Research foundation (2024A1515011221), National Forest Technological Achievement Promotion Project (No. 2020133130) and the Guangzhou Collaborative Innovate on Center on Science-tech of Ecology and Landscape (202206010058).
Data Availability Statement
The original contributions presented in the study are included in the article/Supplementary Materials, further inquiries can be directed to the corresponding authors.
Conflicts of Interest
The authors declare that they have no conflict of interest.
References
- Ding, X.P.; Mei, W.L.; Lin, Q.; Wang, H.; Wang, J.; Peng, S.Q.; Li, H.L.; Zhu, J.H.; Li, W.; Wang, P.; et al. Genome sequence of the agarwood tree Aquilaria sinensis (Lour.) Spreng: The first chromosome-level draft genome in the Thymelaeceae family. Gigascience 2020, 9, giaa013. [Google Scholar] [CrossRef] [PubMed]
- Sun, P.W.; Xu, Y.H.; Yu, C.C.; Lv, F.F.; Tang, X.L.; Gao, Z.H.; Zhang, Z.; Wang, H.; Liu, Y.; Wei, J.H. WRKY44 represses expression of the wound-induced sesquiterpene biosynthetic gene ASS1 in Aquilaria sinensis. J. Exp. Bot. 2020, 71, 1128–1138. [Google Scholar] [PubMed]
- Naziz, P.S.; Das, R.; Sen, S. The scent of stress: Evidence from the unique fragrance of agarwood. Front. Plant Sci. 2019, 10, 840. [Google Scholar] [CrossRef] [PubMed]
- CITES. Checklist of CITES Species. 2005. Available online: https://checklist.cites.org (accessed on 23 February 2023).
- López-Sampson, A.; Cernusak, L.A.; Page, T. Relationship between leaf functional traits and productivity in Aquilaria crassna (Thymelaeaceae) plantations: A tool to aid in the early selection of high-yielding trees. Tree Physiol. 2017, 37, 645–653. [Google Scholar] [CrossRef] [PubMed]
- Shivanand, P.; Arbie, N.F.; Krishnamoorthy, S.; Ahmad, N. Agarwood-the fragrant molecules of a wounded tree. Molecules 2022, 27, 3386. [Google Scholar] [CrossRef] [PubMed]
- Huang, J.Q.; Liao, Y.C.; Chen, H.J.; Zhang, Z. Chemical solution is an efficient method to induce the formation of 2-(2-phenylethyl) chromone derivatives in Aquilaria sinensis. Phytochem. Lett. 2017, 19, 64–70. [Google Scholar] [CrossRef]
- Yu, M.; Liu, Y.Y.; Feng, J.; Chen, D.L.; Yang, Y.; Liu, P.W.; Yu, Z.X.; Wei, J.H. Remarkable phytochemical characteristics of Chi-Nan agarwood induced from new-found Chi-Nan germplasm of Aquilaria sinensis compared with ordinary agarwood. Int. J. Anal. Chem. 2021, 2021, 5593730. [Google Scholar] [CrossRef] [PubMed]
- Kang, Y.; Liu, P.W.; Lv, F.F.; Zhang, Y.X.; Yang, Y.; Wei, J.H. Genetic relationship and source species identification of 58 Qi-Nan germplasms of species in China that easily form agarwood. PLoS ONE 2022, 17, e0270167. [Google Scholar] [CrossRef]
- Chhipa, H.; Chowdhary, K.; Kaushik, N. Artificial production of agarwood oil in Aquilaria sp. by fungi: A review. Phytochem. Rev. 2017, 16, 835–860. [Google Scholar] [CrossRef]
- Liao, G.; Dong, W.H.; Yang, J.L.; Li, W.; Wang, J.; Mei, W.L.; Dai, H.F. Monitoring the chemical profile in agarwood formation within one year and speculating on the biosynthesis of 2-(2-phenylethyl) chromones. Molecules 2018, 23, 1261. [Google Scholar] [CrossRef]
- Tan, C.S.; Isa, N.M.; Ismail, I.; Zainal, Z. Agarwood induction: Current developments and future perspectives. Front. Plant Sci. 2019, 10, 122. [Google Scholar] [CrossRef]
- Fang, H.X.; Zhou, Q.; Cheng, S.C.; Zhou, X.; Wei, B.D.; Zhao, Y.B.; Ji, S.J. 24-epibrassinolide alleviates postharvest yellowing of broccoli via improving its antioxidant capacity. Food Chem. 2021, 365, 130529. [Google Scholar] [CrossRef] [PubMed]
- Kashyap, A.; Planas-Marquès, M.; Capellades, M.; Valls, M.; Coll, N.S. Blocking intruders: Inducible physico-chemical barriers against plant vascular wilt pathogens. J. Exp. Bot. 2021, 72, 184–198. [Google Scholar] [CrossRef]
- Zhang, P.; Li, X.F.; Cui, Z.Y.; Xu, D.P. Morphological, physiological, biochemical and molecular analyses reveal wounding-induced agarwood formation mechanism in two types of Aquilaria sinensis (Lour.) Spreng. Ind. Crops Prod. 2022, 178, 114603. [Google Scholar] [CrossRef]
- Li, W.; Chen, H.Q.; Wang, H.; Mei, W.L.; Dai, H.F. Natural products in agarwood and plants: Chemistry, biological activities and biosynthesis. Nat. Prod. Rep. 2021, 38, 528–565. [Google Scholar] [CrossRef]
- Qi, S.Y.; He, M.L.; Lin, L.D.; Zhang, C.H.; Hu, L.J.; Zhang, H.Z. Production of 2-(2-phenylethyl) chromones in cell suspension cultures of Aquilaria sinensis. Plant Cell Tiss. Organ. Cult. 2005, 83, 217–221. [Google Scholar] [CrossRef]
- Naef, R. The volatile and semi-volatile constituents of agarwood, the infected heartwood of Aquilaria species: A review. Flavour Frag. J. 2011, 26, 73–89. [Google Scholar] [CrossRef]
- Ibrahim, S.R.M.; Mohamed, G.A. Natural occurring 2-(2-phenylethyl) chromones, structure elucidation and biological activities. Nat. Prod. Res. 2015, 29, 1489–1520. [Google Scholar] [CrossRef]
- Azren, P.D.; Lee, S.Y.; Emang, D.; Mohamed, R. History and perspectives of induction technology for agarwood production from cultivated Aquilaria in Asia: A review. J. For. Res. 2019, 30, 1–11. [Google Scholar] [CrossRef]
- Ito, M.; Okimoto, K.; Yagura, T.; Honda, G.; Kiuchi, F.; Shimada, Y. Induction of sesquiterpenoid production by methyl jasmonate in Aquilaria sinensis cell suspension culture. J. Essent. Oil Res. 2005, 17, 175–180. [Google Scholar] [CrossRef]
- Liu, Y.Y.; Chen, H.Q.; Yang, Y.; Zhang, Z.; Wei, J.H.; Meng, H.; Chen, W.P.; Feng, J.D.; Gan, B.C.; Chen, X.Y.; et al. Whole-tree agarwood-inducing technique: An efficient novel technique for producing high-quality agarwood in cultivated Aquilaria sinensis trees. Molecules 2013, 18, 3086–3106. [Google Scholar] [CrossRef] [PubMed]
- Zhang, N.N.; Xue, S.Y.; Song, J.; Zhou, X.R.; Zhou, D.H.; Liu, X.J.; Hong, Z.; Xu, D.P. Effects of various artificial agarwood-induction techniques on the metabolome of Aquilaria sinensis. BMC Plant Biol. 2021, 21, 591. [Google Scholar] [CrossRef]
- Carrodus, B.B. Carbon dioxide and formation of heartwood. New Phytol. 1971, 70, 939–943. [Google Scholar] [CrossRef]
- Johannes, S.; Von Weikersthal-Drachenberg, K.F.; Zielen, S. Comparison of outcomes following ultra short course specific immunotherapy in juvenile and adult patients with asthma. Allergy 2008, 63, 526–527. [Google Scholar]
- Nilsson, M.; Wikman, S.; Eklund, L. Induction of discolored wood in scots pine (Pinus sylvestris). Tree Physiol. 2002, 22, 331–338. [Google Scholar] [CrossRef] [PubMed]
- Cui, Z.Y.; Li, X.F.; Xu, D.P.; Yang, Z.J.; Zhang, N.N.; Liu, X.J.; Hong, Z. Physiological changes during heartwood formation induced by plant growth regulators in Dalbergia odorifera (Leguminosae). IAWA J. 2021, 42, 217–234. [Google Scholar] [CrossRef]
- Lin, L.S.; Guo, D.W.; Huang, J.; Zhang, X.D.; Zhang, L.; Wei, C.X. Molecular structure and enzymatic hydrolysis properties of starches from high-amylose maize inbred lines and their hybrids. Food Hydrocoll. 2016, 58, 246–254. [Google Scholar] [CrossRef]
- Liu, F.L.; Jensen, C.R.; Andersen, M.N. Drought stress effect on carbohydrate concentration in soybean leaves and pods during early reproductive development: Its implication in altering pod set. Field Crops Res. 2004, 86, 1–13. [Google Scholar] [CrossRef]
- Han, Y.Y.; Xu, T.Y.; Chen, H.; Tang, M. Sugar metabolism and 14-3-3 protein genes expression induced by arbuscular mycorrhizal fungi and phosphorus addition to response drought stress in Populus cathayana. J. Plant Physiol. 2023, 288, 154075. [Google Scholar] [CrossRef]
- Nazli, R.I.; Gulnaz, O.; Kafkas, E.; Tansi, V. Comparison of different chemical pretreatments for their effects on fermentable sugar production from miscanthus biomass. Biomass Convers. Bior. 2023, 13, 6471–6479. [Google Scholar] [CrossRef]
- Li, Y.H.; Zou, X.B.; Shen, T.T.; Shi, J.Y.; Zhao, J.W.; Holmes, M. Determination of geographical origin and anthocyanin content of black goji berry (Lycium ruthenicum Murr.) using near-infrared spectroscopy and chemometrics. Food Anal. Methods 2017, 10, 1034–1044. [Google Scholar]
- Nguyen, T.T.N.; Trinh, N.Y.; Le, P.K. Recovery yield and bioactivities evaluation on essential oil and ethanolic extract of star anise (Illicium verum Hook. f.). Chem. Eng. J. 2021, 83, 205–210. [Google Scholar]
- Lv, F.F.; Yang, Y.; Sun, P.W.; Zhang, Y.; Liu, P.W.; Fan, X.H.; Xu, Y.H.; Wei, J.H. Comparative transcriptome analysis reveals different defence responses during the early stage of wounding stress in germplasm and ordinary Aquilaria sinensis. BMC Plant Biol. 2022, 22, 464. [Google Scholar] [CrossRef]
- Howes, M.J.R.; Simmonds, M.S.J.; Kite, G.C. Evaluation of the quality of sandalwood essential oils by gas chromatography-mass spectrometry. J. Chromatogr. A 2004, 1028, 307–312. [Google Scholar] [CrossRef] [PubMed]
- Jones, C.G.; Ghisalberti, E.L.; Plummer, J.A.; Barbour, E.L. Quantitative co-occurrence of sesquiterpenes; a tool for elucidating their biosynthesis in Indian sandalwood, Santalum album. Phytochemistry 2006, 67, 2463–2468. [Google Scholar] [CrossRef] [PubMed]
- Samadi, M.; Abidin, Z.Z.; Yoshida, H.; Yunus, R.; Biak, D.R.A. Towards higher oil yield and quality of essential oil extracted from Aquilaria malaccensis wood via the subcritical technique. Molecules 2020, 25, 3872. [Google Scholar] [CrossRef] [PubMed]
- Sciarrone, D.; Costa, R.; Ragonese, C.; Tranchida, P.Q.; Tedone, L.; Santi, L.; Dugo, P.; Dugo, G.; Mondello, L. Application of a multidemensional gas chromatography system with simultaneous mass spectrometric and flame ionization detection to the analysis of sandalwood oil. J. Chromatogr. A 2011, 1218, 137–142. [Google Scholar] [CrossRef]
- Zhang, Q.L.; Liu, X.J.; Xu, D.P.; Hong, Z.; Zhang, N.N.; Cui, Z. Effects of drought and host on the growth of Santalum album seedlings in pot culture. Int. J. Mol. Sci. 2022, 23, 11241. [Google Scholar] [CrossRef]
- Villar-Salvador, P.; Uscola, M.; Jacobs, D.F. The role of stored carbohydrates and nitrogen in the growth and stress tolerance of planted forest trees. New For. 2015, 46, 813–839. [Google Scholar] [CrossRef]
- Hishamuddin, M.S.; Lee, S.Y.; Isa, N.M.; Lamasudin, D.U.; Zainal Abidin, S.A.; Mohamed, R. Time-based LC-MS/MS analysis provides insights into early responses to mechanical wounding, a major trigger to agarwood formation in Aquilaria malaccensis Lam. Rsc. Adv. 2019, 9, 18383–18393. [Google Scholar] [CrossRef]
- Richardson, A.D.; Carbone, M.S.; Keenan, T.F.; Czimczik, C.I.; Hollinger, D.Y.; Murakami, P.; Schaberg, P.G.; Xu, X.M. Seasonal dynamics and age of stem wood nonstructural carbohydrates in temperate forest trees. New Phytol. 2013, 197, 850–861. [Google Scholar] [CrossRef] [PubMed]
- Hartmann, H.; Trumbore, S. Understanding the roles of nonstructural carbohydrates in forest trees-from what we can measure to what we want to know. New Phytol. 2016, 211, 386–403. [Google Scholar] [CrossRef] [PubMed]
- Liu, B.H.; Liang, J.; Tang, G.M.; Wang, X.F.; Liu, F.C.; Zhao, D.C. Drought stress affects on growth, water use efficiency, gas exchange and chlorophyll fluorescence of Juglans rootstocks. Sci. Hortic. 2019, 250, 230–235. [Google Scholar] [CrossRef]
- Liu, P.W.; Zhang, X.L.; Yang, Y.; Sui, C.; Xu, Y.H.; Wei, J.H. Interxylary phloem and xylem rays are the structural foundation of agarwood resin formation in the stems of Aquilaria sinensis. Trees-Struct. Funct. 2019, 33, 533–542. [Google Scholar] [CrossRef]
- Seydel, C.; Kitashova, A.; Fürtauer, L.; Nägele, T. Temperature-induced dynamics of plant carbohydrate metabolism. Physiol. Plant. 2021, 174, e13602. [Google Scholar] [CrossRef] [PubMed]
- Figueroa-Macías, J.P.; García, Y.C.; Núñez, M.; Díaz, K.; Olea, A.F.; Espinoza, L. Plant growth-defense trade-offs: Molecular processes leading to physiological changes. Int. J. Mol. Sci. 2021, 22, 693. [Google Scholar] [CrossRef] [PubMed]
- Lin, Z.F.; Zhong, S.L.; Grierson, D. Recent advances in ethylene research. J. Exp. Bot. 2009, 60, 3311–3336. [Google Scholar] [CrossRef] [PubMed]
- Vanderauwera, S.; Zimmermann, P.; Rombauts, S.; Vandenabeele, S.; Langebartels, C.; Gruissem, W.; Inzé, D.; Van Breusegem, F. Genome-wide analysis of hydrogen peroxide-regulated gene expression in Arabidopsis reveals a high light-induced transcriptional cluster involved in anthocyanin biosynthesis. Plant Physiol. 2005, 139, 806–821. [Google Scholar] [CrossRef] [PubMed]
- Li, Y.; Zhang, X.H.; Cheng, Q.W.; da Silva, J.A.T.; Fang, L.; Ma, G.H. Elicitors modulate young sandalwood (Santalum album L.) growth, heartwood formation, and concrete oil synthesis. Plants 2021, 10, 339. [Google Scholar] [CrossRef]
- Lv, F.F.; Li, S.S.; Feng, J.; Liu, P.W.; Gao, Z.H.; Yang, Y.; Xu, Y.H.; Wei, J.H. Hydrogen peroxide burst triggers accumulation of jasmonates and salicylic acid inducing sesquiterpene biosynthesis in wounded Aquilaria sinesis. J. Plant Physiol. 2019, 234, 167–175. [Google Scholar] [CrossRef]
- Hieno, A.; Naznin, H.A.; Inaba-Hasegawa, K.; Yokogawa, T.; Hayami, N.; Nomoto, M.; Tada, Y.; Yokogawa, T.; Higuchi-Takeuchi, M.; Hanada, K.; et al. Transcriptome analysis and identification of a transcriptional regulatory network in the response to H2O2. Plant Physiol. 2019, 180, 1629–1646. [Google Scholar] [CrossRef] [PubMed]


Disclaimer/Publisher’s Note: The statements, opinions and data contained in all publications are solely those of the individual author(s) and contributor(s) and not of MDPI and/or the editor(s). MDPI and/or the editor(s) disclaim responsibility for any injury to people or property resulting from any ideas, methods, instructions or products referred to in the content. |
© 2024 by the authors. Licensee MDPI, Basel, Switzerland. This article is an open access article distributed under the terms and conditions of the Creative Commons Attribution (CC BY) license (https://creativecommons.org/licenses/by/4.0/).