
Construction and Application of the Phaeozem Health Evaluation System in Liaoning Province, China


Abstract
:1. Introduction
2. Materials and Methods
2.1. Overview of the Study Area
2.2. Data Sources
2.3. Selection Method of Soil Health Evaluation Index
2.4. Data Processing and Analysis Methods
2.4.1. Principal Component Analysis (PCA)
2.4.2. Construction of Minimum Data Set (MDS)
2.4.3. Grouping and Score Arrangement
2.4.4. Bartlett Test
2.4.5. Fuzzy Mathematics Membership Function
2.4.6. Relevant Calculation Formulas
Coefficient of Variation Calculation
Soil Health Index (SHI) Calculation
3. Results
3.1. Screening the Health Evaluation Index of Phaeozem
3.1.1. Primary Selection of Soil Health Evaluation Indices
Physical Index
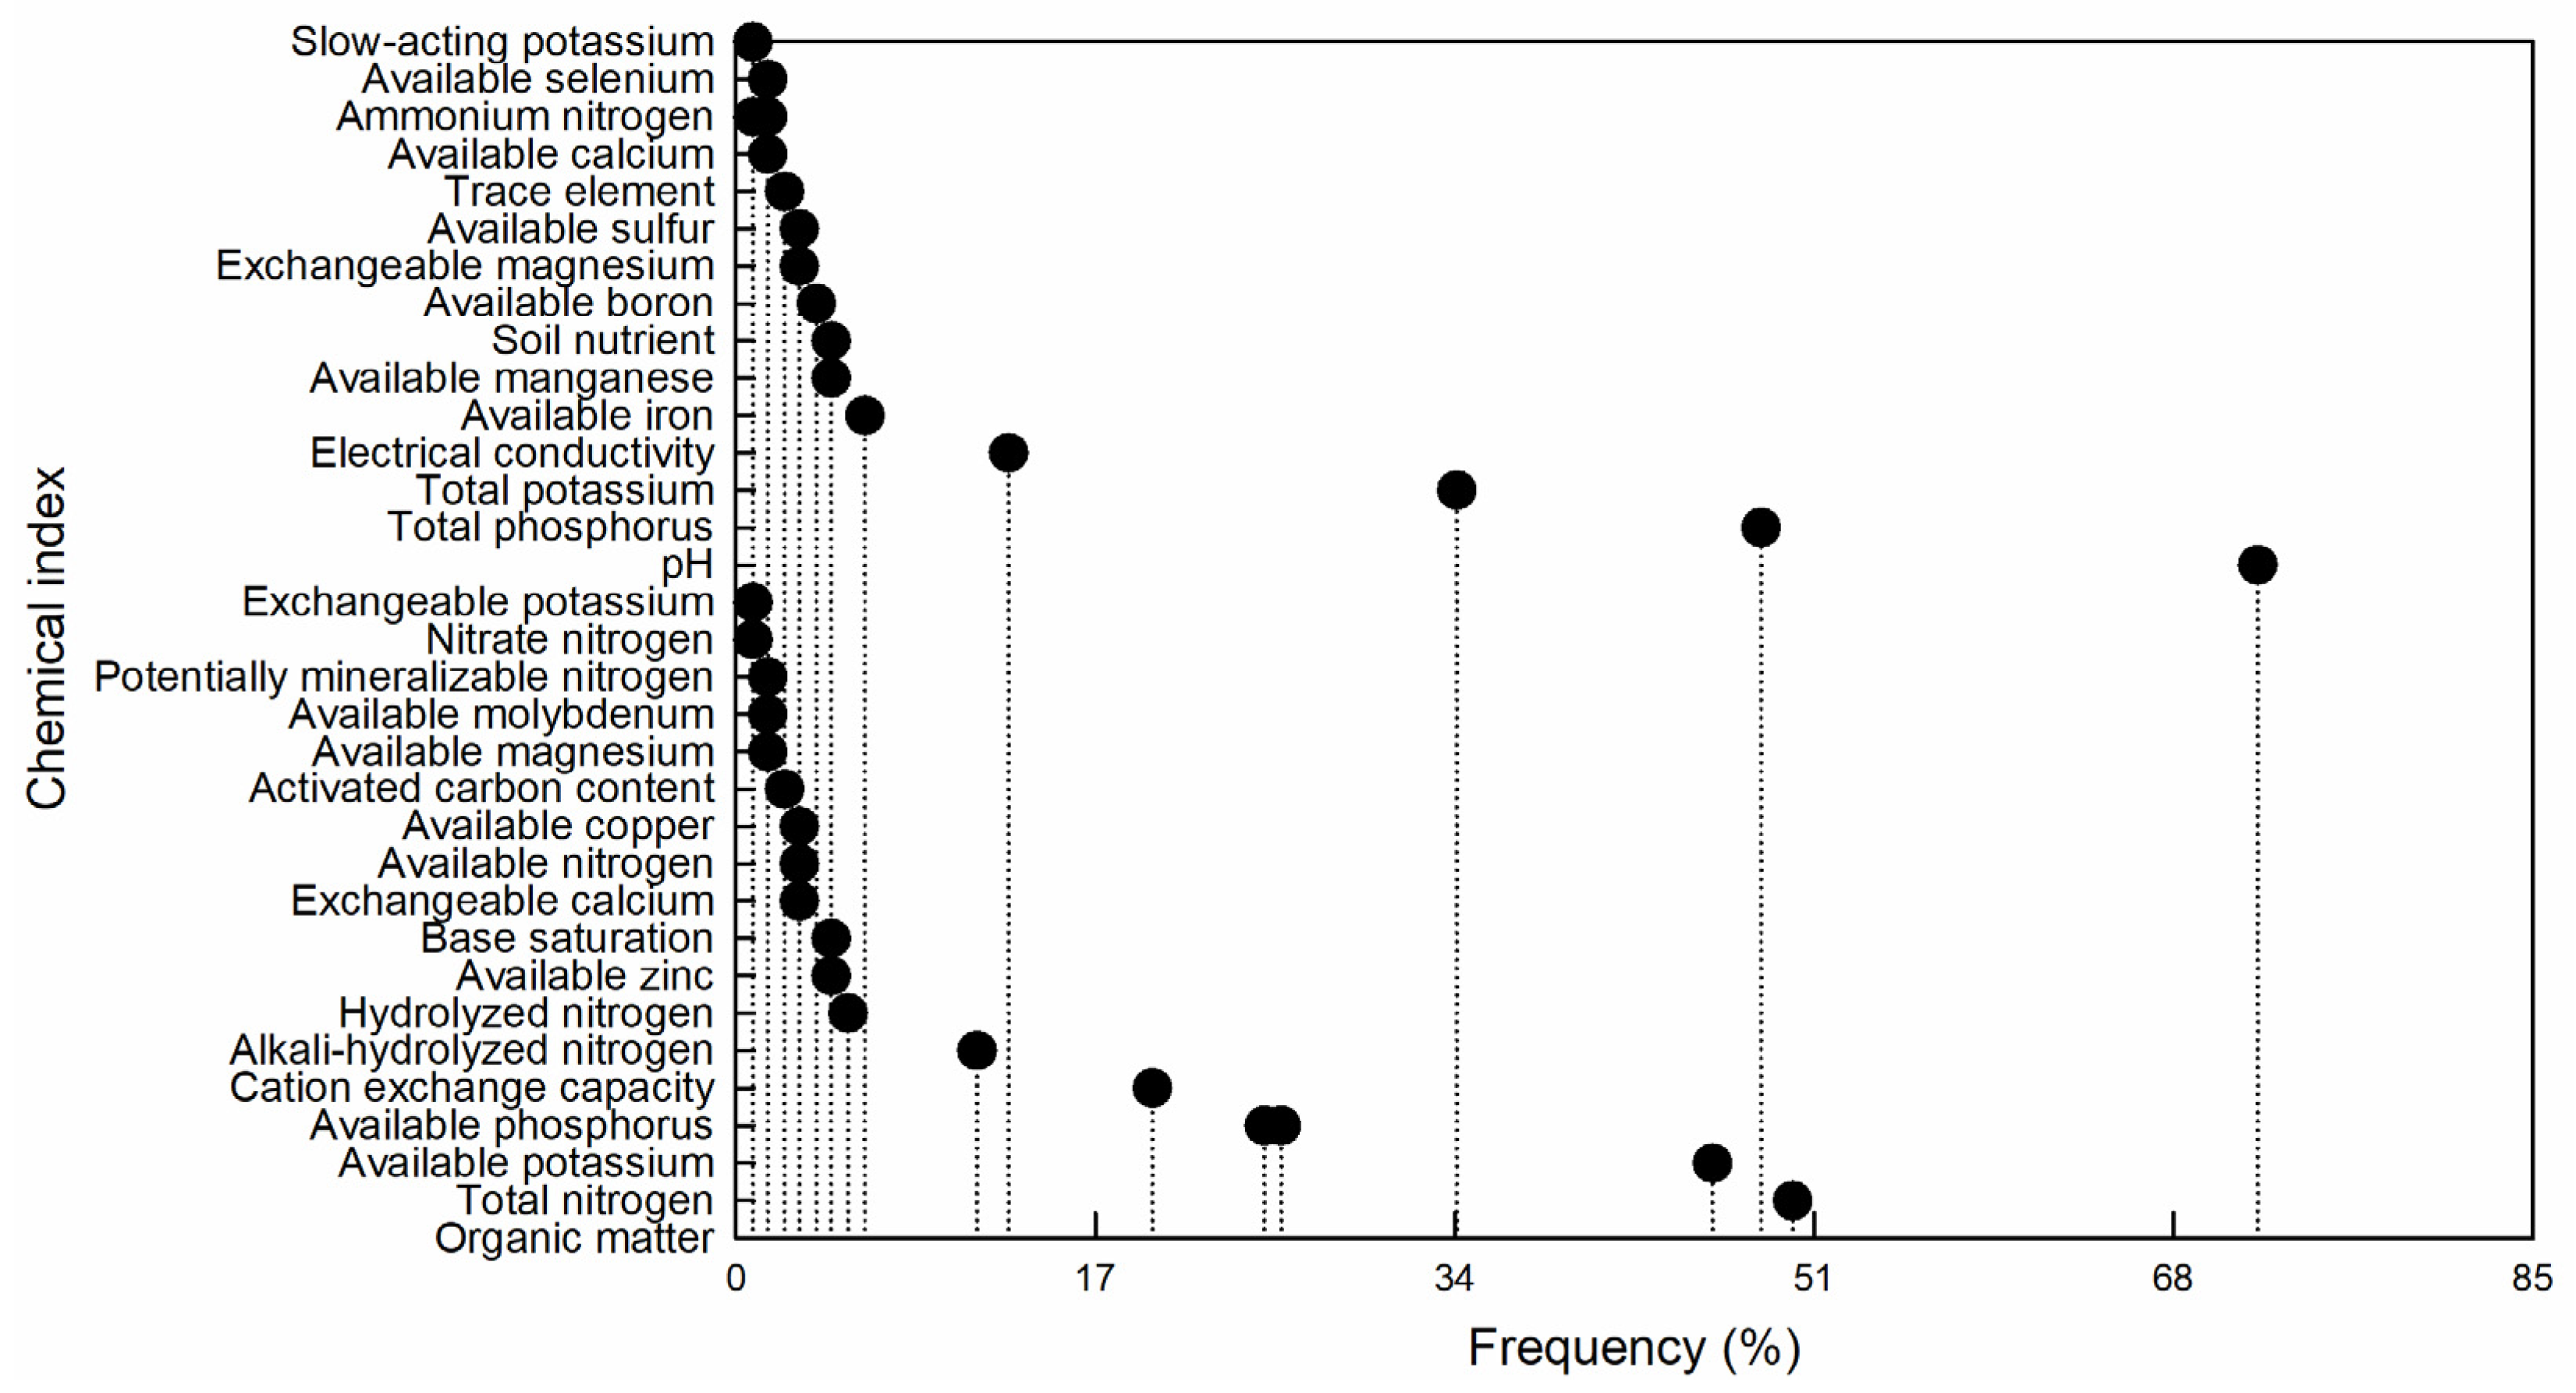
Chemical Index
3.1.2. Preliminary Screening Results of Soil Indices
3.1.3. Minimum Data Set Construction
3.2. Soil Health Evaluation
3.2.1. Determining Membership Function
3.2.2. Calculating Index Weight
3.2.3. Coefficient of Variation for Soil Health Evaluation Index
3.2.4. Reasonableness Validation of the Minimum Data Set
3.2.5. Soil Health Index and Grading System
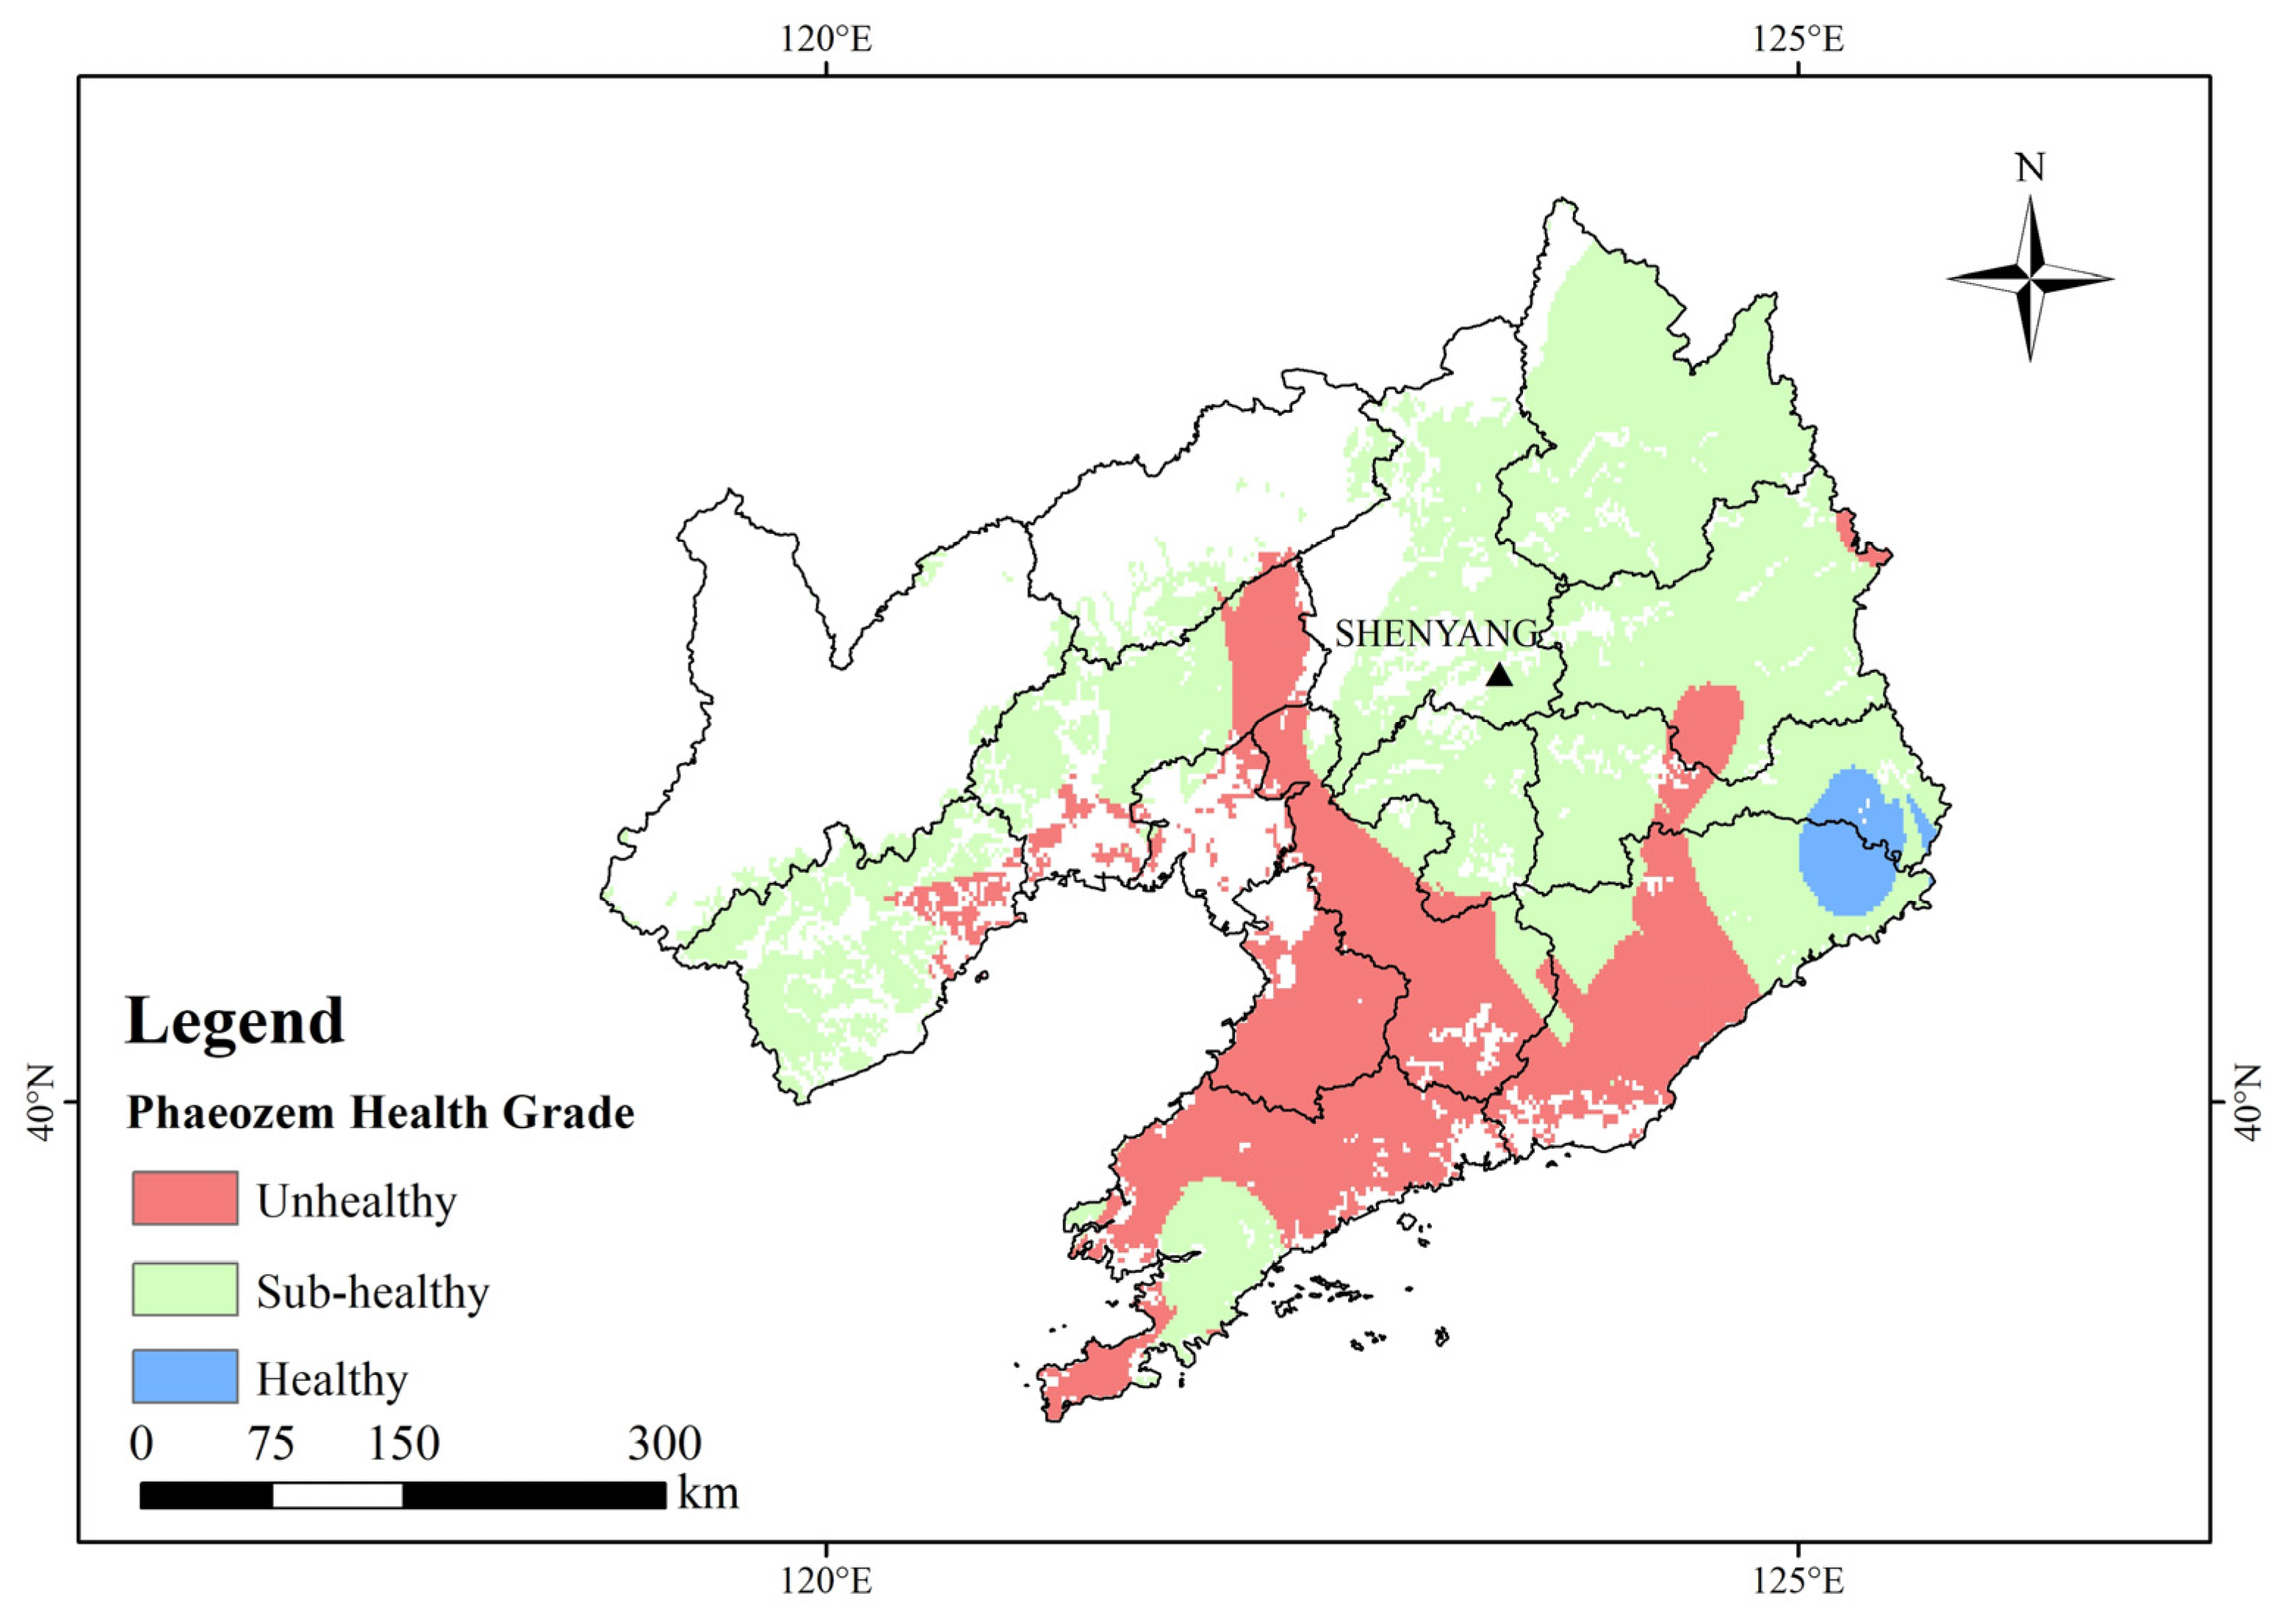
3.3. Soil Health Evaluations
4. Discussion
4.1. Minimum Data Set Indices
4.2. The Soil Health Status of the Phaeozem in Liaoning Province
5. Conclusions
Author Contributions
Funding
Data Availability Statement
Acknowledgments
Conflicts of Interest
References
- Han, H.Q.; Wang, X.H.; Niu, L.Z.; Liang, X.J.; Jiang, X.H.; Tan, Z.T. The land-use and land-cover change characteristics and driving forces of cultivated land in Central Asian countries from 1992 to 2015. Chin. J. Eco-Agric. 2021, 29, 325–339. [Google Scholar]
- Wu, K.N.; Yang, Q.J.; Zhao, R. A Discussion on Soil Health Assessment of Arable Land in China. Acta Pedol. Sin. 2021, 58, 537–544. [Google Scholar]
- Chen, W.; Cai, W.; Zhang, C.; Zhou, W.; Che, X.; Zhang, X.; Liu, Z.; Zeng, J.; Wang, G. Analysis of spatiotemporal pattern global grain security risks. Chin. J. Agric. Resour. Reg. Plan. 2023, 44, 38–51. [Google Scholar]
- Han, X.; Li, N. Research Progress of Black Soil in Northeast China. Sci. Geogr. Sin. 2018, 38, 1032–1041. [Google Scholar]
- Han, X.Z.; Zou, W.X. Effects and suggestions of black Soil protection and soil fertility increase in Northeast China. Bull. Chin. Acad. Sci. 2018, 33, 206–212. [Google Scholar]
- Zhang, X.; Liu, X. Key issues of mollisols research and soil erosion control strategies in China. Bull. Soil. Water Conserv. 2020, 40, 340–344. [Google Scholar]
- Zhang, J.; Li, Y.; Li, Y.; Zhang, J.; Zhang, F. Advances in the Indicator System and Evaluation Approaches of Soil Health. Acta Pedol. Sin. 2022, 59, 603–616. [Google Scholar]
- Zhang, G.L.; Zhu, A.X.; Shi, Z.; Wang, Q.B.; Liu, Y.B.; Zhang, X.C.; Shi, Z.H.; Yang, J.L.; Liu, F.; Song, X.; et al. Progress and future prospect of soil geography. Prog. Geogr. 2018, 37, 57–65. [Google Scholar]
- Kinoshita, R.; Moebius-clune, B.N.; Vanes, H.M.; Hively, W.D.; Bilgili, A.V. Strategies for soil quality assessment using visible and near-infrared reflectance spectroscopy in a Western Kenya chronosequence. Soil Sci. Soc. Am. J. 2012, 76, 1776–1788. [Google Scholar] [CrossRef]
- Doran, J.W.; Stamatiadis, S.; Haberern, J. Soil health as an indicator of sustainable management. Agric. Ecosyst. Environ. 2002, 88, 107–110. [Google Scholar] [CrossRef]
- Schindelbeck, R.R.; Vanes, H.M.; Abawi, G.S. Comprehensive assessment of soil quality for landscape and urban management. Landsc. Urban Plan. 2008, 88, 73–80. [Google Scholar] [CrossRef]
- Fine, A.K.; van Es, H.M.; Schindelbeck, R.R. Statistics, scoring functions and regional analysis of a comprehensive soil health database. Soil Sci. Soc. Am. J. 2017, 81, 589–601. [Google Scholar] [CrossRef]
- Doran, J.W.; Sarrantonio, M.; Liebig, M.A. Soil health and sustainability. Adv. Agron. 1996, 56, 1–54. [Google Scholar]
- Andrews, S.S.; Karlen, D.L.; Cambardella, C.A. The soil management assessment framework: A quantitative soil quality evaluation method. Soil Sci. Soc. Am. J. 2004, 68, 1945–1962. [Google Scholar] [CrossRef]
- Jiang, Y.; Sun, Z.; Zheng, Y.; Wang, H.; Wang, J. Establishing a Soil Health Assessment System for Quaternary Red Soils (Luvisols) under Different Land Use Patterns. Agronomy 2023, 13, 2026. [Google Scholar] [CrossRef]
- Boriani, E.; Benfenati, E.; Baderna, D.; Thomsen, M. Application of ERICA index to evaluation of soil ecosystem health according to sustainability threshold for chemical impact. Sci. Total Environ. 2013, 443, 134–142. [Google Scholar] [CrossRef] [PubMed]
- Shen, R.F.; Teng, Y. The frontier of soil science: Soil health. Pedosphere 2023, 33, 6–7. [Google Scholar] [CrossRef]
- Kooch, Y.; Amani, M.; Abedi, M. Vegetation degradation threatens soil health in a mountainous semi-arid region. Sci. Total Environ. 2022, 830, 154827. [Google Scholar] [CrossRef] [PubMed]
- Guo, M.X. Soil Health Assessment and Management: Recent Development in Science and Practices. Soil Syst. 2021, 5, 61. [Google Scholar] [CrossRef]
- Wang, L.; Ren, Q.; Yang, S. Study on terrain classification standard and zoning scheme of Liaoning Province. J. Liaoning Norm. Univ. Nat. Sci. Ed. 2015, 38, 391–398. [Google Scholar]
- Zhou, X.; Zhao, C. Analysis of Changes in the Old and New Climate Averages and Impactsin Liaoning Province. Desert Oasis Meteorol. 2023, 17, 149–156. [Google Scholar]
- Zhang, G.L.; Wang, Q.B.; Han, C.L.; Sun, F.J.; Sun, Z.X. Soil Series of China—Liaoning Volume; Science Press: Beijing, China, 2020. [Google Scholar]
- Office of National Soil Survey. China Soil Species; China Agricultural Publishing House: Beijing, China, 1994; Volume 2. [Google Scholar]
- Jia, W.J. Liaoning Soil; Liaoning Science and Technology Press: Shenyang, China, 1992. [Google Scholar]
- Du, Z.F. Multivariate Statistical Analysis; Tsinghua University Publishing House Co., Ltd.: Beijing, China, 2016. [Google Scholar]
- Doran, J.W.; Parkin, T.B. Quantitative Indicators of Soil Quality: A Minimum Data Set. In Soil Science Society of America Special Publication 49; American Society of Agronomy: Madison, WI, USA, 1996; pp. 25–37. [Google Scholar]
- Li, G.; Chen, J.; Sun, Z.; Chan, M. Establishing a minimum dataset for quality assessment based on soil properties and land use change. Acta Ecol. Sin. 2007, 27, 2715–2724. [Google Scholar] [CrossRef]
- Wang, X.; Jin, L.; Fu, M. Research on Fuzzy Plastic Constitutive Model Based on Membership Function. Math. Probl. Eng. 2021, 2021, 9901948. [Google Scholar] [CrossRef]
- Sheng, F. Introduction and application of Cornell Soil Health Assessment. Chin. J. Soil Sci. 2014, 45, 1289–1296. [Google Scholar]
- Andrews, S.S.; Karlen, D.L.; Mitchell, J.P. A comparison of soil quality indexing methods for vegetable production systems in northern California. Agric. Ecosyst. Environ. 2002, 90, 25–45. [Google Scholar] [CrossRef]
- Moebius-Clune, B.N.; Moebius-Clune, B.K.; Gugino, B.K.; Idowu, O.J.; Schindelbeck, R.R.; Ristow, A.J.; Van Es, H.M.; Thies, J.E.; Shayler, H.A.; McBride, M.B. Comprehensive Assessment of Soil Health-The Cornell Framework Manual, 3.1 ed.; Cornell University: Geneva, Switzerland; New York, NY, USA, 2016. [Google Scholar]
- Jian, J.; Du, X.; Stewart, R.D. A database for global soil health assessment. Sci. Data 2020, 7, 16. [Google Scholar] [CrossRef] [PubMed]
- Stewart, R.D.; Jian, J.; Gyawali, A.J.; Thomason, W.E.; Brain, D.; Mark, S.; Strickland, M.S. What we talk about when we talk about soil health. Agric. Environ. Lett. 2018, 3, 5–9. [Google Scholar] [CrossRef]
- Karlen, D.L.; Veum, K.S.; Sudduth, K.A.; Obrycki, J.F.; Nunes, M.R. Soil health assessment: Past accomplishments, current activities, and future opportunities. Soil Tillage Res. 2019, 195, 104365. [Google Scholar] [CrossRef]
- Rinot, O.; Levy, G.J.; Steinberger, Y.; Svoray, T.; Eshel, G. Soil health assessment: A critical review of current methodologies and a proposed new approach. Sci. Total Environ. 2019, 648, 1484–1491. [Google Scholar] [CrossRef]
- Maurya, S.; Abraham, J.S.; Somasundaram, S.; Ravi, T.; Renu, G.; Seema, M. Indicators for Assessment of Soil Quality: A Mini-Review; Springer International Publishing: Berlin/Heidelberg, Germany, 2020; Volume 192, p. 604. [Google Scholar]
- Zhu, M.; Xu, D.; Chen, G.; Li, P.; Cheng, Q.; Chen, C. Assessment on soil quality under different land use patterns in Karst area based on Minimum Data Set. Acta Agrestia Sin. 2021, 29, 2323–2331. [Google Scholar]
- Wang, X.; Qu, Y.; Zhao, W.; Ma, J. Soil screening levels in the United States and implication for soil evaluation in China. Earth Sci. Front. 2024, 31, 64–76. [Google Scholar]
- Vincent, P.O.; Rattan, L. Towards a standard technique for soil quality assessment. Geoderma 2016, 265, 96–102. [Google Scholar]
- Liu, S.L.; Fu, B.J.; Liu, G.H.; Ma, K.M. Research review of Quantitative evaluation of soil quality in China. Chin. J. Soil. Sci. 2006, 37, 137–143. [Google Scholar]
- Tang, L.J. Land Health Evaluation Research. In Black Soil Region in Jilin Based on the Geochemistry of Element; Jilin University: Changchun, China, 2015. [Google Scholar]
- Yuan, Y.; Wang, H.; Luo, Y.; Sui, P.X.; Li, R.P.; Zheng, H.B.; Bu, J.; Liu, W.R.; Zheng, J.Y. Evaluation of Tillage Practices on the Soil Quality of Black Soil Farmland Based on the Minimum Data Set. J. Maize Sci. 2023, 31, 148–157. [Google Scholar]
- Su, H.; Li, X.Y.; Wu, C.F. Mechanism of factors influencing the cultivated land system health in the Black Soil region of Northeast China: A Case Study of Keshan County. Econ. Geogr. 2024, 44, 151–160. [Google Scholar]
- Zhao, Z.; Liu, G.; Liu, Q.; Huang, C.; Li, H.; Wu, C. Distribution Characteristics and Seasonal Variation of Soil Nutrients in the Mun River Basin, Thailand. Int. J. Environ. Res. Public Health 2018, 15, 1818. [Google Scholar] [CrossRef]
- Huang, R.; Gao, X.S.; Wang, F.H.; Xu, G.X.; Long, Y.; Wang, C.Q.; Wang, Z.F.; Gao, M. Effects of biochar incorporation and fertilizations on nitrogen and phosphorus losses through surface and subsurface flows in a sloping farmland of Entisol. Agric. Ecosyst. Environ. 2020, 300, 106988. [Google Scholar] [CrossRef]


| Membership Function Type | Calculation Formula | Parameter Descriptions |
|---|---|---|
| Upwards membership function | Y(x): membership function x: Measured value of index a: Lower threshold b: Upper threshold | |
| Downward membership function | ||
| Peak-type membership function | y(x): membership function | |
| x: Measured value of index | ||
| a1: Lower threshold | ||
| a2: Upper threshold | ||
| b1: Lower limit of optimum value | ||
| b2: Upper limit of optimum value |
| Data | Primary Indices | ||||||||||
|---|---|---|---|---|---|---|---|---|---|---|---|
| First group | Black soil thickness | Pedon thickness | Bulk density | Organic matter | pH | Total nitrogen | Total phosphorus | Total potassium | Sand content | Silt content | Clay content |
| Second group | Black soil thickness | Pedon thickness | Organic matter | pH | Total nitrogen | Total phosphorus | Total potassium | Sand content | Silt content | Clay content | |
| Indicator Name | Characteristic Root | Variance Interpretation Rate (%) | Accumulation (%) | Characteristic Root | Variance Interpretation Rate (%) | Accumulation (%) |
|---|---|---|---|---|---|---|
| Sand content | 2.61 | 23.74 | 23.74 | 2.61 | 23.74 | 23.74 |
| Silt content | 1.57 | 14.25 | 37.99 | 1.57 | 14.25 | 37.98 |
| Clay content | 1.48 | 13.52 | 51.50 | 1.49 | 13.52 | 51.50 |
| Bulk density | 1.39 | 12.68 | 64.18 | 1.39 | 12.68 | 64.18 |
| Black soil thickness | 1.05 | 9.54 | 73.72 | 1.05 | 9.54 | 73.72 |
| Total phosphorus | 0.88 | 8.02 | 81.74 | |||
| Total potassium | 0.62 | 5.61 | 87.35 | |||
| Pedon thickness | 0.55 | 4.97 | 92.32 | |||
| Organic matter | 0.45 | 4.05 | 96.36 | |||
| pH | 0.39 | 3.56 | 99.92 | |||
| Total nitrogen | 0.01 | 0.08 | 100 |
| Name | Principal Component | ||||
|---|---|---|---|---|---|
| PC1 | PC2 | PC3 | PC4 | PC5 | |
| Sand content | 0.933 | −0.208 | 0.051 | 0.141 | −0.072 |
| Silt content | −0.749 | 0.225 | 0.125 | 0.243 | 0.167 |
| Clay content | −0.696 | 0.058 | −0.212 | −0.476 | −0.055 |
| Bulk density | 0.606 | 0.225 | −0.181 | −0.248 | 0.378 |
| Black soil thickness | 0.298 | 0.706 | −0.224 | 0.082 | −0.011 |
| Total phosphorus | 0.065 | −0.666 | −0.45 | 0.303 | −0.091 |
| Total potassium | 0.259 | 0.214 | 0.628 | −0.528 | −0.086 |
| Pedon thickness | −0.069 | 0.566 | −0.600 | 0.224 | −0.181 |
| Organic matter | −0.265 | 0.058 | 0.576 | 0.538 | −0.207 |
| pH | 0.285 | 0.326 | 0.215 | 0.508 | −0.059 |
| Total nitrogen | −0.107 | −0.040 | 0.083 | 0.229 | 0.88 |
| Name | Sand Content | Silt Content | Clay Content | Bulk Density | Total Potassium | Organic Matter | Pedon Thickness | Total Phosphorus | Black Soil Thickness | Total Nitrogen | pH |
|---|---|---|---|---|---|---|---|---|---|---|---|
| Norm | 4.65 | 3.91 | 3.88 | 3.47 | 3.30 | 3.25 | 3.24 | 3.22 | 3.16 | 3.91 | 2.72 |
| Name | Black Soil Thickness | Pedon Thickness | Sand Content | Silt Sand | Clay Sand | Bulk Density | pH | Organic Matter | Total Nitrogen | Total Phosphorus | Total Potassium |
|---|---|---|---|---|---|---|---|---|---|---|---|
| Black soil thickness | 1 | ||||||||||
| Pedon thickness | 0.389 ** | 1 | |||||||||
| Sand content | 0.131 | −0.103 | 1 | ||||||||
| Silt sand | −0.131 | 0.078 | −0.780 ** | 1 | |||||||
| Clay sand | −0.129 | 0.076 | −0.746 ** | 0.188 | 1 | ||||||
| Bulk density | 0.236 * | 0.01 | 0.364 ** | −0.280 * | −0.265 * | 1 | |||||
| pH | 0.14 | 0.062 | 0.18 | 0.004 | −0.299 ** | 0.148 | 1 | ||||
| Organic matter | −0.028 | −0.093 | −0.102 | 0.255 * | −0.091 | −0.391 ** | 0.149 | 1 | |||
| Total nitrogen | −0.005 | −0.079 | −0.06 | 0.12 | −0.029 | 0.016 | −0.031 | 0.077 | 1 | ||
| Total phosphorus | −0.196 | −0.063 | 0.152 | −0.138 | −0.087 | −0.082 | −0.09 | −0.102 | −0.02 | 1 | |
| Total potassium | 0.076 | −0.276 * | 0.145 | −0.179 | −0.063 | 0.137 | 0.005 | 0.028 | −0.111 | −0.390 ** | 1 |
| Indicator Name | Characteristic Root | Variance Interpretation Rate % | Accumulation % | Characteristic Root | Variance Interpretation Rate % | Accumulation % |
|---|---|---|---|---|---|---|
| Black soil thickness | 2.967 | 29.67 | 29.67 | 2.967 | 29.67 | 29.67 |
| Pedon thickness | 2.482 | 24.819 | 54.489 | 2.482 | 24.819 | 54.489 |
| Sand content | 1.533 | 15.334 | 69.823 | 1.533 | 15.334 | 69.823 |
| Silt content | 0.936 | 9.356 | 79.179 | |||
| Clay content | 0.883 | 8.834 | 88.013 | |||
| pH | 0.466 | 4.657 | 92.669 | |||
| Organic matter | 0.442 | 4.424 | 97.093 | |||
| Total nitrogen | 0.239 | 2.394 | 99.487 | |||
| Total phosphorus | 0.047 | 0.472 | 99.959 | |||
| Total potassium | 0.004 | 0.041 | 100 |
| Name | Principal Component | ||
|---|---|---|---|
| PC1 | PC2 | PC3 | |
| Black soil thickness | 0.025 | −0.152 | −0.16 |
| Pedon thickness | 0.056 | −0.176 | 0.168 |
| Sand content | −0.21 | 0.292 | 0 |
| Silt content | 0.231 | −0.221 | −0.136 |
| Clay content | 0.114 | −0.299 | 0.244 |
| pH | −0.163 | −0.019 | 0.467 |
| Organic matter | 0.141 | 0.117 | −0.441 |
| Total nitrogen | 0.251 | 0.205 | 0.21 |
| Total phosphorus | 0.255 | 0.198 | 0.214 |
| Total potassium | 0.219 | 0.174 | 0.133 |
| Name | Total Phosphorus | Total Nitrogen | Sand Content | Silt Content | Clay Content | Total Potassium | pH | Organic Matter | Pedon Thickness | Black Soil Thickness |
|---|---|---|---|---|---|---|---|---|---|---|
| Norm | 4.96 | 4.95 | 4.95 | 4.7 | 4.38 | 4.22 | 3.86 | 3.78 | 2.56 | 2.15 |
| Name | Black Soil Thickness | Pedon Thickness | Sand Content | Silt Sand | Clay Sand | pH | Organic Matter | Total Nitrogen | Total Phosphorus | Total Potassium |
|---|---|---|---|---|---|---|---|---|---|---|
| Black soil thickness | 1 | |||||||||
| Pedon thickness | 0.107 | 1 | ||||||||
| Sand content | −0.199 * | −0.269 ** | 1 | |||||||
| Silt content | 0.148 | 0.229 * | −0.839 ** | 1 | ||||||
| Clay content | 0.193 | 0.267 ** | −0.788 ** | 0.464 ** | 1 | |||||
| pH | −0.133 | −0.069 | 0.194 | −0.434 ** | 0.191 | 1 | ||||
| Organic matter | 0.021 | −0.252* | −0.111 | 0.189 | −0.217 * | −0.511 ** | 1 | |||
| Total nitrogen | −0.085 | −0.026 | −0.081 | 0.15 | −0.02 | −0.146 | 0.229 * | 1 | ||
| Total phosphorus | −0.094 | 0.007 | −0.095 | 0.165 | −0.004 | −0.154 | 0.226 * | 0.995 ** | 1 | |
| Total potassium | −0.157 | −0.018 | −0.079 | 0.146 | −0.002 | −0.207 * | 0.231 * | 0.633 ** | 0.631 ** | 1 |
| Name | Total Data Set | Minimum Data Set | ||
|---|---|---|---|---|
| Common Factor Variance | Weights | Common Factor Variance | Weights | |
| Pedon thickness | 0.769 | 4.05% | 0.521 | 9.97% |
| Sand content | 0.94 | 13.06% | 0.851 | 16.29% |
| Silt content | 0.714 | 11.66% | 0.87 | 16.65% |
| Organic matter | 0.737 | 10.29% | 0.63 | 12.06% |
| Total nitrogen | 0.848 | 13.16% | 0.818 | 15.66% |
| Total potassium | 0.793 | 9.34% | 0.603 | 11.54% |
| Total phosphorus | 0.75 | 13.19% | 0.61 | 11.68% |
| pH | 0.495 | 10.73% | 0.322 | 6.16% |
| Black soil thickness | 0.645 | 2.98% | ||
| Clay content | 0.762 | 11.53% | ||
| Bulk density | 0.655 | 8.78% | ||
| Name | Pedon Thickness | Sand Content | Silt Content | Organic Matter | Total Nitrogen | Total Potassium | Total Phosphorus | pH |
|---|---|---|---|---|---|---|---|---|
| SD | 48.73 | 17.68 | 11.6 | 12.84 | 0.45 | 9.41 | 0.89 | 0.86 |
| Mean | 123.17 | 42.93 | 33.68 | 22.09 | 0.88 | 21.69 | 0.91 | 6.39 |
| CV | 39.56% | 41.19% | 34.43% | 58.13% | 50.79% | 43.38% | 97.50% | 13.41% |
Disclaimer/Publisher’s Note: The statements, opinions and data contained in all publications are solely those of the individual author(s) and contributor(s) and not of MDPI and/or the editor(s). MDPI and/or the editor(s) disclaim responsibility for any injury to people or property resulting from any ideas, methods, instructions or products referred to in the content. |
© 2024 by the authors. Licensee MDPI, Basel, Switzerland. This article is an open access article distributed under the terms and conditions of the Creative Commons Attribution (CC BY) license (https://creativecommons.org/licenses/by/4.0/).
Share and Cite
Jiang, Y.; Sun, Z.; Liu, S.; Wang, J. Construction and Application of the Phaeozem Health Evaluation System in Liaoning Province, China. Agronomy 2024, 14, 1754. https://doi.org/10.3390/agronomy14081754
Jiang Y, Sun Z, Liu S, Wang J. Construction and Application of the Phaeozem Health Evaluation System in Liaoning Province, China. Agronomy. 2024; 14(8):1754. https://doi.org/10.3390/agronomy14081754
Chicago/Turabian StyleJiang, Yingying, Zhongxiu Sun, Shan Liu, and Jiaqing Wang. 2024. "Construction and Application of the Phaeozem Health Evaluation System in Liaoning Province, China" Agronomy 14, no. 8: 1754. https://doi.org/10.3390/agronomy14081754