Article

Assessment of Effectiveness and Suitability of Soil and Water Conservation Measures on Hillslopes of the Black Soil Region in Northeast China

1
College of Resources and Environment, Jilin Agricultural University, Changchun 130118, China
2
State Key Laboratory of Black Soils Conservation and Utilization, Northeast Institute of Geography and Agroecology, Chinese Academy of Sciences, Harbin 150081, China
*
Authors to whom correspondence should be addressed.
Agronomy 2024, 14(8), 1755; https://doi.org/10.3390/agronomy14081755 (registering DOI)
Submission received: 2 July 2024 / Revised: 5 August 2024 / Accepted: 8 August 2024 / Published: 10 August 2024
(This article belongs to the Special Issue Effective Soil and Water Conservation Practices in Agriculture)

Abstract

:
There are four sizable black soil regions throughout the world, all of which are valuable natural resources. The black soil region in Northeast China is a major foundation for grain production. Serious risks of soil erosion do exist, and they have an immediate impact on both the country’s food security and future ecological security. Many soil and water conservation measures have been put in place to control soil erosion. However, how effective and suitable are these measures? Currently, systematic analyses and assessments are lacking. The objective of this study was to assess the effectiveness and suitability of soil and water conservation measures on hillslopes using the comprehensive index method and the Pressure–State–Response model. The categorization of effectiveness and suitability of these measures were similar for both methods: that is, very effective and suitable measures included no-tillage + straw mulch and ridge belt or contour ridge. The two methods validated one another. Thus, this categorization standard is useful for choosing the best soil and water conservation measures for different soil erosion regions.

1. Introduction

Globally, soil erosion is a problem that leads to land degradation, reduction of cultivated land, deterioration of water quality, environmental pollution, etc. [1,2,3]. The existing research on soil erosion mainly focuses on types [4,5], processes [6,7], influence factors [8,9], hazards [10,11], and models [12,13]. These studies are useful in revealing the mechanism of soil erosion and in controlling it through the application of appropriate soil and water conservation measures. Thus, soil erosion is always a worldwide research hotspot.
To mitigate severe soil erosion, many soil and water conservation measures have been put into place. Three categories of these measures are tillage, engineering, and biological measures [14,15,16]. Representative tillage measures include contour ridge [17], crop rotation [18], minimal tillage and no-tillage [19], and straw return [20]. Representative engineering measures include terrace [21], fish-scale pit [22], sand barrier [23], and small storage and drainage project on hillslope [24]. Representative biological measures include ecological restoration [25], agricultural protection forest [26], plant hedge [27], and grass waterway [28]. According to [15], annual runoff and soil erosion are typically reduced by 53% and by 84% after applying soil and water conservation measures. However, different measures have unique regional efficacy and applicability. Therefore, more research on the assessment of effectiveness and suitability of soil and water conservation measures is still urgently needed to choose the best measures and configure them properly.
The assessment of effectiveness and suitability is the foundation of scientific use of soil and water conservation measures, which is connected to soil erosion control effects and agricultural sustainable development [29]. While accounting for economic and social benefits, the effectiveness and suitability are primarily determined by ecological benefits [30]. The assessment is a complex process that involves many factors of the social, economic, and natural ecological environment, and each factor includes multiple subfactors that interact with one other [31]. Many indicators have been used to assess different soil and water conservation measures [32,33,34], such as soil erosion degree, soil erosion intensity, soil erosion control area, soil organic matter content, soil conservation rate, biological diversity, frequency of drought and flood disasters, reservoir capacity loss, grain yield, gross farm production, per capita net income, gross value of social products, etc. Nevertheless, not much research has been performed to assess the effectiveness and suitability of these measures. Therefore, it is still challenging to determine which indicators to utilize and what techniques to apply to systematically assess the effectiveness and suitability of soil and water conservation measures.
There are four sizable black soil regions in the world, which are the Northeast Plain in China, the Ukrainian Plain in Ukraine, the Mississippi Plain in the United States, and the Pampas steppe extending from Argentina to Uruguay in South America [35]. Due to their great fertility, these black soil regions produce goods of superior quality [36]. However, serious erosion and degradation are plaguing black soil worldwide [20,37,38,39]. With regard to the black soil region in Northeast China, the primary causes of soil erosion are water force, wind force, and freeze–thaw cycles [5]. According to the China Soil and Water Conservation Bulletin from 2023, the area affected by soil erosion is 208,900 km2, accounting for 19.2% of its total land area of 1,087,600 km2. Soil erosion is most common in sloping farmland, which accounts for 46.39% of the soil erosion area [40,41]. This can lower the grain yield by up to 14.7% annually [42]. Therefore, both national food security and additional ecological security are directly affected by soil erosion. Soil and water conservation measures can protect the black soil resources and also preserve the capacity of land production [16,36,43]. However, the objective assessment of these measures is particularly deficient because the work was started later than expected in the black soil region of Northeast China.
The process of calculating the comprehensive index involves first choosing representative indicators based on the multilevel continuous assessment [30] and comparative analysis of soil and water conservation [44]. Next, the weight of each indicator value is determined using a combination of subjective weighting (expert experience method, analytic hierarchy process) [45,46] and objective weighting (coefficient of variation method, principal component analysis method) [47,48]. Finally, the comprehensive index is obtained using weighted summation and the geometric average method. A framework model made up of pressure, state, and response indexes is the Pressure–State–Response (PSR) model. The pressure refers to the load caused by human activities to the environment and natural resources; the state refers to the quality of the environment and natural resources; the response refers to the natural, economic, and social measures taken by human beings. The PSR model is typically used to assess flood resilience [49], ecosystem health [50], ecosystem resilience [51], and agricultural sustainability [52]. When assessing the benefits of soil and water conservation measures, the comprehensive index is typically employed, while the PSR model is rarely used.
This study closes the knowledge gap regarding the assessment of effectiveness and suitability of soil and water conservation measures on hillslopes of black soil regions. By analyzing the data based on field monitors, radioactive tracers, simulated rainfall, and simulated inflow from our research team and the other pertinent literatures on the black soil region of Northeast China, the comprehensive index method and PSR model were applied and compared. The aims were (1) to obtain the values of soil erosion reduction ratio, gradation changes of soil erosion intensity, energy value, and proportion of cultivated land occupied; (2) to establish an assessment index system based on the PSR model, and analyze its coordination degrees; and (3) to calculate both the comprehensive indexes and assessment values of the PSR model and categorize the effectiveness and suitability of soil and water conservation measures.

2. Materials and Methods
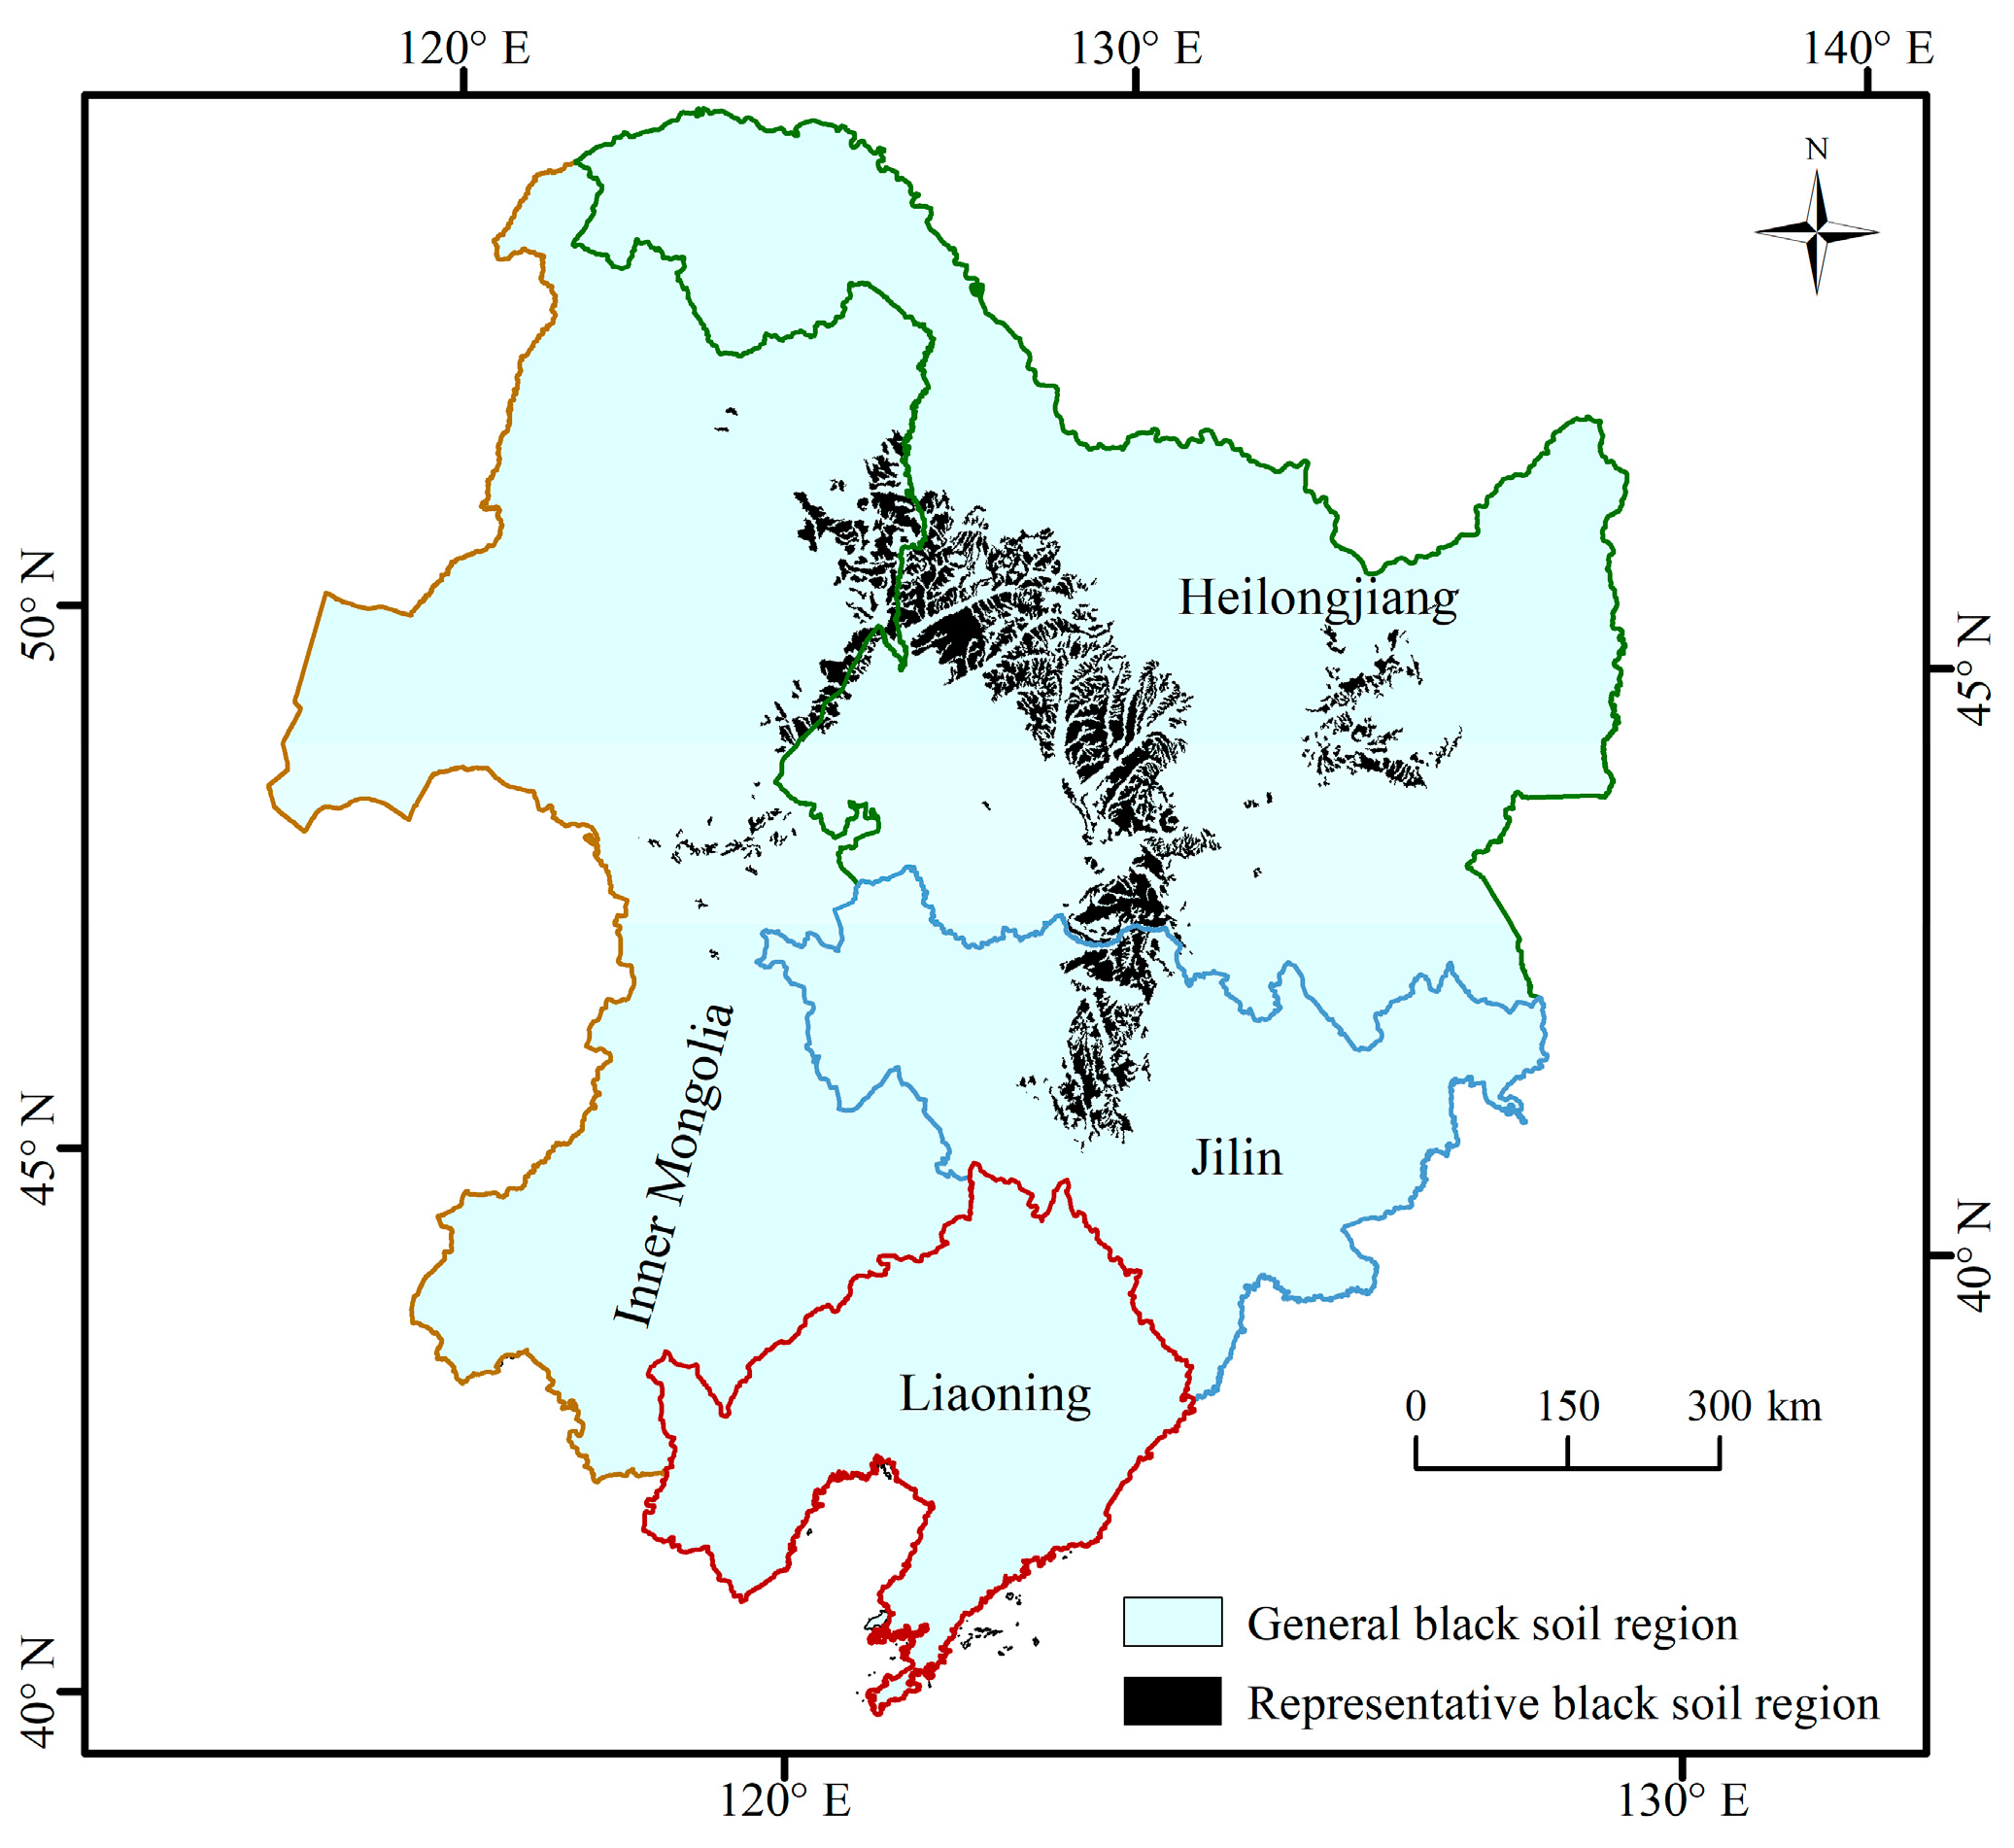
2.1. Study Area

The study area is situated in the black soil region of Northeast China (Figure 1), which extends across Heilongjiang, Jilin, and Liaoning provinces and into part of the Inner Mongolia Autonomous Region with an area of 1,087,600 km2. There is a large distribution of black soil (Chinese Soil Taxonomy) with a sticky soil texture and a high soil organic matter concentration with values of 17.25, 24.12, 26.15, and 40.43 g kg−1 for Liaoning, Inner Mongolia, Jilin, and Heilongjiang, respectively [53,54]. When compared to other regions, the topography’s gentle slope gradients and long slope lengths produce distinct soil erosion processes [7]. The climate of this region is a northern continental monsoon that is moderate and semi-humid. The external agency of soil erosion includes water, wind, freeze–thaw cycles, gravity, etc. [5]. Soil erosion has gotten worse since the 1950s as a result of natural factors and human activities [55].
The mean annual temperature is 4.8 °C. The frost-free period lasts approximately 140 days each year. The mean yearly rainfall fluctuates between 400 and 850 mm, with about 60% of precipitation falling between July and August, and 90% falling between April and September. The maximum wind speeds, which range from 20 to 25 m s−1, happen between March and May. There is a noticeable freeze–thaw cycle as a result of larger daily and annual temperature variations. Gravitational erosion happens all year round; it is most prevalent in the summer. Freeze–thaw action and gravitational erosion usually occur in tandem with water erosion [46]. Soil and water conservation measures mostly include contour ridge, wide ridge, straw return, minimum tillage, no-tillage, terrace, ridge belt, agricultural protection forest, etc., for controlling soil erosion on hillslopes of the black soil region in Northeast China [14].

2.2. Data Sources

The data were obtained from our research team [56,57,58] and other pertinent literature [59,60,61,62,63,64,65] on the Chinese black soil region. These data were from four experimental methods: that is, field monitors, radioactive tracers, simulated rainfall, and simulated inflow. The control treatments included no-ridge (bare fallow), narrow ridge along hillslope, traditional up- and downslope tillage, and the location before the forest belt based on various concrete measures. With regard to each treatment, there were 3–6 repetitions.
For the field monitors [56,59,60,61,62,63,64], natural rainfall processes, wind speeds and directions, temperatures, and other general indicators were recorded using different automatic meteorological stations. The runoff and sediment were observed by traditional runoff collectors such as buckets or automatic collecting devices (xyz-2 type, Harbin, China). The wind-eroded materials were collected by sand-taped instruments (HHH.SCC-X step type, Beijing, China). About 27–51 runoff and sediment samples or wind-eroded materials for each treatment of every year were weighed and oven-dried at 105 °C or 75 °C to calculate the amounts of soil erosion.
For the radioactive tracers [65], the 137Cs and 210Pbex were utilized. Soil samples were taken using the 5 cm diameter soil augers. Next, 704–716 soil samples for each time were put through 2 mm sieves to remove impurities such as grass roots and stones and were crushed after a drying process. The high purity germanium probe γ spectrometer (ORTEC GMX-50220, CANBERRA company, Toledo, USA), which had a measurement range of 3–3 × 10³ keV, was used to test for radioactive elements. Nuclide activity could be used to calculate soil erosion rates.
For simulated rainfall experiments [56], a lateral sprinkler rainfall simulator system was utilized to replicate rainfall. By adjusting the nozzle size and water pressure, rainfall intensities were varied between 30 and 165 mm h−1. The rainfall height was 6 m, and the rainfall uniformity was >85%. A pre-rain with a 30 mm h−1 rainfall intensity was applied to soil pans until surface flow occurred to maintain constant soil water contents. During the rainfall (50 or 100 mm h−1), runoff and sediment samples were measured in 1–2 min intervals. Then, ~30 samples for each treatment were weighed and oven-dried to determine the amounts and rates of runoff and soil erosion.
For simulated inflow experiments [57,58], an overland tank equipped with a clapboard was attached to the upper end of experimental plot to supply inflow water. Additionally, a runoff collector was set up at the base of every runoff plot to gather runoff and sediment samples. Then, ~30 samples for each treatment were weighed and oven-dried to calculate the quantities and rates of runoff and soil erosion.

2.3. Research Methods

2.3.1. Comprehensive Index Method

Four representative indicators, that is, soil erosion reduction ratio, gradation changes of soil erosion intensity, energy value, and proportion of cultivated land occupied, were chosen based on methods of multilevel continuous assessment [30] and comparative analysis of soil and water conservation [44] to evaluate weights and calculate comprehensive indexes.
Each representative indicator’s weight was established by combining the subjective and objective weighting methods [46]. Then, the effectiveness and suitability comprehensive indexes of soil and water conservation measures were assessed using the weighted summation and geometric average method to establish how effective and suitable they were.

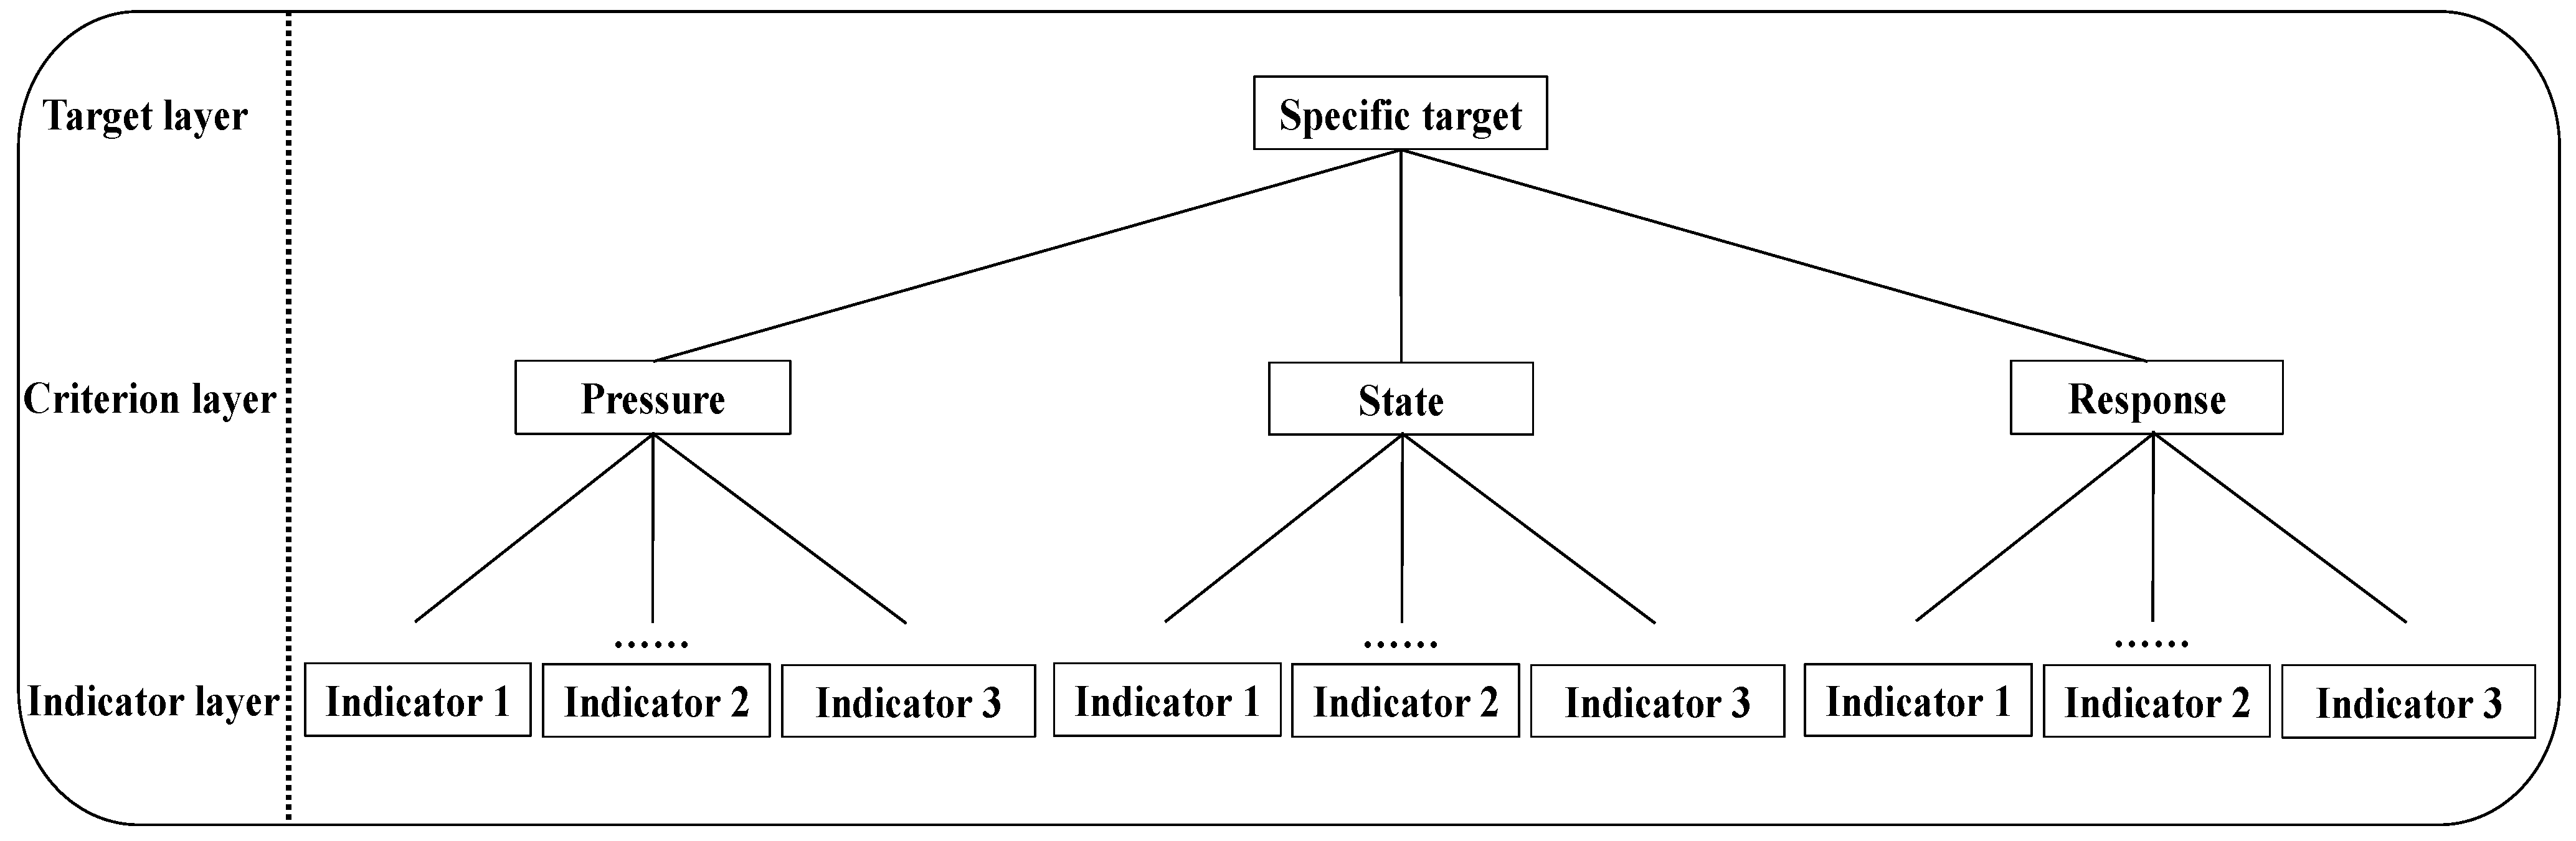
2.3.2. Pressure–State–Response Model

  • Indicator standardization
There were positive and negative indicators affecting the effectiveness and suitability of soil and water conservation measures. The positive indicator was to promote the effectiveness and suitability, and the higher the value, the better the outcome. The negative indicator was to hinder the effectiveness and suitability, and the lower the value, the better the outcome.
To unify units and dimensions of each indicator, a standardization was required [43]. In this study, the maximum–minimum method was adopted to standardize indicators. The formula was as follows:
Positive   indicator :   Y i j = ( X i j X i m i n ) / ( X i m a x X i m i n )
Negative   indicator :   Y i j = ( X i m a x X i j ) / ( X i m a x X i m i n )
where Yij is the standardized value, Xij is the original value, and Ximin and Ximax are the minimum and maximum values for the i-th indicator of the j-th soil and water conservation measure.
  • Determination of assessment indicator weight
The assessment of effectiveness and suitability of soil and water conservation measures was a multi-factor comprehensive assessment process. The assessment region’s features were taken into account when analyzing the relative relevance of each factor in the assessment index system. The mean square error weighting was the primary method used in this study to calculate the weight of each indicator. The specific calculation process was as follows.
First, the degree of dispersion of the random variable yi was calculated. The calculation formula was
E i = 1 n j = 1 n Y i j
where Ei is the mean value of the random variable yi; j is soil and water conservation measure (j = 1, 2, ……, n); and Yij is the standardized value for the i-th indicator of the j-th soil and water conservation measure.
Secondly, the mean square error σi of the random variable yi was calculated. The calculation formula was
σ i = 1 n j = 1 n ( Y i j E i ) 2
Finally, the weight coefficient of Yij relative to each subsystem was calculated. The calculation formula was
w i = σ i / i = 1 m σ i
where wi is the weight coefficient for indicator i (i = 1, 2, ……, m) and i = 1 m σ i is the sum of the mean square error of total m indicators.
  • Scores of effectiveness and suitability
The scores of effectiveness and suitability of soil and water conservation measures were calculated based on the formula as follows.
D j = i = 1 m Y i j w i
where Dj is the score for the i-th indicator of the j-th soil and water conservation measure.
The indicator weight of the criterion layer was obtained in the same way, and finally, the weight coefficient of each indicator at each level was obtained. Then, assessment values of the pressure, state, response, and further scores of effectiveness and suitability of soil and water conservation measures were calculated.
  • Coordination degree analysis of PSR model
The process of putting soil and water conservation measures into place was dynamic, and the only way to increase their efficiency was to repeatedly manage and regulate the situation. The coordination degree between the components of each subsystem of pressure, state, and response determined the effectiveness and suitability of soil and water conservation measures [51]. Any subsystem’s bias would have an effect on its effectiveness and suitability. Thus, this study constructed a coordination degree model of pressure index, state index, and response index and judged the coordination status of the three subsystems. The constructed model was as follows:
C = Y p + Y s + Y R Y p   2 + Y s   2 + Y R   2
where C is the coordination degree index and YP, YS, YR are, respectively, the assessment scores of pressure, state, and response. The closer the scores of each index system are, the closer the C values are, and the higher the assessment value is, indicating the stronger the effectiveness and suitability of soil and water conservation measures.

2.3.3. Categorization of Effectiveness and Suitability

According to the quartile method (25%, 50%, 75%, and 100%) [66], four classes for effectiveness and suitability of soil and water conservation measures were separated: that is, ineffective and unsuitable (<25%), moderately effective and suitable (25–50%), relatively effective and suitable (50–75%), and very effective and suitable (>75%) classes for both the comprehensive index method and the PSR model.

2.4. Defining Indicators

2.4.1. Soil Erosion Reduction Ratio

Soil erosion reduction ratio refers to the proportion of soil erosion reduction amount of a soil and water conservation measure that is compared to that of the control treatment. The specific formula is
S = S C S i S C × 100 %
where ∆S is the soil erosion reduction ratio (%); SC is the soil erosion amount of control treatment (t km−2 y−1); and Si is the soil erosion amount of the i-th soil and water conservation measure (t km−2 y−1).

2.4.2. Gradation Changes of Soil Erosion Intensity

Soil erosion intensity is classified into six classes by using the mean soil erosion modulus (t km−2 y−1), which are slight (≤200), light (200–1200), middle (1200–2400), strong (2400–3600), very strong (3600–4800), and severe (>4800) soil erosion based on ‘Techniques standard for comprehensive control of soil erosion in the black soil region (SL 446—2009)’ [67]. Then, the gradation changes of soil erosion intensity are calculated by subtracting the number of lower levels from the number of higher levels.

2.4.3. Energy Value

Energy analysis is to transform all available energy from different products and resources into solar energy [68]. The energy analysis of soil and water conservation measures on hillslopes is to transform different forms of input into a unified energy value standard to create a unified assessment of various types of substances, energy, and information.
Based on the information gathered from the questionnaire, energy analysis was used to quantify the energy values of soil and water conservation measures on hillslopes. The specific formula is
E = T B
where E is the solar energy (sej); T is the solar energy conversion rate (sej/g or sej/J); and B is the mass (g) or energy (J) contained in a substance.
The energy calculation table [69] is used to compute the solar energy conversion rates (T). The mass or energy values of a substance (B) were computed based on the mechanical fuel consumption value, as well as other costs including labor, machinery, fertilizer, and seed costs. The input was then converted to the mechanical fuel consumption value.

2.4.4. Proportion of Cultivated Land Occupied

The proportion of cultivated land occupied refers to the ratio of land area taken by a soil and water conservation measure that cannot be cultivated to the total area of the original cultivated land. The specific formula is
A = A i A 0 × 100 %
where ∆A is the proportion of cultivated land occupied (%); Ai is the land area taken by the i-th soil and water conservation measure that cannot be cultivated (km2); and A0 is the total area of original cultivated land (km2).

3. Results and Discussion

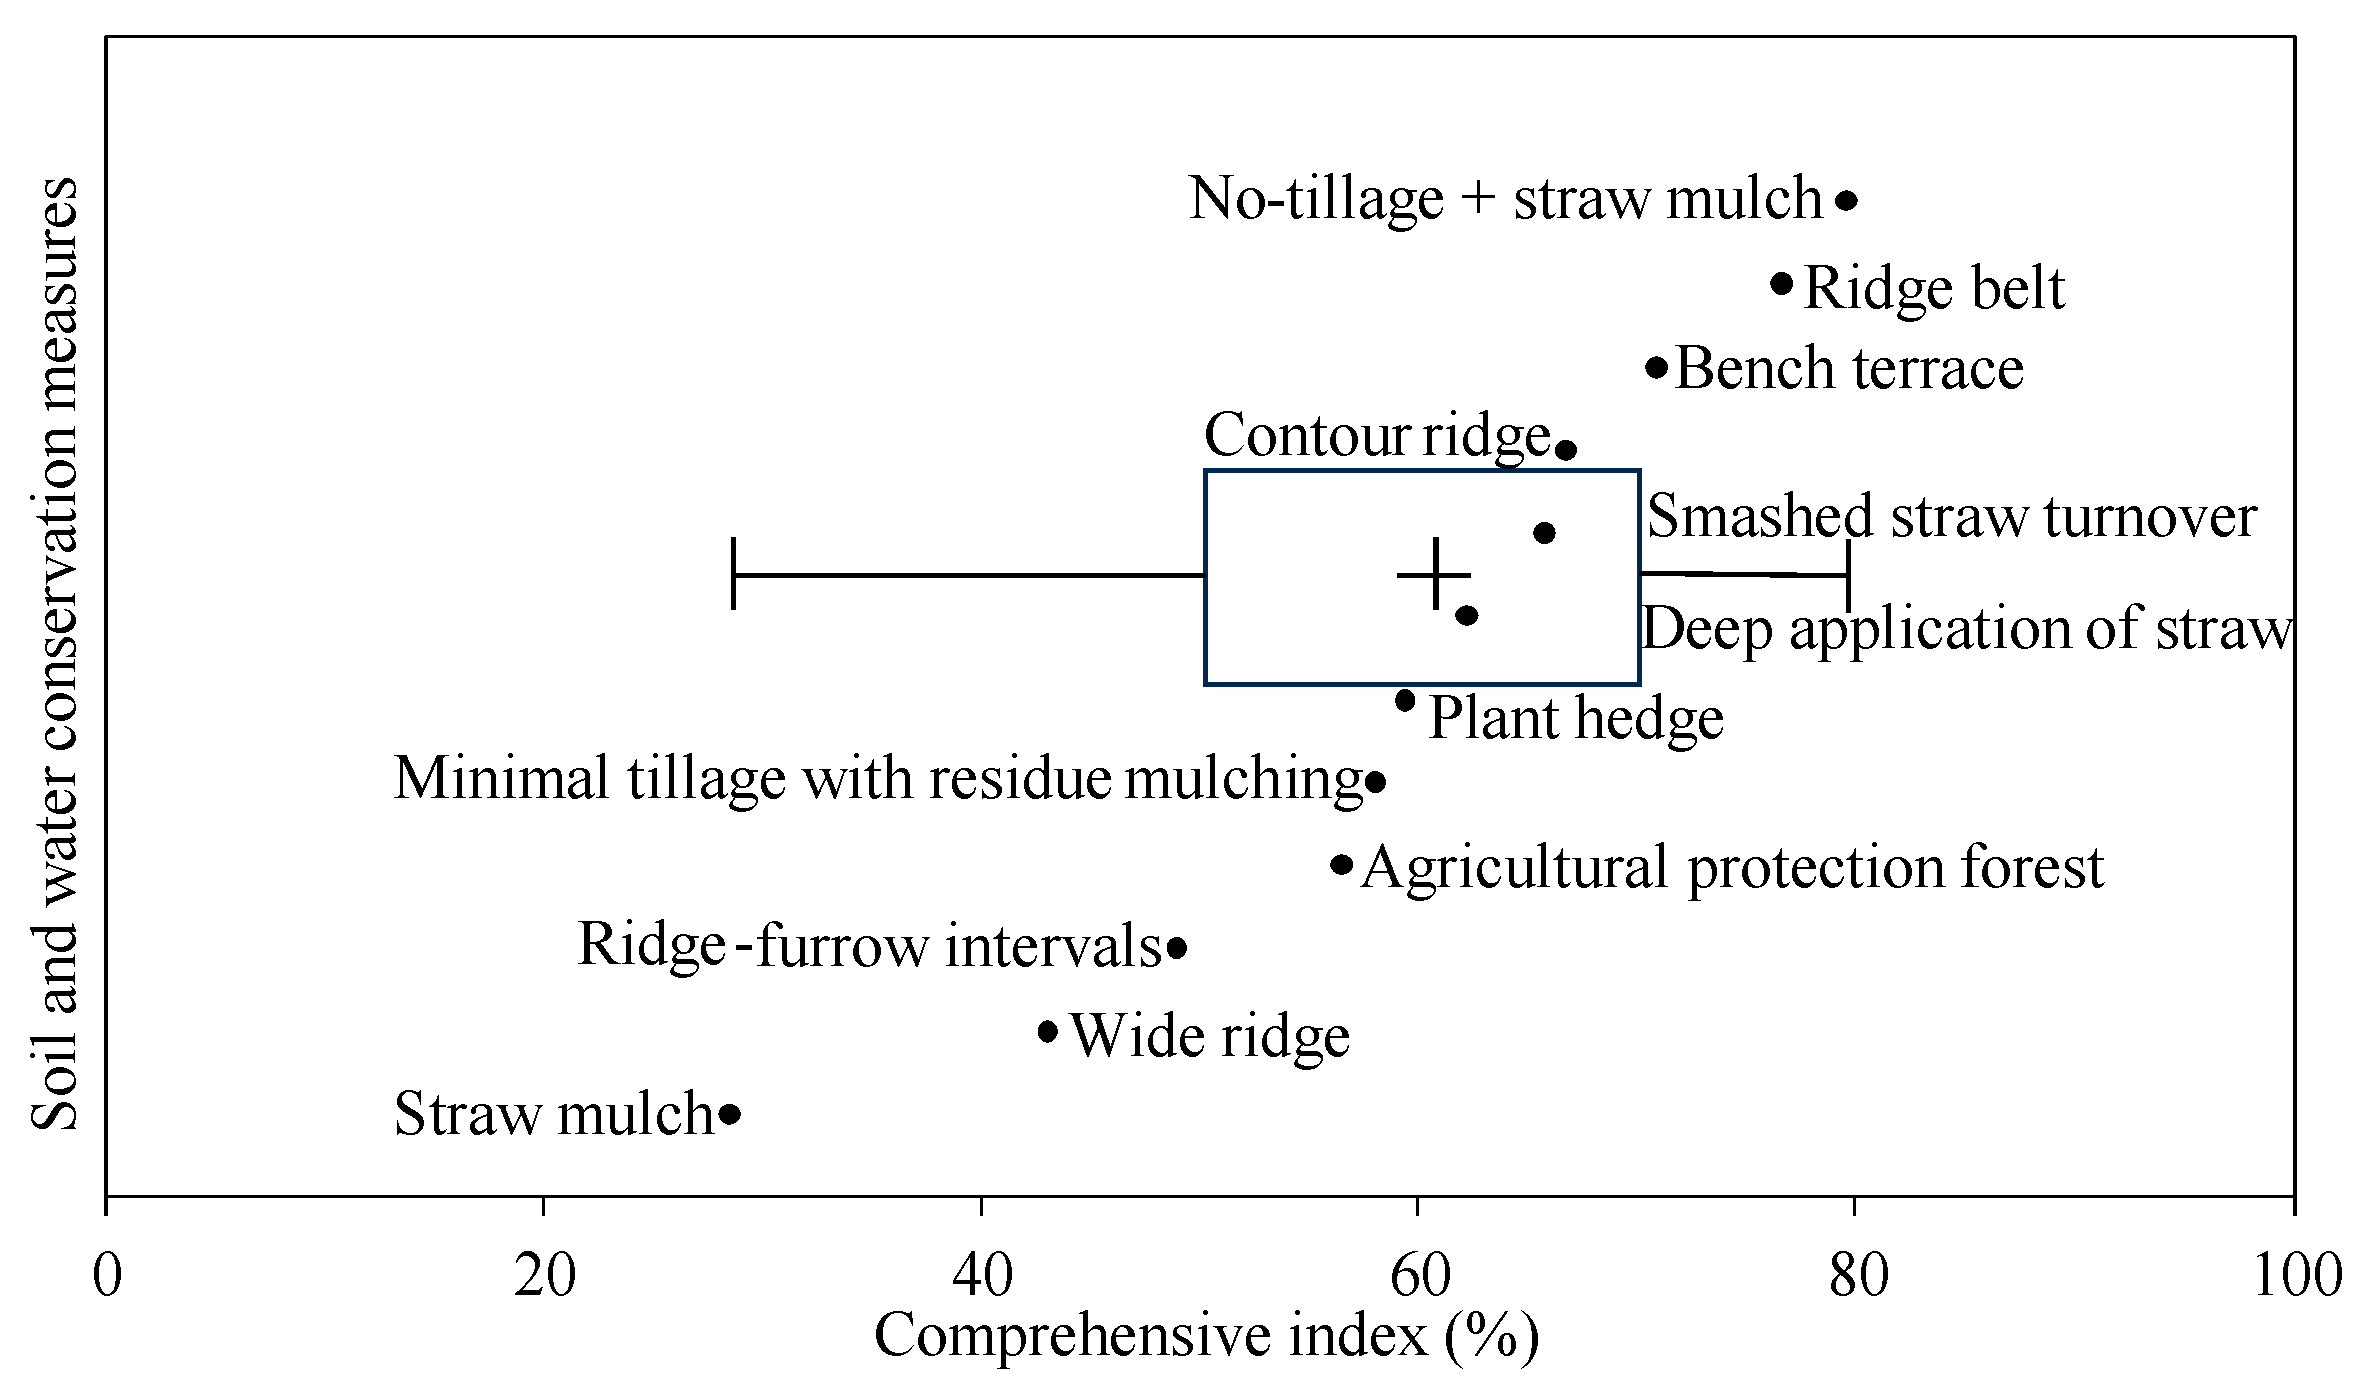
3.1. Assessment of the Effectiveness and Suitability of Soil and Water Conservation Measures Based on the Comprehensive Index Method

In comparison to the control treatments, the soil erosion reduction ratios of soil and water conservation measures on hillslopes in the Chinese black soil region were 34.5–99.6%, with an average of 84.1% (Table 1). This finding was comparable to that reported by Xiong et al. [15], who found that yearly soil erosion reduction ratios were typically 84% based on a meta-analysis of 1589 sample plots across 22 countries to identify soil and water conservation measures.
The soil erosion intensity for various soil and water conservation measures could be gradually reduced from a high level to a low level [70]. In this study, the mean gradation changes of soil erosion intensity were 2–3 levels (Table 1). In the practical application of soil and water conservation measures, two or more measure types were often used for spatial allocation [16,71] because any individual measure could not meet the soil loss tolerance standard (≤200 t km−2 y−1) [43]. Quantifying soil erosion intensity enabled an assessment of effectiveness and suitability of soil and water conservation measures.
Energy values were from 1.06 × 10⁸ to 74.80 × 10⁸ sej for different soil and water conservation measures (Table 1). The capital investment in building terraces was the largest [72], and the input energy value was also the largest. Ridge tillage with common cost was ploughed and re-ridged each year. Straw mulch was also carried out in some areas every year [20], mainly during the autumn harvest, which costed mediumly. The agricultural protection forest measure did not need to be repaired every year after completion and could also create income [73], and thus, its cost was the lowest. Soil and water conservation measures with high energy values mainly included bench terrace, ridge belt, and ridge cultivation in low hilly areas. Those with medium energy values mainly included straw mulch and conventional ridge tillage. Those with low energy values mainly included agricultural protection forests. Therefore, energy values of different measures should be fully considered in the allocation of hillslope soil and water conservation measures.
The majority of soil and water conservation measures neither increase nor decrease the amount of land under cultivation [51], with the exception of ridge belt and plant hedge, which occupied approximately 6% of the cultivated land (Table 1). Moreover, the bench terrace occupied a larger percentage of cultivated land, between 13 and 20% on average [16]. Thus, the proportion of cultivated land occupied should also be considered to increase farmers’ acceptance of the measures.
Comparing comprehensive indexes and categorizing the effectiveness and suitability of various soil and water conservation measures yielded the following results: very effective and suitable measures included no-tillage + straw mulch and ridge belt; relatively effective and suitable measures included bench terrace, contour ridge, smashed straw turnover, deep application of straw, plant hedge, minimal tillage with residue mulching, and agricultural protection forest; and moderately effective and suitable measures included ridge–furrow intervals, wide ridge, and straw mulch (Figure 2, Table 1). It was noteworthy that no ineffective and unsuitable soil and water conservation measures were discovered. In the practice of soil and water conservation, the best soil and water conservation measures could be chosen based on the effectiveness and suitability categorizations mentioned above.

3.2. Assessment of Effectiveness and Suitability of Soil and Water Conservation Measures Based on the PSR Model

The PSR model takes into account the relationship between pressure (runoff, soil erosion, freeze–thaw conditions, etc.), state (soil organic matter content, soil nitrogen and phosphorus content, soil pH, etc.), and response (runoff reduction ratio, soil erosion reduction ratio, etc.) and has strong flexibility and practicability [51]. From an empirical perspective, this study constructed a scientific assessment index system based on the PSR model, chose a fair assessment method, and analyzed the effectiveness and suitability of various soil and water conservation measures on hillslopes on the basis of a substantial amount of experimental data. These findings could serve as a guide for the selection of scientific soil and water conservation measures in the black soil region.

3.2.1. Assessment Index System of Effectiveness and Suitability

Principles of scientificity, feasibility, independence, completeness, simplicity, comparability, and hierarchy should be adhered to while completely taking assessment objectives into account. Then, to build an assessment index system, indicators that could accurately convey the scientific meaning of the effectiveness and suitability of soil and water conservation measures were carefully chosen. Target, criterion, and indicator layers made up the index system, which also included pressure, status, and reaction index systems with various specialized indicators (Figure 3).
For the specific index selection, a frequency statistical method was adopted [74]. Corresponding indicators were listed after reviewing the literature on the assessment of benefits of soil and water conservation measures. Local farmers and specialists with extensive practical experience were then requested to take part in the questionnaire survey. The background, purpose, and basic principles of indication selection were informed to farmers and specialists. According to their own expertise and experience, they selected the indicators that significantly influenced soil and water conservation measures as a crucial point of reference for choosing assessment indicators. Ultimately, the assessment index system was constructed by choosing indicators with a high frequency of occurrence based on a thorough study of local conditions (Table 2). Among them, the energy value of soil and water conservation measures in the response index was introduced for the first time in the assessment index system of effectiveness and suitability. The runoff reduction ratio and soil erosion reduction ratio were the mean indexes of reducing runoff and soil erosion obtained by methodically comparing multiple soil and water conservation measures.

3.2.2. Assessment of Effectiveness and Suitability

By using the aforementioned assessment method and model, the original data of eight indicators for contour ridge, wide ridge, deep application of straw, smashed straw turnover, no-tillage, and no-tillage + straw mulch were processed, respectively, to determine standardized values for each indicator and assessment values for each measure (Table 3, Table 4 and Table 5). Then, the effectiveness and suitability of different soil and water conservation measures were clearly demonstrated. According to the findings, assessment values of the effectiveness and suitability of soil and water conservation measures were 0.40–0.76, or 0.44–0.76 and 0.40–0.70 under 50 mm h−1 and 100 mm h−1 rainfall intensity, respectively. The rationale was that increased rainfall intensity led to increased hillslope runoff at higher velocities [9], which increased soil erosion and impacted the effectiveness and suitability of measures [75]. Therefore, with an increase in rainfall intensity from 50 to 100 mm h−1, assessment values of the effectiveness and suitability of soil and water conservation measures generally decreased, particularly for wide ridge and smashed straw turnover, where assessment values declined by 25–26%. Nonetheless, assessment values of no-tillage + straw mulch and contour ridge still continued to display a high level.
The following is the ranking of assessment values for the effectiveness and suitability of soil and water conservation measures: no-tillage + straw mulch > contour ridge > smashed straw turnover > wide ridge > deep application of straw > no-tillage (Table 5). The reason was that the former measures could clearly boost infiltration and control runoff to prevent its collection in contrast to the latter ones [17,43]. The effectiveness and suitability of soil and water conservation measures were also categorized into four classes, which are ineffective and unsuitable (<0.25), moderately effective and suitable (0.25–0.5), relatively effective and suitable (0.5–0.75), and very effective and suitable (>0.75). By comparing the categorization, for the 50 mm h−1 rainfall intensity, a very effective and suitable measure was no-tillage + straw mulch. Relatively effective and suitable measures included contour ridge, smashed straw turnover, and wide ridge. Moderately effective and suitable measures included deep application of straw and no-tillage. For the 100 mm h−1 rainfall intensity, there was no very effective and suitable measure because greater rainfall intensity with greater rainfall erosivity and runoff erosivity was difficult to control [9]. Relatively effective and suitable measures included contour ridge and no-tillage + straw mulch. Moderately effective and suitable measures included smashed straw turnover, deep application of straw, wide ridge, and no-tillage. The categorization of the effectiveness and suitability of soil and water conservation measures showed different results because sloping farmland was more sensitive to changes in rainfall intensity [43]. This indicated that the same measure might fall into different classes depending on rainfall intensities [75,76]. Thus, reference to the categorization standard of this study is helpful for choosing soil and water conservation measures.

3.2.3. Coordination Degree Analysis of PSR Model

After calculating the coordination degrees of the PSR model [77] of various soil and water conservation measures (Table 6), the weight analysis of the coordination degree was performed using the same methodology as the categorization of assessment values based on the quartile method [66]. According to the assessment, the soil and water conservation measures fell into four categories: ineffective and unsuitable (coordination degree < 1.32), moderately effective and suitable (coordination degree 1.32–1.53), relatively effective and suitable (coordination degree 1.53–1.64), and very effective and suitable (>1.64) class.
By comparing the coordination degrees of the PSR model, it was discovered that when rainfall intensity was relatively low, a very effective and suitable measure was no-tillage + straw mulch; relatively effective and suitable measures included contour ridge, smashed straw turnover, and no-tillage; moderately effective and suitable measures included deep application of straw and wide ridge (Table 5). When rainfall intensity was relatively high, a very effective and suitable measure was still no-tillage + straw mulch; relatively effective and suitable measures included no-tillage, contour ridge, and deep application of straw; moderately effective and suitable measures included smashed straw turnover and wide ridge. There was no ineffective and unsuitable measure also because of greater rainfall erosivity and runoff erosivity [9].
The coordination degrees of the PSR model generally declined in the following order: no-tillage + straw mulch > contour ridge > no-tillage > smashed straw turnover > deep application of straw > wide ridge (Table 5). The smashed straw turnover, no-tillage + straw mulch, and contour ridge measures showed a decrease in coordination degrees of 2.9–8.2%. However, the no-tillage, wide ridge, and smashed straw turnover showed an increase in coordination degrees of 0.7–2.6% when rainfall intensity was increased from 50 to 100 mm h−1. The results demonstrated improved coordination between the three subsystems [77], as indicated by the coordination degrees of the PSR model. This finding might be a reflection of the practical and scientific assessment of the effectiveness and suitability of the hillslope soil and water conservation measures.
In terms of assessment values of the effectiveness and suitability of soil and water conservation measures and coordination degrees of the PSR model, no-tillage + straw mulch and contour ridge were the most effective and suitable soil and water conservation measures on hillslope for treatments with different rainfall intensities. It was necessary to assess the effectiveness and suitability of the other soil and water conservation measures in light of the particular circumstances, as they did not manifest an obvious difference.

4. Conclusions

This study focused on soil and water conservation measures on hillslopes in the black soil region to assess their effectiveness and suitability by using the comprehensive index method and the PSR model. Soil erosion reduction ratio, gradation changes of soil erosion intensity, energy value, and the proportion of cultivated land occupied were chosen to compute comprehensive indexes. The findings revealed that the mean soil erosion reduction ratio was 84.1%, with ranges from 34.5 to 99.6%. The gradation changes of soil erosion intensity were typically 2–3 levels. The energy values decreased in the order of bench terrace, ridge belt, ridge cultivation in low hilly areas, straw mulch, conventional ridge tillage, and agricultural protection forest. The proportions of cultivated land occupied were roughly 6% for the ridge belt and plant hedge and 13–20% for the bench terrace. By comparing the comprehensive indexes and categorization of the effectiveness and suitability of various soil and water conservation measures, very effective and suitable measures included no-tillage + straw mulch and ridge belt. Additionally, an assessment index system was developed based on the PSR model. Its assessment values of the effectiveness and suitability ranged from 0.40 to 0.76, and they were arranged as follows: no-tillage + straw mulch > contour ridge > smashed straw turnover > wide ridge > deep application of straw > no-tillage. The coordination degrees of the PSR model, which ranged from 1.38 to 1.71, might be indicative of the findings of the scientific and practical assessments. The two methods corroborated each other’s categorizations of the effectiveness and suitability of soil and water conservation measures. Thus, appropriate soil and water conservation measures might be chosen based on the categorizations of effectiveness and suitability. In future studies, the effectiveness and suitability should be further assessed in allocation of hillslope soil and water conservation measures according to different geomorphic or soil erosion types.

Author Contributions

Conceptualization, H.S., W.H. and X.C.; Data curation, C.L. and Y.L.; Formal analysis, C.L. and Y.L.; Funding acquisition, H.S. and W.H.; Investigation, C.L. and Y.L.; Methodology, H.S., W.H. and X.C.; Writing—original draft, X.W.; Writing—review and editing, H.S., W.H. and X.C. All authors have read and agreed to the published version of the manuscript.

Funding

This research was funded by the Outstanding Youth Fund Project of Jilin Province [20240101024JJ]; the ‘Black Soil Granary’ Science and Technology Competition ‘Open List’ Research Project of Jilin Province [JJKH20240457HT]; the Young Scientist Group Project of Northeast Institute of Geography and Agroecology, Chinese Academy of Sciences [2023QNXZ03]; and the National Key R&D Program of China [2016YFE0202900, 2021YFD1500700]. This paper was also supported by the China Scholarship Council.

Data Availability Statement

The data presented in this study are available on request from the corresponding author.

Acknowledgments

We thank the anonymous reviewers and editors for their constructive comments on this manuscript.

Conflicts of Interest

The authors declare no conflicts of interest.

References

  1. Preiti, G.; Romeo, M.; Bacchi, M.; Monti, M. Soil loss measure from Mediterranean arable cropping systems: Effects of rotation and tillage system on C-factor. Soil Tillage Res. 2017, 170, 85–93. [Google Scholar] [CrossRef]
  2. Xie, Y.; Tang, J.; Gao, Y.; Gu, Z.J.; Liu, G.; Ren, X.Y. Spatial distribution of soil erosion and its impacts on soil productivity in Songnen typical black soil region. Int. Soil Water Conserv. Res. 2023, 11, 649–659. [Google Scholar] [CrossRef]
  3. Quinton, J.N.; Fiener, P. Soil erosion on arable land: An unresolved global environmental threat. Eurasian Soil Sci. 2024, 48, 136–161. [Google Scholar] [CrossRef]
  4. Edwards, B.L.; Webb, N.P.; Brown, D.P.; Elias, E.; Peck, D.E.; Pierson, F.B.; Williams, C.J.; Herrick, J.E. Climate change impacts on wind and water erosion on US rangelands. J. Soil Water Conserv. 2019, 74, 405–418. [Google Scholar] [CrossRef]
  5. Yuan, C.; Fan, H.M. Response mechanism of black soil structure to compound erosion forces in sloping farmland, Northeast China. Soil Tillage Res. 2024, 240, 106103. [Google Scholar] [CrossRef]
  6. Asadi, H.; Gnadiri, H.; Rose, C.W.; Rouhipour, H. Interrill soil erosion processes and their interaction on low slopes. Earth Surf. Process. Landf. 2007, 32, 711–724. [Google Scholar] [CrossRef]
  7. Shen, H.O.; He, Y.F.; Hu, W.; Geng, S.B.; Han, X.; Zhao, Z.J.; Li, H.L. The temporal evolution of soil erosion for corn and fallow hillslopes in the typical Mollisol region of Northeast China. Soil Tillage Res. 2019, 186, 200–205. [Google Scholar] [CrossRef]
  8. Wang, S.A.; Fu, B.J.; Piao, S.L.; Lu, Y.H.; Ciais, P.; Feng, X.M.; Wang, Y.F. Reduced sediment transport in the Yellow River due to anthropogenic changes. Nat. Geosci. 2016, 9, 38–41. [Google Scholar] [CrossRef]
  9. Wen, L.L.; Zheng, F.L.; Shen, H.O.; Bian, F.; Jiang, Y.L. Rainfall intensity and inflow rate effects on hillslope soil erosion in the Mollisol region of Northeast China. Nat. Hazards 2015, 79, 381–395. [Google Scholar] [CrossRef]
  10. Rahman, M.R.; Shi, Z.H.; Cai, C.F.; Zhu, D. Assessing soil erosion hazard-a raster based GIS approach with spatial principal component analysis (SPCA). Earth Sci. Inform. 2015, 8, 853–865. [Google Scholar] [CrossRef]
  11. Zhang, T.Y.; Wilson, G.V.; Hao, Y.F.; Han, X. Erosion hazard evaluation for soil conservation planning that sustains life expectancy of the A-horizon: The black soil region of China. Land Degrad. Dev. 2021, 32, 2629–2641. [Google Scholar] [CrossRef]
  12. Kinnell, P.I.A. The role of detention storage of sediment on erosion by rain-impacted flows. Catena 2024, 238, 107913. [Google Scholar] [CrossRef]
  13. Raj, R.; Saharia, L.K. Spatial E-PSR modelling for ecological sensitivity assessment for arid rangeland resilience and management. Ecol. Model. 2024, 478, 110283. [Google Scholar] [CrossRef]
  14. Liu, B.Y.; Liu, Y.N.; Zhang, K.L.; Xie, Y. Classification for soil conservation practices in China. J. Soil Water Conserv. 2013, 27, 80–84, (In Chinese, with English Abstract). [Google Scholar]
  15. Xiong, M.Q.; Sun, R.H.; Chen, L.D. Effects of soil conservation techniques on water erosion control: A global analysis. Sci. Total Environ. 2018, 645, 753–760. [Google Scholar] [CrossRef]
  16. Shen, H.O.; Wang, D.L.; Wen, L.L.; Zhao, W.T.; Zhang, Y. Soil erosion and typical soil and water conservation measures on hillslopes in the Chinese Mollisol Region. Eurasian Soil Sci. 2020, 53, 1509–1519. [Google Scholar] [CrossRef]
  17. An, J.; Wu, Y.Z.; Song, H.L.; Wang, L.Z.; Wu, X.Y.; Han, J.X.; Zhao, H.B. Investigating the stability of contour ridge system using rare earth element tracers under natural rainfall in the rocky mountain areas of Northern China. Soil Tillage Res. 2023, 234, 105841. [Google Scholar] [CrossRef]
  18. Lorenz, M.; Fürst, C.; Thiel, E. A methodological approach for deriving regional crop rotations as basis for the assessment of the impact of agricultural strategies using soil erosion as example. J. Environ. Manag. 2013, 127, S37–S47. [Google Scholar] [CrossRef]
  19. Oshunsanya, S.O.; Yu, H.Q.; Ojeade, D.E.; Odebode, A.M. Soil transportation due to harvesting of ginger and turmeric under tillage management practices. Soil Tillage Res. 2024, 242, 106–154. [Google Scholar] [CrossRef]
  20. Xing, S.K.; Zhang, G.H.; Chen, S.Q.; Zhang, N.; Wang, C.S. Response of soil erosion resistance to straw incorporation amount in the black soil region of Northeast China. J. Environ. Manag. 2024, 357, 120801. [Google Scholar] [CrossRef]
  21. Ma, T.L.; Liu, B.Y.; He, L.; Dong, L.X.; Yin, B.; Zhao, Y.G. Response of soil erosion to vegetation and terrace changes in a small watershed on the Loess Plateau over the past 85 years. Geoderma 2024, 443, 116837. [Google Scholar] [CrossRef]
  22. Wang, Z.J.; Jiao, J.Y.; Su, Y.; Chen, Y. The efficiency of large-scale afforestation with fish-scale pits for revegetation and soil erosion control in the steppe zone on the hill-gully Loess Plateau. Catena 2014, 115, 159–167. [Google Scholar] [CrossRef]
  23. Cao, X.; Li, J.J.; Jiao, J.Y.; Bai, L.C.; Wang, X.; Chen, T.D.; Ma, X.Y. The secret of nabkha development–From the inspective of surface wind erosion and sand accumulation. Catena 2024, 240, 107992. [Google Scholar] [CrossRef]
  24. Monsieurs, E.; Poesen, J.; Dessie, M.; Adgo, E.; Verhoest, N.E.C.; Deckers, J.; Nyssen, J. Effects of drainage ditches and stone bunds on topographical thresholds for gully head development in North Ethiopia. Geomorphology 2015, 234, 193–203. [Google Scholar] [CrossRef]
  25. Du, H.Q.; Liu, X.F.; Jia, X.P.; Li, S.; Fan, Y.W. Assessment of the effects of ecological restoration projects on soil wind erosion in northern China in the past two decades. Catena 2022, 215, 106360. [Google Scholar] [CrossRef]
  26. Wen, Y.R.; Liu, B.; Lin, L.T.; Hu, M.M.; Wen, X.; Li, T.Y.; Rong, J.D.; Yao, S.H. Shelterbelt effects on soil redistribution on an arable slope by wind and water. Catena 2024, 241, 108044. [Google Scholar] [CrossRef]
  27. Kervroëdan, L.; Armand, R.; Saunier, M.; Ouvry, J.F.; Faucon, M.P. Plant functional trait effects on runoff to design herbaceous hedges for soil erosion control. Ecol. Eng. 2018, 118, 143–151. [Google Scholar] [CrossRef]
  28. Silva, T.P.; Bressiani, D.; Ebling, É.D.; Reichert, J.M. Best management practices to reduce soil erosion and change water balance components in watersheds under grain and dairy production. Int. Soil Water Conserv. Res. 2024, 12, 121–136. [Google Scholar] [CrossRef]
  29. Liu, G.C.; Dai, F.Q.; Nan, L.; Du, S.H. Assessing the suitability of soil and water conservation practices in Southwestern China. Land Use Policy 2013, 30, 319–327. [Google Scholar] [CrossRef]
  30. Zhang, Y.B.; Wang, Y.C.; Guo, J. Primary investigation on the theory and method of the suitability assessment on the soil and water conservation measures. Res. Soil Water Conserv. 2014, 21, 47–55, (In Chinese, with English Abstract). [Google Scholar]
  31. Chen, Z.; Li, X.J.; Xia, X.L.; Zhang, J.Z. The impact of social interaction and information acquisition on the adoption of soil and water conservation technology by farmers: Evidence from the Loess Plateau, China. J. Clean. Prod. 2024, 434, 139880. [Google Scholar] [CrossRef]
  32. Jin, H.F.; Zhong, Y.J.; Shi, D.M.; Li, J.K.; Lou, Y.B.; Li, Y.L.; Li, J.F. Quantifying the impact of tillage measures on the cultivated-layer soil quality in the red soil hilly region: Establishing the thresholds of the minimum data set. Ecol. Indic. 2021, 130, 108013. [Google Scholar] [CrossRef]
  33. Idé, S.K.; Caron, J.; Daeichin, S.; Frenette-Vallières, C. Relating soil properties to soil losses by wind erosion in a cultivated organic soil in the southwest of Quebec, Canada. Catena 2023, 233, 107535. [Google Scholar]
  34. Wang, Y.F.; An, X.B.; Zheng, F.L.; Wang, X.S.; Wang, B.; Zhang, J.Q.; Xu, X.M.; Yang, W.G.; Feng, Z.Z. Effects of soil erosion–deposition on corn yields in the Chinese Mollisol region. Catena 2024, 240, 108001. [Google Scholar] [CrossRef]
  35. Li, R.; Hu, W.Y.; Jia, Z.J.; Liu, H.Q.; Zhang, C.; Huang, B.; Yang, S.H.; Zhao, Y.G.; Zhao, Y.C.; Shukla, M.K.; et al. Soil degradation: A global threat to sustainable use of black soils. Pedosphere 2024, in press. [Google Scholar] [CrossRef]
  36. Ma, S.; Wang, L.J.; Wang, H.Y.; Zhao, Y.G.; Jiang, J. Impacts of land use/land cover and soil property changes on soil erosion in the black soil region, China. J. Environ. Manag. 2023, 328, 117024. [Google Scholar] [CrossRef] [PubMed]
  37. Wang, L.; Zheng, F.L.; Liu, G.; Zhang, X.C.J.; Wilson, G.V.; Shi, H.Q.; Liu, X.J. Seasonal changes of soil erosion and its spatial distribution on a long gentle hillslope in the Chinese Mollisol region. Int. Soil Water Conserv. Res. 2021, 9, 394–404. [Google Scholar] [CrossRef]
  38. Li, X.Y.; Wang, X.W.; Gu, J.T.; Sun, C.; Zhao, H.G.; You, S.C. Temporal and spatial variation in rainfall erosivity in the rolling hilly region of Northeast China. Agronomy 2023, 13, 2877. [Google Scholar] [CrossRef]
  39. Xu, Y.; Yu, Z.H.; Li, Y.S.; Jin, J.; Zhang, X.Y.; Wang, G.H.; Liu, X.B. Removal of crop ion components in relation to Mollisol acidification under long-term management. Agronomy 2024, 14, 191. [Google Scholar] [CrossRef]
  40. An, J.; Zheng, F.L.; Wang, B. Using 137Cs technique to investigate the spatial distribution of erosion and deposition regimes for a small catchment in the black soil region, northeast China. Catena 2014, 23, 243–251. [Google Scholar] [CrossRef]
  41. Ouyang, W.; Wu, Y.Y.; Hao, Z.C.; Zhang, Q.; Bu, Q.W.; Gao, X. Combined impacts of land use and soil property changes on soil erosion in a mollisol area under long-term agricultural development. Sci. Total Environ. 2017, 613–614, 798–809. [Google Scholar] [CrossRef] [PubMed]
  42. Feng, Z.Z.; Zheng, F.L.; Hu, W.; Li, G.F.; Xu, X.M. Impacts of mollic epipedon thickness and overloaded sediment deposition on corn yield in the Chinese Mollisol region. Agric. Ecosyst. Environ. 2018, 257, 175–182. [Google Scholar] [CrossRef]
  43. Zhang, Q.; Qin, W.; Cao, W.H.; Jiao, J.; Yin, Z.; Xu, H.C. Response of erosion reduction effect of typical soil and water conservation measures in cropland to rainfall and slope gradient changes and their applicable range in the Chinese Mollisols Region, Northeast China. Int. Soil Water Conserv. Res. 2023, 11, 251–262. [Google Scholar] [CrossRef]
  44. Chen, J.; Xiao, H.B.; Li, Z.W.; Liu, C.; Ning, K.; Tang, C.J. How effective are soil and water conservation measures (SWCMs) in reducing soil and water losses in the red soil hilly region of China? A meta-analysis of field plot data. Sci. Total Environ. 2020, 735, 139517. [Google Scholar] [CrossRef] [PubMed]
  45. Hayatzadeh, M.; Moosavi, V.; Aliramaee, R. Assessment and prioritization of soil erosion triggering factors using analytical hierarchy process and Taguchi method. Int. J. Sediment Res. 2023, 38, 396–404. [Google Scholar] [CrossRef]
  46. Zhai, Y.Y.; Fang, H.Y. Spatiotemporal variations of freeze-thaw erosion risk during 1991–2020 in the black soil region, northeastern China. Ecol. Indic. 2023, 148, 110149. [Google Scholar] [CrossRef]
  47. Mokarram, M.; Zarei, A.R. Soil erosion prediction using Markov and CA-Markov chains methods and remote sensing drought indicators. Ecol. Inform. 2023, 78, 102386. [Google Scholar] [CrossRef]
  48. Mikha, M.M.; Green, T.R.; Untiedt, T.J.; Hergret, G.W. Land management affects soil structural stability: Multi-index principal component analyses of treatment interactions. Soil Tillage Res. 2024, 235, 105890. [Google Scholar] [CrossRef]
  49. Fu, X.F.; Liu, Y.; Xie, Z.Q.; Jiang, F.S.; Xu, J.R.; Yang, Z.B.; Deng, Z.T.; Wang, Q.S.; Liao, M.F.; Wu, X.D.; et al. A coupled PSR-based framework for holistic modeling and flood resilience assessment: A case study of the 2022 flood events in five southern provinces of China. J. Hydrol. 2024, 636, 131255. [Google Scholar] [CrossRef]
  50. Li, S.J.; Liu, C.L.; Ge, C.Z.; Yang, J.; Liang, Z.L.; Li, X.; Cao, X.Y. Ecosystem health assessment using PSR model and obstacle factor diagnosis for Haizhou Bay, China. Ocean. Coast. Manag. 2024, 250, 107024. [Google Scholar] [CrossRef]
  51. Miao, X.R.; Li, Z.H.; Wang, M.Y.; Mei, J.; Chen, J. Measurement of cultivated land ecosystem resilience in black soil region of Northeast China under the background of cultivated land protection policy in China: Case study of Qiqihar City. J. Clean. Prod. 2024, 434, 140141. [Google Scholar] [CrossRef]
  52. Jatav, S.S.; Naik, K. Measuring the agricultural sustainability of India: An application of Pressure-State-Response (PSR) model. Reg. Sustain. 2023, 4, 218–234. [Google Scholar] [CrossRef]
  53. Yang, F.; Xu, Y.; Cui, Y.; Meng, Y.D.; Dong, Y.; Li, R.; Ma, Y.B. Variation of soil organic matter content in croplands of China over the last three decades. Acta Pedol. Sin. 2017, 54, 1047–1056, (In Chinese, with English Abstract). [Google Scholar]
  54. Hu, X.J.; Liu, J.J.; Wei, D.; Zhu, P.; Cui, X.A.; Zhou, B.K.; Chen, X.L.; Jin, J.; Liu, X.B.; Wang, G.H. Effects of over 30-year of different fertilization regimes on fungal community compositions in the black soils of northeast China. Agric. Ecosyst. Environ. 2017, 248, 113–122. [Google Scholar] [CrossRef]
  55. Nearing, M.A.; Xie, Y.; Liu, B.Y.; Ye, Y. Natural and anthropogenic rates of soil erosion. Int. Soil Water Conserv. Res. 2017, 5, 77–84. [Google Scholar] [CrossRef]
  56. He, Y.F.; Shen, H.O.; Zhang, Y.; Zhao, Z.J.; Mou, T.S. Analysis of soil and water conservation effects of different straw returning patterns in sloping farmland in the Chinese black soil region. J. Soil Water Conserv. 2020, 34, 89–94, (In Chinese, with English Abstract). [Google Scholar]
  57. Shen, H.O.; Feng, J.; Wang, D.L.; Li, H.L.; Wang, Y. Characteristics of soil erosion and sediment size distribution for different land uses in the Chinese Mollisol region. J. Mt. Sci. 2021, 18, 1295–1306. [Google Scholar] [CrossRef]
  58. Shen, H.O.; Ma, R.M.; Ye, Q.; Feng, J.; Wang, J.H. Impacts of corn straw coverage and slope gradient on soil erosion and sediment size distributions in the Mollisol region, NE China. Eurasian Soil Sci. 2021, 54, 2000–2008. [Google Scholar] [CrossRef]
  59. Chen, G. Analysis of sediment reduction benefit for hillslope erosion control of key project in northeast black soil region. Northeast. Water Resour. Hydropower 2006, 24, 56–59. (In Chinese) [Google Scholar]
  60. Chen, X.; Cai, Q.G.; Wang, X.Q. Suitability of soil and water conservation measures on sloping farmland in typical black soil regions of Northeast China. Sci. Soil Water Conserv. 2008, 6, 44–49, (In Chinese, with English Abstract). [Google Scholar]
  61. Yang, A.Z.; Wei, Y.X.; Zhang, Z.X.; Zhang, B.L. Effects of technology modes for sloping farm-land comprehensive control on soil water conservation and crop yield. Trans. Chin. Soc. Agric. Eng. 2011, 27, 222–226, (In Chinese, with English Abstract). [Google Scholar]
  62. He, C.; Wang, L.; Zheng, F.L.; He, X.; Fu, H. Effects of ridge tillage on hillslope soil erosion in thin layer black soil region. J. Soil Water Conserv. 2018, 32, 24–28, (In Chinese, with English Abstract). [Google Scholar]
  63. Li, S.L.; Li, H.P.; Lin, Y.; Xiao, B.; Wang, G.P. Effects of tillage methods on wind erosion in farmland of northeastern China. J. Soil Water Conserv. 2019, 33, 110–118, (In Chinese, with English Abstract). [Google Scholar]
  64. Wang, L.; Shi, H.Q.; Liu, G.; Zheng, F.L.; Qin, C.; Zhang, X.C.; Zhang, J.Q. Comparison of soil erosion between wide and narrow longitudinal ridge tillage in black soil region. Trans. Chin. Soc. Agric. Eng. 2019, 35, 176–182, (In Chinese, with English Abstract). [Google Scholar]
  65. Fang, H.Y.; Wu, D.R. Impact of agricultural shelterbelt on soil erosion and sediment deposition at catchment scale in the black soil region, northeastern China. J. Shaanxi Norm. Univ. Nat. Sci. Ed. 2018, 46, 104–110, (In Chinese, with English Abstract). [Google Scholar]
  66. Kamaraj, P.; Thangapandian, I.D.; Karuppannan, S.; Garo, T. A statistical-based geospatial approach to prioritize the watersheds for soil erosion conservation in the Upper Awash Basin (Upstream Koka), Ethiopia. Kuwait J. Sci. 2024, 51, 100198. [Google Scholar] [CrossRef]
  67. Ministry of Water Resources of the People’s Republic of China. Techniques Standard for Comprehensive Control of Soil Erosion in the Black Soil Region (SL 446—2009); China Water & Power Press: Beijing, China, 2009; pp. 2–3. (In Chinese) [Google Scholar]
  68. Odum, H.T. Energy quality and carrying capacity of the earth. Trop. Ecol. 1975, 16, 14. [Google Scholar]
  69. Odum, H.T. Environmental Accounting: Energy and Environmental Decision Making; John Wiley and Sons: New York, NY, USA, 1996; p. 370. ISBN 978-0-471-11442-0. [Google Scholar]
  70. Zhu, Z.Z.; Li, L.; Zhang, S.X.; Zhang, P.; Ren, Y.N.; Zhang, Y. Dynamic simulation study of soil erosion intensity on slopes with different vegetation patterns in pisha sandstone area. Ecol. Model. 2024, 491, 110665. [Google Scholar] [CrossRef]
  71. Fang, H.Y.; Sun, L.Y. Modelling soil erosion and its response to the soil conservation measures in the black soil catchment, Northeastern China. Soil Tillage Res. 2017, 165, 23–33. [Google Scholar]
  72. Antle, J.M.; Stoorvogel, J.J.; Valdivia, R.O. Multiple equilibria, soil conservation investments, and the resilience of agricultural systems. Environ. Dev. Econ. 2006, 11, 477–492. [Google Scholar] [CrossRef]
  73. Viccaro, M.; Caniani, D. Forest, agriculture, and environmental protection as path to sustainable development. Nat. Resour. Res. 2019, 28, 1–4. [Google Scholar] [CrossRef]
  74. Dangiso, Y.; Wolka, K. Assessing sustainable management practices of expert-introduced physical soil and water conservation measures. Environ. Chall. 2023, 13, 100780. [Google Scholar] [CrossRef]
  75. Zhang, J.L.; Zhou, L.L.; Ma, R.M.; Jia, Y.F.; Yang, F.; Zhou, H.Y.; Cao, X.Y. Influence of soil moisture content and soil and water conservation measures on time to runoff initiation under different rainfall intensities. Catena 2019, 182, 104172. [Google Scholar] [CrossRef]
  76. Fang, H.Y. Impacts of rainfall and soil conservation measures on soil, SOC, and TN losses on slopes in the black soil region, northeastern China. Ecol. Indic. 2021, 129, 108016. [Google Scholar] [CrossRef]
  77. Zhu, S.; Feng, H.; Arashpour, M.; Zhang, F. Enhancing urban flood resilience: A coupling coordinated evaluation and geographical factor analysis under SES-PSR framework. Int. J. Disaster Risk Reduct. 2024, 101, 104243. [Google Scholar] [CrossRef]
Figure 1. The Chinese black soil region including general and representative areas.
Agronomy 14 01755 g001
Figure 2. Comparison of comprehensive indexes of effectiveness and suitability of soil and water conservation measures on hillslope.
Agronomy 14 01755 g002
Figure 3. A framework of the Pressure–State–Response model used to assess the effectiveness and suitability of soil and water conservation measures on hillslope.
Agronomy 14 01755 g003
Table 1. Indicators of soil and water conservation measures on hillslopes and their categorization for comprehensive index method.
Soil and Water Conservation MeasureExperimental ConditionControl TreatmentSoil Erosion Modulus in Control Treatment (t km−2 y−1)Soil Erosion Modulus in Measure Treatment (t km−2 y−1)Soil Erosion Reduction Ratio (%)Gradation Changes of Soil Erosion IntensityEnergy Value (108 sej)Proportion of Cultivated Land Occupied (%)Categorization of Effectiveness and Suitability
Contour ridge [62]Field monitorNo-ridge (bare fallow)1225.120.898.3From middle to slight 13.240Relatively effective and suitable 2
Wide ridge [64]Field monitorNarrow ridge along hillslope501.6172.565.6From light to slight3.740Moderately effective and suitable
Straw mulch [58]Simulated inflowNo-ridge (bare fallow)1613.81057.034.5From middle to slight1.870Moderately effective and suitable
Deep application of straw [56]Simulated rainfallTraditional up- and downslope tillage13,672.02176.584.1From severe to middle2.810Relatively effective and suitable
Smashed straw turnover [56]Simulated rainfallTraditional up- and downslope tillage13,672.01376.089.9From severe to middle2.340Relatively effective and suitable
No-tillage + straw mulch [63]Field monitorTraditional up- and downslope tillage43,382.3177.399.6From severe to slight1.870Very effective and suitable
Plant hedge [57]Simulated inflowNo-ridge (bare fallow)4421.0822.081.4From very strong to light9.856Relatively effective and suitable
Ridge–furrow intervals [61]Field monitorTraditional up- and downslope tillage456.0112.075.4From light to slight3.270Moderately effective and suitable
Minimal tillage with residue mulching [63]Field monitorTraditional up- and downslope tillage43,382.34188.790.3From severe to very strong1.870Relatively effective and suitable
Bench terrace [60]Field monitorNo-ridge (bare fallow)4962.0130.097.4From severe to slight74.8016.5Relatively effective and suitable
Ridge belt [59]Field monitorTraditional up- and downslope tillage5947.0123.097.9From severe to slight19.706Very effective and suitable
Agricultural protection forest [65]Radioactive tracerThe location before the forest belt5.30.394.4From slight to slight1.060Relatively effective and suitable
1 Soil erosion intensity is divided into six classes using the mean soil erosion modulus (t km−2 y−1), which are slight (≤200), light (200–1200), middle (1200–2400), strong (2400–3600), very strong (3600–4800), and severe (>4800) soil erosion based on ‘Techniques standard for comprehensive control of soil erosion in the black soil region (SL 446—2009)’ [67]. 2 The comprehensive index method was used to categorize the effectiveness and suitability into four classes according to the quartile method [66]: ineffective and unsuitable (<25%), moderately effective and suitable (25–50%), relatively effective and suitable (50–75%), and very effective and suitable (>75%).
Table 2. Assessment indicator system of the effectiveness and suitability of soil and water conservation measures on hillslope for the Pressure–State–Response model.
Target LayerCriterion LayerIndicator LayerWeight FunctionAttribute of Indicator
50 mm h−1100 mm h−1
Effectiveness and suitability of soil and water conservation measures on hillslopePressureA1 Soil erosion rate (g m−2 h−1)0.120.13Reverse indicator
A2 Runoff (L)0.140.13Reverse indicator
StateA3 Soil organic matter content (g kg−1)0.120.12Forward indicator
A4 Soil total nitrogen (g kg−1)0.140.13Forward indicator
A5 Soil total phosphorus (g kg−1)0.120.13Forward indicator
ResponseA6 Energy value (sej)0.120.12Reverse indicator
A7 Runoff reduction ratio (%)0.120.12Forward indicator
A8 Soil erosion reduction ratio (%)0.120.12Forward indicator
Table 3. Original data and standardized values of each indicator of soil and water conservation measures at the 50 mm h−1 rainfall intensity.
Indicator Layer 1Original Data (g m−2 h−1)Standardized Value
Contour RidgeWide Ridge along HillslopeDeep
Application of Straw
Smashed Straw TurnoverNo-TillageNo-Tillage + Straw MulchContour RidgeWide Ridge along HillslopeDeep Application of StrawSmashed Straw TurnoverNo-TillageNo-Tillage + Straw Mulch
A17.53900.30113.5577.8468.5828.101.000.000.880.920.930.98
A25.0441.6226.5718.1037.4314.131.000.000.410.640.110.75
A324.1837.2025.9025.9025.5230.850.001.000.130.130.100.51
A41.271.301.251.311.271.280.270.910.001.000.270.55
A50.520.550.510.460.490.520.701.000.600.060.410.70
A62.343.272.812.343.741.210.930.880.900.930.851.00
A797.7066.4037.0057.1011.1266.601.000.660.340.560.050.66
A899.8072.2087.2091.2092.2596.801.000.550.790.860.880.95
1 A1—Soil erosion rate (g m−2 h−1), A2—Runoff (L), A3—Soil organic matter content (g kg−1), A4—Soil total nitrogen (g kg−1), A5—Soil total phosphorus (g kg−1), A6—Energy value (sej), A7—Runoff reduction ratio (%), A8—Soil erosion reduction ratio (%).
Table 4. Original data and standardized values of each indicator of soil and water conservation measures at the 100 mm h−1 rainfall intensity.
Indicator Layer 1Original Data (g m−2 h−1)Standardized Value
Contour RidgeWide Ridge along HillslopeDeep Application of StrawSmashed Straw TurnoverNo-TillageNo-Tillage + Straw MulchContour RidgeWide Ridge along HillslopeDeep Application of StrawSmashed Straw TurnoverNo-TillageNo-Tillage + Straw Mulch
A116.091941.94321.73197.42148.6989.661.000.000.840.910.930.96
A25.2143.7728.2222.0441.1315.561.000.000.400.560.070.73
A324.1837.2025.9025.9025.5230.850.001.000.130.130.100.51
A41.271.301.251.311.271.280.000.000.000.000.000.00
A50.520.550.510.460.490.520.701.000.600.060.410.70
A62.343.272.812.343.741.210.930.880.90 0.930.851.00
A797.7056.8036.6050.607.1164.901.000.550.33 0.480.000.64
A899.1066.9082.6089.3091.9696.801.000.340.66 0.800.850.95
1 A1—Soil erosion rate (g m−2 h−1), A2—Runoff (L), A3—Soil organic matter content (g kg−1), A4—Soil total nitrogen (g kg−1), A5—Soil total phosphorus (g kg−1), A6—Energy value (sej), A7—Runoff reduction ratio (%), A8—Soil erosion reduction ratio (%).
Table 5. Assessment values of the effectiveness and suitability of soil and water conservation measures on hillslopes and their categorization for the Pressure–State–Response model.
Soil and Water Conservation Measure50 mm h−1100 mm h−1
PressureStateResponseTotal ValueCategorization of Effectiveness and SuitabilityPressureStateResponseTotal ValueCategorization of Effectiveness and Suitability
Contour ridge0.260.120.350.73Relatively effective and suitable0.250.090.360.70Relatively effective and suitable 1
Wide ridge along hillslope0.000.370.250.62Relatively effective and suitable0.000.250.220.46Moderately effective and suitable
Deep application of straw0.160.090.240.50Moderately effective and suitable0.160.090.230.48Moderately effective and suitable
Smashed straw turnover0.200.160.280.64Relatively effective and suitable0.190.020.270.48Moderately effective and suitable
No-tillage0.130.100.210.44Moderately effective and suitable0.130.060.210.40Moderately effective and suitable
No-tillage + straw mulch0.220.220.310.76Very effective and suitable0.210.150.320.68Relatively effective and suitable
1 Categorization of effectiveness and suitability is also divided into four classes, which are ineffective and unsuitable (<0.25), moderately effective and suitable (0.25–0.5), relatively effective and suitable (0.5–0.75), and very effective and suitable (>0.75) class [66].
Table 6. System coordination degrees of soil and water conservation measures for the Pressure–State–Response model at 50 and 100 mm h−1 rainfall intensities.
Rainfall Intensity (mm h−1)Contour RidgeWide Ridge along HillslopeDeep Application of StrawSmashed Straw TurnoverNo-TillageNo-Tillage + Straw Mulch
501.621.381.521.581.541.71
1001.561.411.531.451.581.66
Disclaimer/Publisher’s Note: The statements, opinions and data contained in all publications are solely those of the individual author(s) and contributor(s) and not of MDPI and/or the editor(s). MDPI and/or the editor(s) disclaim responsibility for any injury to people or property resulting from any ideas, methods, instructions or products referred to in the content.

