Article

Spatial and Temporal Variability of Soil pH, Organic Matter and Available Nutrients (N, P and K) in Southwestern China

1
College of Resources and Environment, Southwest University, Beibei, Chongqing 400715, China
2
Chongqing Agricultural Technology Extension Station, Chongqing Municipal Committee of Agriculture and Rural Affairs, Chongqing 400121, China
3
College of Computer and Information Science, Southwest University, Beibei, Chongqing 400715, China
*
Author to whom correspondence should be addressed.
Agronomy 2024, 14(8), 1796; https://doi.org/10.3390/agronomy14081796
Submission received: 19 July 2024 / Revised: 6 August 2024 / Accepted: 9 August 2024 / Published: 15 August 2024
(This article belongs to the Section Soil and Plant Nutrition)

Abstract

:
Knowledge of the spatial and temporal variations in soil nutrients is crucial for designing efficient site-specific nutrient management plans, which can improve crop yields and maximize nutrient use efficiency. The present study was conducted to evaluate and compare the status and spatio-temporal distribution pattern of available nitrogen (AHN), phosphorus (AP) and potassium (AK) and some selected soil properties [soil pH and soil organic matter (SOM)] in cultivated soils of Southwestern China over a 15-year period (2007–2022). We visualized the correlations among soil properties, AHN, AP and AK and analyzed the spatial structures of these parameters. A total of 3845 topsoil (0–20 cm) samples (3331 in 2007 and 514 in 2022) were collected from the cultivated areas of Jiangjin District, Chongqing, Southwestern China. Soil pH, SOM, AHN and AK showed moderate variability with coefficient of variation (CV) values varying between 10 and 100%, except AP (CV > 100%, high variability). The mean soil pH, SOM, AP and AK in 2022 were significantly higher than those in 2007. AHN was significantly positively correlated with SOM (r = 0.531, p < 0.01 in 2007, r = 0.768, p < 0.01 in 2022) and significantly negatively correlated with soil pH (r = −0.186, p < 0.01 in 2007, r = −0.102, p < 0.05 in 2022). AP was significantly negatively correlated with soil pH (r = −0.075, p < 0.01 in 2007, r = −0.126, p < 0.01 in 2022). AK was significantly positively correlated with SOM (r = 0.164, p < 0.01 in 2007, r = 0.229, p < 0.01 in 2022), ANH (r = 0.131, p < 0.01 in 2007, r = 0.251, p < 0.01 in 2022) and AP (r = 0.145, p < 0.01 in 2007, r = 0.52, p < 0.01 in 2022). The exponential function performed best for the soil properties and all three nutrients, with higher R2 values (0.203 to 0.93 in 2007 and 0.316 to 0.796 in 2022) in both years. The nugget/sill ratios (which varied from 31.58% to 72% in 2007 and from 29.31% to 47.02% in 2022) indicated the moderate spatial dependence of all soil parameters, except AK in 2022 (nugget/sill ratio = 23.81%, strong spatial dependence). During the study period, soil pH, AP and AK increased in the central and northern areas; SOM increased in the northern and southwestern parts; AHN decreased in the central areas. The current study highlighted the change in spatial variability of soil pH, AHN, AP and AK in the study area over 15 years.

1. Introduction

At present, the world’s population, resource and environmental problems are becoming more and more prominent; in particular, China has a large population, and arable land accounts for only 15.9% of the national territory, such that the per capita share of arable land is far lower than the world average. According to relevant survey data [1], China’s per capita arable land area in 2022 was 0.09 hm2, equaling about one-third of the world’s per capita level. Since the reform and opening up, due to the rapid development of industrialization and urbanization, the rural population has been continuously migrating to the cities, resulting in a generally low utilization rate of arable rural land across the country [2]. Therefore, the question of how to utilize less arable land to obtain greater benefits has become the top priority of the current agricultural development in China. As the main type of arable land resources in Southwestern China, purple soil slope cropland is an important production base for food and agricultural products. However, purple soil is characterized by rich mineral nutrients, fast soil formation, high soil productivity, a shallow soil layer, high erodibility, poor drought resistance and serious degradation [3]. Adopting reasonable management measures to improve soil nutrients in the tillage layer is of great significance to enhance land productivity and ensure crop yield.
Fertility levels in cultivated soils have declined in various regions of the world, mainly due to unsuitable application of fertilizers and unsustainable farming management practices. In excessively acidic or excessively alkaline soils, nutrient transformation, microbial activity and element transport will be limited, thus affecting soil fertility and land productivity. It is reported that about 40% of arable soil is subject to acidification around the world [4]. Soil organic matter (SOM) is closely associated with soil fertility and crop growth and development because it impacts the soil’s physical, chemical and biological properties [5]. The loss of SOM in cultivated soils caused by agricultural management practices is found in different regions around the world [6]. SOM content can be enhanced by the addition of residual biomass and composts and by reduced tillage [7]. Soil nutrients are also important indicators of comprehensive soil productivity and key factors affecting crop yield. A large number of previous studies have shown that crop yield and nutrient uptake are quantitatively correlated with the effective nutrient content of the soil, especially alkali-hydrolyzable nitrogen, available phosphorus and available potassium [8,9]. Increasing the total quantity of effective nutrients in soil to achieve high crop yields through rational fertilization is one of the most important measures at present. The essential plant nutrients, nitrogen, phosphorus and potassium are the main parameters of soil nutrient status assessment, and their contents directly reflect the soil’s fertility status [10,11]. In addition to soil pH and organic matter, nitrogen is one of the most important factors affecting crop growth and yield [12,13]. However, excessive accumulation of nitrogen in agricultural soils can easily cause adverse effects on the ecological environment and human health [14,15]. Alkali-hydrolyzable nitrogen is one common form of nitrogen absorbed by plants, which reflects soil’s N-supplying capacity. There is no substitute for phosphorus for food crops [16]. In soils, phosphorus is easily fixed in a form that is unusable to plants. The available phosphorus content is generally very small; previous studies reported that only 10–20% of phosphorus fertilizer could be absorbed and utilized by crops [17]. Potassium is also a major essential nutrient for plants’ growth and development; however, most studies have reported that soil potassium is continuously deficient around the world [18,19]. It is worth noting that excessive application of these fertilizers might cause many ecological and economic concerns, such as resource wastage, low fertilizer efficiency and environmental pollution [15,20].
Understanding the spatial variability of these soil properties and their temporal change is essential for soil fertility management and agricultural production. This can be accomplished using geostatistical techniques, which generate values at unsampled locations in consideration of the spatial relationships between the values at the sampled sites and the estimated locations [21]. These approaches also reduce survey costs. We assumed that the spatio-temporal variability of alkali-hydrolyzable nitrogen (AHN), available phosphorus (AP), available potassium (AK) and related soil properties (soil organic matter (SOM) and pH) in the arable soils of a typical hilly region of Southwestern China is mainly due to adoption of different farming management practices, especially fertilizer applications in different years. Large amounts of chemical fertilizers, especially nitrogen fertilizer, were used in traditional farming activities. Overapplication of nitrogen fertilizer increases the risk of nitrate leaching and nitrogen gas emission, which have a negative impact on the environment and human health [14,15]. The present study aims to (1) analyze and visualize relations among AHN, AP, AK and associated soil properties and (2) assess the temporal and spatial variability of AHN, AP, AK and other soil properties in arable soils. The field work was carried out in 2007 and 2022. This study is expected to provide valuable information about the temporal and spatial variability of soil pH, SOM, AHN, AP and AK for site-specific sustainable nutrient management in arable soils.

2. Materials and Methods
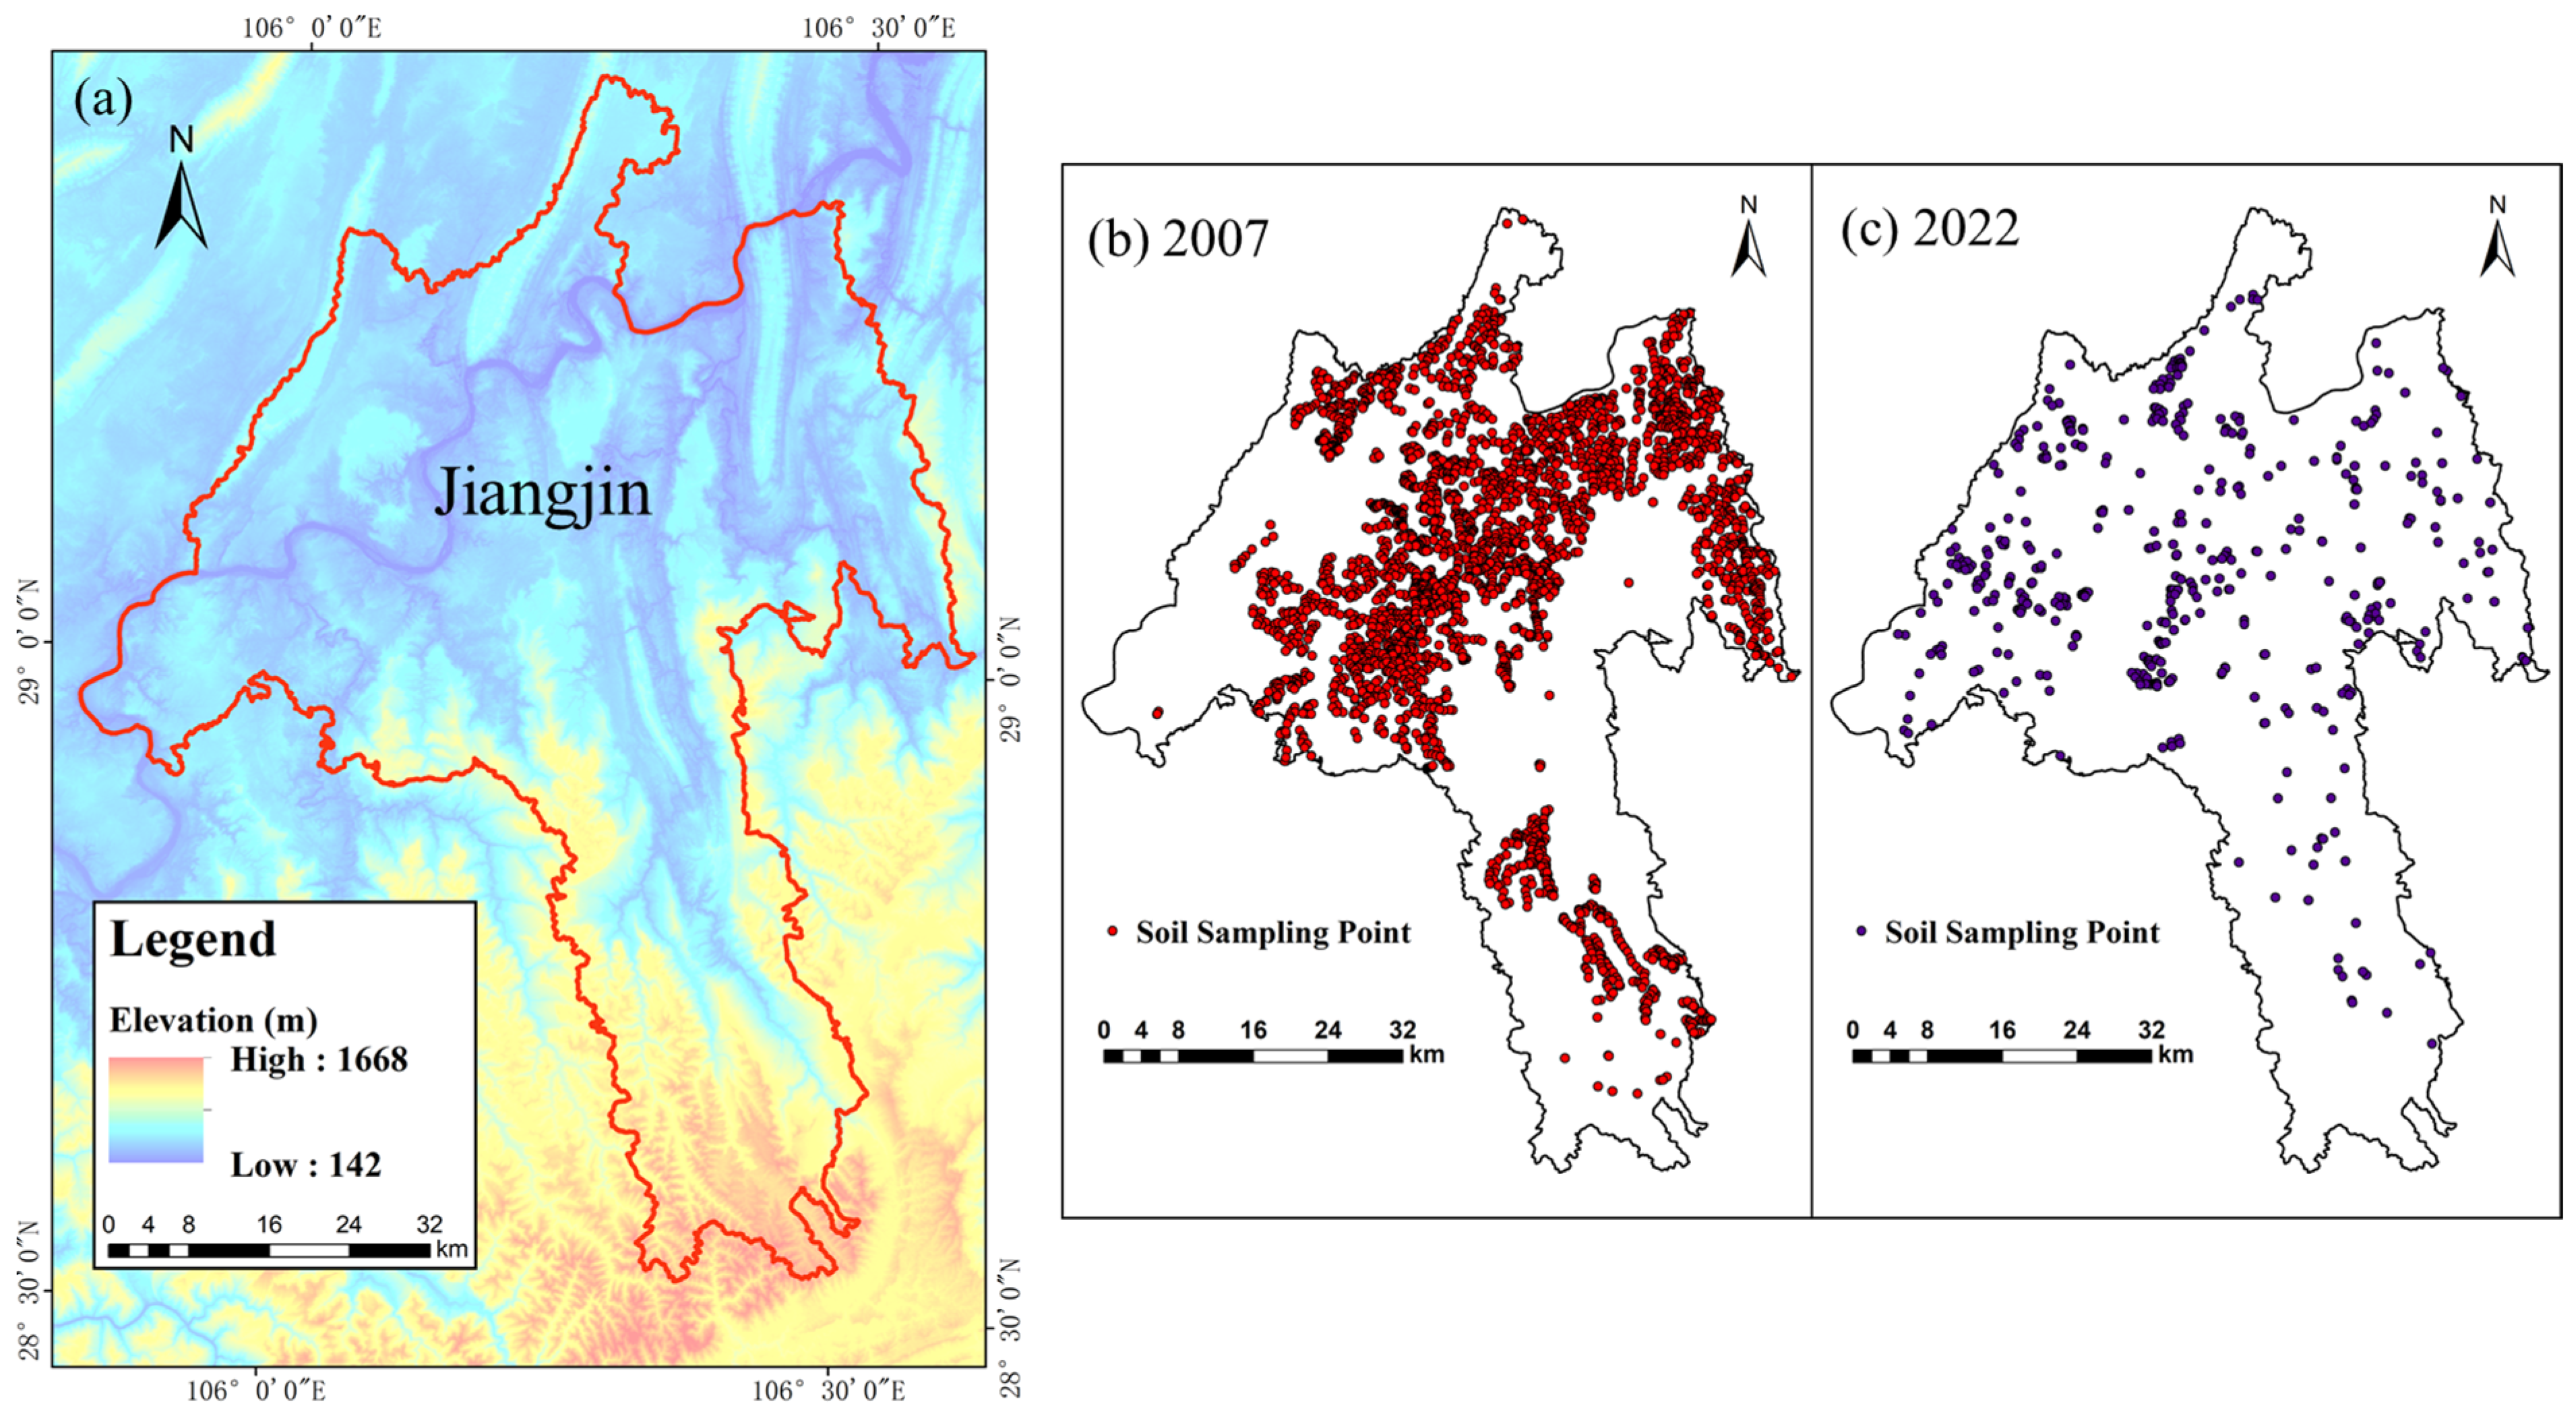
2.1. Study Area

The study area (Jiangjin District, 28°28′–29°28′ N latitude, 105°49′–106°49′ E longitude) covers about 3219 km2 and is located in the upper reaches of the Yangtze River, Southwestern China (Figure 1). The terrain is hilly and mountainous with elevation varying between 142 and 1668 m. The study area is sited in a subtropical monsoon zone. The average temperatures are 28 °C and 8 °C in summer and winter, respectively. The annual average precipitation is about 1034.7 mm, which mainly occurs during May to October. Soil types include ferralsols, fluvo-aquic soils, anthrosols and amorphic soils. The main crops are rice, wheat and various kinds of beans, and the cash crops are mainly rape, citrus and pepper. The application of nitrogen fertilizer reduced from 45.7% to 38%, that of phosphorus fertilizer increased from 9.7% to 29%, that of potassium fertilizer increased from 0.12% to 27.8%, and that of organic fertilizer increased from 1.98% to 5.3% from 2007 to 2022 [22]. To treat soil acidification, lime and some soil conditioners including calcium–magnesium–phosphorus fertilizers have been applied since 2016.

2.2. Data Collection

All data were obtained from the agricultural soil fertility survey database of Jiangjin District. These soil samples were collected from the cultivated soils (0–20 cm) after crops were harvested. For each location, a soil sample was made by thoroughly mixing 10 sub-samples taken within a radius of 10 m. Before the laboratory analysis, these soil samples were air-dried at room temperature and passed through a 2-mm soil sieve [23]. Soil properties (soil pH and organic matter (SOM)), alkali-hydrolyzable nitrogen (AHN), available phosphorus (AP) and available potassium (AK) were then determined in the laboratory. Soil pH was measured in a 1:2.5 soil–water suspension with a pH meter. SOM was determined by the wet oxidation–redox titration method. AHN was measured by the diffusion–absorption method. AP was measured by colorimetric analysis following extraction of soil with 0.5 mol L−1 NaHCO3. AK was quantified using 1.0 mol L−1 CH3COONH4 as an extractant [24].

2.3. Statistical Analyses

The classical statistics including maximum, minimum, mean, standard deviation (SD), coefficient of variation (CV), skewness and kurtosis were calculated for each soil parameter. A t-test was used to check the differences in soil parameters between the studied years. Levene’s test was applied to detect the normality and homogeneity of variance of the parameters. The Kolmogorov–Smirnov (K–S) test revealed that these data were lognormal (at p < 0.05). Pearson’s correlation analysis was used to calculate the correlations between the soil parameters to analyze the direction and strength of linear relationships. Principal component analysis (PCA) was employed to obtain important information from the original datasets by creating a set of new orthogonal variables (principal components). The data were examined using the Kaiser–Meyer–Olkin (KMO) test and Bartlett’s test. The KMO test is used for evaluating the number of samples, and Bartlett’s test for homogeneity of variances. Every principal component having an eigenvalue ≥1 was considered. These analyses were performed with SPSS version 21.2.

2.4. Geostatistical Analysis

A semi-variogram analysis of soil pH, SOM, AHN, AP and AK in 2007 and 2022 was carried out using GS+ version 9. For each soil parameter, the semi-variogram function was built, and values of range and nugget/sill ratio were calculated. The semi-variograms were best fitted in isotropic form with the cross-validation technique. Interpolation was performed by the ordinary kriging method with these best-fitted models’ spatial parameters in ArcGIS 10.5. The geostatistical technique studies natural phenomena with randomness and structure based on the semi-variance function, which is expressed by:
γ h = 1 2 N h i = 1 N h Z x i + h Z x i 2 ,
where h is a distance interval, Z(xi) and Z(xi + h) are values of two samples separated by h, N(h) is the number of sample pairs within h, and γ* (h) is the semi-variogram value at h. Semi-variogram plots were obtained by choosing an optimal fitting model, such as exponential function,
γ h = C 0 + C 1 e h / a
where C0 and C denote nuggets and partial sill, respectively; C0 + C is sill; and a is the range. This function is of great importance in statistical theory, as it expresses the nature of the spatial randomness of the sample parameters, and it is a function of the variance of first-order autoregressive and Markov processes. A flowchart of this study’s methodology is shown in Figure 2.

3. Results

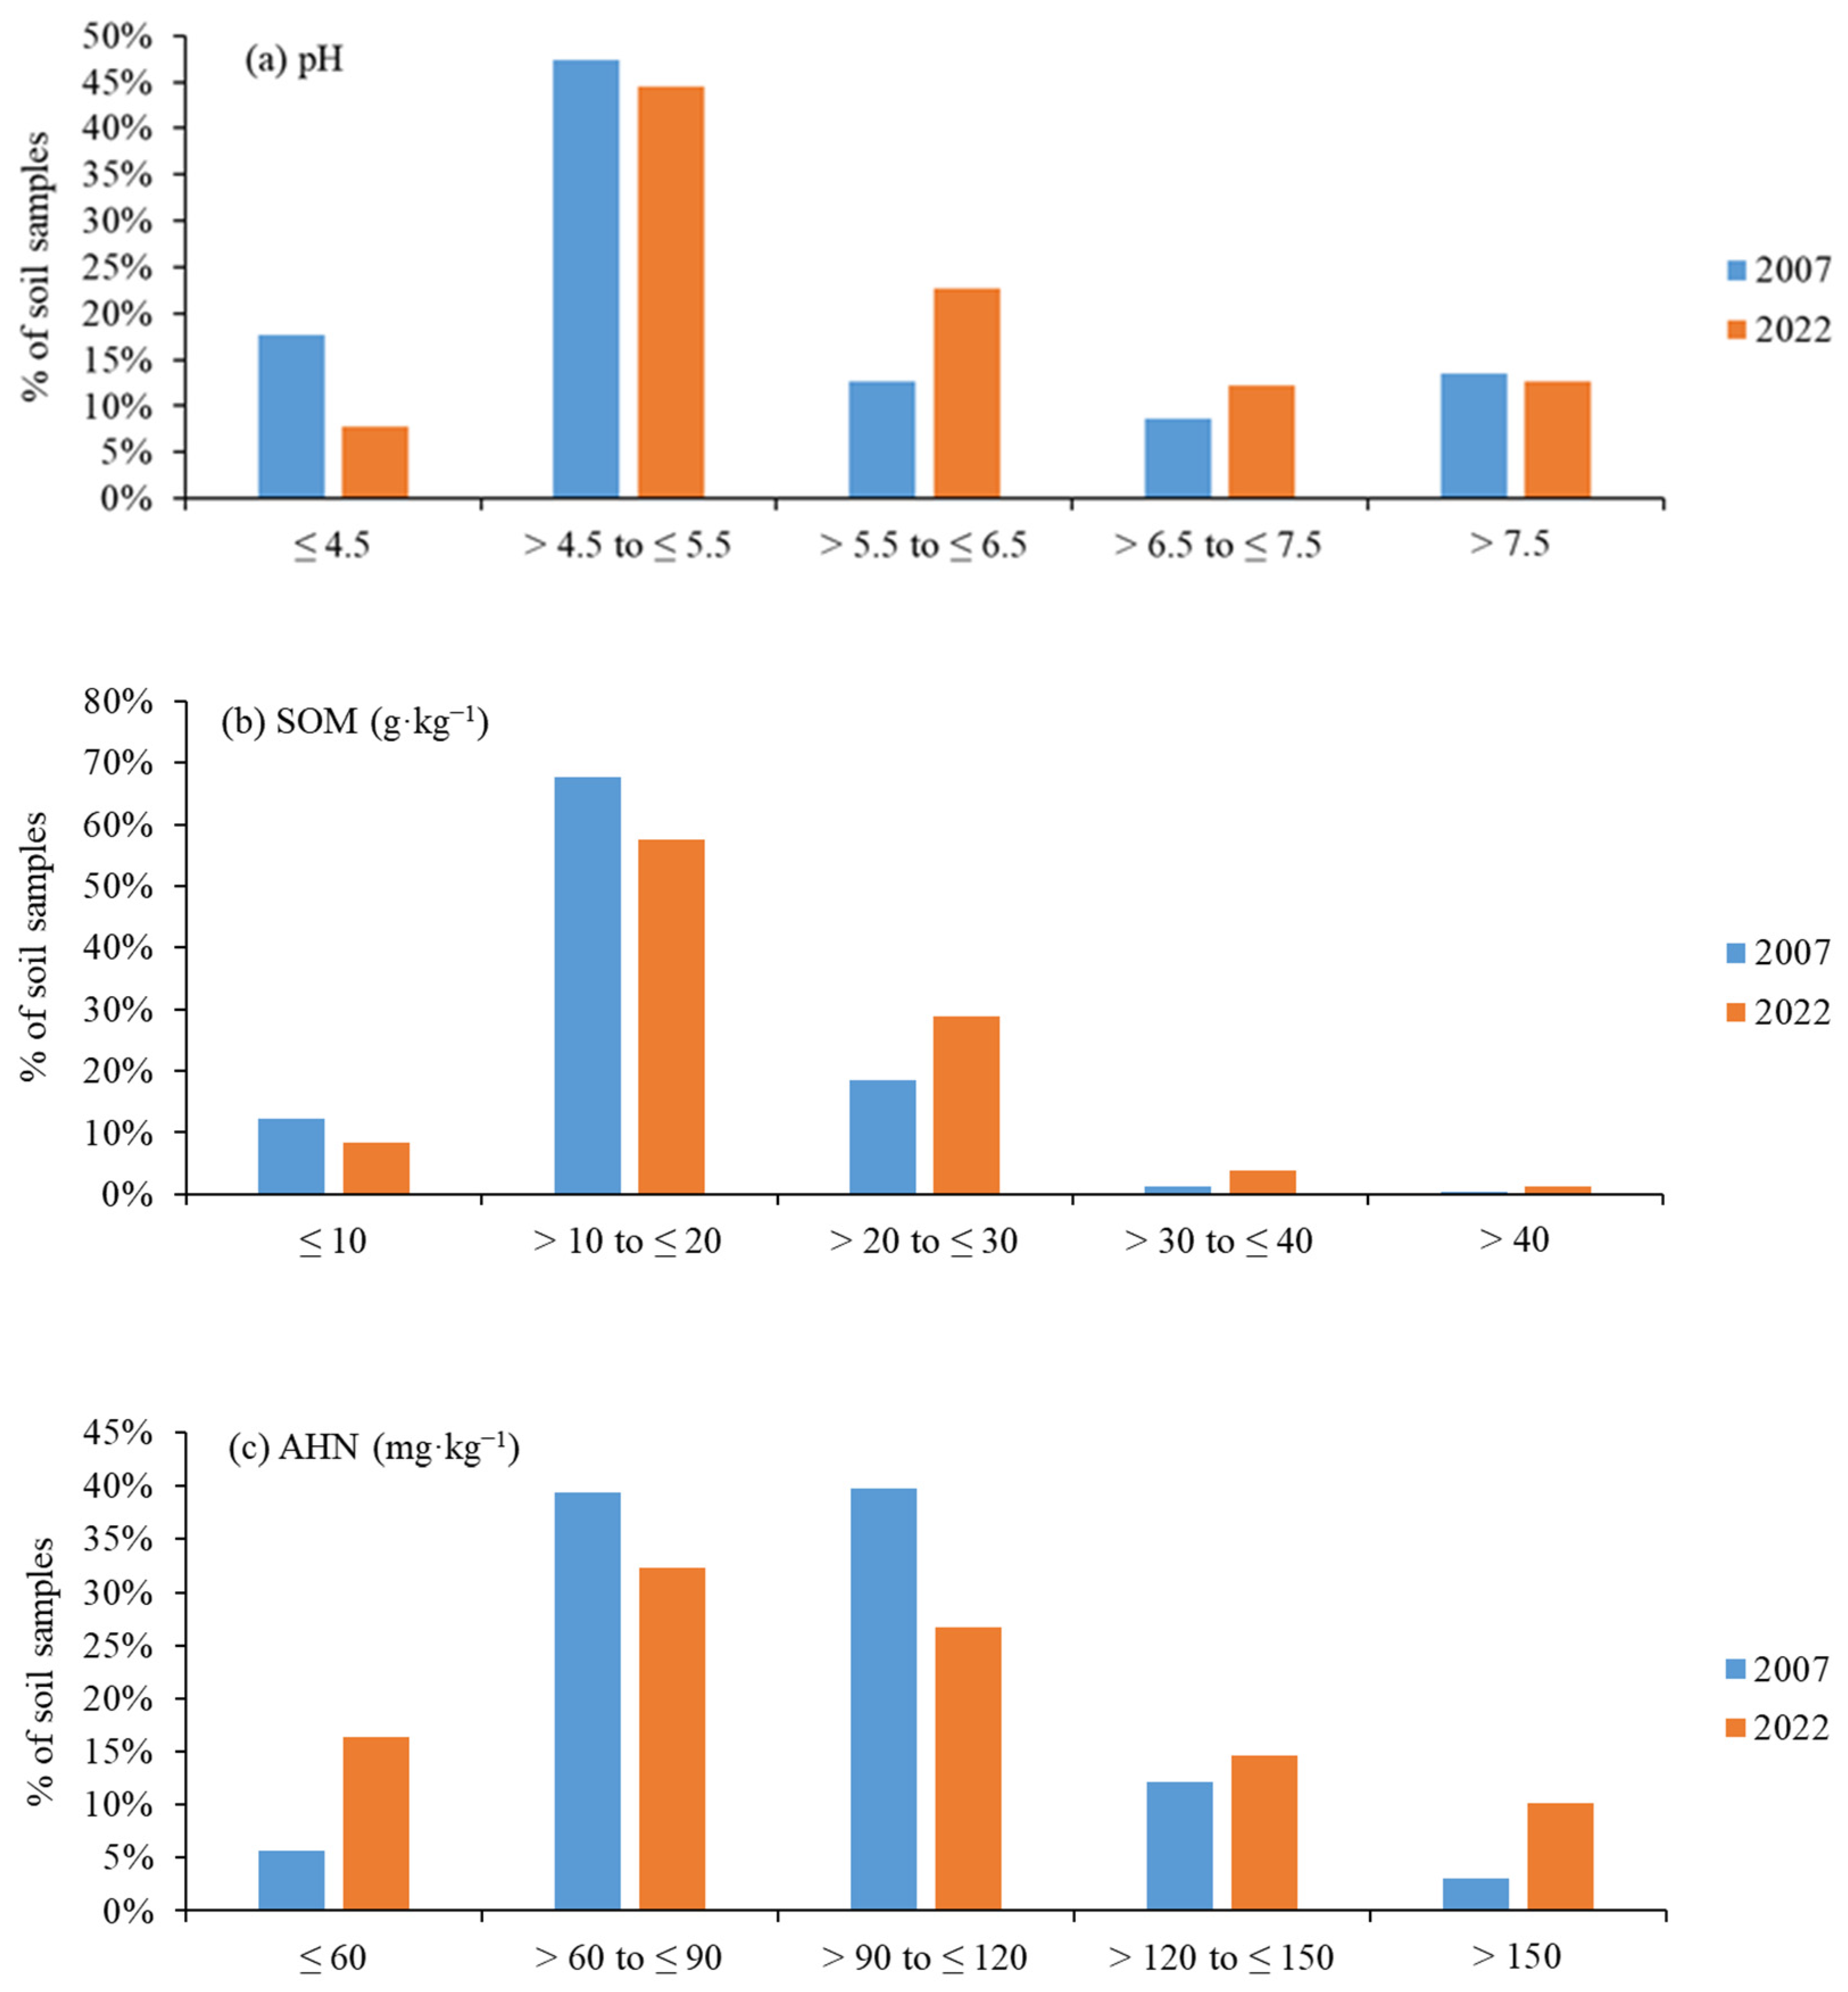
3.1. Descriptive Statistical Analysis

On average, the arable soils were acidic in both years, but the mean pH values increased significantly from 5.54 in 2007 to 5.81 in 2022 (Table 1). Soil pH presented moderate variations in both years (10% < CV ≤ 100%), according to Nielsen and Bouma [25]. About 17.74% and 7.78% of soil samples had pH values of ≤4.5, 47.43% and 44.55% had ≤5.5 and 12.67% and 22.76% had ≤6.5 in 2007 and 2022, respectively (Figure 3). Mean SOM was significantly higher in 2022 than in 2007. SOM presented moderate variations in both years. About 12.28% and 8.37% of soil samples had SOM values of ≤10 g/kg, 67.73% and 57.59% had ≤20 g/kg and 18.43% and 28.79% had ≤30 g/kg in 2007 and 2022, respectively. No significant difference in AHN was found between the two years. AHN presented moderate variations over the study area. About 5.61% and 16.34% soil samples had AHN values of ≤60 mg/kg, 39.42% and 32.30% had ≤90 mg/kg and 39.78% and 26.65% had ≤120 mg/kg in 2007 and 2022, respectively. AP increased significantly from 11.04 mg/kg in 2007 to 42.69 mg/kg in 2022. AP presented high variations in both years (CV > 100%). About 41.91% and 25.49% soil samples had AP values of ≤5 mg/kg, and 39.66% and 22.57% had ≤15 mg/kg in 2007 and 2022, respectively. AK was much higher in 2022 (153.04 mg/kg) than in 2007 (82.88 mg/kg). AK presented moderate variations in two years. About 18.82% and 5.06% soil samples had AK values of ≤50 mg/kg, 35.59% and 12.84% had ≤75 mg/kg and 23.96% and 16.15% had ≤100 mg/kg in 2007 and 2022, respectively.

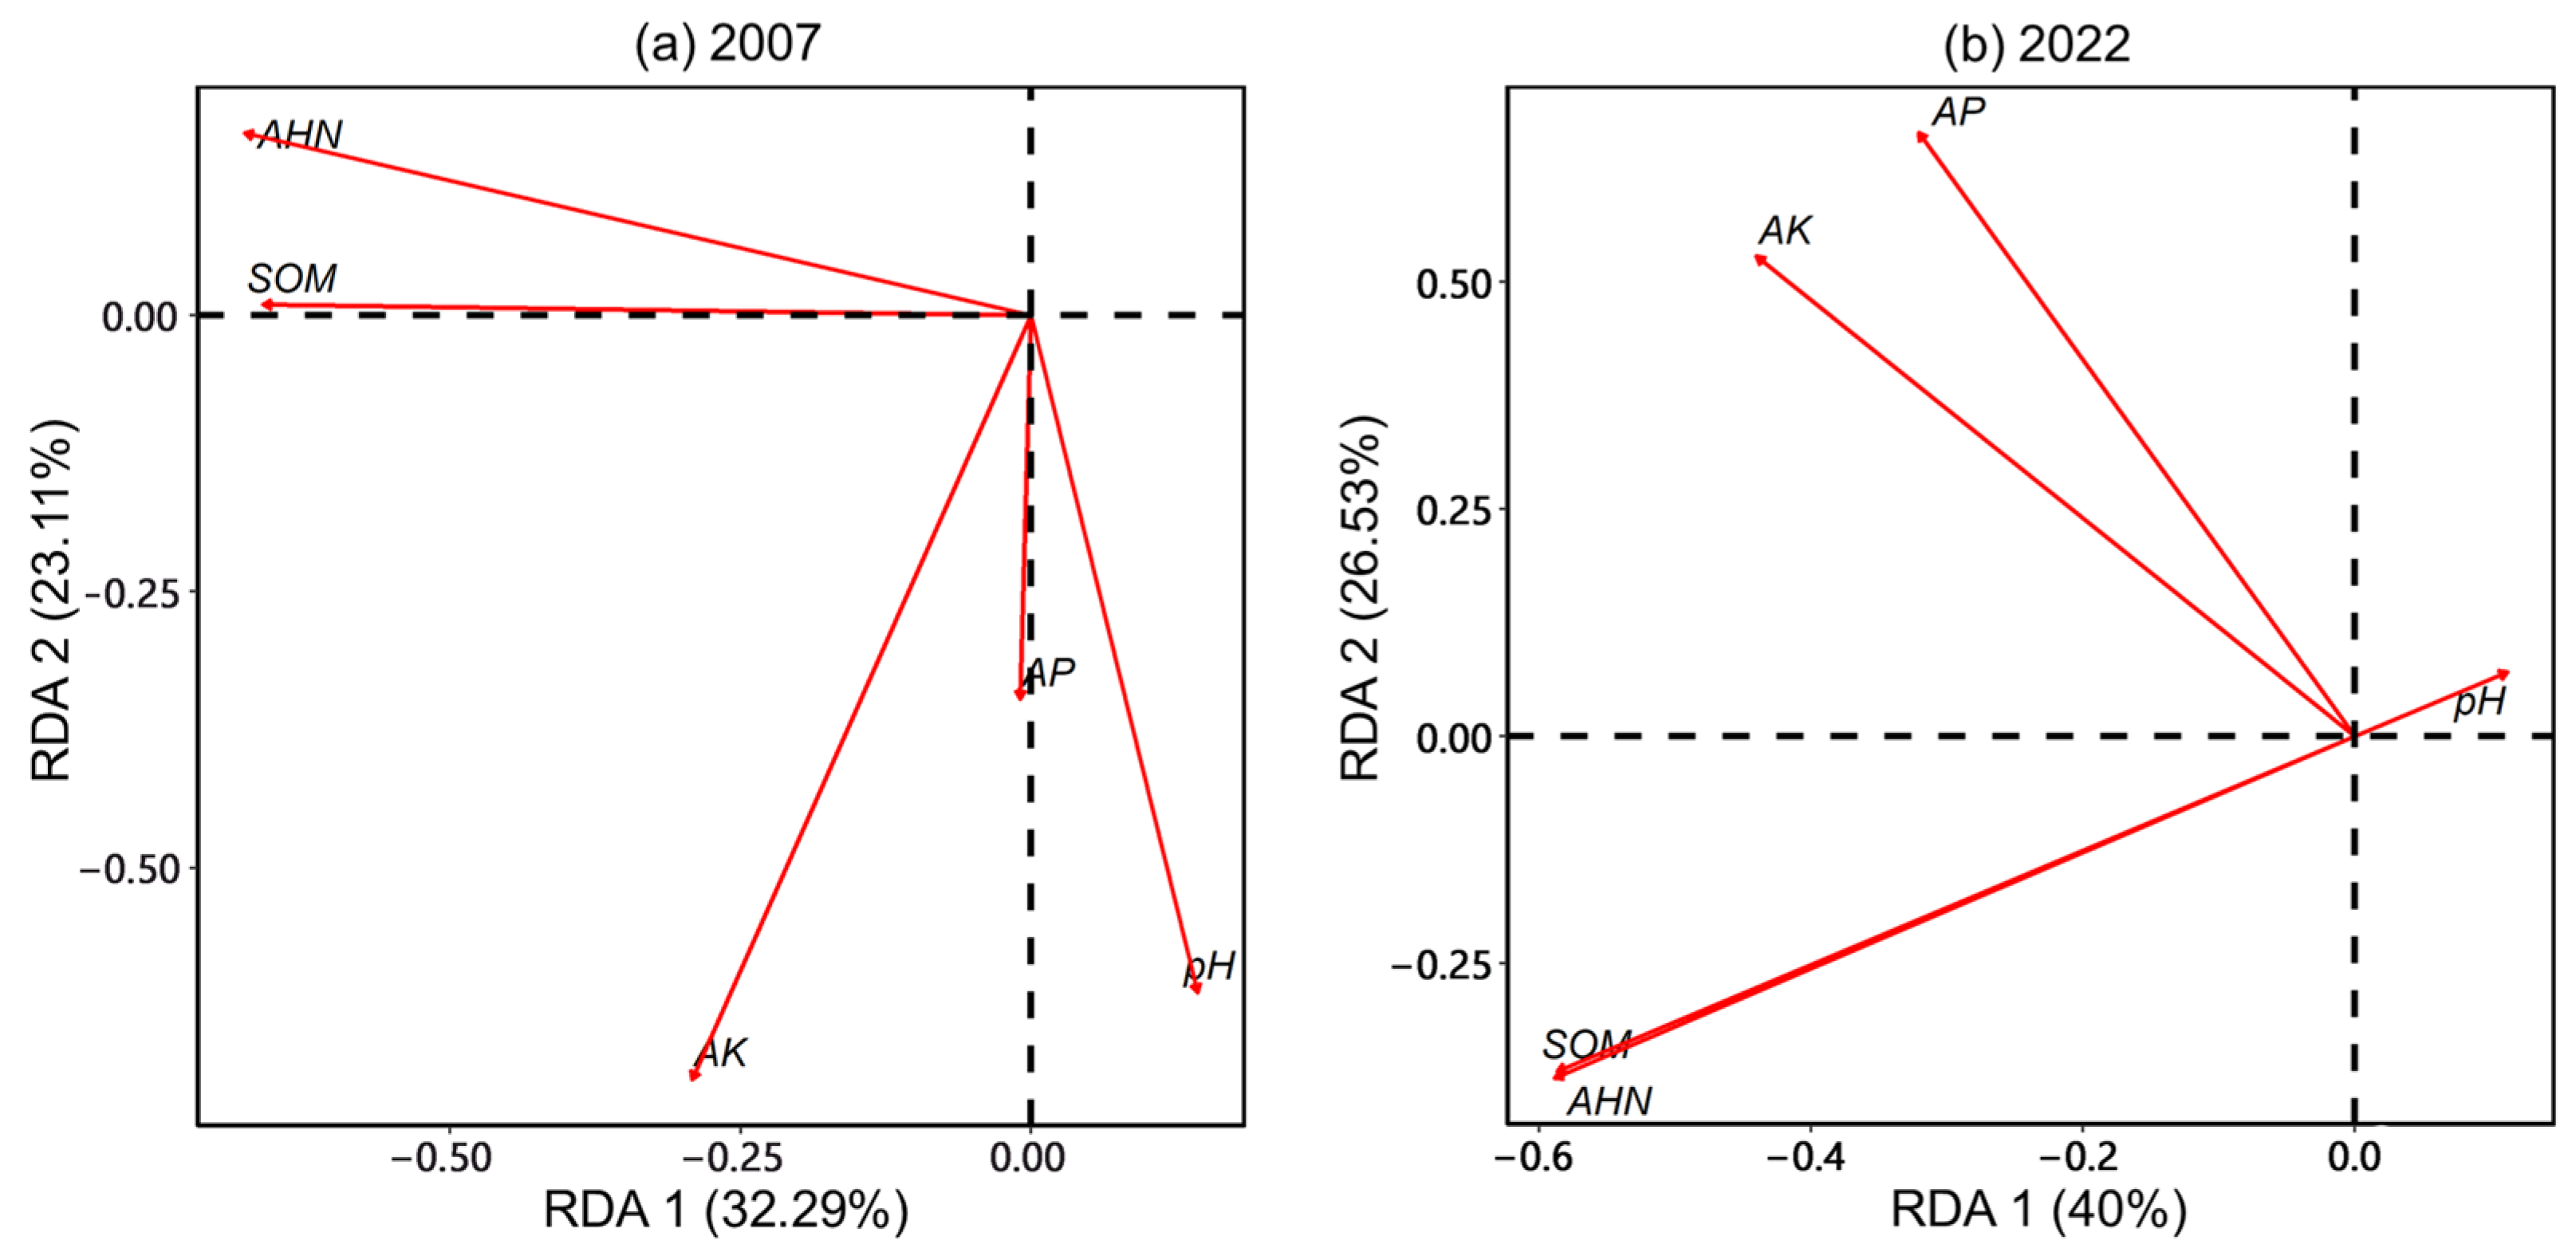
3.2. Relationships between Soil Parameters

Table 2 shows the relationships between soil parameters in different years. Soil pH was significantly negatively correlated with AHN and AP in 2007 and 2022 and positively correlated with AK in 2007. SOM was significantly positively correlated with AHN in 2007 and 2022 and negatively correlated with AP in 2007. AK was significantly positively correlated with SOM, AHN and AP in 2007 and 2022. No significant relationship was found between AHN and AP in either year. Principal component analysis (PCA) yielded three PCs having eigenvalues >1 in both years (Table 3). In 2007, three PCs (PC1, PC2 and PC3) explained 32.29, 23.11 and 21.91% of total variability, respectively. In 2022, three PCs (PC1, PC2 and PC3) accounted for 40, 26.53 and 20.57% of total variability, respectively. PC1 was mainly dominated by SOM and AHN in both years. PC2 was dominated by AK in 2007 and by AP in 2022. PC3 was dominated by AP in 2007 and by pH in 2022. These are also indicated by the biplots (PC1 vs. PC2, Figure 4).

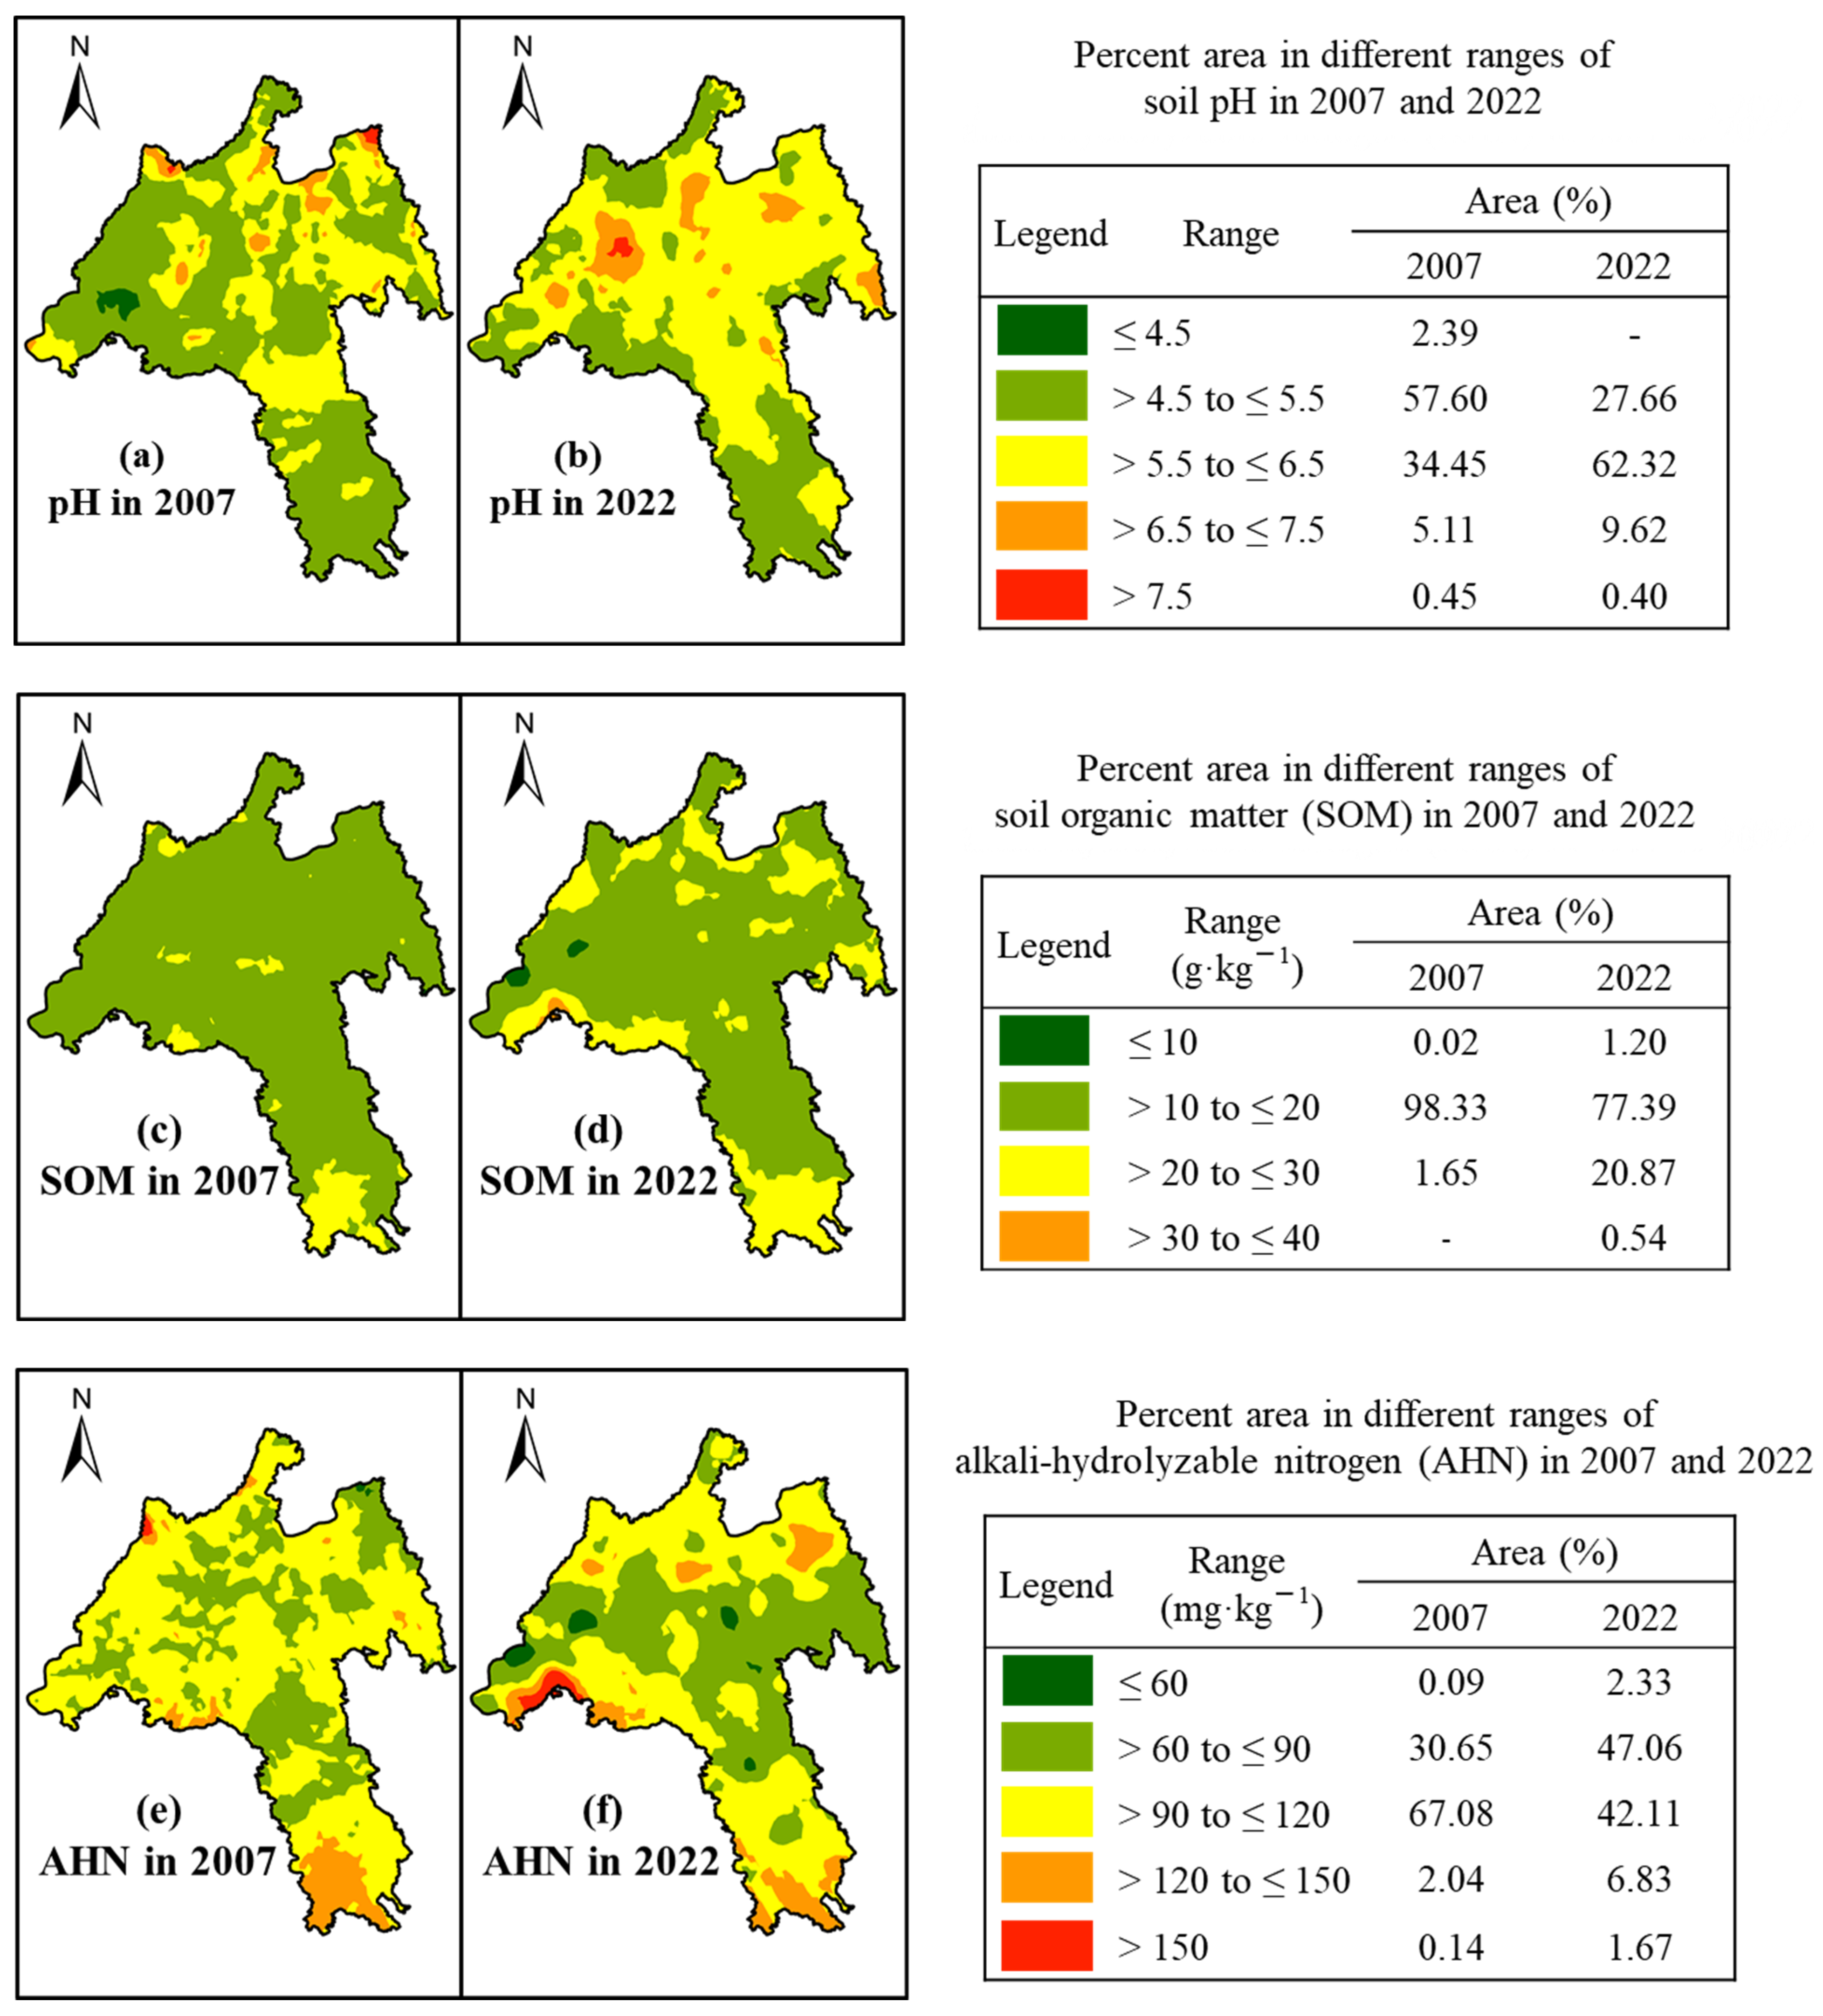
3.3. Temporal and Spatial Variability of Soil Parameters

The exponential semi-variance function performed best for all soil parameters in both years (Figure 5, Table 4). The nugget/sill ratios of soil pH, OM, AHN, AP and AK varied from 31.58% to 72% in 2007 and from 23.81% to 47.02% in 2022. For soil pH, the values of range were 3960 and 3870 m in 2007 and 2022, respectively. For SOM, the values of range were 2460 and 3300 m in 2007 and 2022, respectively. For AHN, the values of range were 2910 and 3540 m in 2007 and 2022, respectively. For AP, the values of range were 2850 and 4590 m in 2007 and 2022, respectively. For AK, the values of range were 3780 and 184,650 m in 2007 and 2022, respectively.
For each soil nutrient, different spatial distribution patterns were observed in the two years over the study area (Figure 6). Soil pH was very low in most parts of the area in 2007. A clear spatial and temporal change in soil pH was observed in 2022 over this region. The % area with soil pH of 4.5–5.5 decreased from 57.6% in 2007 to 27.66% in 2022. The % area with soil pH of 5.5–6.5 decreased from 34.45% in 2007 to 32.32% in 2022. The % area with soil pH of 6.5–7.5 increased from 5.11% in 2007 to 9.62% in 2022. SOM was also very low over the study area in 2007. The enhancement of SOM was found mainly in the northern area in 2022. The % area with SOM of 10–20 g/kg decreased from 98.33% in 2007 to 77.39% in 2022. The % area with SOM of 20–30 g/kg increased from 1.65% in 2007 to 20.87% in 2022. AHN was high in 2007 and decreased in 2022. The reduction in AHN was observed mainly in the central parts. The % area with AHN of 60–90 mg/kg increased from 30.65% in 2007 to 47.06% in 2022. The % area with AHN of 90–120 mg/kg decreased from 67.08% in 2007 to 42.11% in 2022. AP was low in 2007 and high in 2022. The soils with higher AP mainly appeared in the northern and southern parts. The % area with AP of 5–15 mg/kg decreased from 76.31% in 2007 to 13.89% in 2022. The % area with AP of 15–25 mg/kg increased from 5.58% in 2007 to 27.84% in 2022. The % area with AP of 25–40 mg/kg increased from 0.53% in 2007 to 27.87% in 2022. About 30.33% of the area had AP of >40 mg/kg in 2022. AK was low in 2007 and high in 2022. The soils with higher AK mainly distributed in the northern and southern parts. The % area with AK of 75–100 mg/kg decreased from 36.24% in 2007 to 7.96% in 2022. The % area with AK of 100–150 mg/kg increased from 7.74% in 2007 to 53.81% in 2022. About 36.88% of the area had AK of >150 mg/kg in 2022.

4. Discussion

4.1. Temporal Change in Soil Parameters

According to Nielsen and Bouma [25], soil pH, SOM, AHN and AK presented moderate variation and AP exhibited high variation in 2007 and 2022. The soils were acidic during the study years, although the soil pH was significantly higher in 2022 than 2007. This could be attributed to the application of lime and soil conditioners since 2016. The mean SOM value in the study area improved from 2007 to 2022 due to the additive application of organic fertilizers to the soil [26,27]. Compared to 2007, the soil had greatly higher values of AP and AK in 2022. The application of organic fertilizers is an effective way to increase the content of SOM. Rich SOM content could result in an increase in other nutrient elements [28]. Therefore, the increments in phosphorus and potassium can probably be ascribed to the applications of organic fertilizers, phosphorus fertilizers and potassium fertilizers.

4.2. Relationships between Soil Properties and Nutrients

The AHN concentration was significantly positively correlated with SOM and AP and significantly negatively correlated with pH in both years. This suggests that AHN increases with SOM and AP and decreases with pH in the soils. Similar findings were reported by Gao et al. in vegetable-growing areas of Guangdong [29]. Most soil nitrogen comes from organic matter; higher soil organic matter content provides a richer source of soil AHN, and so AHN is high when SOM is high. While the soil is slightly acidic, the competition between H and NH+ is enhanced, resulting in competitive inhibition of nitrogen uptake by plant roots, which reduces the amount of nitrogen uptake, resulting in a higher content of AHN in the soil; when the soil pH becomes higher, it increases the amount of nitrogen uptake, and the content of AHN in the soil decreases accordingly [30]. The content of AK was significantly positively correlated with soil pH and SOM, indicating that the AK concentration increased with soil pH and SOM. Soil pH plays an important role in determining the availability of nutrients to plants. Generally, at higher soil pH levels (slightly alkaline to neutral), the availability of potassium increases. This is because alkaline conditions enhance the dissolution of potassium-containing minerals, making potassium more accessible to plants [31]. Therefore, as soil pH increases, the AK also tends to increase. Soil organic matter is known to influence soil properties such as cation exchange capacity (CEC). CEC refers to the ability of soil to exchange and retain positively charged ions such as potassium. High levels of SOM increase the CEC of soil, leading to better retention and availability of potassium ions [32]. As a result, soils with higher organic matter content tend to have higher levels of available potassium.
The concentration of AP was significantly negatively correlated with soil pH and SOM, indicating that the AP concentration decreases with soil pH and SOM. Soil pH strongly influences the chemical forms and availability of phosphorus in soil. In alkaline soils (higher pH), phosphorus tends to form insoluble compounds with calcium, iron and aluminum, making it less available to plants. This process is known as phosphorus fixation, where phosphorus becomes immobilized and less accessible for plant uptake [33,34]. Therefore, as soil pH increases, the availability of phosphorus (AP) tends to decrease. Soil organic matter has a high affinity for phosphorus ions, leading to their adsorption and retention in the soil. As a result, soils with higher organic matter content tend to retain more phosphorus, reducing its availability for plant uptake. Additionally, the presence of SOM can enhance phosphorus fixation by facilitating its binding with soil minerals and organic compounds [35]. In this region, acidic purple soils have the greatest risk of phosphorus release; therefore, phosphate fertilizer management measures should be developed for agricultural production.
PC1 was dominated by SOM and AHN in 2007 and 2022, indicating that the changes in them were similar during this period. The differences in PC2 and PC3 in different years might be ascribable to the application of large amounts of P fertilizers, K fertilizers, soil conditioners and calcium–magnesium–phosphorus fertilizers in recent years [22].

4.3. Characteristics of Spatio-Temporal Variations of Soil Parameters

An exponential function was the best fitted semi-variogram model for all soil parameters. The nugget value suggests the micro-variability of the target variable. AP had the largest nugget values in both years indicating, that the sampling distance for AP might be different from those of other nutrients and that the current sampling distance might not effectively capture the micro-variability of AP. The range value of the semi-variance function represents the distance within which two soil samples are considered to be spatially dependent; otherwise, the two samples are not spatially dependent. The soil nutrients having a larger range value might be influenced by natural environmental and human factors for a greater distance than those having a smaller range value. The larger change in range values of AK in the two years might be caused by the combined influence of internal factors (such as geology, topography and climate conditions) and external factors (such as various farming practices for different crops).
The nugget/sill ratios varying from 29.31% to 72% indicated that these soil nutrients had moderate spatial dependence in the two years, except for AK in 2022 (nugget/sill = 23.81%; strong spatial dependence). The moderate spatial dependence of these soil nutrients could be attributed to the combined impacts of natural factors (i.e., geology and topography) and human activities (i.e., cultivation of different crops and farming practices). AK in 2022 showed stronger spatial dependence and had a larger range value than AK in 2007, indicating that this nutrient might be affected mainly by natural conditions, such as topography and soil types, over a greater distance.
The spatial distribution of the soil parameters was different in 2007 and 2022 (Figure 6). Soil pH, SOM, AP and AK increased in many areas of the study site from 2007 to 2022.
The increase in pH was mainly due to the implementation of measures to improve soil acidification, such as the applications of soil conditioners and calcium–magnesium–phosphorus fertilizers. Soil conditioners increase the pH values by chemically neutralizing the acids in the soil. These substances dissolve and react with the hydrogen ions (H⁺) and the Al3⁺ in the soil to form water and insoluble compounds, thus reducing the acidity of the soil. According to Liu et al., the application of soil conditioners greatly increased soil pH, available phosphorus and potassium [36]. Ca2⁺ in calcium and magnesium phosphate fertilizers can neutralize H⁺ in the soil, thereby reducing soil acidity and raising the soil pH. Mg2⁺ also neutralizes soil acidity in a similar way to calcium. Calcium and magnesium react with soil acids to form insoluble alkaline salts that persist in the soil and continue to regulate soil pH. Calcium and magnesium ions can occupy exchange sites on soil colloids, reducing the quantities of hydrogen and aluminum ions exchanged and thus reducing the risk of soil acidification [37]. Calcium and magnesium promote the decomposition of soil organic matter, releasing more carbonates, which neutralize soil acids [38,39]. However, the decreased soil pH was also scattered in some areas, which might be ascribable to the change in land use (from paddies to vegetable fields). It has been noted that changes in land use can lead to a decrease in soil pH [40,41].
The increase in SOM was mainly distributed in the northern and southwestern areas of the study site due to the increasing application of organic fertilizer. However, the loss of SOM was observed in the western areas. This was probably due to intensive tillage and less addition of crop residues. A decline in the SOM content of cultivated soils is also found around the world [42,43]. Some agricultural management activities, such as addition of crop residues, crop rotation and reduced tillage, could improve SOM content [44,45].
The decline in AHN was found mainly in the central parts of the study site due to the agricultural practices of reducing nitrogen fertilization in recent years. According to Ning et al., the reduction in N fertilizer application did not reduce yield [46].
However, the increased AHN was also scattered in some areas, which might be ascribed to the change in land use (such as from paddies to dry land). Relevant studies have demonstrated that changes in land use patterns can lead to a rise in AHN [47].
Both AP and AK increased in the study area. On the one hand, farmers responded positively to the policy of changing the ratio and structure of fertilizers by increasing the application of potassium and phosphorus fertilizers. Lin et al.’s study also proved that the application of fertilizers was the main reason for the increase in AP and AK [48,49]. On the other hand, soil conditioners used in the treatment of soil acidification also increase AP and AK contents.

4.4. Implications and Limitations

The cultivated soils in the study area had higher concentrations of pH, SOM, AP and AK in 2022 than in 2007. However, acidic soils were still observed across the region. Continuous farming practices for alleviating soil acidification should be promoted and encouraged. The soils had medium SOM fertility levels, although the SOM concentration was increased from 2007 to 2022. Therefore, more efforts should be made to improve SOM concentration by the addition of crop residues, crop rotation and reduced tillage. Regarding the concentrations of AP and AK, it is not always true that larger amounts are better. For example, high surpluses of K may cause an unbalanced composition of nutrients in soils [50]. Excessive soil P can increase the risk of non-point-source pollution [51].
The main limitations of this work are as follows: (1) the sampling locations were different in the two years, and (2) the spatial distribution of soil nutrients in 2007 and 2022 was initially obtained by kriging interpolation. Although these inevitably introduce uncertainty, the findings provide valuable insights into the trends and patterns of variability in soil properties within a certain period of time.

5. Conclusions

The present work examined the temporal and spatial variability of soil pH, SOM, AHN, AP and AK in a typical agricultural region of Southwestern China. During the study period, soil pH, AP and AK concentrations increased in the central and northern areas, and SOM increased in the northern and southwestern parts, while AHN decreased in the central areas. Soil pH, SOM, AHN and AK exhibited moderate variability, while AP had high variability in both years. The concentration of AHN was significantly positively correlated with SOM and AK and negatively correlated with soil pH. The concentration of AK was significantly positively correlated with SOM and AP. The concentration of AP was significantly negatively correlated with soil pH. The soil nutrients had moderate to strong spatial dependence over the region. The results highlighted that (1) the adopted measurements could improve soil acidification and that (2) more efforts should be taken to enhance SOM content. Further studies on the spatio-temporal variability of soil nutrients in other agricultural areas are needed to design region-specific sustainable soil nutrient management plans around the world.

Author Contributions

Conceptualization, B.-X.G., Z.-Y.W., W.W. and H.-B.L.; methodology, B.-X.G.; software, B.-X.G.; resources, J.Z., L.-Q.Z. and H.-B.L.; data curation, J.Z., L.-Q.Z. and H.-B.L.; writing—original draft, B.-X.G.; writing—review and editing, W.W. and Z.-Y.W. All authors have read and agreed to the published version of the manuscript.

Funding

This research received no external funding.

Data Availability Statement

The data are contained within the article.

Conflicts of Interest

The authors declare no conflicts of interest.

References

  1. National Bureau of Statistics of China. China Statistical Yearbook 2023. Available online: https://www.stats.gov.cn/sj/ndsj/2023/indexch.htm (accessed on 5 August 2024).
  2. Yan, D.; Wu, S.; Tang, Y.; Zhu, J.; Zhou, S.; Xu, Z. Arable land and water footprints for food consumption in China: From the perspective of urban and rural dietary change. Sci. Total Environ. 2022, 838, 155749. [Google Scholar] [CrossRef] [PubMed]
  3. Li, Q.; Luo, Y.; Wang, C.; Li, B.; Zhang, X.; Yuan, D.; Gao, X.; Zhang, H. Spatiotemporal variations and factors affecting soil nitrogen in the purple hilly area of Southwest China during the 1980s and the 2010s. Sci. Total Environ. 2016, 547, 173–181. [Google Scholar] [CrossRef] [PubMed]
  4. Brown, K.A. Chemical effects of pH-3 sulfuric-acid on a soil-profile. Water Air Soil Pollut. 1987, 32, 201–218. [Google Scholar] [CrossRef]
  5. Honorato Fernandes, M.M.; Coelho, A.P.; Fernandes, C.; da Silva, M.F.; Dela Marta, C.C. Estimation of soil organic matter content by modeling with artificial neural networks. Geoderma 2019, 350, 46–51. [Google Scholar] [CrossRef]
  6. Ogle, S.M.; Breidt, F.J.; Paustian, K. Agricultural management impacts on soil organic carbon storage under moist and dry climatic conditions of temperate and tropical regions. Biogeochemistry 2005, 72, 87–121. [Google Scholar] [CrossRef]
  7. Rumpel, C.; Chabbi, A. Managing Soil Organic Carbon for Mitigating Climate Change and Increasing Food Security. Agronomy 2021, 11, 1553. [Google Scholar] [CrossRef]
  8. Wen, X.; Gu, L.; Wen, S. Job satisfaction and job engagement: Empirical evidence from food safety regulators in Guangdong, China. J. Clean. Prod. 2019, 208, 999–1008. [Google Scholar] [CrossRef]
  9. Zhang, X.; Zhu, A.; Xin, X.; Yang, W.; Zhang, J.; Ding, S. Tillage and residue management for long-term wheat-maize cropping in the North China Plain: I. Crop yield and integrated soil fertility index. Field Crops Res. 2018, 221, 157–165. [Google Scholar] [CrossRef]
  10. Mugo, J.N.; Karanja, N.N.; Gachene, C.K.; Dittert, K.; Nyawade, S.O.; Schulte-Geldermann, E. Assessment of soil fertility and potato crop nutrient status in central and eastern highlands of Kenya. Sci. Rep. 2020, 10, 7779. [Google Scholar] [CrossRef]
  11. Liang, Z.; Zou, T.; Gong, J.; Zhou, M.; Shen, W.; Zhang, J.; Fan, D.; Lu, Y. Evaluation of Soil Nutrient Status Based on LightGBM Model: An Example of Tobacco Planting Soil in Debao County, Guangxi. Appl. Sci. 2022, 12, 12354. [Google Scholar] [CrossRef]
  12. Giroux, M. Effects of nitrogen-fertilization on yields and total nitrogen-content of alfalfa (Medicago sativa L.). Nat. Can. 1979, 106, 535–538. [Google Scholar]
  13. Ronga, D.; Pentangelo, A.; Parisi, M. Optimizing N Fertilization to Improve Yield, Technological and Nutritional Quality of Tomato Grown in High Fertility Soil Conditions. Plants 2020, 9, 575. [Google Scholar] [CrossRef] [PubMed]
  14. Conley, D.J.; Paerl, H.W.; Howarth, R.W.; Boesch, D.F.; Seitzinger, S.P.; Havens, K.E.; Lancelot, C.; Likens, G.E. ECOLOGY Controlling Eutrophication: Nitrogen and Phosphorus. Science 2009, 323, 1014–1015. [Google Scholar] [CrossRef] [PubMed]
  15. Perera, M.K.; Englehardt, J.D. Simultaneous nitrogen and phosphorus recovery from municipal wastewater by electrochemical pH modulation. Sep. Purif. Technol. 2020, 250, 117166. [Google Scholar] [CrossRef]
  16. Cordell, D.; White, S. Life’s bottleneck: Sustaining the world’s phosphorus for a food secure future. Ann. Rev. Environ. Resour. 2014, 39, 161–188. [Google Scholar] [CrossRef]
  17. Goldstein, A. Phosphate starvation inducible enzymes and proteins in higher plants. In Society for Experimental Biology Seminar Series; Cambridge University Press: Cambridge, UK, 1992; pp. 25–44. [Google Scholar]
  18. Jamil, N.; Kumar, P.; Batool, R. Soil Microenvironment for Bioremediation and Polymer Production; John Wiley & Sons: Hoboken, NJ, USA, 2019; ISBN 9781119592129. [Google Scholar]
  19. Liu, T.C.; Bai, L.L.; Huang, L.F.; Mao, D.H. NP and 9311 are excellent population parents for screening QTLs of potassium-efficient rice. PLoS ONE 2023, 18, e0284510. [Google Scholar] [CrossRef] [PubMed]
  20. Covaciu, D.C.; Balint, A.C.; Neamtu, C.V.; Mosneag, S.C.; Bordea, D.; Dirjan, S.; Odagiu, A.C.M. Assessment of Groundwater Quality in Relation to Organic versus Mineral Fertilization. Water 2023, 15, 2895. [Google Scholar] [CrossRef]
  21. Behera, S.K.; Shukla, A.K.; Pachauri, S.P.; Shukla, V.; Sikaniya, Y.; Srivastava, P.C. Spatio-temporal variability of available sulphur and micronutrients (Zn, Fe, Cu, Mn, B and Mo) in soils of a hilly region of northern India. CATENA 2023, 226, 107082. [Google Scholar] [CrossRef]
  22. Jiangjin District Local History Office (JDLHO). Jiangjin Yearbook 2021. Available online: https://dfz.cq.gov.cn/dfz/static/plugin/pdf/web/book_view.html?timestamp=1722861089594&bookId=eba38e0dcb3743e5a1ab0a9045c44ad8&file=https://dfz.cq.gov.cn/book/eba38e0dcb3743e5a1ab0a9045c44ad8/0.html&bookName=%E6%B1%9F%E6%B4%A5%E5%B9%B4%E9%89%B42021 (accessed on 5 August 2024).
  23. Gou, Y.; Chen, H.; Wu, W.; Liu, H.-B. Effects of slope position, aspect and cropping system on soil nutrient variability in hilly areas. Soil Res. 2015, 53, 338–348. [Google Scholar] [CrossRef]
  24. Tian, X.; Li, Z.; Wang, Y.; Li, B.; Wang, L. Evaluation on soil fertility quality under biochar combined with nitrogen reduction. Sci. Rep. 2021, 11, 13792. [Google Scholar] [CrossRef]
  25. Nielsen, D.R.; Bouma, J. Soil Spatial Variability: Proceedings of a Workshop of the ISSS and the SSSA, Las Vegas, USA/Pdc296; Center Agricultural Pub & Document: Wageningen, The Netherlands, 1985. [Google Scholar]
  26. Wei, Y.; Wang, S.; Zhao, J.; Peng, Q.; Wang, Y.; Li, Z.; Cai, G.; Yang, L.; Xu, W.; Zhang, J.; et al. Characteristics of Nutrient Distribution and Comprehensive Evaluation of Fertility of Zanthoxylum bungeanum Orchards Soil in Chongqing. J. Southwest Univ. (Nat. Sci.) 2022, 44, 48–58. [Google Scholar] [CrossRef]
  27. Xie, X.; Li, Z.; Peng, Q. Soil Nutrient Monitoring and Change Evaluation of Cultivated Land in Jiangjin District, Chongqing, China. South China Agric. 2017, 11, 88–93. [Google Scholar] [CrossRef]
  28. Shi, J.; Zhou, H.; Xu, M.; Zhang, Q.; Li, J.; Wang, J. Fertilization Highly Increased the Water Use Efficiency of Spring Maize in Dryland of Northern China: A Meta-Analysis. Agronomy 2023, 13, 1331. [Google Scholar] [CrossRef]
  29. Gao, L.; Li, H.; Feng, H. Analysis and Evaluation of Physical and Chemical Properties of Vegetable Soil in Shaoguan. Vegetables 2024, 1, 40–48. [Google Scholar]
  30. Jiang, H.; Yang, N.; Qian, H.; Chen, G.; Wang, W.; Lu, J.; Li, Y.; Hu, Y. Effects of Different Ecological Restoration Pattern on Soil Organic Nitrogen Components in Alpine Sandy Land. Agronomy 2024, 14, 680. [Google Scholar] [CrossRef]
  31. Ai, C.; Liang, G.; Sun, J.; Wang, X.; He, P.; Zhou, W. Different roles of rhizosphere effect and long-term fertilization in the activity and community structure of ammonia oxidizers in a calcareous fluvo-aquic soil. Soil Biol. Biochem. 2013, 57, 30–42. [Google Scholar] [CrossRef]
  32. Zhao, X.; Gao, S.; Lu, D.; Chen, X.; Feng, W.; Wang, Y.; Zhao, S.; Wang, H. Analysis of mechanisms of soil potassium-holding capacity using different soils of China. Agron. J. 2022, 114, 825–834. [Google Scholar] [CrossRef]
  33. Nunozawa, F.; Tanaka, A. Comparison of nutrient management among acid soils differing in phosphorus fixation capacity and cation exchange capacity. Soil Sci. Plant Nutr. 1984, 30, 51–61. [Google Scholar] [CrossRef]
  34. Pati, R.; Mukhopadhyay, D. Inorganic phosphorus fractions in some acid soils under terai situations of West Bengal. Res. Crops 2008, 9, 57–60. [Google Scholar]
  35. Omar, M.d.M.; Massawe, B.H.J.; Shitindi, M.J.; Pedersen, O.; Meliyo, J.L.; Fue, K.G. Assessment of salt-affected soil in selected rice irrigation schemes in Tanzania: Understanding salt types for optimizing management approaches. Front. Soil Sci. 2024, 4, 1372838. [Google Scholar] [CrossRef]
  36. Liu, S.; Li, H.; Han, C.; Sheng, X.; Liu, J. Cd inhibition and pH improvement via a nano-submicron mineral-based soil conditioner. Environ. Sci. Pollut. Res. 2017, 24, 4942–4949. [Google Scholar] [CrossRef] [PubMed]
  37. Jiang, J.; Wang, Y.-P.; Yu, M.; Li, K.; Shao, Y.; Yan, J. Responses of soil buffering capacity to acid treatment in three typical subtropical forests. Sci. Total Environ. 2016, 563–564, 1068–1077. [Google Scholar] [CrossRef] [PubMed]
  38. Azman, E.A.; Ismail, R.; Ninomiya, S.; Jusop, S.; Tongkaemkaew, U. The effect of calcium silicate and ground magnesium limestone (GML) on the chemical characteristics of acid sulfate soil. PLoS ONE 2023, 18, e0290703. [Google Scholar] [CrossRef] [PubMed]
  39. Hettiarachchi, L.S.K.; Sinclair, A.H. Effects of addition of magnesium and calcium supplied in liming and non-liming materials on the growth of Camellia japonica in an acid soil, and its soil pH changes, nutrient uptake, and availability. Commun. Soil Sci. Plant Anal. 2002, 33, 2965–2988. [Google Scholar] [CrossRef]
  40. Qiu, H.; Kuai, L.; Zhang, L.; Liu, L.; We, S.; Cai, Z. Characteristics of Acidity and Nutrient Changes in Red Soil After Conversion of Paddy Field to Dry Land and Vegetable Field. Sci. Agric. Sin. 2024, 57, 525–538. [Google Scholar] [CrossRef]
  41. Zhu, S.; Xiao, G.; Han, X.; Gao, W.; Luo, J. Study on Dynamic Change Characteristics of Soil Fertility Quality under Different Agricultural Land Use Patterns in Dujiangyan City. Acta Agric. Jiangxi 2023, 35, 66–72. [Google Scholar] [CrossRef]
  42. Swanepoel, C.M.; van der Laan, M.; Weepener, H.L.; du Preez, C.C.; Annandale, J.G. Review and meta-analysis of organic matter in cultivated soils in southern Africa. Nutr. Cycl. Agroecosystems 2016, 104, 107–123. [Google Scholar] [CrossRef]
  43. Ladha, J.K.; Reddy, C.K.; Padre, A.T.; van Kessel, C. Role of Nitrogen Fertilization in Sustaining Organic Matter in Cultivated Soils. J. Environ. Qual. 2011, 40, 1756–1766. [Google Scholar] [CrossRef] [PubMed]
  44. Zhang, X.; Davidson, E.A.; Mauzerall, D.L.; Searchinger, T.D.; Dumas, P.; Shen, Y. Managing nitrogen for sustainable development. Nature 2015, 528, 51–59. [Google Scholar] [CrossRef]
  45. McLennon, E.; Dari, B.; Jha, G.; Sihi, D.; Kankarla, V. Regenerative agriculture and integrative permaculture for sustainable and technology driven global food production and security. Agron. J. 2021, 113, 4541–4559. [Google Scholar] [CrossRef]
  46. Ning, C.; Chen, Y.; Liu, R.; Li, T.; Chen, H.; Tian, J.; Cai, K. Effects of N fertilizer reduction combined with straw biochar application on the yield, Si, and N nutrition of double-cropping rice. Yingyong Shengtai Xuebao 2023, 34, 993–1001. [Google Scholar] [CrossRef] [PubMed]
  47. Li, W. Study on the evolution of soil nutrients after conversion of paddy fields to facility cultivation in Hefei polder area. Anhui Agric. Sci. Bull. 2014, 77, 106. [Google Scholar]
  48. Liu, T.; Dong, X.; Guo, K.; Wang, J.; Liu, X.; Sun, H. Effects of fertilizer types and application levels on phosphorus availability of saline soils and crops: A meta-analysis. Land Degrad. Dev. 2024, 35, 4068–4080. [Google Scholar] [CrossRef]
  49. Aleiadeh, H.; Idris, J.; Mohidin, H.; Omar, L.; Man, S.; Munir, S.; Jong, V. Effect of Co-application of Vetiver Grass Biochar and NPK Fertilizer on the Growth of Oil Palm (Elaeis guineensis Jacq.) Seedlings and Soil Chemical Properties. Malays. J. Soil Sci. 2024, 28, 26–37. [Google Scholar]
  50. Blanchet, G.; Libohova, Z.; Joost, S.; Rossier, N.; Schneider, A.; Jeangros, B.; Sinaj, S. Spatial variability of potassium in agricultural soils of the canton of Fribourg, Switzerland. Geoderma 2017, 290, 107–121. [Google Scholar] [CrossRef]
  51. Zhong, S.; Liu, W.; Ni, C.; Yang, Q.; Ni, J.; Wei, C. Runoff harvesting engineering and its effects on soil nitrogen and phosphorus conservation in the Sichuan Hilly Basin of China. Agric. Ecosyst. Environ. 2020, 301, 107022. [Google Scholar] [CrossRef]
Figure 1. (a) Digital elevation map of the study area; sampling locations of (b) 2007 and (c) 2022.
Agronomy 14 01796 g001
Figure 2. Flowchart of methodology. The red, yellow, green, blue and grey boxes indicate sample collection, laboratory analysis, classical statistics, geostatistical analysis and results, respectively.
Agronomy 14 01796 g002
Figure 3. Frequency distributions of (a) soil pH, (b) soil organic matter (SOM), (c) alkali-hydrolyzable nitrogen (AHN), (d) available phosphorus (AP), and (e) available potassium (AK) in 2007 and 2022.
Agronomy 14 01796 g003aAgronomy 14 01796 g003b
Figure 4. PC1 vs. PC2 biplots of soil nutrients in (a) 2007 and (b) 2022.
Agronomy 14 01796 g004
Figure 5. Experimental semi-variograms of soil parameters with fitted models in 2007 (ae) and 2022 (fj).
Agronomy 14 01796 g005
Figure 6. Spatial distribution maps of soil parameters in 2007 (a,c,e,g,i) and 2022 (b,d,f,h,j).
Agronomy 14 01796 g006aAgronomy 14 01796 g006b
Table 1. Statistics of soil nutrients in 2007 and 2022.
YearSoil NutrientMin.Max.MeanSDCV (%)SkewnessKurtosis
2007pH3.88.25.54 b1.1821.370.9−0.59
n = 3331SOM (g·kg−1)3.417415.90 b6.2439.235.61124.41
AHN (mg·kg−1)1235696.37 a27.3928.421.588.39
AP (mg·kg−1)0.232911.04 b15.75142.655.969.61
AK (mg·kg−1)447782.88 b42.7851.612.238.56
2022pH3.88.65.81 a1.1519.720.76−0.51
n = 514SOM (g·kg−1)3.162.718.21 a7.0738.811.214.14
AHN (mg·kg−1)10.141798.03 a44.4445.331.807.31
AP (mg·kg−1)0.8528.142.69 a58.34136.662.49.89
AK (mg·kg−1)12645153.04 a97.9363.991.854.59
Note: SOM: soil organic matter; AHN: alkali-hydrolyzable nitrogen; AP: available phosphorus; AK: available potassium; SD: standard deviation; CV: coefficient of variation. Different letters within the mean column indicate a significant difference in soil nutrients between the two years (p < 0.05).
Table 2. Pearson’s correlation coefficients for soil nutrients in 2007 and 2022.
PeriodSoil ParameterpHSOMAHNAP
2007 (n = 3331)SOM0.001---
AHN−0.186 **0.531 **--
AP−0.075 **−0.079 **0.008-
AK0.131 **0.164 **0.131 **0.145 **
2022 (n = 514)SOM-0.078---
AHN−0.102 *0.768 **--
AP−0.126 **0.080.053-
AK0.0760.229 **0.251 **0.520 **
Note: SOM: soil organic matter; AHN: alkali-hydrolyzable nitrogen; AP: available phosphorus; AK: available potassium; * and **: 5% and 1% significance levels, respectively.
Table 3. Loadings of soil parameters in 2007 and 2022 calculated by principal component analysis.
20072022
PC1PC2PC3PC1PC2PC3
pH−0.1820.658−0.585−0.1590.0810.97
SOM0.84−0.01−0.2360.83−0.4240.076
AHN0.86−0.1770.0470.833−0.4320.059
AP0.0120.3730.8260.4540.764−0.192
AK0.3710.7430.1120.6220.6080.207
Eigenvalue1.6151.1561.09621.3261.029
Variability (%)32.2923.1121.914026.5320.57
Cumulative %32.2955.477.314066.5387.1
Note: SOM: soil organic matter; AHN: alkali-hydrolyzable nitrogen; AP: available phosphorus; AK: available potassium; PC1: principal component 1; PC2: principal component 2; PC3: principal component 3.
Table 4. Semi-variogram models for soil parameters in 2007 and 2022.
Soil ParameterModelNugget
(C0)
Partial Sill (C)Sill
(C0 + C)
Range (m)Nugget/SillR2
2007
pHExponential0.020.020.043960.0050.510.93
SOMExponential0.090.040.132460.0072.000.58
AHNExponential0.060.040.102910.0055.560.511
APExponential0.410.360.772850.0053.360.203
AKExponential0.060.130.193780.0031.580.266
2022
pHExponential0.010.020.043870.0032.100.727
SOMExponential0.080.100.193300.0045.160.472
AHNExponential0.110.120.233540.0047.020.552
APExponential0.631.522.154590.0029.310.316
AKExponential0.070.210.28184,650.0023.810.796
Note: SOM: soil organic matter; AHN: alkali-hydrolyzable nitrogen; AP: available phosphorus; AK: available potassium.
Disclaimer/Publisher’s Note: The statements, opinions and data contained in all publications are solely those of the individual author(s) and contributor(s) and not of MDPI and/or the editor(s). MDPI and/or the editor(s) disclaim responsibility for any injury to people or property resulting from any ideas, methods, instructions or products referred to in the content.

