Article

Analysis of Total Flavonoid Variation and Other Functional Substances in RILs of Tartary Buckwheat, with Near-Infrared Model Construction for Rapid Non-Destructive Detection

Research Center of Buckwheat Industry Technology, College of Life Science, Guizhou Normal University, Guiyang 550001, China
*
Authors to whom correspondence should be addressed.
These authors contributed equally to this work.
Agronomy 2024, 14(8), 1826; https://doi.org/10.3390/agronomy14081826
Submission received: 9 July 2024 / Revised: 30 July 2024 / Accepted: 17 August 2024 / Published: 19 August 2024
(This article belongs to the Special Issue The Application of Near-Infrared Spectroscopy in Agriculture)

Abstract

:
According to the requirements of Tartary buckwheat breeding, it is necessary to develop a method for the rapid detection of functional substances in seeds. To ensure a diverse sample pool, we utilized the stable recombinant inbred lines (RILs) of Tartary buckwheat. The coefficients of variation of the total flavonoid, vitamin E (VE), and GABA contents of the RIL population were 15.06, 16.53, and 36.93, respectively. Subsequently, we established prediction models for the functional substance contents in Tartary buckwheat using near-infrared spectroscopy (NIRS) combined with chemometrics. The Kennard–Stone algorithm divided the dataset into training and test sets, employing six different methods for preprocessing spectra. The Competitive Adaptive Reweighted Sampling algorithm extracted the characteristic spectra. The best models for total flavonoid and VE were normalized using the first derivative. The calibration correlation coefficient (Rc) and prediction correlation coefficient (Rp) of the total flavonoid and VE prediction models were greater than 0.94. The optimal GABA prediction model underwent preprocessing via normalization combined with the standard normal variate, and the Rc and Rp values were greater than 0.93. The results demonstrated that the NIRS-based prediction model could satisfy the requirements for the rapid determination of total flavonoids, VE, and GABA in Tartary buckwheat seeds.

1. Introduction

Buckwheat, a member of the Polygonaceae family, is a dicotyledonous annual plant. Its two main cultivated species are common buckwheat and Tartary buckwheat [1]. As lifestyles evolve, concerns about people’s health status escalate, accompanied by a heightened awareness of health. Tartary buckwheat has garnered significant attention as a functional food due to its abundance of flavonoids, vitamin E (VE), gamma-aminobutyric acid (GABA), and other bioactive compounds [2,3,4]. These constituents play crucial roles in enhancing human health, serving as antioxidants and anticancer agents, and contributing to cardiovascular and cerebrovascular well-being [5,6,7].
Flavonoids are natural compounds abundant in Tartary buckwheat that possess diverse biological activities and medicinal significance [8]. Studies have indicated that these flavonoids can regulate insulin resistance, ensure stable insulin secretion, and stabilize blood glucose levels [9]. Furthermore, they have been observed to modulate blood lipid levels in patients with type 2 diabetes [10]. Additionally, the antioxidant properties of Tartary buckwheat flavonoids render them valuable and promising for both food and pharmaceutical development [11]. The seed is the most crucially utilized part of Tartary buckwheat, exhibiting a high concentration of bioactive flavonoids (0.67–2.27%) and abundant flavonoid components, notably rich in rutin (70–85% of total flavonoids), a characteristic absent in other major crops such as rice, wheat, and maize [12,13]. VE, exclusively sourced from plants [14], is notably more abundant in Tartary buckwheat than in common buckwheat. Certain studies have suggested that the plant-derived VE serves a dual function: protecting plants from oxygen toxicity and enhancing plant stress resistance [15]. VE exerts beneficial effects on human health by reducing the risk of cardiovascular disease [16] and potentially regulating the proliferation and death of pancreatic cancer cells [17]. GABA, a neurotransmitter, has several health benefits. Research has indicated that its role in regulating brain function contributes to maintaining brain health and improving cognitive function [18]. Additionally, low GABA levels have been associated with the onset of depression [19], implying that augmenting GABA levels exogenously may rebalance neurotransmitters and alleviate depressive symptoms. Tartary buckwheat, a GABA-rich food, particularly in its sprouted form, has a higher GABA content than unsprouted varieties [20]. The consumption of buckwheat grains or sprouts abundant in GABA may promote emotional stability and mental well-being.
Currently, the predominant international methods for assessing functional nutrient components in foods are classical, which can be associated with drawbacks such as time consumption, labor intensiveness, and environmental impact [8,21]. Flavonoid content is typically measured using high-performance liquid chromatography and spectrophotometry [22]. The primary detection method for VE is reverse-phase chromatography, and the determination of GABA content typically involves high-performance liquid chromatography and ultraviolet colorimetry [23]. Nevertheless, these conventional chemical analysis methods often require long sample handling and testing durations at the expense of reagents and equipment. By contrast, near-infrared spectroscopy (NIRS) offers faster and more cost-effective alternatives. NIRS creates predictive models for various components by synthesizing the spectral bands produced by O-H, N-H, C-H, and other hydrogen-containing groups that are absorbed and doubled in frequency during group stretching vibrations. This synthesis combines the spectrum and chemical data with stoichiometric methods [24]. NIR spectroscopy conducts non-destructive analyses on untreated samples, thus saving the time and cost associated with sample processing. NIRS has extensive applications in the food, agricultural, and pharmaceutical industries [3,25,26,27,28,29,30,31]. For instance, Platov et al. employed UV-VIS-NIR spectroscopy alongside multivariate analysis to effectively classify and identify buckwheat grains [27]. Zhang et al. successfully employed NIRS to rapidly detect moisture, ash, protein, fat, and other nutrients in buckwheat [29]. Additionally, models for the accurate and rapid detection of amylose and amylopectin contents in sorghum grains were established [30]. Wang et al. utilized NIRS to non-destructively determine the protein and fat content of torreya [31].
The establishment of a model for the rapid detection of functional components, such as total flavonoids, VE, and GABA, in Tartary buckwheat using NIRS technology can be of significance for quality assessment, breeding, and functional food development. Hence, this study focused on collecting data from an inbred line population of Tartary buckwheat to acquire chemical values with substantial coefficient variation, ultimately aiming to establish a robust prediction model.

2. Materials and Methods

2.1. Experimental Materials and Spectra Acquisition

2.1.1. Experimental Materials

In this study, 175 samples were collected from a stable recombinant inbred line (RIL) population of two Tartary buckwheat varieties: the Shanxi province registered variety ‘Jinbuckwheat No. 2’ and the local thin-shelled Tartary buckwheat variety ‘Millet buckwheat’ from Yunnan. After harvesting, the seeds were dried in an oven (Model MGL-125B, Taisite Instrument, Tianjin, China) at 60 °C for 2–3 d. Subsequently, the dried seed spectra were scanned, and the selected portions were ground and hulled using a high-speed grinder (Model FW100, Taisite Instrument, Tianjin, China) and subsequently passed through an 80-mesh sieve to ascertain their chemical composition.

2.1.2. Spectra Acquisition

The NIR spectra of the whole buckwheat grains were obtained using the MPA type Fourier transform near-infrared spectrometer (Model MPA, Bruker Corporation, Karlsruhe, Germany) from Bruker Spectral Instrument Co. LTD of Germany. using the diffuse reflectance method. OPUS 8.0 was applied as the acquisition software. Each sample underwent a single scan repeated 64 times, with a resolution of 4 cm−1 and a scanning range spanning from 4000 to 12,000 cm−1. Each sample was scanned three times, and the spectral average value was computed for modeling purposes.

2.2. Determination of the Contents of Total Flavonoid, VE, and GABA

The methods for determining the total flavonoids, VE, and GABA in Tartary buckwheat were conducted following Wang’s protocol [32] with minor adjustments to the procedural workflow.

2.2.1. Determination of Total Flavonoids of Tartary Buckwheat

After acquiring the spectrum, 0.0200 g of powder from each test material was measured and placed in a 2 mL centrifuge tube. After the addition of 2 mL of 75% CH3OH to the tube, the powder was placed in a constant-temperature water bath (Model DK98-2, Taisite Instrument, Tianjin, China) set at 60 °C for 2 h, then removed and centrifuged (Model D2012 plus, Dalong Xingchuang Experimental Instruments (Beijing) Co., Ltd., Beijing, China) at 8000 rpm for 10 min at room temperature. Following filtration, the supernatant was collected. Subsequently, 50 μL of filtrate was mixed with 400 μL of 0.1 mol/L AlCl3, 600 μL of 1.0 mol/L KAc, and 200 μL of 75% CH3OH in succession. After thorough shaking, 250 μL was extracted, and the absorbance value of the filtrate was determined at a wavelength of 420 nm (Model T6-1650E, Puxi General Instrument Co., Ltd., Beijing, China). This process was repeated three times for each sample, and the average value was used for modeling.
The concentration (C) of the total flavonoid in the extraction solution was determined using the standard curve. The standard curve of total flavonoid is y = 46.537x − 2.2425, R2 = 0.9961, the calibration value is in the range of 0–13 μg/mL. Subsequently, the total flavonoid content of the samples was calculated using the following formula:
X (%) = (C × N × (V/m) × 10−6) × 100%
C—the concentration of total flavonoids in the liquid to be measured (μg/mL);
V—volume of the liquid to be measured (mL);
N—the total dilution of the sample;
m—the mass of the sample (g).

2.2.2. Determination of VE in Tartary Buckwheat

The sample powder (0.1000 g) was accurately measured and dissolved in a 2 mL centrifuge tube. Subsequently, 2 mL of 60% ethanol was added and allowed to stand for 5 min. It was then extracted for 20 min at room temperature using an ultrasonic power of 100 W and then centrifuged for 5 min at room temperature at a speed of 5000 rpm. The resulting supernatant was adopted as the sample extraction solution. The extraction solution was added to a 10 mL centrifuge tube and diluted to 7 mL with methanol (5 mL). Then, 1 mL of C12H10N2O was added at a concentration of 6 mmol/L, followed by 1 mL of a 1 mmol/L FeCl3 solution. After 15 s, 1 mL of 40 mmol/L H3PO4 solution was immediately added and mixed thoroughly. This constituted the sample liquid for measurement. The sample liquid (250 μL) was adopted for the spectrophotometric analysis, and the absorbance was measured at a wavelength of 510 nm (Model T6-1650E, Puxi General Instrument Co., Ltd., Beijing, China). The process was repeated three times for the same sample, and the values were averaged during modeling.
Initially, the concentration of C (μg/mL) of the VE in the measured liquid was determined using a standard curve. The standard curve of VE is y = 44.061x − 2.04, R2 = 0.9991, and the calibration value is in the range of 0–13 μg/mL. Subsequently, the VE content of the sample was calculated using the following formula:
X (mg/100 g) = C × V × N/(m × 10)
C—VE concentration in the liquid to be measured (μg/mL);
V—volume of liquid to be measured (mL);
N—the total dilution of the sample;
m—the mass of the sample (g).

2.2.3. Determination of GABA Content in Tartary Buckwheat

The sample powder was weighed to the nearest 0.0500 g. CH3OH was added to a 2 mL centrifuge tube up to the 2 mL mark. Subsequently, the mixture was placed in an oscillating water bath (Model DK98-2, Taisite Instrument, Tianjin, China) at 40 °C for 10 min, followed by centrifugation at 12,000 r/min for 5 min (Model D2012 plus, Dalong Xingchuang Experimental Instruments (Beijing) Co., Ltd., Beijing, China). The supernatant was discarded, and this process was repeated four times. It was then dried until a constant weight was achieved, and 2 mL of distilled water was added to the remaining precipitate. The resulting solution was the sample extraction solution obtained by heating in a water bath at 80 °C for 10 min. One milliliter of the extract was collected, and 0.4 mL of 0.5 mol/L AlCl3 solution was added. The mixture was shaken for 5 min at room temperature and centrifuged at 12,000 r/min for 5 min. Then, 500 μL of the supernatant was collected, and 0.6 mL of 1 mol/L KOH solution was added. The previous step of shock centrifugation was repeated. The supernatant (60 μL) was taken, and it was combined with 0.2 mL of 0.1 mol/L Na2B4O7 buffer and 0.16 mL of 6% C6H5OH solution. Thorough mixing was performed, followed by the addition of 0.12 mL of a 5% NaClO solution. The mixture was then heated in a water bath at 80 °C for 20 min and immediately transferred to an ice bath for 5 min. Subsequently, 0.4 mL of 60% C2H5OH was added, and the mixture was left to stand for 10 min to allow the development of color, thus forming the liquid to be measured. The absorbance of the test solution was measured at 625 nm using an enzyme-labeled instrument (Model T6-1650E, Puxi General Instrument Co., Ltd., Beijing, China). The procedure was repeated three times with the same sample, and the average value was obtained during modeling.
The GABA concentration in the liquid to be measured was determined using a standard curve, denoted as C (μg/mL). The standard curve of GABA is y = 29.885x − 1.0852, R2 = 0.9977. The calibration value range of the three equations is 0–13 μg/mL. Subsequently, the GABA content in the sample was calculated using the following formula:
X (‰) = C × V × N/(m × 106) × 1000‰
C—GABA concentration in the liquid to be measured (μg/mL);
V—volume of the liquid to be measured (mL);
N—the total dilution of the sample;
m—the mass of the sample (g).

2.3. Data Processing and Model Evaluation

2.3.1. Data Processing

The chemical values of the total flavonoids, VE, and GABA in Tartary buckwheat were calculated and analyzed using Excel. Subsequently, the chemical values were systematically analyzed using Origin 2022. MATLAB R2023b was applied to preprocess the spectrum, partition the dataset, screen the feature wavelengths, and construct the model. Six types of spectral were applied. The normalization was always applied before data processing, and then preprocessing was carried out in six different ways; the first method was nothing but normalization, the second method was standard normal variate transformation (SNV), the third method was multiplicative scatter correction (MSC), the forth method was the Savitzky–Golay smoothing filter (SG), the fifth method was the first derivative, and the sixth method was the second derivative. The normalization primarily mitigated the influence of the uncorrelated variables, such as instrument sensitivity differences and sample size inconsistencies, to accentuate the signal [33]. SNV eliminated the impacts of solid particle size, surface scattering, and light path alterations on the diffuse reflected light [34]. The MSC addressed the scattering effects resulting from the uneven particle distribution and size [35,36]. The SG contributed to the signal denoising, data smoothing, and feature extraction [37]. The derivation effectively removed the interference from the baseline and other backgrounds, thereby enhancing resolution and sensitivity [38].
The dataset was divided into training and test sets in a 4:1 ratio using the Kennard–Stone (KS) algorithm. The competitive adaptive reweighted sampling (CARS) method was employed to screen the characteristic bands from the preprocessed spectra, and then the model was constructed using the partial least squares method.

2.3.2. Model Evaluation

The model was verified using the leave-one-out cross-validation method, and the best model was selected on the basis of several criteria: the cross-validation root means square error (RMSECV), the root mean square error of the test set (RMSEP), the coefficient of determination of the training set (Rc), the coefficient of determination of the test set (Rp), and the residual deviation of prediction (RPD) [33,34,38,39]. In this context, the RMSE reflected the predictive ability and smaller values indicated better performance. The Rc and Rp represented the level of agreement between the predicted and actual values, with values closer to 1 indicating better agreement, and the RPD reflected the accuracy and robustness of the model [38]. The RPD had specific thresholds, where RPD < 1.5 indicated poor predictive ability and unsuitability for prediction; 1.5 ≤ RPD < 2.5 suggested moderate predictive ability, enabling use for prediction; and RPD ≥ 3.0 indicated excellent predictive ability [39].

3. Results

3.1. Determination of Functional Components of Tartary Buckwheat and Analysis of Variation

The total flavonoid, VE, and GABA contents in Tartary buckwheat grains were assessed using traditional methods. Table 1 presents that the total flavonoid content ranged from 1.20% to 3.37%, averaging 2.42%. The VE content varied between 1.82 and 5.25 mg/100 g, averaging 3.33 mg/100 g, and the GABA content ranged from 0.37‰ and 2.49‰, averaging 1.34‰. The coefficients of variation (CV) for total flavonoids, VE, and GABA were 15.06, 16.53, and 36.93, respectively. The skewness and kurtosis values for each component were less than 1, indicating an approximately normal distribution. The dispersion levels of these functional substances were relatively high, signifying a significant variability in the sample content and good representativeness.

3.2. Construction of the Near Infrared Model

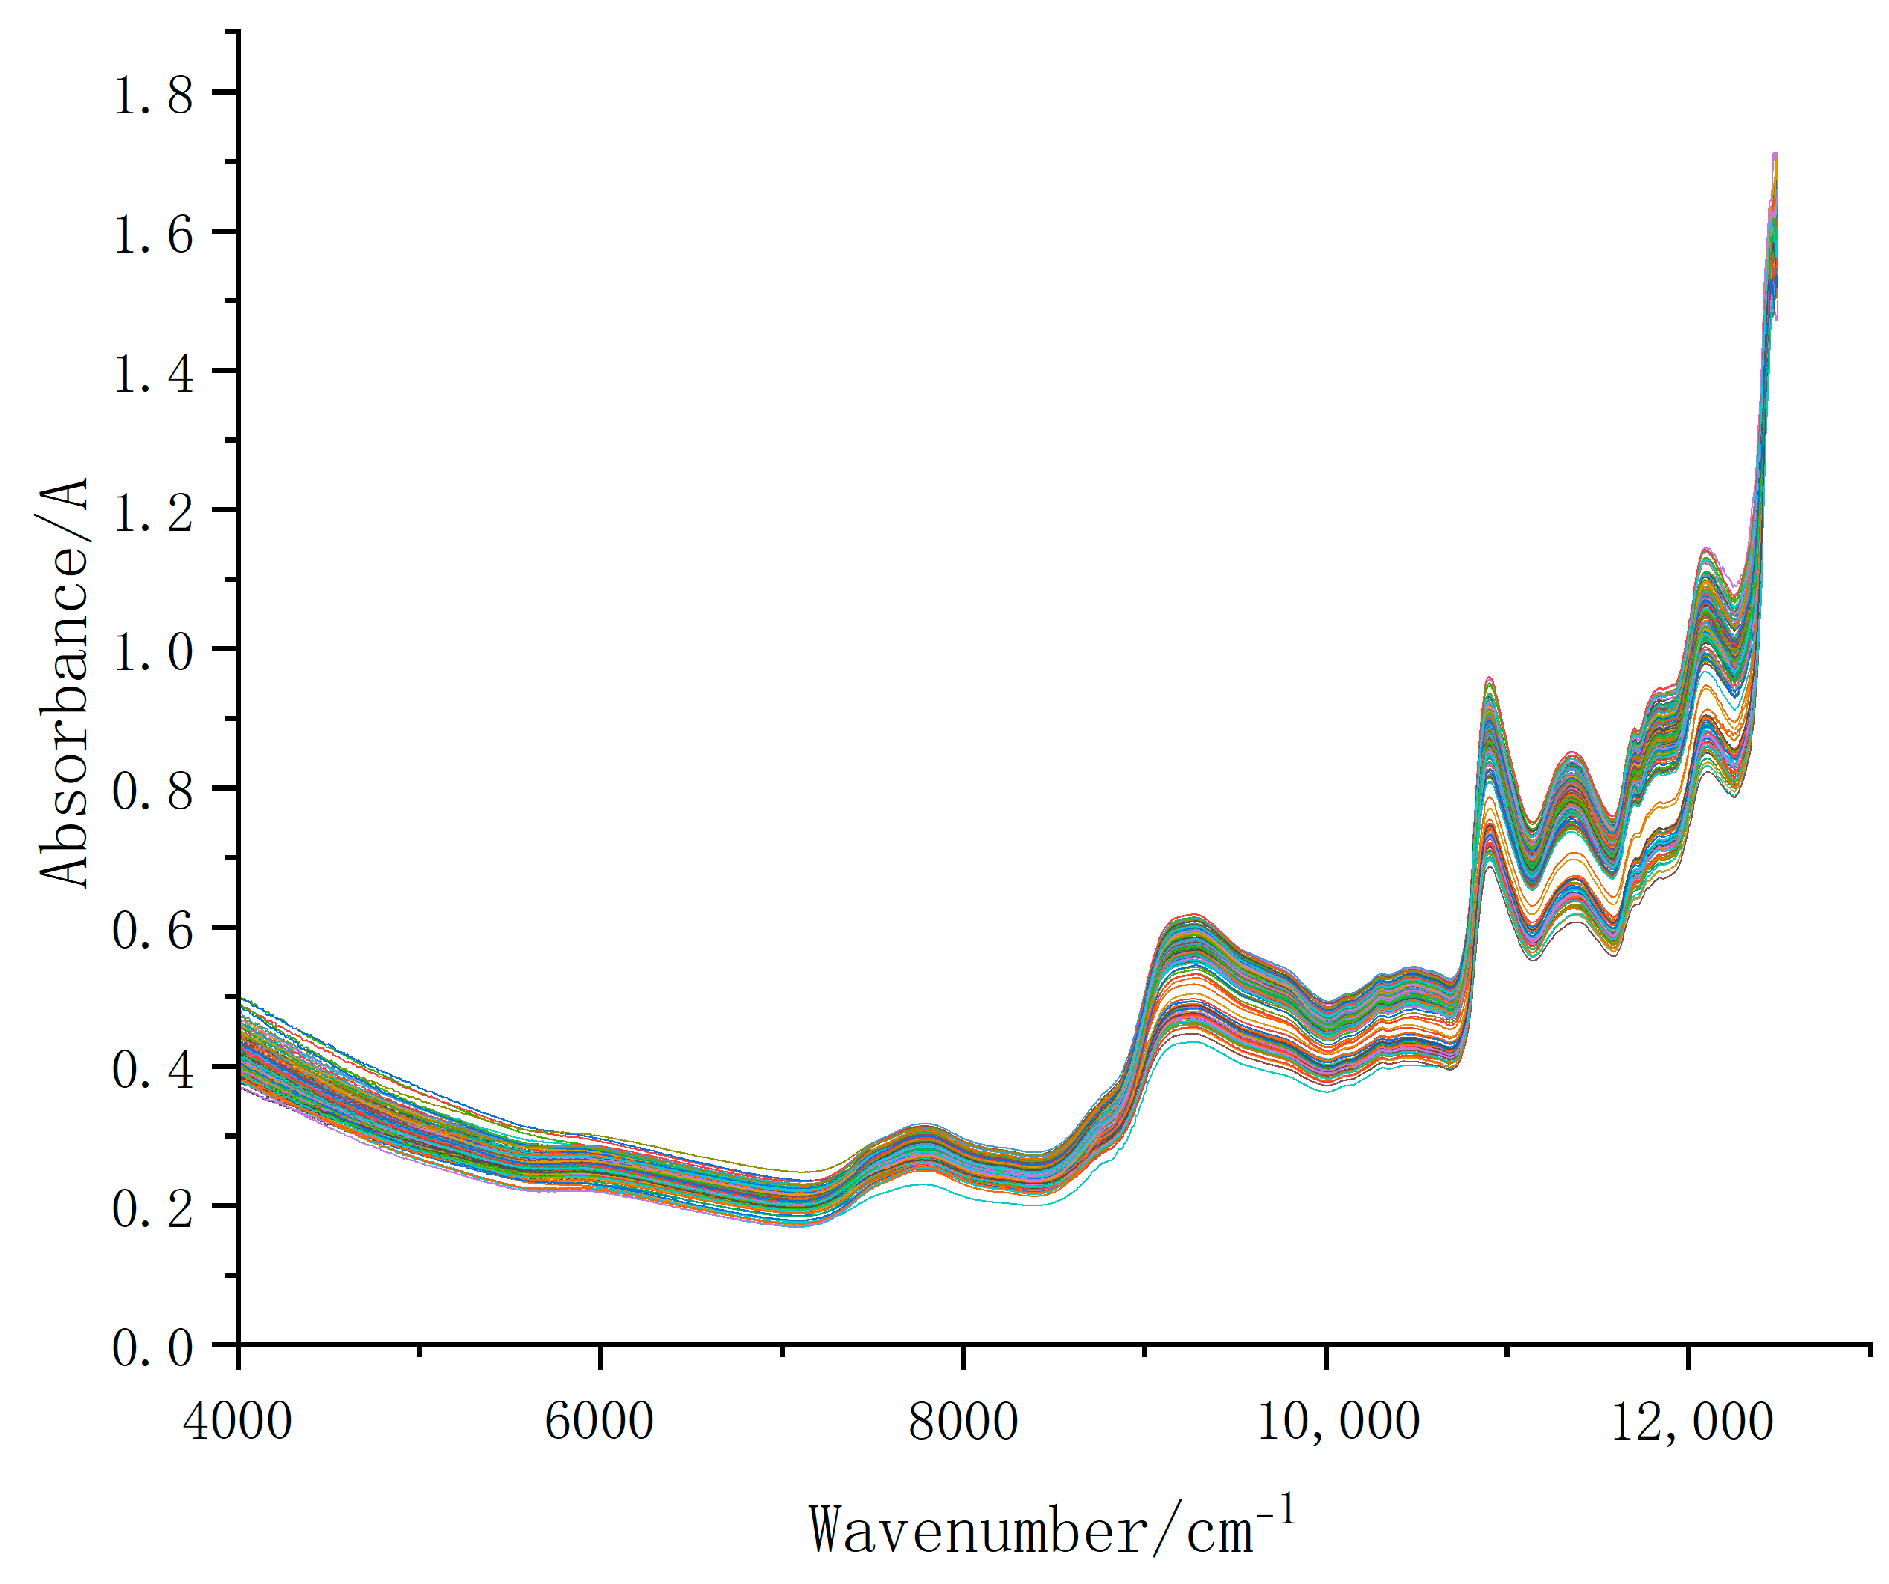
3.2.1. Near Infrared Spectrum of Tartary Buckwheat

The model creation can be related to the spectrum quality, with crucial factors including peak distinguishability, intensity, and reproducibility. The ideal spectral data exhibited clear peaks, minimal noise, and consistent patterns across repeated measurements. Figure 1 presents an overlap diagram featuring 175 buckwheat spectra in the near-infrared range, with each color denoting a sample. This illustrated the absorption intensity of Tartary buckwheat within the spectral region of 4000–12,000 cm−1, where the absorption peak spans approximately from 7500 to 4000 cm−1, demonstrating robust differentiation and repeatability of the near-infrared spectra. Although the absorption peaks across the samples were similar, their intensities varied, resulting in clear and smooth spectra with minimal noise interference. These spectra served as suitable resources for the construction of near-infrared models.

3.2.2. Partitioning of the Sample Set

In this experiment, the KS algorithm partitioned the dataset, revealing an improved predictive capacity when the training and test sets were divided in a 4:1 ratio. Table 2 presents detailed information on Tartary buckwheat samples categorized into sample sets. The mean values and SD of the total flavonoids, VE, and GABA in both the training and test sets were comparable. Furthermore, the analytical data in the test set were within the range of those in the training set.

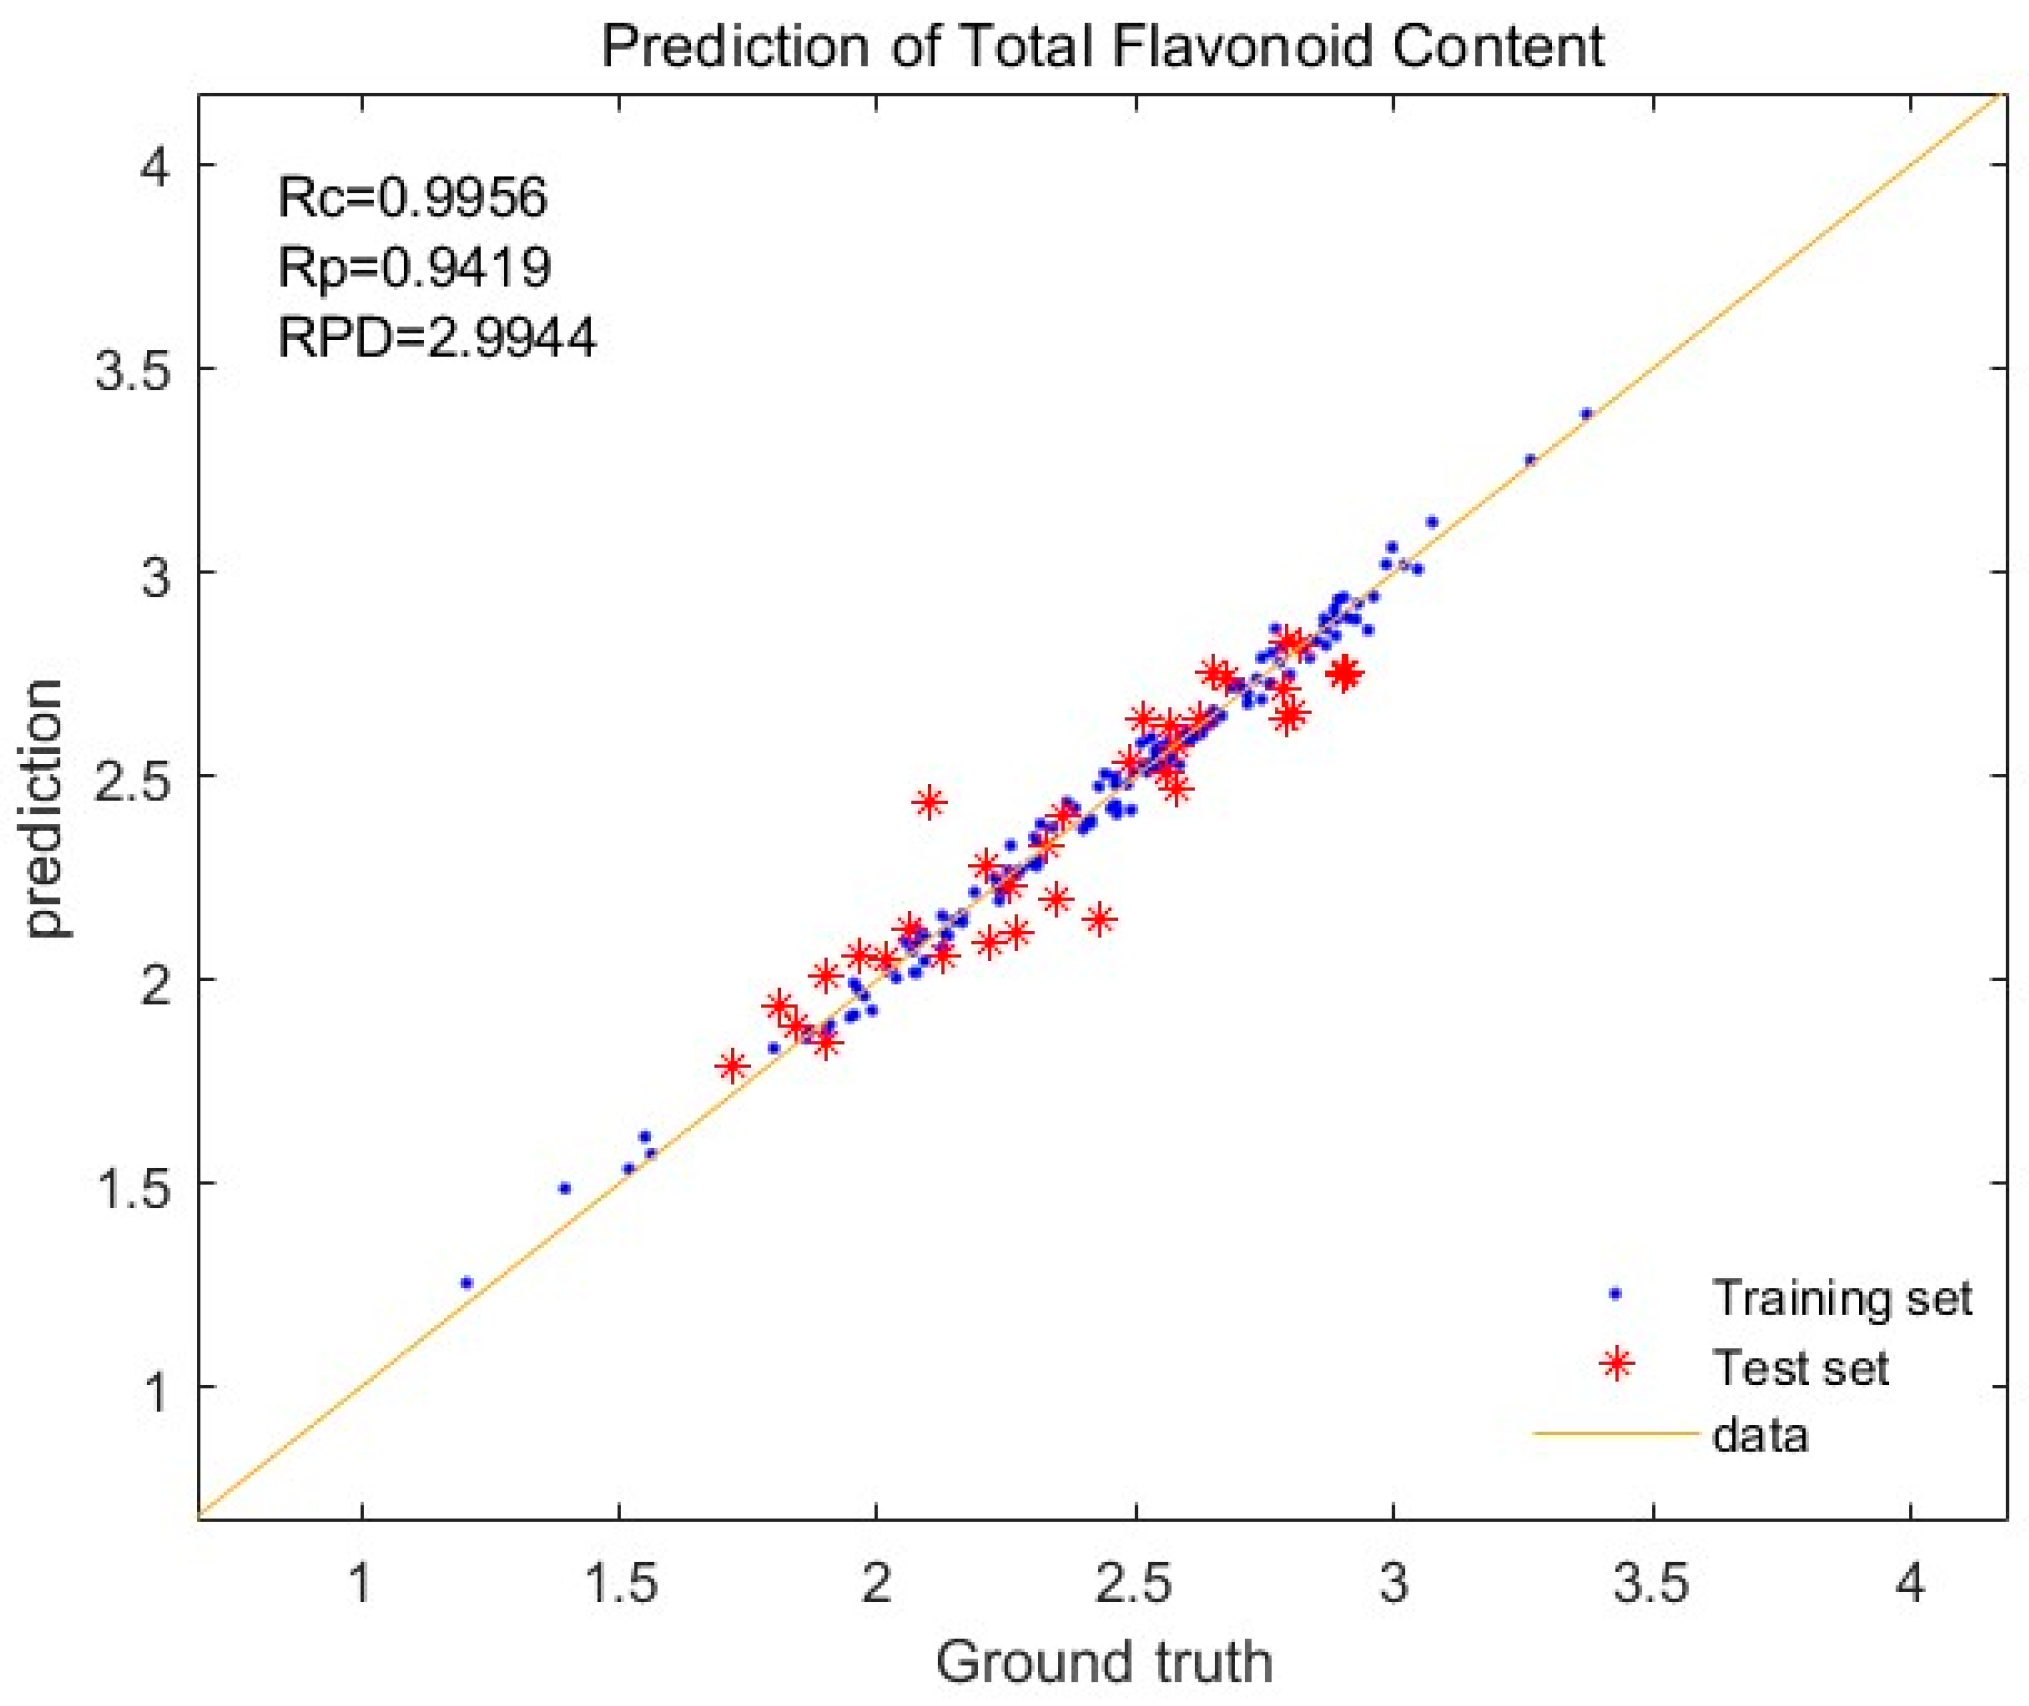
3.3. Creation of Total Flavonoid Prediction Models

To construct the prediction model for total flavonoid in Tartary buckwheat using spectral and chemical data, the KS algorithm partitioned the data into a 4:1 ratio for the training and test sets. Six pretreatment methods were applied, and the CARS algorithm divided the total wavenumber into 2307 points, selecting 155–217 points for modeling. This narrowed the wavenumber range to 6.7–9.4% of the total, followed by modeling using the partial least squares method with 13 principal components. As shown in Table 3, both the Rc and Rp values of the models constructed after the normalized plus derivative preprocessing spectra surpassed 0.9, with corresponding RPDs of 2.9944 and 2.8988, respectively, and the first-order derivative model proved to be superior. However, the models created after normalized + SG and normalized + SNV pretreatment were not viable, yielding RPDs of 1.4063 and 1.4692, respectively, which were below 1.5. Nonetheless, the RPDs for the other models exceeded 1.5, rendering them suitable for predicting the chemical value of total flavonoids (Table 3).
Figure 2 illustrates the regression plot of the optimal prediction model for total flavonoid content.
This model was developed with a 4:1 split between the training and test sets and utilized normalization combined with the first derivative preprocessing method. In the plot, the blue dots represent the training set, and the red stars denote the prediction set. Notably, most data points closely aligned with the best-fit line, indicating a relatively accurate prediction by the model. Both the Rc and Rp values for the training and test sets were close to 1 at 0.9956 and 0.9419, respectively. The high correlation coefficients between the training and test sets suggested a strong association between the predicted and total flavonoid content, indicating excellent predictive capability. The lower RMSECV and RMSEP values (0.0350 and 0.1178, respectively) signified superior model performance. These low values further affirmed the accuracy of the model. Additionally, the RPD value served as another indicator for assessing the predictive ability. The RPD value exceeding 3 represented the strong predictive ability and stability in the model. With the RPD value of 2.9944, which was close to 3, the model demonstrated high prediction accuracy and reliability. This level of performance was sufficient for the rapid and dependable prediction of the total flavonoid content in Tartary buckwheat in practical applications.

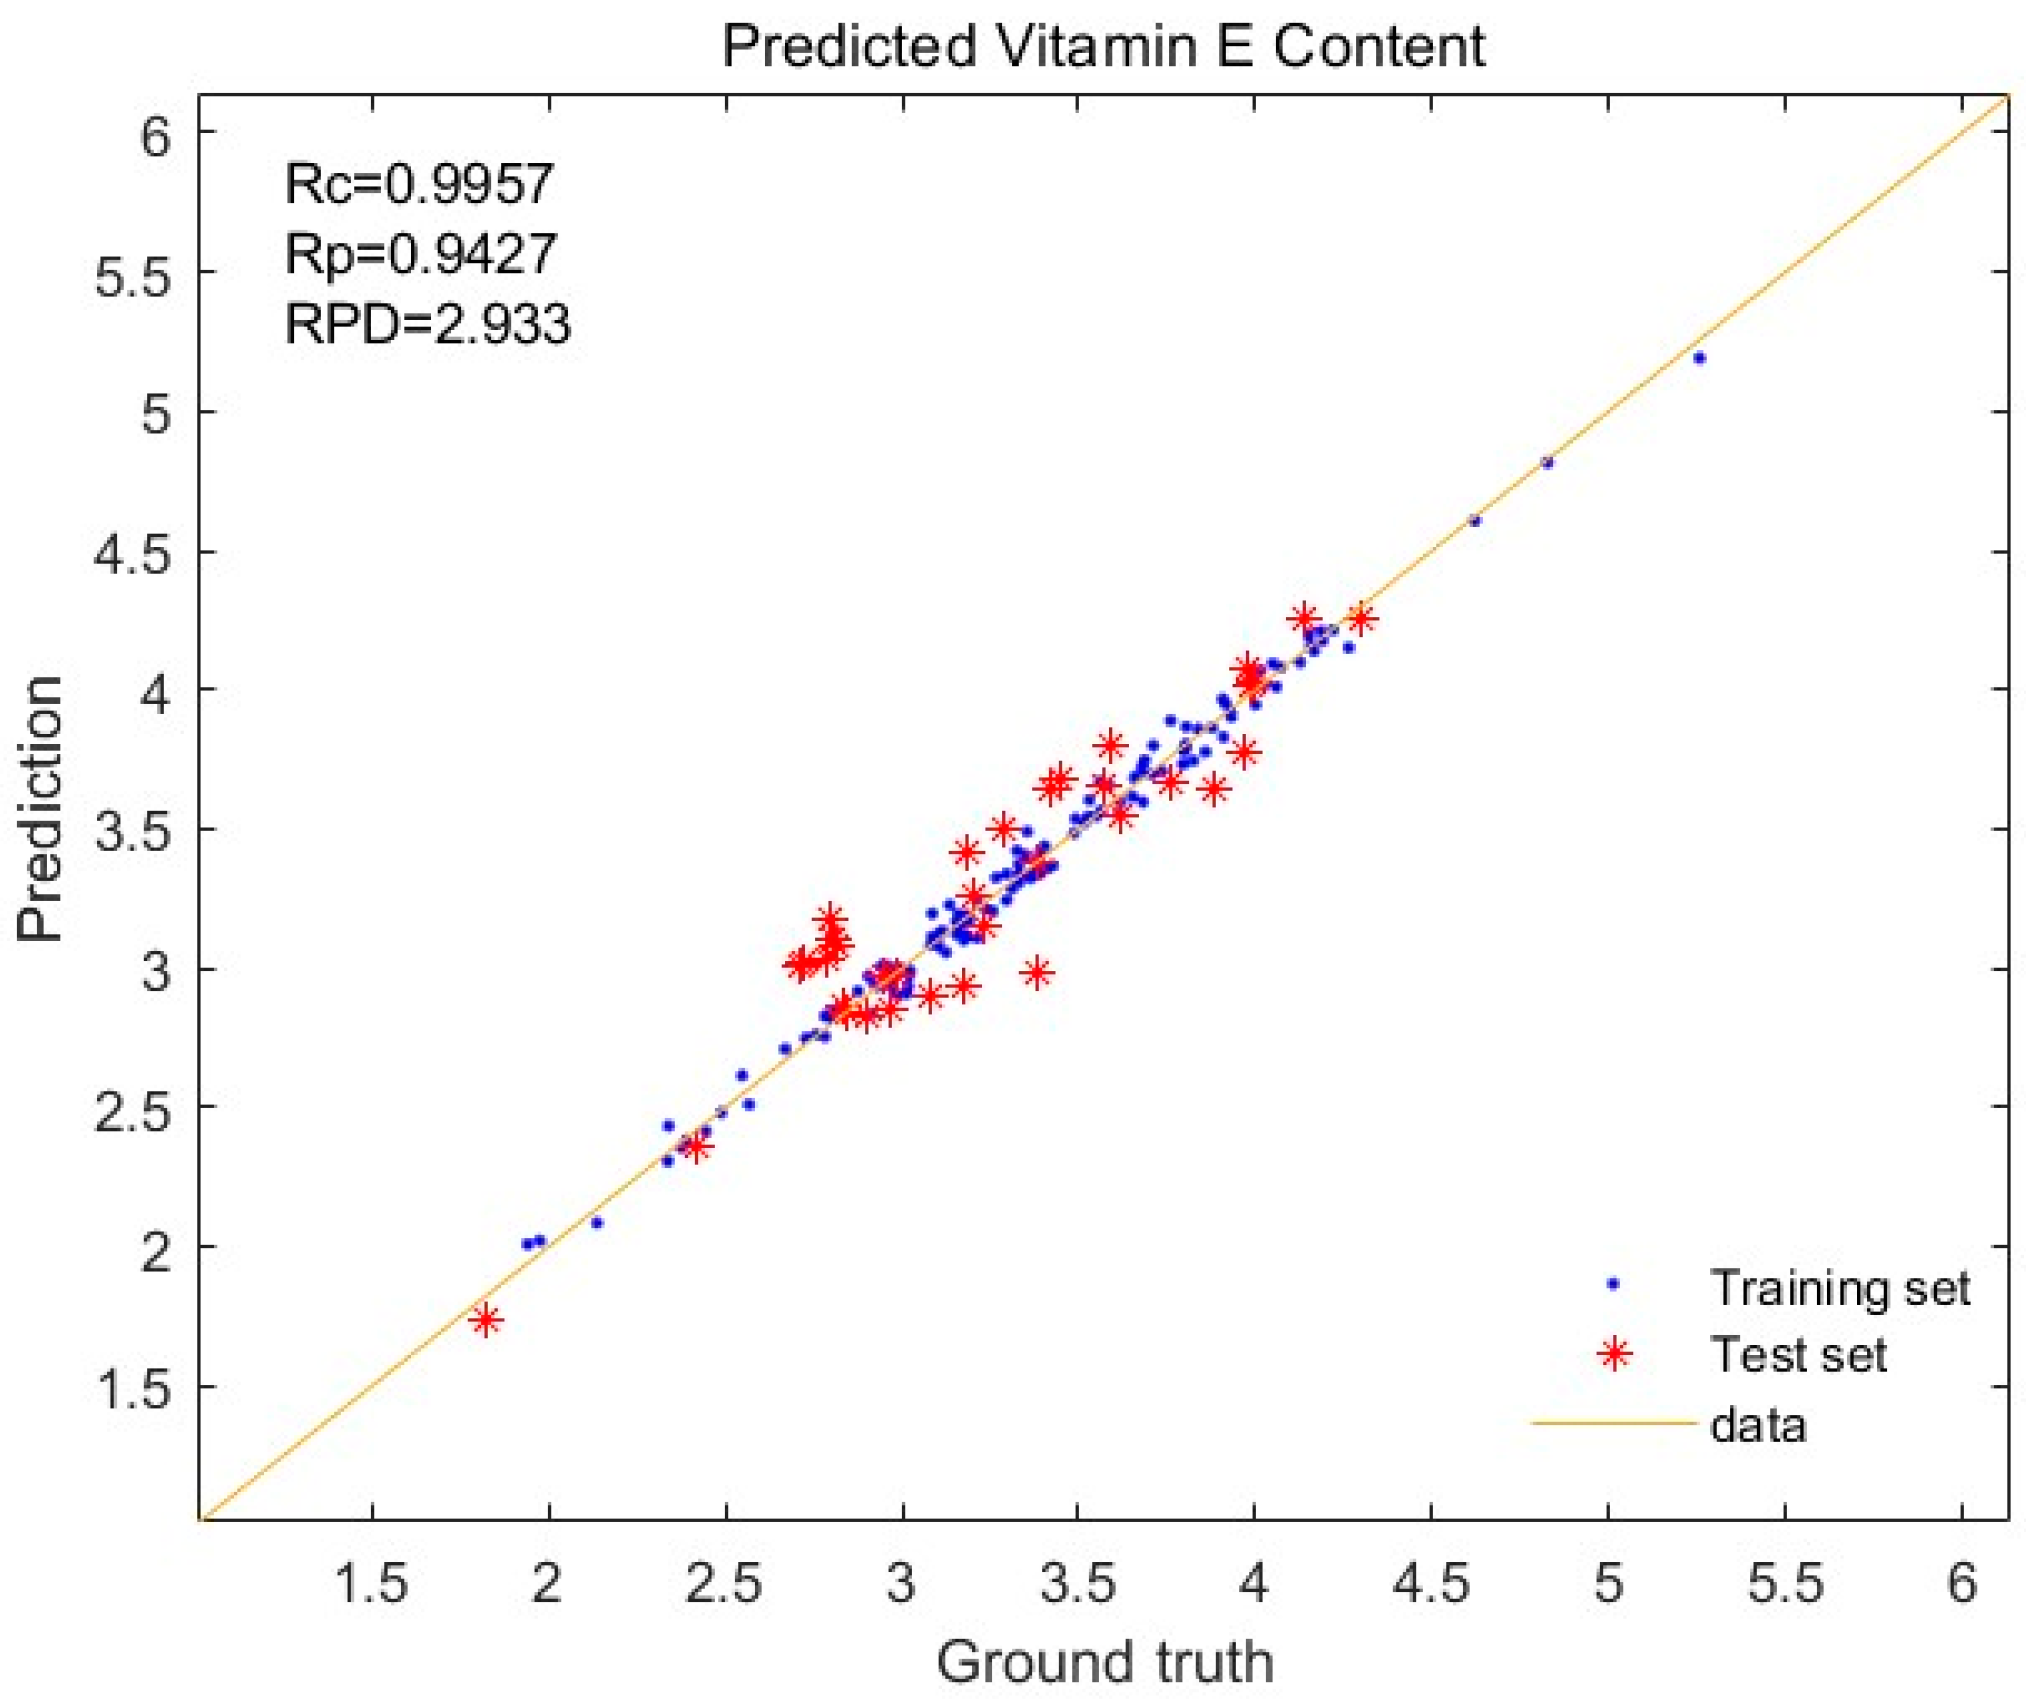
3.4. Effects of Different Pretreatment Methods on VE Modeling

When modeling the VE using Tartary buckwheat grain spectra, the data were partitioned into training and test sets in a 4:1 ratio using the KS algorithm. In addition, six pretreatment methods were applied to preprocess the spectra. The CARS algorithm divided the spectrum into 2307 wavenumber points, of which 155–238 points were selected, representing 6.71–10.3% of the total wavenumber points. Subsequently, modeling was conducted using the least squares method, resulting in the selection of a model with 15 principal components.
Table 4 illustrates the significant variations in the prediction effectiveness among the models constructed using the six pretreatment methods. Among these, the model utilizing normalized plus first derivative pretreatment exhibited the highest prediction performance, with the Rc and Rp exceeding 0.94 and the RPD nearly reaching 3. This model enabled the efficient prediction of the VE content in Tartary buckwheat. Conversely, the model employing the normalization plus MSC pretreatment of the spectrum demonstrated poor predictive ability. Despite the Rc and Rp values above 0.8, the RPD was merely 0.3435, indicating overfitting and rendering the model unusable (Table 4).
Figure 3 depicts the regression diagram of the optimal model for predicting the VE content in Tartary buckwheat, employing a 4:1 split between the training and test sets, and utilizing the pretreatment method of normalization plus the first derivative. The data points representing the true and predicted values clustered closely around the best-fit line, thereby demonstrating a strong correlation. The Rc and Rp values for both the training and test sets approached 1 at 0.9957 and 0.9427, respectively, indicating high accuracy. Moreover, the low RMSECV and RMSEP values of 0.0504 and 0.1848, respectively, confirmed the excellent predictive ability of the model. With the RPD close to 3, at 2.933, the model exhibited high reliability and excellent prediction performance, rendering it suitable for the rapid determination of the VE content in Tartary buckwheat.

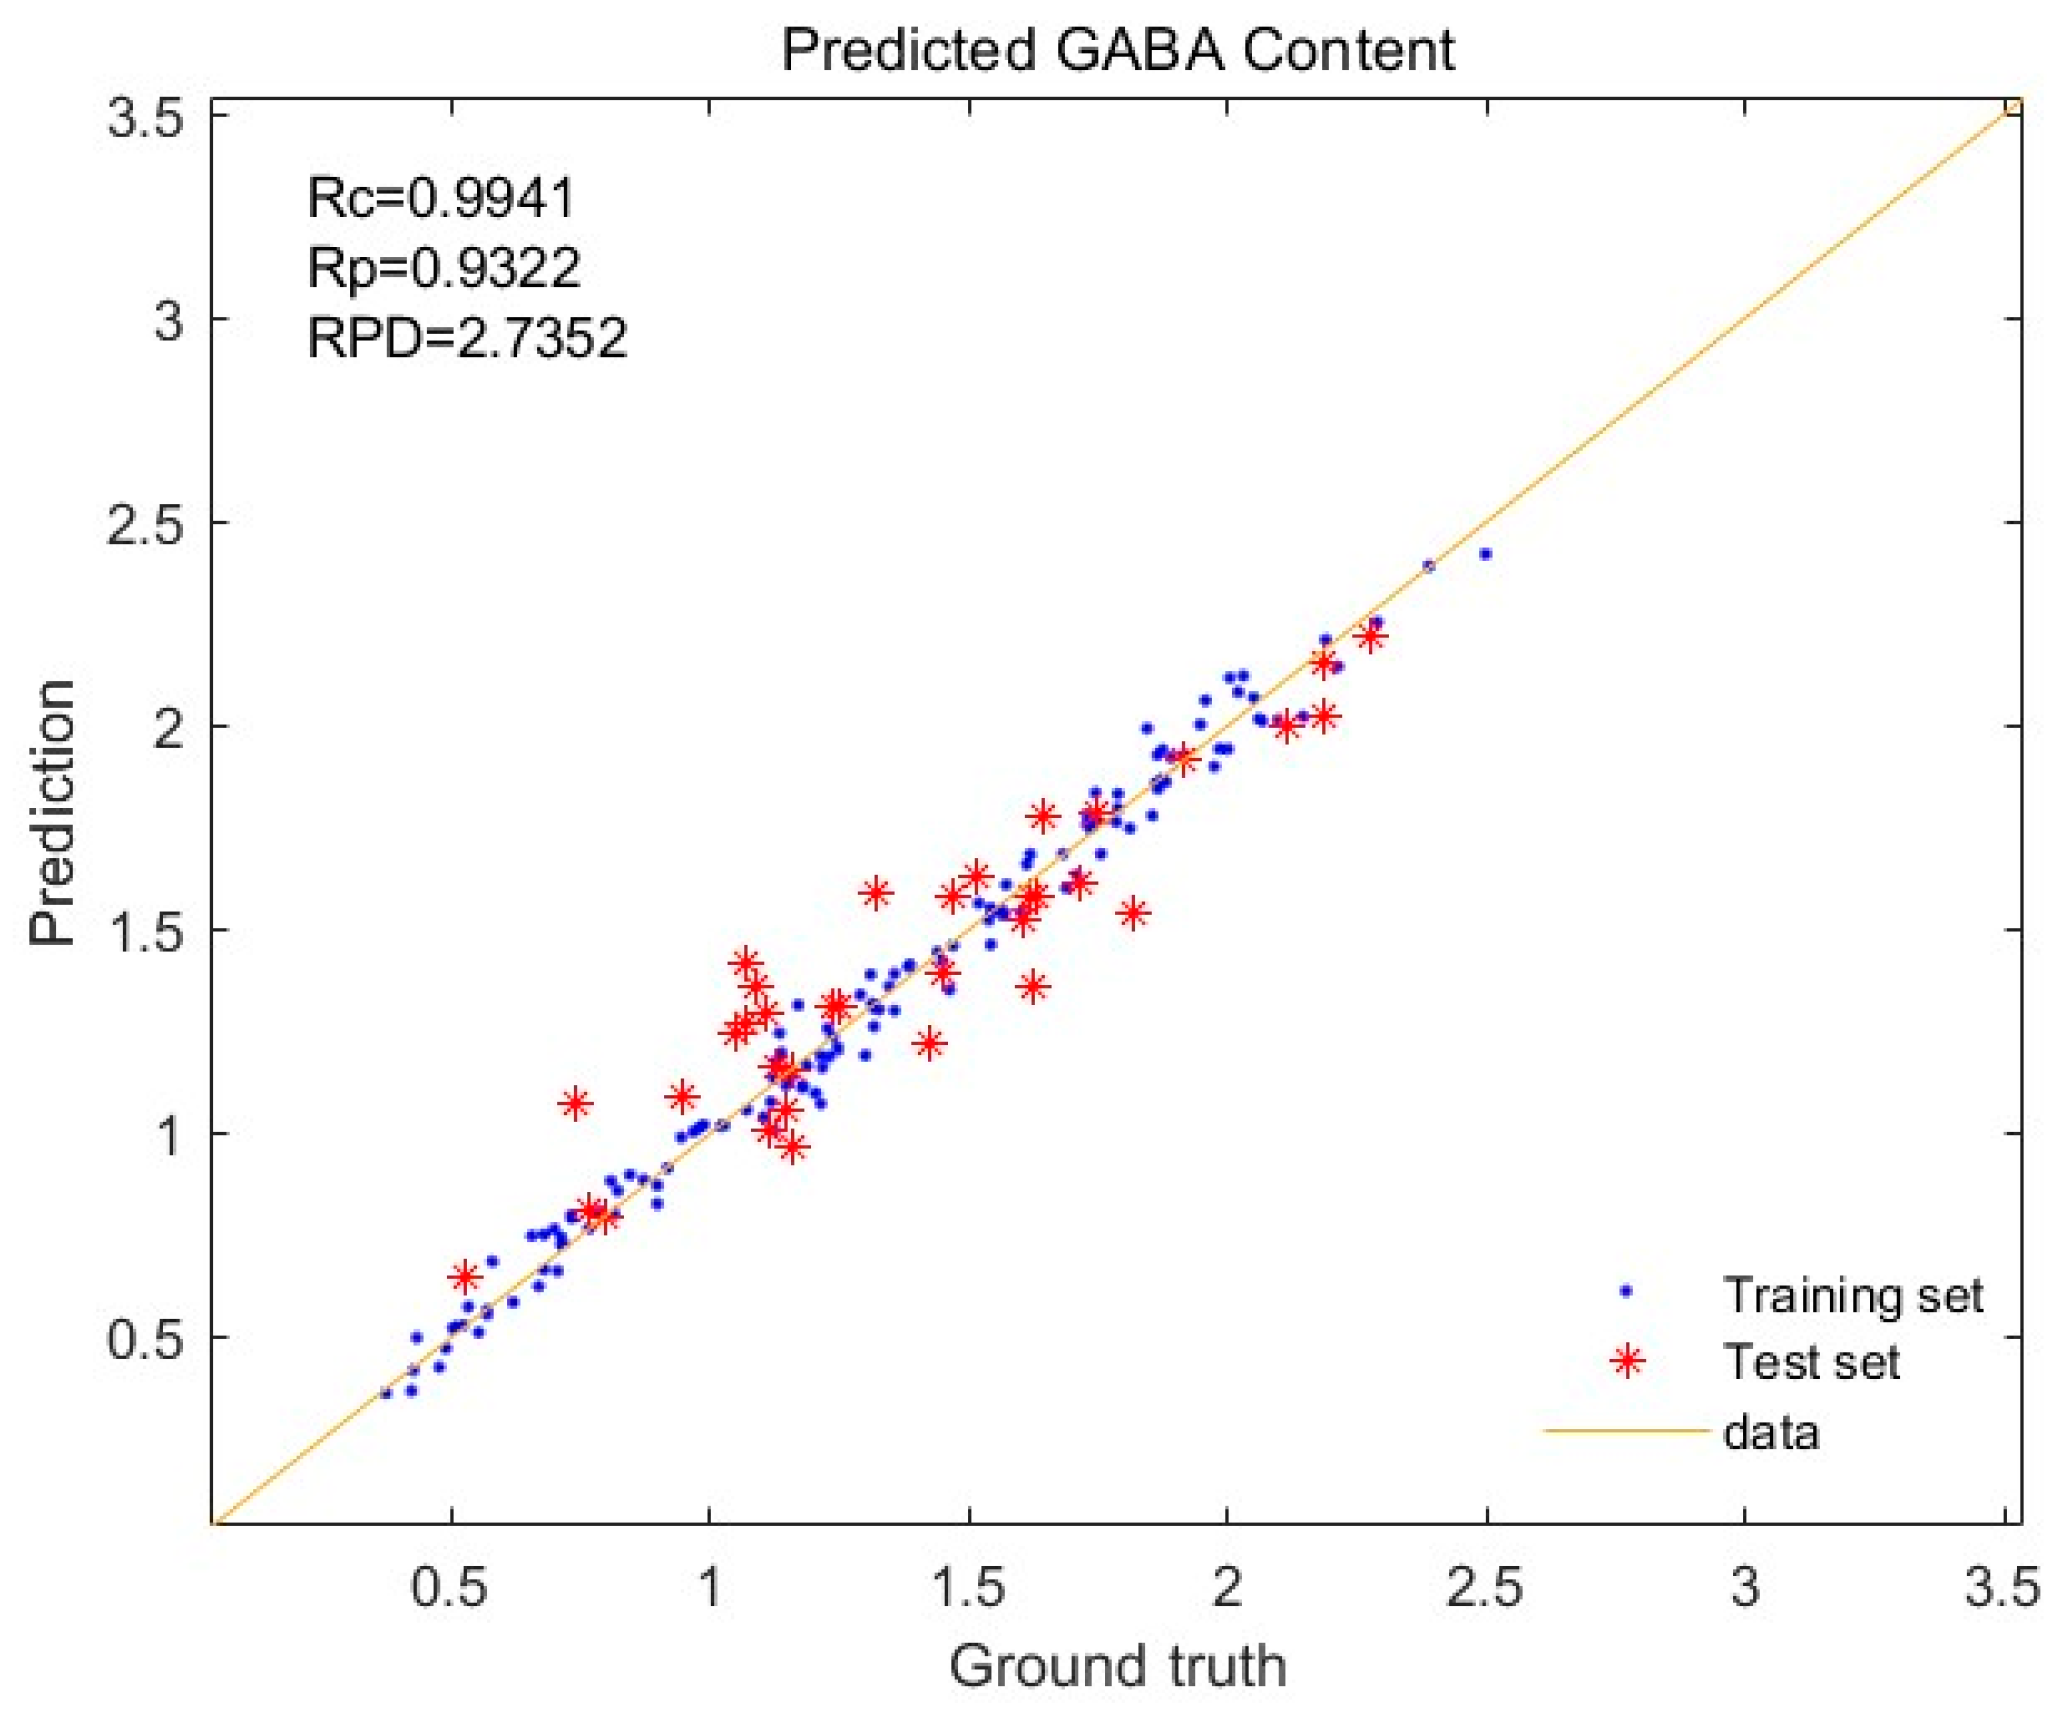
3.5. Effects of Different Pretreatment Methods on the Modeling of GABA

For the GABA modeling, the CARS algorithm divided the total wavenumber into 2307 points, of which 135–197 points were selected for the model construction, constituting 5.8–8.5% of the total wavenumber. This selection enhanced the wavenumber utilization efficiency. The modeling employed the partial least squares method with a model comprising 16 principal components.
Table 5 presents that the most effective model utilized the normalized + SNV pretreatment spectrum. With the Rc and Rp values of 0.9941 and 0.9322, respectively, along with an RPD of 2.7352, this model demonstrated the robust predictive ability for the GABA content in Tartary buckwheat. Conversely, the model constructed using normalized + MSC preprocessing spectroscopy exhibited poor performance, with a notably high RMSEP (RPD 0.8692). However, other models exhibited favorable predictive effects, exhibiting Rc and Rp values surpassing 0.95 and 0.85, respectively, along with RPDs exceeding 2.
Figure 4 illustrates the optimal GABA prediction model achieved under the condition of normalization + SNV preprocessing, with the 4:1 split between the training and test sets. Although the data points of the training set closely aligned with the best-fit line, those of the test set exhibited slight scattering in proximity to the fit line, indicating the strong predictive ability of the model. The data points from both sets were evenly distributed around the best-fit line, highlighting the stability and consistency of the model across the measurement range. The Rc and Rp values for both the training and test sets surpassed 0.9, nearing 1, with the RMSECV and RMSEP values of 0.0553 and 0.1599, respectively. The RPD of 2.7352 indicated the effective prediction performance, suggesting its suitability for rapid GABA content prediction in Tartary buckwheat.

4. Discussion

4.1. Sample Diversity

Numerous factors affected the model construction, with the sample representation and diversity being the most significant. The representative samples ensured the universality and generalizability of the model, facilitating the accurate prediction of the chemical values across different samples. The flavonoid content in buckwheat grains was observed to vary between 1.02% and 2.84% [40], and the major forms of VE were identified as γ-tocopherol (117.8 μg/g), δ-tocopherol (7.3 μg/g), and α-tocopherol (2.1 μg/g) [41]. In this study, the total flavonoid, VE, and GABA contents in the inbred lines ranged from 1.2% to 3.37%, 1.82 to 5.25 mg/100 g, and 0.37‰ to 2.49‰, respectively. These findings provided a solid foundation for the successful establishment of a widely applicable model for this study.

4.2. Pre-Processing of the Spectrum

Before creating the model, the preprocessing of the spectrum was essential to eliminate the errors induced by the noise and other factors during the scanning of the spectrum. Different preprocessing methods yielded varying effects, necessitating testing and comparison of various approaches [42]. After numerous tests, the model generated using normalization + derivative and normalization + SNV for spectrum preprocessing exhibited superior evaluation metrics. The normalization scaled the data to a specific range or distribution to mitigate the dimensional differences among various features and enhance the model training efficiency and stability [37]. However, this process may induce a baseline drift [38]. The derivative processing effectively eliminated the baseline drift and overlay effects, thereby significantly enhancing the predictive efficiency of the model [38]. The SNV primarily addressed the grain size imbalances and was crucial for modeling the full spectrum [41].

4.3. Sample Splitting

The partitioning of the sample set can play a crucial role in model development. Common partitioning methods include KS and sample set partitioning based on joint x-y distance (SPXY) methods. The KS method relies on sample similarity to ensure balanced subsets, thereby preventing bias towards specific sample types and enhancing the generalization of the model across different subsets [37]. In Khamsopha et al.’s modeling, the samples (n = 201) were divided into a calibration set (n = 140) and a prediction set (n = 61) [43]. In the modeling by Zhang et al., the samples (n = 112) were divided into a calibration set (n = 82) and a prediction set (n = 30) [30]. In addition, there are 2:1 [3], 3:1 [31], and 5:1 [44,45] ratios of training sets and test sets during the modeling process. The SPXY, an extension of the KS method, comprehensively considers the sample concentration and spectral distance for sample screening. Wang et al. employed both the SPXY and KS algorithms for sample partitioning in modeling soybean meal nutrients and determined the superiority of the KS algorithm for water and protein [42]. During the research process of this project, the KS algorithm was utilized to divide the training set and the test set into different proportions for modeling. Finally, it was found that the most favorable model was created when the ratio between the two was 4:1.

4.4. Extraction of the Characteristic Spectrum

Near-infrared spectroscopy faces several challenges, including low absorption intensity and sensitivity, spectral bandwidth, and significant overlap. The whole spectrum modeling combines these issues with high information redundancy and collinearity, leading to suboptimal model prediction performance [46]. Therefore, a variable selection method is necessary to isolate pertinent wavenumber variables and enhance model accuracy and stability. CARS, which can identify the most useful variables from thousands of wavenumbers, improves the predictive ability while reducing model complexity [47]. In Li et al.’s study, the SPA and CARS feature screening methods were adopted to classify the rice mold by screening feature wavenumber and creating models. The findings revealed that the feature wavenumber identified by the CARS algorithm exhibited superior discriminative power, thereby enhancing the discriminative ability of the model [48]. The spectral multivariate quantitative correction methods include both linear and nonlinear approaches. The widely utilized linear correction algorithm is the partial least squares method, and the most common nonlinear correction algorithms include the BP neural network and support vector machine [49]. Li et al. constructed a near-infrared model for the flavonoid content in peanut kernels using full-wavenumber spectroscopy, achieving the Rc value of 0.884 for the correction set [50]. By contrast, this study yielded improved modeling results following the feature spectrum extraction using the CARS algorithm. The correlation coefficients between the modeling and test sets surpassed 0.94. PLS modeling offered the advantage of effectively reducing dimensions and eliminating complex collinearities between variables by extracting the principal components from the matrices of independent and dependent variables. In our previous study, the GABA prediction model for Tartary buckwheat leaves, built using the near-infrared full spectrum, exhibited coefficients of determination of 0.9328 and 0.9149 for the training and test sets, respectively [3]. In this study, the utilization efficiency of the wavenumber was significantly enhanced by employing the CARS algorithm, consequently improving the predictive capability of the model constructed using the least-squares method. The coefficients of determination for the training and test sets were 0.9941 and 0.9322, respectively.

4.5. Modeling of Whole Grains

Researchers typically scan the spectrum after crushing the sample and subsequently employ the entire spectrum to construct a compositional prediction model. This approach unavoidably prolongs the sample processing time [3,28,29]. Zhang et al. demonstrated the effective spectral modeling of intact sorghum grains, yielding a favorable modeling effect [30]. Li et al. observed that modeling the near-infrared spectra of paddy, brown rice, and rice separately yielded reliable models for predicting rice amylose content [50]. To cater to the requirements of buckwheat breeding and enhance the utility of the model, the experiment collected spectra from whole grains before modeling. Subsequently, separate NIR models for total flavonoids, VE, and GABA were developed. The findings of this study demonstrated that the satisfactory spectral modeling of Tartary buckwheat grains was achievable using suitable processing methods. This efficacy was attributed to the rich information content present in whole grains and the reliable pretreatment methods facilitating the enhanced information extraction for modeling purposes.

4.6. Potential Limitations

Scientists use modeling of RIL populations to predict chemical values and to perform QTL mapping and achieve good results [51,52,53]. In this study, near-infrared models were successfully constructed to predict the total flavonoid, VE, and GABA contents of Tartary buckwheat. The Rc and Rp values of the best model are both above 0.93, which may contribute to these RIL populations achieving high quality in production, breeding, and QTL mapping. However, modeling RIL populations also has drawbacks. It has been found that modeling natural populations has better predictive power for exotic samples than modeling RIL populations. This could be related to the narrower range of chemical values in RIL populations [52]. The construction of the model is influenced by various factors, the representativeness and diversity of the samples being among the most important. A wider range of chemical values in the sample increases the applicability of the constructed model. Therefore, the predicted results of samples with chemical values within the range of RILs will be more accurate. To expand the scope of the model, we need to add samples outside the group of inbred lines to the modeling samples.
The model created in this study can predict the total contents of flavonoids, vitamin E, and GABA in the seeds of Tartary buckwheat relatively accurately. To apply these models in practice during breeding or cultivation, near-infrared spectra must first be collected. With the development of the technology, scientists have been able to use convolutional neural network technology to extract the NIR band in satellite imagery [54] and utilize the reflectivity of the resolution imaging spectrometer in the red and near-infrared spectral regions to estimate chlorophyll-α concentrations in turbid coastal and estuarine production waters [55]. Drones equipped with RGB cameras are used to repeatedly collect image information from plots to achieve real-time monitoring of the height and growth rate of crops grown on the plots [56]. In the future, we may also try to use satellite images and drone technology to collect near-infrared spectral information, which will be imported into the near-infrared model to realize real-time monitoring of field samples.

5. Conclusions

In this study, the NIRS technology offered a rapid and reliable method for predicting the contents of total flavonoids, VE, and GABA in the RILs of Tartary buckwheat. The CARS algorithm was used to filter the features of the original spectra of the grains of the RIL population of Tartary buckwheat, and a series of quantitative analysis models based on PLS were built. The constructed model achieved Rp values of 0.9419, 0.9427, and 0.9322 in predicting the total flavonoid, VE, and GABA contents, respectively. This significantly reduced the cycle time for seed selection and quality assessment in buckwheat breeding, thereby enhancing the work efficiency and providing practical value.

Author Contributions

Resources, L.Z., Q.C. and T.S.; Funding acquisition, L.Z. and Q.C.; Project administration, L.Z.; Writing—review and editing, L.Z., Q.C., T.S., J.D., J.H., H.L. and F.C.; Supervision, L.Z.; Investigation, Q.D.; Data curation, Q.D.; Methodology, Q.D.; Writing—original draft, Q.D. All authors have read and agreed to the published version of the manuscript.

Funding

This research was funded by the earmarked fund for China Agricultural Research system (grant number CARS 07-A5), the National Natural Science Foundation of China (grant number 31760430), the major science and technology project and key research and development plan of Yunnan Province (grant number 202202AE090020), and the Qianshi new seedling project (grant number [2021]B17).

Data Availability Statement

The original contributions presented in the study are included in the article, further inquiries can be directed to the corresponding author/s.

Acknowledgments

We would like to thank all the reviewers who participated in the review.

Conflicts of Interest

The authors declare no conflict of interest.

References

  1. Luo, S.; Huang, J.M.; Yi, Y.; Zhang, Z.Y. Development status, problems, advantages and countermeasures of guizhou buckwheat industry. Tillage Cultiv. 2017, 6, 49–53+68. [Google Scholar]
  2. Qu, Z.H.; Bai, J.; Liu, R.M.; Wang, D.Q.; Zuo, W.B. Effects of variety and environment on flavonoid content in F. esculentum Moench. J. Shanxi Agric. Sci. 2023, 51, 1404–1409. [Google Scholar]
  3. Zhu, L.W.; Zhou, Y.; Cai, F.; Deng, J.; Huang, J.; Zhang, X.N.; Zhang, J.G.; Chen, Q.F. Quantitative analysis of perennial buckwheat leaves protein and GABA using near infrared spectroscopy. Spectrosc. Spectr. Anal. 2020, 40, 2421–2426. [Google Scholar]
  4. Zhang, Z.L.; Zhou, M.L.; Tang, Y.; Li, F.L.; Tang, Y.X.; Shao, J.R.; Xue, W.T.; Wu, Y.M. Bioactive compounds in functional buckwheat food. Food Res. Int. 2012, 49, 389–395. [Google Scholar] [CrossRef]
  5. Chang, Z.H.; NiMa, Y.Z.; Huang, H.J.; Laba, Z.X.; Gao, X.L.; Tian, P.J.; Yin, Z.J. Exploring the mechanism of Tartary Fagopyrum tataricum on pancreatic cancer based on data mining. Tibet J. Agric. Sci. 2023, 45, 29–34. [Google Scholar]
  6. Wang, Y.F.; Chen, X.Y.; Han, S.Y.; Zhu, L.S.; Liu, S.M.; Lv, H.; Chu, J.X. Experimental study on total flavones from buckwheat leaf in fighting pain and in flammation. Acad. J. Shanghai Univ. Tradit. Chin. Med. 2004, 11, 54–55. [Google Scholar]
  7. Zhu, L.S.; Ma, X.C.; Han, S.Y.; Liu, S.M.; Lv, H. Effects of total flavones of buckwheat leaf on blood lipid and lipid peroxides. Chin. J. Clin. Rehabil. 2004, 24, 5178–5179. [Google Scholar]
  8. Ke, J.; Ran, B.; Sun, P.; Cheng, Y.; Chen, Q.; Li, H. An evaluation of the absolute content of flavonoids and the identification of their relationship with the flavonoid biosynthesis genes in Tartary buckwheat seeds. Agronomy 2023, 13, 3006. [Google Scholar] [CrossRef]
  9. Tan, P.Y.; Guo, W.B. Research progress of Tartary buckwheat flavonoids on human body’s physiological function and mechanism. Med. Recapitul. 2018, 24, 1627–1632. [Google Scholar]
  10. Qiu, J.; Liu, Y.P.; Yue, Y.F.; Qin, Y.C.; Li, Z.G. Dietary Tartary buckwheat intake attenuates insulin resistance and improves lipid profiles in patients with type 2 diabetes: A randomized controlled trial. Nutr. Res. 2016, 36, 1392–1401. [Google Scholar] [CrossRef]
  11. Lei, L.T.; Zhou, Y.C.; Pu, X.Y. Preparation of flavonoid compounds from Tartary buckwheat and study on their antioxidative and hypoglycemic effects. Chin. Food Ind. 2023, 02, 102–104. [Google Scholar]
  12. Qin, P.Y.; Wang, Q.A.; Shan, F.; Hou, Z.H.; Ren, G.X. Nutritional composition and flavonoids content of flour from different buckwheat cultivars. Int. J. Food Sci. Tech. 2010, 45, 951–958. [Google Scholar] [CrossRef]
  13. Yao, P.; Huang, Y.; Dong, Q.; Wan, M.; Wang, A.; Chen, Y.; Li, C.; Wu, Q.; Chen, H.; Zhao, H. FtMYB6, a light-induced SG7 R2R3-MYB transcription factor, promotes flavonol biosynthesis in Tartary buckwheat (Fagopyrum tataricum). J. Agric. Food Chem. 2020, 68, 13685–13696. [Google Scholar] [CrossRef] [PubMed]
  14. Duan, C.Y.; Xiong, X.; Jing, M.Y.; Gao, Y.; Hou, F.F.; Xing, G.M.; Li, S. Genetic analysis and QTL localization of vitamin E content in Hemerocallis citrina Baroni. J. Hebei Agric. Univ. 2023, 46, 38–45. [Google Scholar]
  15. Ma, J.T.; Qiu, D.Y.; Pang, Y.Z.; Gao, H.W.; Wang, X.M.; Qin, Y.C. Diverse roles of tocopherols in response to abiotic and biotic stresses and strategies for genetic biofortification in plants. Mol. Breed. 2020, 40, 18. [Google Scholar] [CrossRef]
  16. Sozen, E.; Demirel, T.; Ozer, N.K. Vitamin E: Regulatory role in the cardiovascular system. IUBMB Life 2019, 71, 507–515. [Google Scholar] [CrossRef] [PubMed]
  17. Ekeuku, S.O.; Etim, E.P.; Pang, K.L.; Chin, K.Y.; Mai, C.W. Vitamin E in the management of pancreatic cancer: A scoping review. World J. Gastrointest. Oncol. 2023, 15, 943–958. [Google Scholar] [CrossRef] [PubMed]
  18. Wu, Z.; Wang, N.S.; Li, Y.H. Correlation of serum glutamate and gamma-aminobutyric acid levels with clinical symptoms in chronic schizophrenia patients and their diagnostic value for cognitive impairment. Int. J. Lab. Med. 2024, 45, 95–98+103. [Google Scholar]
  19. Yan, R. The levels and clinical significance of serum glutamate and T-aminobutyric acid in patients with depression. J. Int. Psychl. 2022, 49, 609–611. [Google Scholar]
  20. Tong, X.M.; Chai, C.X.; Wang, Y.Q. Effect of germination on grain quality of Tartary buckwheat and optimization of technology. Food Mach. 2021, 4, 176–183. [Google Scholar]
  21. Xi, Z.Y. Study on Non-Destructive Detection Method of Buckwheat Based on Near-Infrared Spectroscopy Technology. Master’s Thesis, Kunming University of Science and Technology, Kunming, China, 2013. [Google Scholar]
  22. Xu, B.C.; Ding, X.L. The quantitative methods of flavonoids in buckwheat (Fagopyrum tataricum). J. Food Sci. Biotechnol. 2003, 02, 98–101. [Google Scholar]
  23. Tang, C.Y.; Wang, T.; Tu, J.; Liu, G.H.; Li, P.; Zhao, J. Comparison of colorimetry and HPLC for determination of γ-aminobutyric acid in mulberry leaf tea. Food Sci. 2018, 39, 256–260. [Google Scholar]
  24. Zheng, Z.X. Application of near-infrared spectroscopy analysis technology in the feed processing industry. Fujian Agric. Mach. 2019, 1, 24–27. [Google Scholar]
  25. Yang, N.; Ren, G.X. Application of near-infrared reflectance spectroscopy to the evaluation of rutin and d-chiro-inositol contents in Tartary buckwheat. J. Agric. Food Chem. 2008, 761–764. [Google Scholar] [CrossRef] [PubMed]
  26. Li, W.L.; Han, H.F.; Cheng, Z.W.; Zhang, Y.; Liu, S.Y.; Qu, H.B. A feasibility research on the monitoring of traditional Chinese medicine production process using NIR-based multivariate process trajectories. Sens. Actuators B Chem. 2016, 231, 313–323. [Google Scholar] [CrossRef]
  27. Platov, Y.T.; Metlenkin, D.A.; Platova, R.A.; Rassulov, V.A.; Vereshchagin, A.I.; Marin, V.A. Buckwheat identification by combined UV-VIS-NIR spectroscopy and multivariate analysis. J. Appl. Spectrosc. 2021, 88, 723–730. [Google Scholar] [CrossRef]
  28. Zhu, L.W.; Yan, J.X.; Huang, J.; Shi, T.X.; Cai, F.; Li, H.Y.; Chen, Q.F.; Chen, Q.J. Rapid determination of amino acids in golden Tartary buckwheat based on near infrared spectroscopy and artificial neural network. Spectrosc. Spectr. Anal. 2022, 42, 49–55. [Google Scholar]
  29. Zhang, J.; Guo, J.; Zhang, M.L.; Zhang, X.; E, J.J. Establishment of rapid detection model of buckwheat nutritional components based on near infrared spectroscopy. J. Chin. Cereals Oils Assoc. 2020, 35, 151–158. [Google Scholar]
  30. Zhang, B.J.; Chen, S.S.; Li, K.Y.; Li, L.H.; Xu, R.H.; An, C.; Xiong, F.M.; Zhang, Y.; Dong, L.L.; Ren, M.J. Construction and application of detection model for amylose and amylopectin content in sorghum grains based on near infrared spectroscopy. Sci. Agric. Sin. 2022, 55, 26–35. [Google Scholar]
  31. Wang, Y.Y.; Dai, Y.J.; Wang, Y.Y.; Yang, J.L.; Xiang, D.H.; Yang, Y.Q.; Zeng, S.W. Research on non-destructive detection of protein and fat content in Torreya based on near-infrared spectroscopy technology. Sci. Technol. Food Ind. 2024, 45, 1–8. [Google Scholar]
  32. Wang, C.W. The Vegetable Quality Evaluation of Perennial Buckwheat. Master’s Thesis, Guizhou Normal University, Guiyang, China, 2015. [Google Scholar]
  33. Chen, M.M.; Qiu, Y.C.; Song, Y.; Yang, S.Q.; Zuo, F.; Qian, L.L. Study on origin tracing of mung bean based on near-infrared spectrum. J. Heilongjiang Bayi Agric. Univ. 2024, 36, 49–54. [Google Scholar]
  34. Yan, H.; Neves, M.D.G.; Wise, B.M.; Moraes, I.A.; Barbin, D.F.; Siesler, H.W. The application of handheld near-infrared spectroscopy and raman spectroscopic imaging for the identification and quality control of food products. Molecules 2023, 28, 7891. [Google Scholar] [CrossRef]
  35. Lv, D.; Li, R.Y.; Zheng, R.; Zheng, J.Q.; Meng, Z.Y.; Shi, T.X.; Chen, Q.F. Variation analysis of flavonoids content in seeds and seed traits of tartary buckwheat germplasn resources. Mol. Plant Breed. 2020, 18, 4762–4774. [Google Scholar]
  36. Ren, C.Z.; Shan, F.; Wang, M.; Li, Y.L. Review on nutrition and functionality and food product development of buckwheat. Chin. J. Grain Oil Sci. 2022, 37, 261–269. [Google Scholar]
  37. Galvao, R.K.H.; Araujo, M.C.U.; Jose, G.E.; Pontes, M.J.C.; Silva, E.C.; Saldanha, T.C.B. A method for calibration and validation subset partitioning. Talanta 2005, 67, 736–740. [Google Scholar] [CrossRef] [PubMed]
  38. Rabatel, G.; Marini, F.; Walczak, B.; Roger, J. VSN: Variable sorting for normalization. J. Chemom. 2019, 34, e3164. [Google Scholar] [CrossRef]
  39. Chu, X.L.; Li, Y.H. Practical Handbook of Near Infrared Spectroscopy, 1st ed.; Chemical Industry Press: Beijing, China, 2023; pp. 139–140. [Google Scholar]
  40. Barnes, R.J.; Dhanoa, M.S.; Lister, S.J. Correction to the description of standard normal variate (SNV) and detrend (DT) transformations in practical spectroscopy with applications in food and beverage analysis—2nd Edition. J. Near Infrared Spectrosc. 1993, 1, 185–186. [Google Scholar] [CrossRef]
  41. Sun, J.H.; Zhang, W.; Shi, J.Q.; Li, Y.K. Selection and application of spectral data preprocessing strategy. Acta Metrol. Sin. 2023, 44, 1284–1292. [Google Scholar]
  42. Wang, L.Q.; Yao, J.; Wang, R.Y.; Chen, Y.H.; Luo, S.N.; Wang, W.N.; Zhang, Y.R. Research on detection of soybean meal quality by nir based on PLS-GRNN. Spectrosc. Spect. Anal. 2022, 42, 1433–1438. [Google Scholar]
  43. Khamsopha, D.; Woranitta, S.; Teerachaichayut, S. Utilizing near infrared hyperspectral imaging for quantitatively predicting adulteration in tapioca starch. Food Control 2021, 123, 107781. [Google Scholar] [CrossRef]
  44. Li, S.P.; Wang, J.Y.; Wang, L. Construction and application of amylose content calibration model based on near-infrared spectroscopy. Grain Oil Sci. Technol. 2023, 36, 139–143. [Google Scholar]
  45. Chai, Y.H.; Yu, Y.; Zhu, H.; Li, Z.M.; Dong, H.; Yang, H.S. Identification of common buckwheat (Fagopyrum esculentum Moench) adulterated in Tartary buckwheat (Fagopyrum tataricum (L.) Gaertn) flour based on near-infrared spectroscopy and chemometrics. Curr. Res. Food Sci. 2023, 7, 100573. [Google Scholar] [CrossRef]
  46. Cui, C.; Liu, C.L.; Sun, X.R.; Wu, J.Z. Peanut frostbite detection method based on near infrared hyperspectral imaging technology. Food Ind. Technol. 2024, 45, 226–233. [Google Scholar]
  47. Centner, V.; Massart, D.L.; Denoord, O.E.; Dejong, S.; Vandeginste, B.M.; Sterna, C. Elimination of uninformative variables for multivariate calibration. Anal. Chem. 1996, 68, 3851–3858. [Google Scholar] [CrossRef]
  48. Li, B.; Su, C.T.; Yin, H.; Liu, Y.D. Hyperspectral imaging technology combined with machine learning for detection of moldy rice. Spectrosc. Spectr. Anal. 2023, 43, 2391–2396. [Google Scholar]
  49. Chen, P.; Dai, J.W.; Li, J.Y.; Xu, Y.P.; Liu, D.; Chu, X.L. Progress of chemometric methods in near- infrared spectroscopy. Chem. Reag. 2023, 45, 105–112. [Google Scholar]
  50. Li, Z.; Hong, M.Y.; Cui, S.L.; Chen, M.; Liu, X.K.; Chen, H.Y.; Liu, L.F. Rapid detection method of flavonoid content in peanut seed based on near infrared technology. Spectrosc. Spectr. Anal. 2024, 44, 1112–1116. [Google Scholar]
  51. Hashemi, S.M.; Perry, G.; Rajcan, I.; Eskandari, M. SoyMAGIC: An unprecedented platform for genetic studies and breeding activities in soybean. Front Plant Sci. 2022, 13, 945471. [Google Scholar] [CrossRef]
  52. Zhang, H.J.; Wu, J.H.; Luo, Y.; Li, L.J.; Yang, H.; Yu, X.Q.; Wang, X.S.; Chen, L.; Mei, H.W. Comparison of near infrared spectroscopy models for determining protein and amylose contents between calibration samples of recombinant inbred lines and conventional varieties of rice. Sci. Agric. Sin. 2007, 6, 941–948. [Google Scholar] [CrossRef]
  53. Jasinski, S.; Lécureuil, A.; Durandet, M.; Bernard-Moulin, P.; Guerche, P. Arabidopsis seed content QTL mapping using high-throughput phenotyping: The assets of near infrared spectroscopy. Front. Plant Sci. 2016, 7, 1682. [Google Scholar] [CrossRef]
  54. Illarionova, S.; Shadrin, D.; Trekin, A.; Ignatiev, V.; Oseledets, I. Generation of the nir spectral band for satellite images with convolutional neural networks. Sensors 2021, 21, 5646. [Google Scholar] [CrossRef] [PubMed]
  55. Moses, W.J.; Gitelson, A.A.; Berdnikov, S.; Povazhnyy, V. Satellite estimation of chlorophyll-α concentration using the red and NIR bands of MERIS—The Azovsea case study. IEEE Geosci. Remote Sens. Lett. 2009, 6, 845–849. [Google Scholar] [CrossRef]
  56. Holman, F.H.; Riche, A.B.; Michalski, A.; Castle, M.; Wooster, M.J.; Hawkesford, M.J. High throughput field phenotyping of wheat plant height and growth rate in field plot trials using UAV based remote sensing. Remote Sens. 2016, 8, 1031. [Google Scholar] [CrossRef]
Figure 1. Raw near-infrared spectra of 175 samples of Tartary buckwheat grains. Note: Different colors in the image represent different samples of Tartary buckwheat grains.
Agronomy 14 01826 g001
Figure 2. Regression plot of true and predicted values of total flavonoid.
Agronomy 14 01826 g002
Figure 3. Regression plot of true and predicted values of VE.
Agronomy 14 01826 g003
Figure 4. Regression plot of true and predicted GABA values.
Agronomy 14 01826 g004
Table 1. Statistical analysis of total flavonoid, VE, and GABA contents in the seeds of RILs of Tartary buckwheat.
Functional
Component
Number of Samples (NS)RangeMean Value (MV)SkewnessKurtosisStandard Deviation (SD)Coefficient of Variation (CV)
Total flavonoid1751.20–3.372.42−0.4620.2760.3615.06
VE1731.82–5.263.330.0610.5020.5516.53
GABA1730.37–2.501.340.054−0.8180.4936.93
Note: The unit for the total flavonoid range and mean value in the table is %, the unit for the VE range and mean value is mg/100 g, the unit for the GABA range and mean value is ‰, and the unit for the SD is the same as the unit for the mean value between the same rows. These units apply throughout this study.
Table 2. Sample data for the training and test sets used in modeling.
Functional ComponentNSSample SizeRangeMVSD
Total flavonoidtraining set1401.20–3.372.440.37
test set351.71–2.902.390.35
VEtraining set1381.82–5.263.370.54
test set351.94–4.303.260.54
GABAtraining set1380.37–2.501.310.51
test set350.53–2.271.390.43
Table 3. Effect of pretreatment method on total flavonoid models.
Pretreatment MethodRcRpRMSECVRMSEPRPD
Normalization0.95860.77250.10620.22451.5719
Normalization + MSC0.96210.83240.10180.19591.8013
Normalization + SNV0.94910.73030.11750.25091.4063
Normalization + First derivative0.99560.94190.03500.11782.9944
Normalization + Second derivative0.99540.93890.03560.12172.8988
Normalization + SG0.95340.74830.11260.24011.4692
Table 4. Effect of pretreatment method on VE models.
Pretreatment MethodRcRpRMSECVRMSEPRPD
Normalization0.98560.77480.09150.34831.5562
Normalization + MSC0.98610.84830.09001.57800.3435
Normalization + SNV0.98700.85860.08690.27941.9399
Normalization + First derivative0.99570.94270.05040.18482.9330
Normalization + Second derivative0.99800.93290.03430.19742.7459
Normalization + SG0.98070.86330.10570.30081.8021
Table 5. Effect of pretreatment method on GABA models.
Pretreatment MethodRcRpRMSECVRMSEPRPD
Normalization0.99360.89030.05790.20072.1786
Normalization + MSC0.99290.91610.06110.50310.8692
Normalization + SNV0.99410.93220.05530.15992.7352
Normalization + First derivative0.99730.90320.03780.20282.1560
Normalization + Second derivative0.0.99890.89500.02450.19442.2494
Normalization + SG0.99430.90670.05470.17932.4385
Disclaimer/Publisher’s Note: The statements, opinions and data contained in all publications are solely those of the individual author(s) and contributor(s) and not of MDPI and/or the editor(s). MDPI and/or the editor(s) disclaim responsibility for any injury to people or property resulting from any ideas, methods, instructions or products referred to in the content.

