

Effects of Different Tillage Years on Soil Composition and Ground-Dwelling Arthropod Diversity in Gravel-Sand Mulching Watermelon Fields

 , ,
, ,
Abstract
1. Introduction
2. Materials and Methods
2.1. Site Details and Field Experimental Design
2.2. Soil Collection and Physicochemical Properties Measurements
2.3. Collection of Arthropods
2.4. Statistical Analysis of Data
3. Results
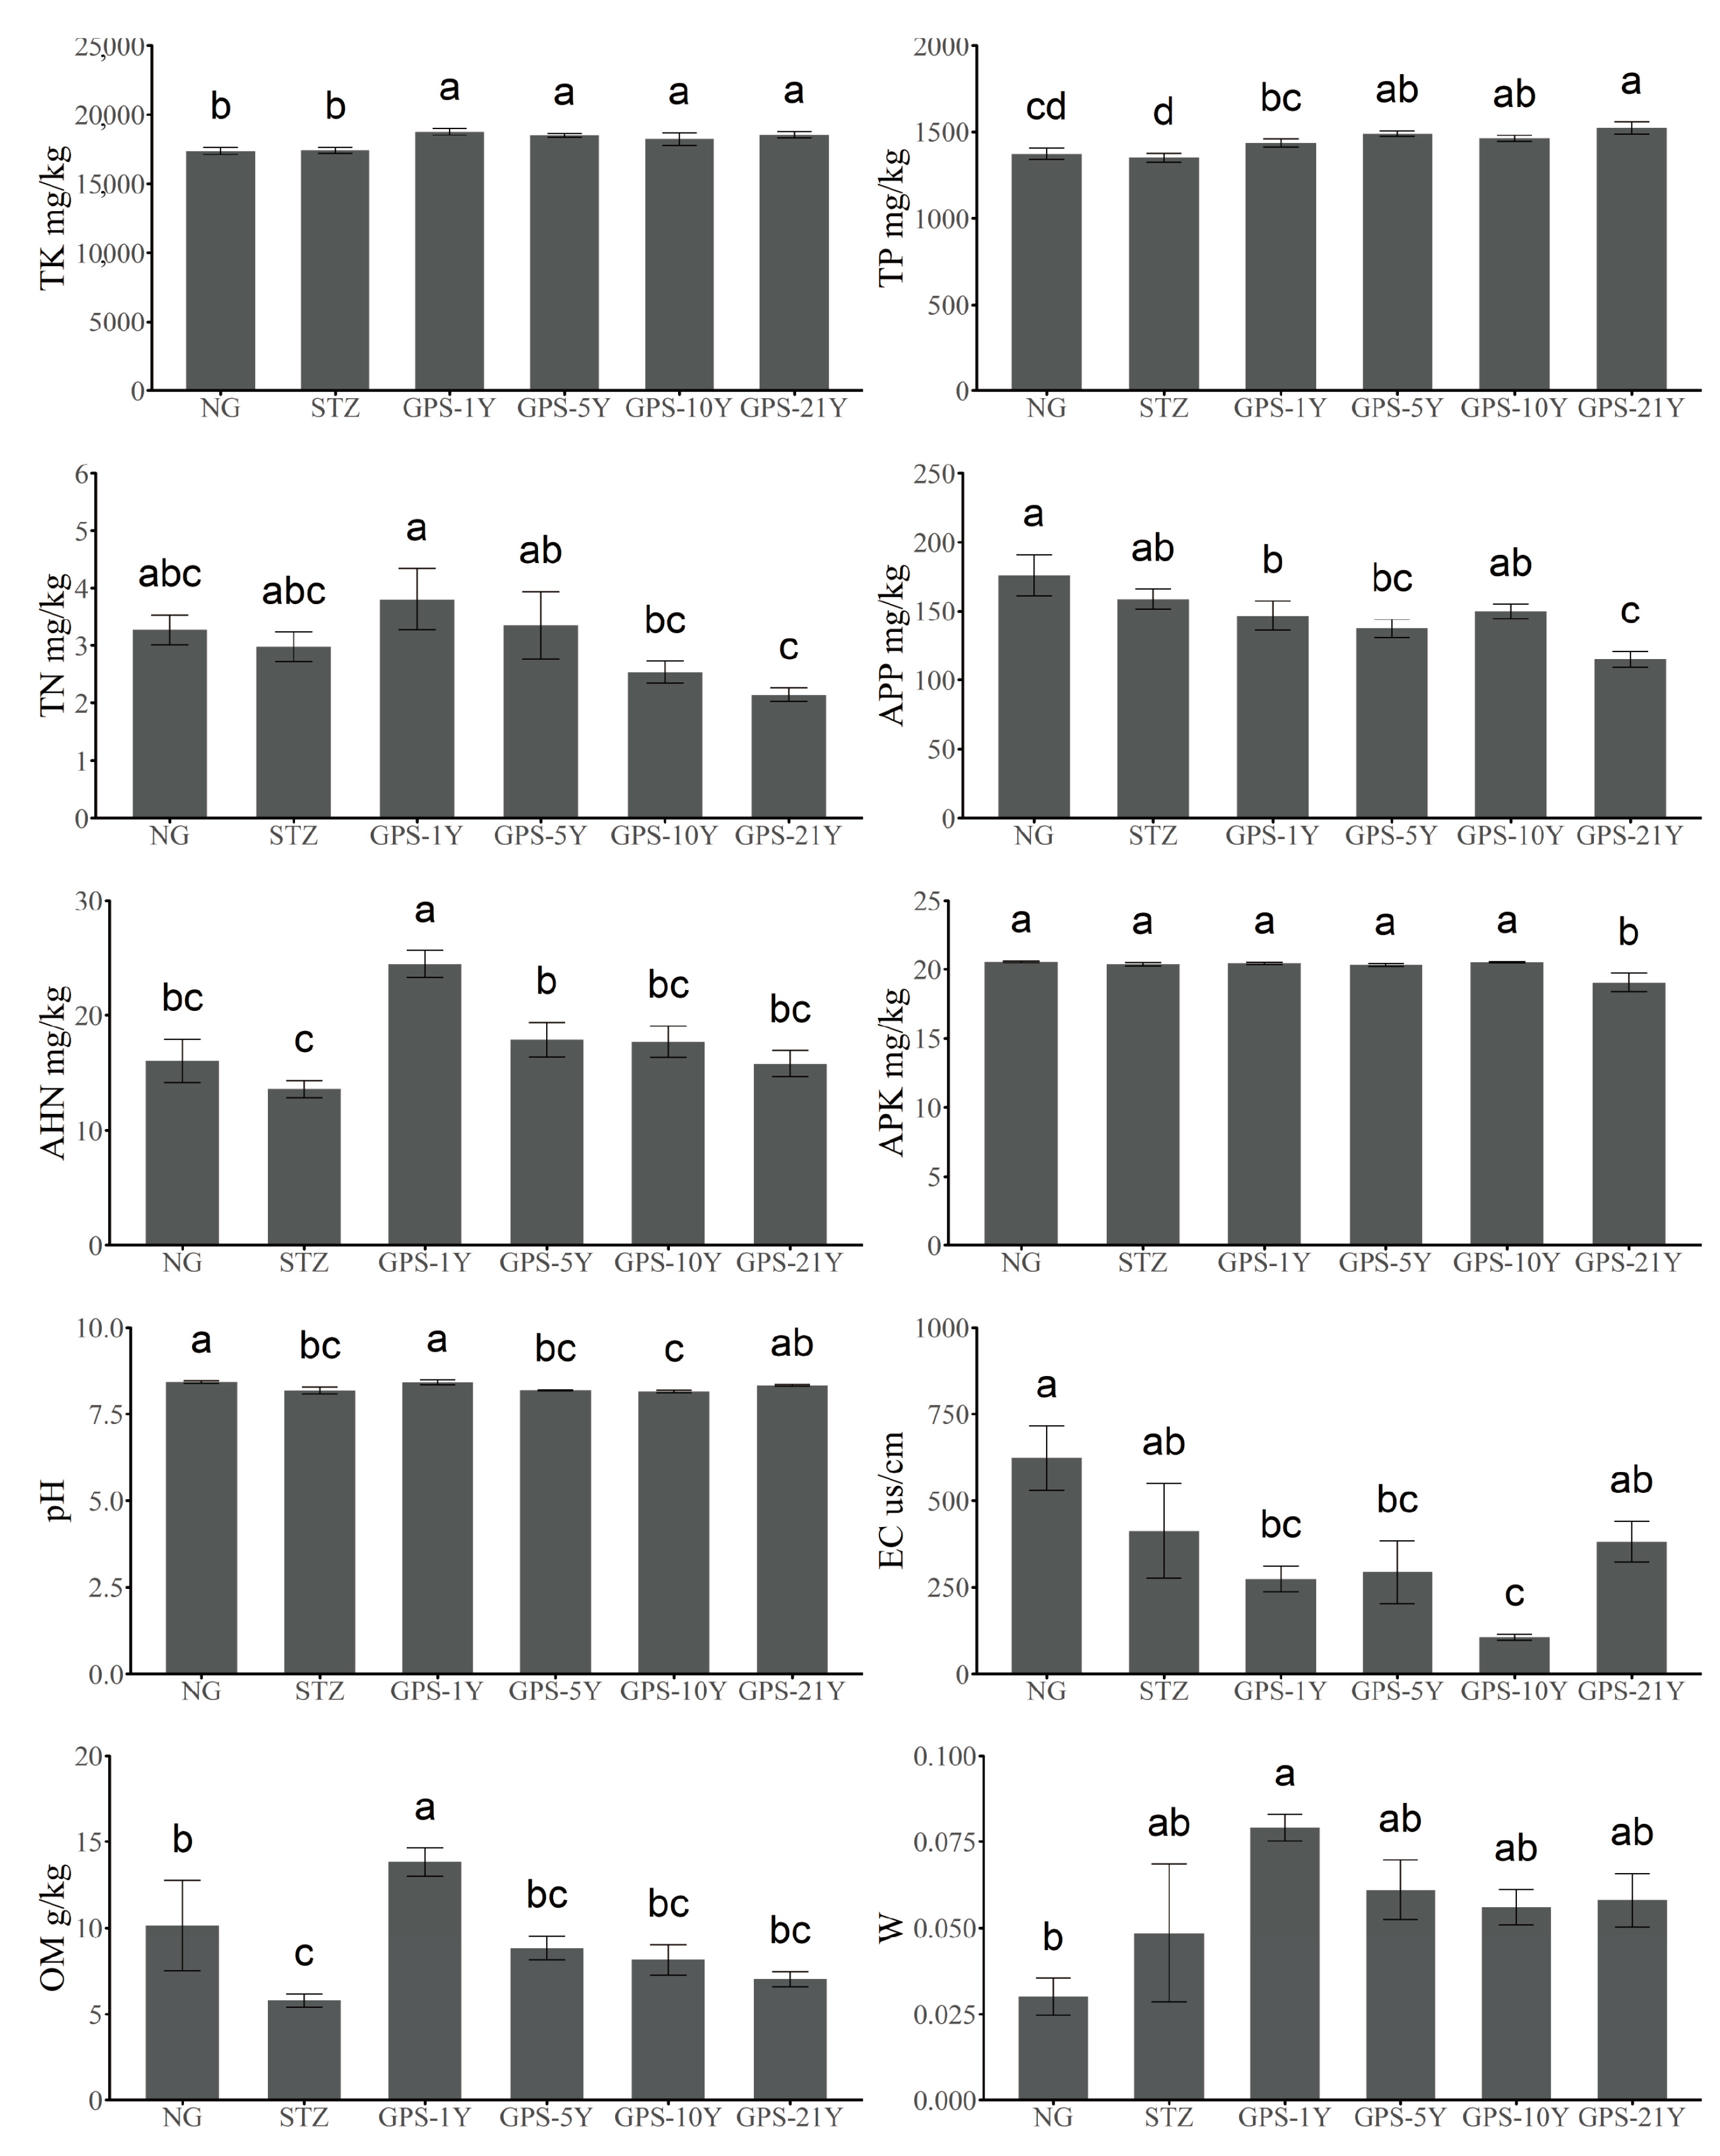
3.1. Changes in Soil Physicochemical Properties
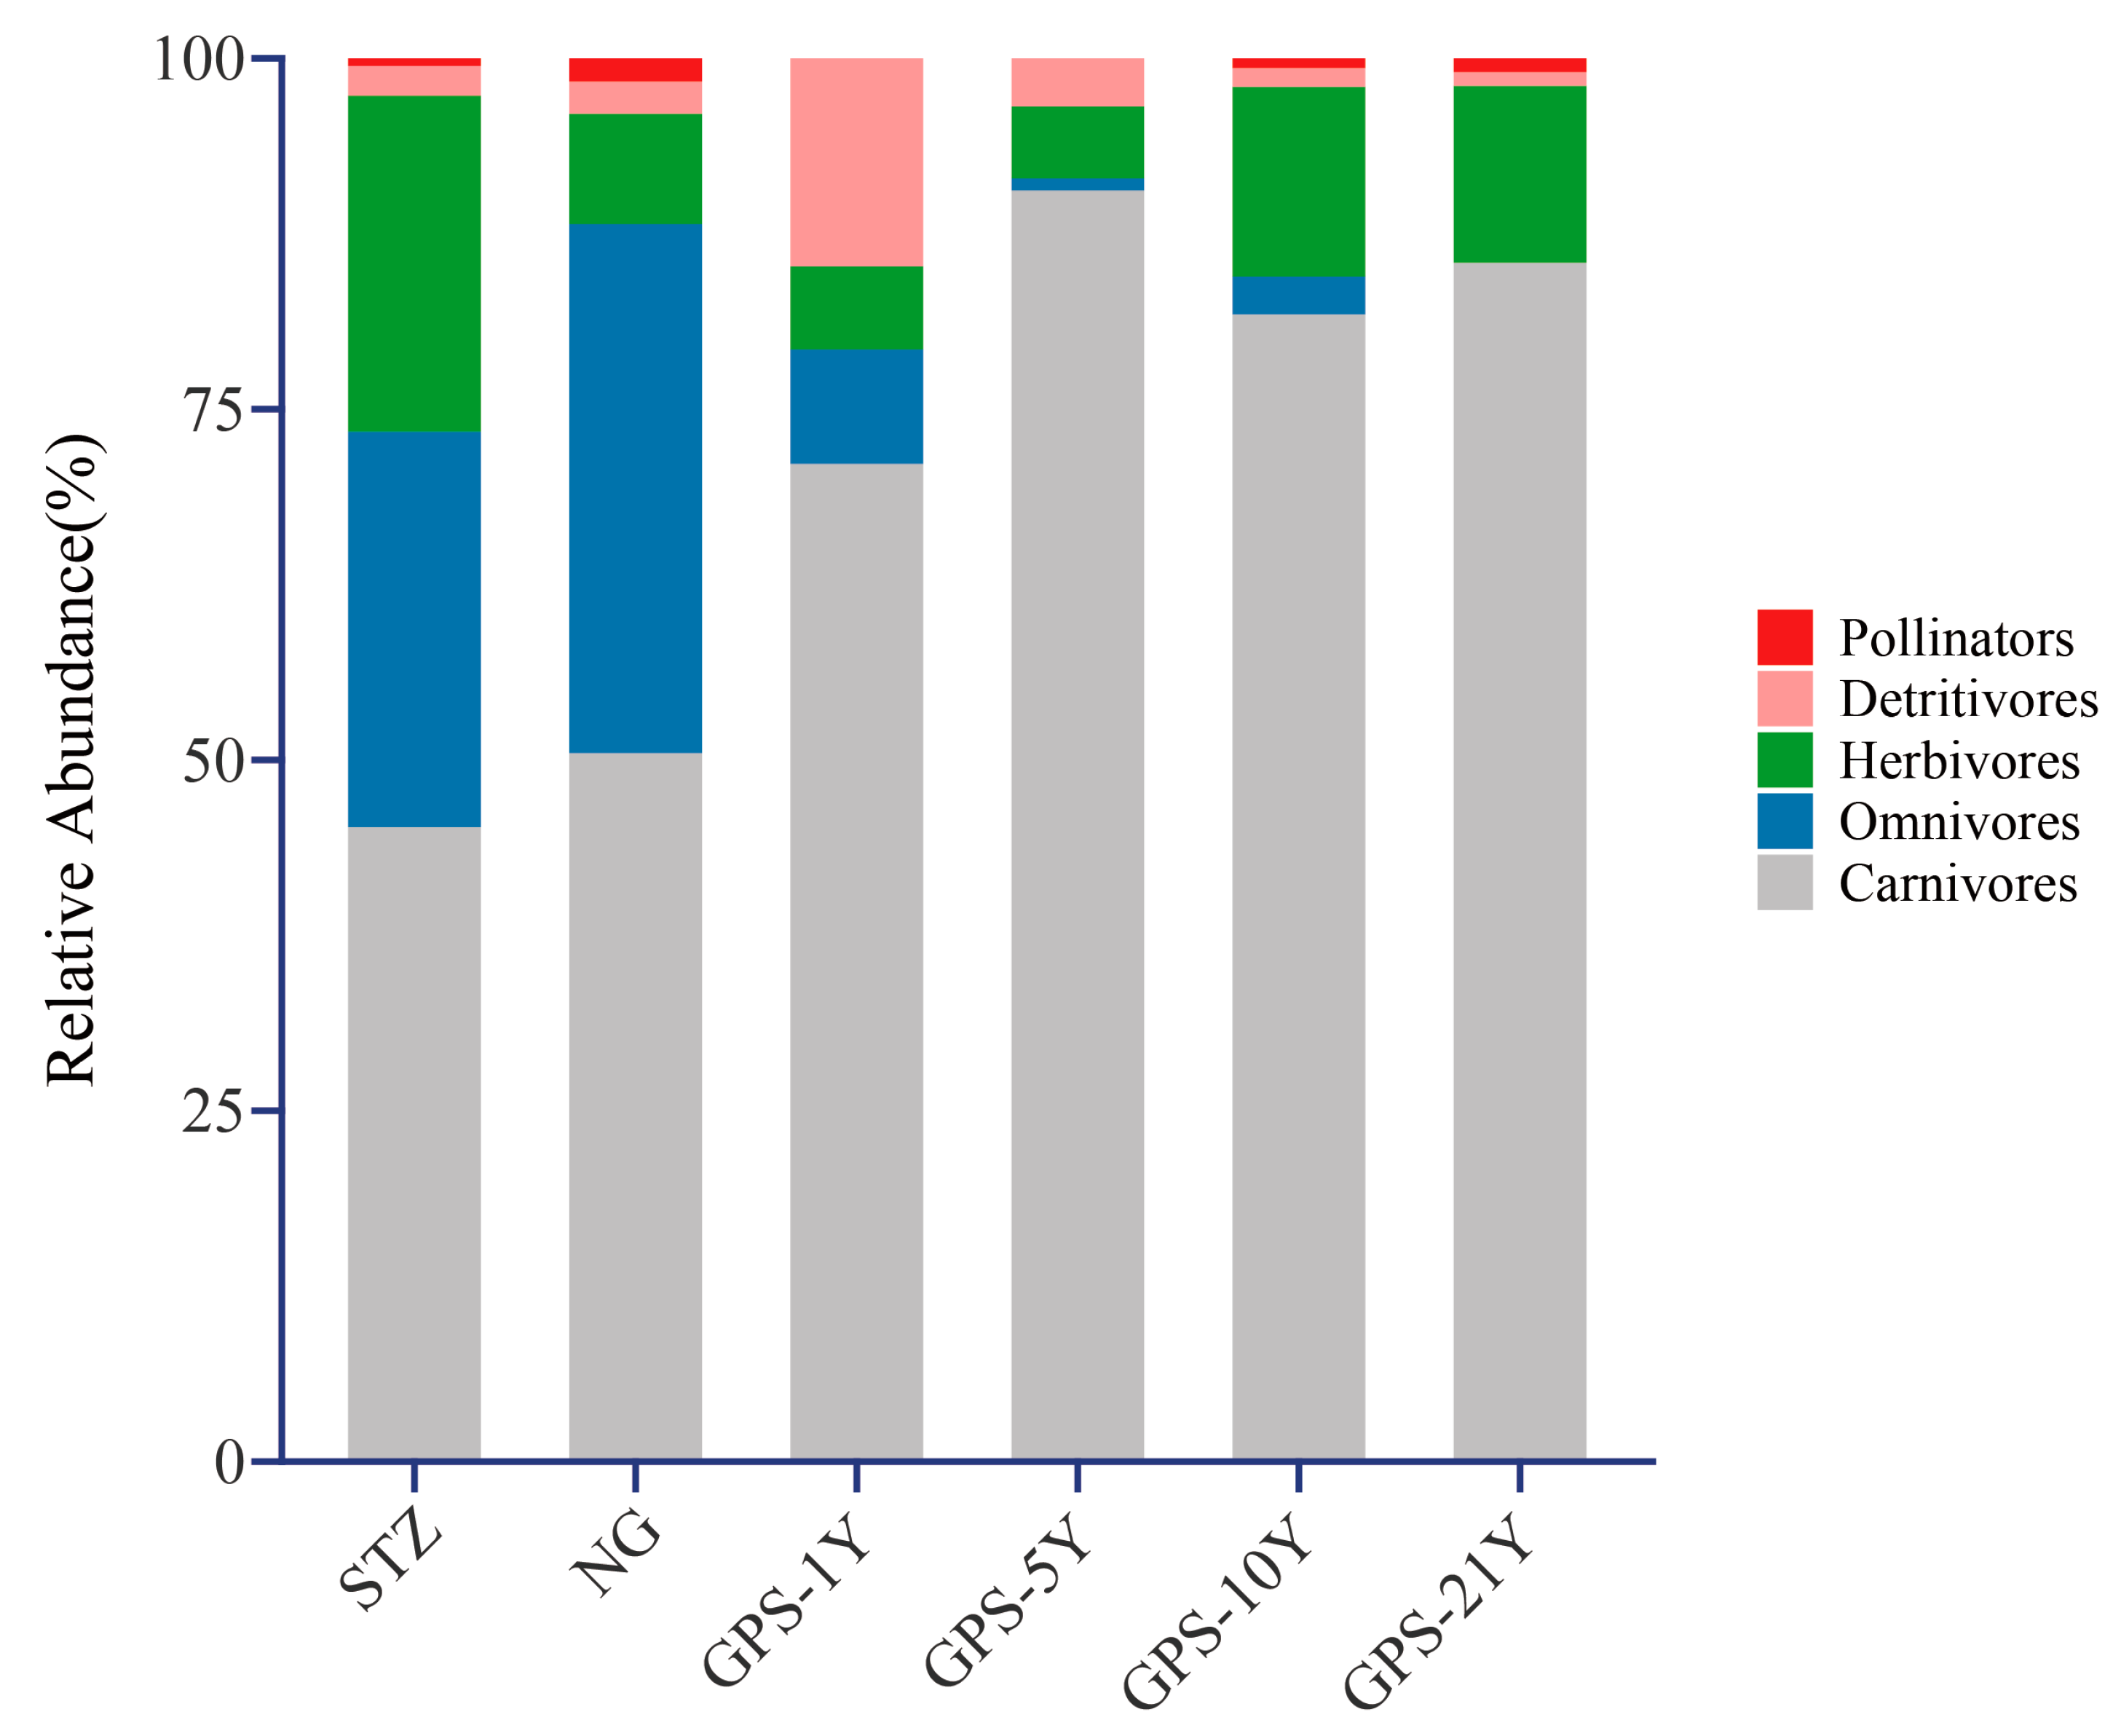
3.2. Changes in Arthropod Taxa Composition under Different Tillage Years
3.3. Effects of Different Tillage Years and Soil Physicochemical Properties on Species Diversity
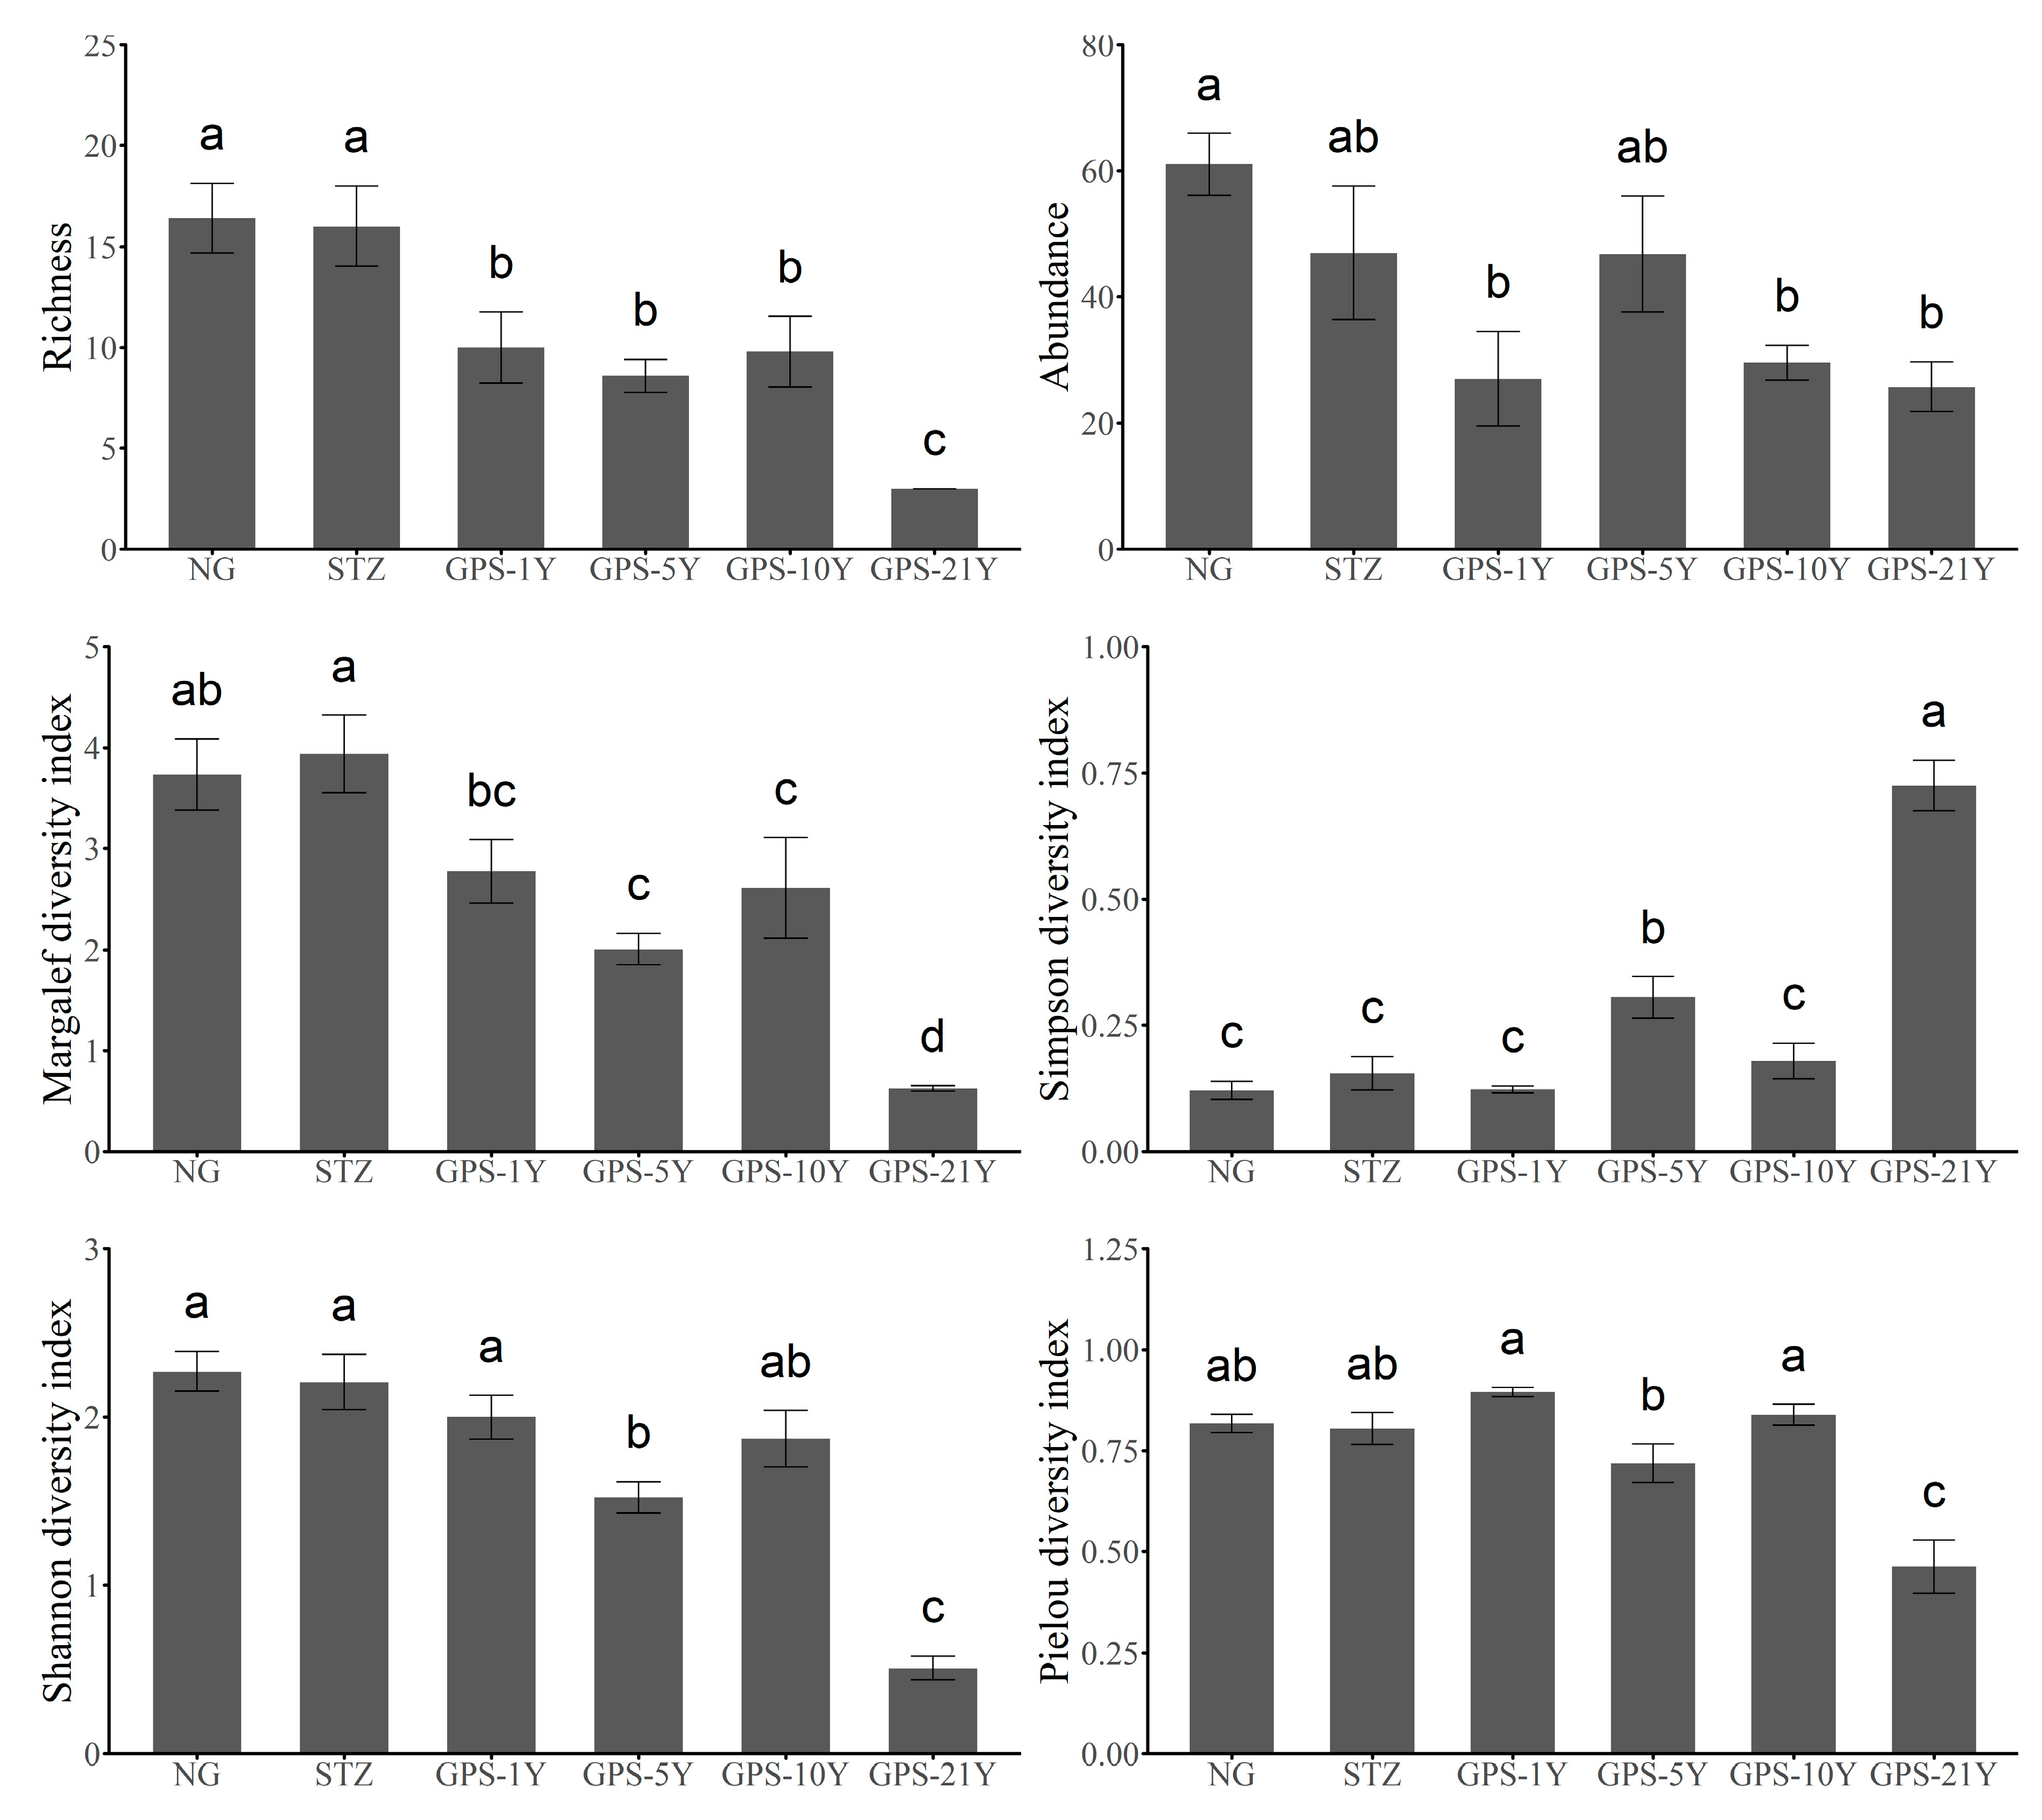
3.4. Changes in Arthropod Diversity
3.5. Similarity of Arthropod Composition and Soil Properties and Correlation between the Two
4. Discussion
5. Conclusions
Author Contributions
Funding
Data Availability Statement
Acknowledgments
Conflicts of Interest
Appendix A

| Taxa | Name | NG | STZ | GPS-1Y | GPS-5Y | GPS-10Y | GPS-21Y | Proportion (%) |
|---|---|---|---|---|---|---|---|---|
| Dominant taxa | ||||||||
| Carnivore | Labidura japonica | 1 | 4 | 0 | 116 | 3 | 88 | 19.29% |
| Carnivore | Cataglyphis aenes | 59 | 31 | 28 | 28 | 29 | 0 | 15.92% |
| Common taxa | ||||||||
| Carnivore | Spider 1 | 14 | 2 | 11 | 21 | 40 | 0 | 8.01% |
| Omnivore | Blaps Fabricius | 34 | 43 | 0 | 0 | 1 | 0 | 7.10% |
| Carnivore | Spider 7 | 4 | 2 | 14 | 14 | 10 | 0 | 2.73% |
| Carnivore | Pseudotaphoxenus brevipennis | 15 | 17 | 1 | 3 | 3 | 0 | 3.55% |
| Carnivore | India red feather Fantail | 1 | 2 | 12 | 7 | 15 | 0 | 3.37% |
| Omnivore | Trigonocnera pseudopimelia | 33 | 4 | 0 | 0 | 0 | 0 | 3.37% |
| Carnivore | scutiger coleoptrata | 14 | 2 | 5 | 10 | 2 | 0 | 3.00% |
| Carnivore | Buthus martensii | 23 | 5 | 3 | 0 | 1 | 0 | 2.91% |
| Herbivore | Ampedus nigrinus | 0 | 2 | 2 | 3 | 19 | 0 | 2.37% |
| Carnivore | Spider13 | 11 | 4 | 0 | 9 | 1 | 0 | 2.27% |
| Herbivore | Mantitheus pekinensis | 13 | 10 | 0 | 0 | 0 | 0 | 2.09% |
| Herbivore | Teleogryllus infernalis | 0 | 0 | 0 | 2 | 0 | 10 | 1.09% |
| Omnivore | Penthicus alashanicus | 18 | 0 | 1 | 0 | 0 | 0 | 1.73% |
| Herbivore | Nemobius caudatus | 0 | 0 | 0 | 5 | 0 | 2 | 0.64% |
| Detritivore | Termites | 0 | 0 | 13 | 4 | 0 | 0 | 1.55% |
| Rare taxa | ||||||||
| Herbivore | Glyptobothrus albonemus | 0 | 16 | 0 | 0 | 0 | 0 | 1.46% |
| Omnivore | Microdera kraatzi alashanica | 8 | 2 | 1 | 0 | 0 | 0 | 1.00% |
| Omnivore | Blaps opaca | 10 | 1 | 0 | 0 | 1 | 0 | 1.09% |
| Carnivore | Spider 15 | 0 | 0 | 5 | 0 | 6 | 0 | 1.00% |
| Carnivore | Harpalus sinicus | 1 | 7 | 1 | 0 | 1 | 0 | 0.91% |
| Omnivore | Tachinidae | 0 | 0 | 8 | 1 | 0 | 0 | 0.82% |
| Carnivore | Spider 2 | 2 | 0 | 0 | 1 | 2 | 0 | 0.45% |
| Detritivore | Lethrus potanini | 5 | 2 | 0 | 0 | 0 | 1 | 0.73% |
| Detritivore | Flax fly | 1 | 2 | 4 | 0 | 1 | 0 | 0.73% |
| Herbivore | Eodorcadion virgatum | 0 | 6 | 0 | 0 | 0 | 0 | 0.55% |
| Omnivore | Pterocoma reitteri | 5 | 1 | 0 | 0 | 0 | 0 | 0.55% |
| Carnivore | Adonia variegata | 0 | 0 | 4 | 1 | 0 | 0 | 0.45% |
| Carnivore | harlequin ladybird | 0 | 0 | 2 | 0 | 3 | 0 | 0.45% |
| Herbivore | Sphingonotus ningsianus | 4 | 1 | 0 | 0 | 0 | 0 | 0.45% |
| Carnivore | Pseudotaphoxenus mongolicus | 1 | 0 | 2 | 0 | 1 | 0 | 0.36% |
| Herbivore | Dorysthcnes paradoxus | 0 | 1 | 1 | 0 | 1 | 1 | 0.36% |
| Omnivore | Blaps variolosa | 3 | 1 | 0 | 0 | 0 | 0 | 0.36% |
| Pollinator | Bee 4 | 4 | 0 | 0 | 0 | 0 | 0 | 0.36% |
| Detritivore | lepismatidae | 0 | 0 | 0 | 4 | 0 | 0 | 0.36% |
| Carnivore | Pterostichus gebleri | 0 | 3 | 0 | 0 | 0 | 0 | 0.27% |
| Carnivore | Spider 8 | 1 | 2 | 0 | 0 | 0 | 0 | 0.27% |
| Carnivore | Epicauta sibirica | 0 | 2 | 0 | 1 | 0 | 0 | 0.27% |
| Carnivore | Spider 5 | 2 | 0 | 0 | 0 | 1 | 0 | 0.27% |
| Carnivore | Spider 6 | 1 | 0 | 0 | 0 | 2 | 0 | 0.27% |
| Carnivore | Camponotus | 0 | 0 | 3 | 0 | 0 | 0 | 0.27% |
| Carnivore | Spider 10 | 2 | 0 | 1 | 0 | 0 | 0 | 0.27% |
| Herbivore | Zichya piechockii | 3 | 0 | 0 | 0 | 0 | 0 | 0.27% |
| Detritivore | Porcellio | 0 | 0 | 3 | 0 | 0 | 0 | 0.27% |
| Herbivore | Crambus pinellus | 0 | 2 | 1 | 0 | 0 | 0 | 0.27% |
| Herbivore | Deracanthus potanini | 2 | 0 | 1 | 0 | 0 | 0 | 0.27% |
| Omnivore | ichneumon | 0 | 0 | 0 | 1 | 1 | 0 | 0.18% |
| Carnivore | Formica candida | 0 | 0 | 2 | 0 | 0 | 0 | 0.18% |
| Carnivore | Vespidae | 1 | 0 | 1 | 0 | 0 | 0 | 0.18% |
| Omnivore | Cyphogenia chinensis | 2 | 0 | 0 | 0 | 0 | 0 | 0.18% |
| Herbivore | Chromonotus bipunctatus | 1 | 1 | 0 | 0 | 0 | 0 | 0.18% |
| Herbivore | Chloebius aksuanus | 0 | 1 | 0 | 1 | 0 | 0 | 0.18% |
| Herbivore | Amrasca biguttula | 0 | 0 | 2 | 0 | 0 | 0 | 0.18% |
| Carnivore | Scolopendridae | 0 | 1 | 0 | 0 | 0 | 0 | 0.09% |
| Carnivore | Cophinopoda chinensis | 1 | 0 | 0 | 0 | 0 | 0 | 0.09% |
| Carnivore | Carabus brandti Faldermann | 0 | 0 | 1 | 0 | 0 | 0 | 0.09% |
| Carnivore | Cicindela elisae | 0 | 1 | 0 | 0 | 0 | 0 | 0.09% |
| Carnivore | Pheropsophus jessoensis | 0 | 0 | 0 | 1 | 0 | 0 | 0.09% |
| Carnivore | Sympetrum imitans | 0 | 0 | 0 | 0 | 1 | 0 | 0.09% |
| Herbivore | Conocephalidae | 0 | 0 | 1 | 0 | 0 | 0 | 0.09% |
| Herbivore | Angaracris rhodopa | 0 | 1 | 0 | 0 | 0 | 0 | 0.09% |
| Herbivore | Lygaeus murinus | 0 | 0 | 0 | 1 | 0 | 0 | 0.09% |
| Omnivore | Pterocoma vittata | 0 | 1 | 0 | 0 | 0 | 0 | 0.09% |
| Detritivore | Gymnopleurus mopsus | 1 | 0 | 0 | 0 | 0 | 0 | 0.09% |
| Omnivore | Anatolica nureti | 0 | 0 | 0 | 0 | 1 | 0 | 0.09% |
| Pollinator | Bee 1 | 0 | 0 | 0 | 0 | 1 | 0 | 0.09% |
| Detritivore | Nicrophorus concolor | 0 | 0 | 0 | 0 | 1 | 0 | 0.09% |
| Herbivore | Conorrhynchus conirostris | 0 | 1 | 0 | 0 | 0 | 0 | 0.09% |
| Pollinator | Bee 7 | 0 | 1 | 0 | 0 | 0 | 0 | 0.09% |
| Pollinator | Bombus richardsi | 0 | 0 | 0 | 0 | 0 | 1 | 0.09% |
| Omnivore | Sphecidae | 0 | 0 | 1 | 0 | 0 | 0 | 0.09% |
| Pollinator | Bee 5 | 1 | 0 | 0 | 0 | 0 | 0 | 0.09% |
| Omnivore | Sternoplax szechenyii | 1 | 0 | 0 | 0 | 0 | 0 | 0.09% |
| Herbivore | Loxostege verticalis | 1 | 0 | 0 | 0 | 0 | 0 | 0.09% |
| Omnivore | Prosodes kreitneri | 1 | 0 | 0 | 0 | 0 | 0 | 0.09% |
| Herbivore | Lixus divaricatus | 0 | 1 | 0 | 0 | 0 | 0 | 0.09% |
| Herbivore | Agrotis segetum | 0 | 1 | 0 | 0 | 0 | 0 | 0.09% |
| Herbivore | Bothynoderes Punctiventris | 0 | 1 | 0 | 0 | 0 | 0 | 0.09% |
| Total | 305 | 188 | 121 | 234 | 148 | 103 | 100% | |
References
- Flores-Gutierrez, A.M.; Mora, F.; Avila-Cabadilla, L.D.; Boege, K.; del-Val, E. Assessing the Cascading Effects of Management and Landscape on the Arthropod Guilds Occurring in Papaya Plantations. Agric. Ecosyst. Environ. 2020, 293, 106836. [Google Scholar] [CrossRef]
- Oerke, E.-C. Crop Losses to Pests. J. Agric. Sci. 2006, 144, 31–43. [Google Scholar] [CrossRef]
- Isaacs, R.; Tuell, J.; Fiedler, A.; Gardiner, M.; Landis, D. Maximizing Arthropod-Mediated Ecosystem Services in Agricultural Landscapes: The Role of Native Plants. Front. Ecol. Environ. 2009, 7, 196–203. [Google Scholar] [CrossRef]
- Zhang, W.; Ricketts, T.H.; Kremen, C.; Carney, K.; Swinton, S.M. Ecosystem Services and Dis-Services to Agriculture. Ecol. Econ. 2007, 64, 253–260. [Google Scholar] [CrossRef]
- Shi, X.; Ma, C.; Gustave, W.; Orr, M.; Sritongchuay, T.; Yuan, Z.; Wang, M.; Zhang, X.; Zhou, Q.; Huang, Y.; et al. Effects of Arsenic and Selenium Pollution on Wild Bee Communities in the Agricultural Landscapes. Sci. Total Environ. 2024, 907, 168052. [Google Scholar] [CrossRef] [PubMed]
- Pirk, C.W.W.; Crewe, R.M.; Moritz, R.F.A. Risks and Benefits of the Biological Interface between Managed and Wild Bee Pollinators. Funct. Ecol. 2017, 31, 47–55. [Google Scholar] [CrossRef]
- Liu, R.; Chen, D.; Luo, S.; Xu, S.; Xu, H.; Shi, X.; Zou, Y. Quantifying Pollination Efficiency of Flower-Visiting Insects and Its Application in Estimating Pollination Services for Common Buckwheat. Agric. Ecosyst. Environ. 2020, 301, 107011. [Google Scholar] [CrossRef]
- Menta, C.; Remelli, S. Soil Health and Arthropods: From Complex System to Worthwhile Investigation. Insects 2020, 11, 54. [Google Scholar] [CrossRef] [PubMed]
- Baloglu, M.C.; Ulu, F.; Altunoglu, Y.C.; Pekol, S.; Alagoz, G.; Ese, O. Identification, Molecular Characterization and Expression Analysis of RPL24 Genes in Three Cucurbitaceae Family Members: Cucumber, Melon and Watermelon. Biotechnol. Biotechnol. Equip. 2015, 29, 1024–1034. [Google Scholar] [CrossRef]
- Wijesinghe, S.A.E.C.; Evans, L.J.; Kirkland, L.; Rader, R. A Global Review of Watermelon Pollination Biology and Ecology: The Increasing Importance of Seedless Cultivars. Sci. Hortic. 2020, 271, 109493. [Google Scholar] [CrossRef]
- Fehér, T. 21—Watermelon: Citrullus lanatus (Thunb.) Matsum. & Nakai. In Genetic Improvement of Vegetable Crops; Kalloo, G., Bergh, B.O., Eds.; Pergamon: Amsterdam, The Netherlands, 1993; pp. 295–311. ISBN 978-0-08-040826-2. [Google Scholar]
- Adeoye, I.B.; Olajide-Taiwo, F.B.; Adebisi-Adelani, O.; Usman, J.M.; Badmus, M.A. Economic Analysis of Watermelon Based Production System in Oyo State Nigeria. J. Agric. Biol. Sci. 2011, 6, 53–59. [Google Scholar]
- Zhou, W.; Zhou, X.; Cai, L.; Jiang, Q.; Zhang, R. Temporal and Habitat Dynamics of Soil Fungal Diversity in Gravel-Sand Mulching Watermelon Fields in the Semi-Arid Loess Plateau of China. Microbiol. Spectr. 2023, 11, e03150-22. [Google Scholar] [CrossRef] [PubMed]
- Wang, Y.; Xie, Z.; Malhi, S.S.; Vera, C.L.; Zhang, Y.; Guo, Z. Effects of Gravel–Sand Mulch, Plastic Mulch and Ridge and Furrow Rainfall Harvesting System Combinations on Water Use Efficiency, Soil Temperature and Watermelon Yield in a Semi-Arid Loess Plateau of Northwestern China. Agric. Water Manag. 2011, 101, 88–92. [Google Scholar] [CrossRef]
- Hao, H.; Zhao, X.; Wang, Y.; Zhang, Y.; Xie, Z.; Guo, Z.; Wang, R. Effects of Gravel-Sand Mulching on Soil Bacterial Community and Metabolic Capability in the Semi-Arid Loess Plateau, China. World J. Microbiol. Biotechnol. 2017, 33, 209. [Google Scholar] [CrossRef] [PubMed]
- Qiu, Y.; Wang, Y.; Xie, Z. Long-Term Gravel–Sand Mulch Affects Soil Physicochemical Properties, Microbial Biomass and Enzyme Activities in the Semi-Arid Loess Plateau of North-Western China. Acta Agric. Scand. Sect. B—Soil Plant Sci. 2014, 64, 294–303. [Google Scholar] [CrossRef]
- Li, X.-Y. Effects of Gravel and Sand Mulches on Dew Deposition in the Semiarid Region of China. J. Hydrol. 2002, 260, 151–160. [Google Scholar] [CrossRef]
- Adams, J.E. Influence of Mulches on Runoff, Erosion, and Soil Moisture Depletion. Soil Sci. Soc. Am. J. 1966, 30, 110–114. [Google Scholar] [CrossRef]
- Lamb, J.; Chapman, J.E. Effect of Surface Stones on Erosion, Evaporation, Soil Temperature, and Soil Moisture. J. Am. Soc. Agron. 1943, 35, 567–578. [Google Scholar] [CrossRef]
- Nachtergaele, J.; Poesen, J.; van Wesemael, B. Gravel Mulching in Vineyards of Southern Switzerland. Soil Tillage Res. 1998, 46, 51–59. [Google Scholar] [CrossRef]
- Li, X.-Y.; Gong, J.-D.; Wei, X.-H. In-Situ Rainwater Harvesting and Gravel Mulch Combination for Corn Production in the Dry Semi-Arid Region of China. J. Arid Environ. 2000, 46, 371–382. [Google Scholar] [CrossRef]
- Wookey, P.A.; Aerts, R.; Bardgett, R.D.; Baptist, F.; Bråthen, K.A.; Cornelissen, J.H.C.; Gough, L.; Hartley, I.P.; Hopkins, D.W.; Lavorel, S.; et al. Ecosystem Feedbacks and Cascade Processes: Understanding Their Role in the Responses of Arctic and Alpine Ecosystems to Environmental Change. Glob. Chang. Biol. 2009, 15, 1153–1172. [Google Scholar] [CrossRef]
- Wardle, D.A.; Bardgett, R.D.; Klironomos, J.N.; Setälä, H.; Van Der Putten, W.H.; Wall, D.H. Ecological Linkages Between Aboveground and Belowground Biota. Science 2004, 304, 1629–1633. [Google Scholar] [CrossRef] [PubMed]
- Clark, C.M.; Tilman, D. Loss of Plant Species after Chronic Low-Level Nitrogen Deposition to Prairie Grasslands. Nature 2008, 451, 712–715. [Google Scholar] [CrossRef] [PubMed]
- Shen, H.; Dong, S.; DiTommaso, A.; Xiao, J.; Lu, W.; Zhi, Y. Nitrogen Deposition Shifts Grassland Communities through Directly Increasing Dominance of Graminoids: A 3-Year Case Study from the Qinghai-Tibetan Plateau. Front. Plant Sci. 2022, 13, 811970. [Google Scholar] [CrossRef] [PubMed]
- Song, M.-H.; Zheng, L.-L.; Yin, T.-F.; Zhang, X.-Z.; Yu, F.-H.; Cornelissen, J.H.C. Changes in Quantity Rather than Palatability of Alpine Meadow Species Induce Cascading Effects of Long-Term Nitrogen Fertilization on Phytophagous Insect Abundance. J. Veg. Sci. 2018, 29, 867–876. [Google Scholar] [CrossRef]
- Reihart, R.W.; Angelos, K.P.; Gawkins, K.M.; Hurst, S.E.; Montelongo, D.C.; Laws, A.N.; Pennings, S.C.; Prather, C.M. Crazy Ants Craving Calcium: Macronutrients and Micronutrients Can Limit and Stress an Invaded Grassland Brown Food Web. Ecology 2021, 102, e03263. [Google Scholar] [CrossRef] [PubMed]
- Joern, A.; Behmer, S.T. Impact of Diet Quality on Demographic Attributes in Adult Grasshoppers and the Nitrogen Limitation Hypothesis. Ecol. Entomol. 1998, 23, 174–184. [Google Scholar] [CrossRef]
- Wang, L.; Cui, H.; Chang, X.; Zhu, M.; Zhao, Z. Increased Nitrogen Fertilization Inhibits the Biocontrol Activity Promoted by the Intercropping Partner Plant. Insect Sci. 2021, 28, 1179–1190. [Google Scholar] [CrossRef] [PubMed]
- Fengrui, L.; Songling, Z.; Geballe, G.T. Water Use Patterns and Agronomic Performance for Some Cropping Systems with and without Fallow Crops in a Semi-Arid Environment of Northwest China. Agric. Ecosyst. Environ. 2000, 79, 129–142. [Google Scholar] [CrossRef]
- Stanturf, J.A. Chapter 5—Landscape Degradation and Restoration. In Soils and Landscape Restoration; Stanturf, J.A., Callaham, M.A., Eds.; Academic Press: Cambridge, MA, USA, 2021; pp. 125–159. ISBN 978-0-12-813193-0. [Google Scholar]
- Wei, S.; Huang, W.; Zhu, M.; Gao, L.; Wang, Y.; Zhang, R.; Li, Z.; Zhao, Z. The Asymmetric Responses of Carabid Beetles to Steppe Fragmentation in Northwest China. Glob. Ecol. Conserv. 2020, 23, e01058. [Google Scholar] [CrossRef]
- Wang, D.; Hao, H.; Liu, H.; Sun, L.; Li, Y. Spatial–Temporal Changes of Landscape and Habitat Quality in Typical Ecologically Fragile Areas of Western China over the Past 40 Years: A Case Study of the Ningxia Hui Autonomous Region. Ecol. Evol. 2024, 14, e10847. [Google Scholar] [CrossRef] [PubMed]
- Guan, Q.; Guan, W.; Yang, J.; Zhao, S.; Pan, B.; Wang, L.; Song, N.; Lu, M.; Li, F. Spatial and Temporal Changes in Desertification in the Southern Region of the Tengger Desert from 1973 to 2009. Theor. Appl. Clim. 2017, 129, 487–502. [Google Scholar] [CrossRef]
- Wang, T.; Ren, W.; Yang, F.; Niu, L.; Li, Z.; Zhang, M. Effects of Different Tillage and Residue Retention Measures on Silage Maize Yield and Quality and Soil Phosphorus in Karst Areas. Agronomy 2023, 13, 2306. [Google Scholar] [CrossRef]
- Wu, Y.; Yu, Y. Soil Carbon, Nitrogen and Phosphorus Fractions and Response to Microorganisms and Mineral Elements in Zanthoxylum Planispinum ‘Dintanensis’ Plantations at Different Altitudes. Agronomy 2023, 13, 558. [Google Scholar] [CrossRef]
- Hubbell, S.P. Commonness and Rarity in a Neotropical Forest: Implications for Tropical Tree Conservation. Conserv. Biol. Sci. Scarcity Divers. 1986, 205–231. [Google Scholar]
- Jorgensen, S.E.; Fath, B.D. Encyclopedia of Ecology; Elsevier B.V.: Amsterdam, The Netherlands, 2008; ISBN 978-0-444-52033-3. [Google Scholar]
- Heil, K.; Schmidhalter, U. Improved Evaluation of Field Experiments by Accounting for Inherent Soil Variability. Eur. J. Agron. 2017, 89, 1–15. [Google Scholar] [CrossRef]
- Fromont, C.; Riegler, M.; Cook, J.M. Relative Abundance and Strain Diversity in the Bacterial Endosymbiont Community of a Sap-Feeding Insect Across Its Native and Introduced Geographic Range. Microb. Ecol. 2017, 74, 722–734. [Google Scholar] [CrossRef] [PubMed]
- Oksanen, J.; Blanchet, F.G.; Friendly, M.; Kindt, R.; Legendre, P.; Mc Glinn, D.; Minchin, P.R.; O’Hara, R.B.; Simpson, G.L.; Solymos, P.; et al. Vegan: Community Ecology Package. R Packages Version 2.5–7. Available online: https://CRAN.R-project.org/package=vegan/ (accessed on 28 November 2020).
- Grunsky, E.C. R: A Data Analysis and Statistical Programming Environment–an Emerging Tool for the Geosciences. Comput. Geosci. 2002, 28, 1219–1222. [Google Scholar] [CrossRef]
- Rodríguez-Berbel, N.; Soria, R.; Villafuerte, A.B.; Ortega, R.; Miralles, I. Short-Term Dynamics of Bacterial Community Structure in Restored Abandoned Agricultural Soils under Semi-Arid Conditions. Agronomy 2023, 13, 86. [Google Scholar] [CrossRef]
- Belay, A.; Claassens, A.; Wehner, F. Effect of Direct Nitrogen and Potassium and Residual Phosphorus Fertilizers on Soil Chemical Properties, Microbial Components and Maize Yield under Long-Term Crop Rotation. Biol. Fertil. Soils 2002, 35, 420–427. [Google Scholar] [CrossRef]
- Riggs, C.E.; Hobbie, S.E. Mechanisms Driving the Soil Organic Matter Decomposition Response to Nitrogen Enrichment in Grassland Soils. Soil Biol. Biochem. 2016, 99, 54–65. [Google Scholar] [CrossRef]
- Colla, G.; Rouphael, Y.; Mirabelli, C.; Cardarelli, M. Nitrogen-use Efficiency Traits of Mini-watermelon in Response to Grafting and Nitrogen-fertilization Doses. Z. Pflanzenernähr. Bodenk. 2011, 174, 933–941. [Google Scholar] [CrossRef]
- Xu, S.; Li, P.; Sayer, E.J.; Zhang, B.; Wang, J.; Qiao, C.; Peng, Z.; Diao, L.; Chi, Y.; Liu, W.; et al. Initial Soil Organic Matter Content Influences the Storage and Turnover of Litter, Root and Soil Carbon in Grasslands. Ecosystems 2018, 21, 1377–1389. [Google Scholar] [CrossRef]
- Chen, B.; Yang, H.; Song, W.; Liu, C.; Xu, J.; Zhao, W.; Zhou, Z. Effect of N Fertilization Rate on Soil Alkali-Hydrolyzable N, Subtending Leaf N Concentration, Fiber Yield, and Quality of Cotton. Crop J. 2016, 4, 323–330. [Google Scholar] [CrossRef]
- Xu, C.; Chen, Y.; Zang, Q.; Li, Y.; Zhao, J.; Lu, X.; Jiang, M.; Zhuang, H.; Huang, L. The Effects of Cultivation Patterns and Nitrogen Levels on Fertility and Bacterial Community Characteristics of Surface and Subsurface Soil. Front. Microbiol. 2023, 14, 1072228. [Google Scholar] [CrossRef] [PubMed]
- Bai, Z.; Caspari, T.; Gonzalez, M.R.; Batjes, N.H.; Mäder, P.; Bünemann, E.K.; de Goede, R.; Brussaard, L.; Xu, M.; Ferreira, C.S.S.; et al. Effects of Agricultural Management Practices on Soil Quality: A Review of Long-Term Experiments for Europe and China. Agric. Ecosyst. Environ. 2018, 265, 1–7. [Google Scholar] [CrossRef]
- Kudrevatykh, I.Y.; Kalinin, P.I.; Mitenko, G.V. The Effect of Changes Vegetation Cover on the Chemical Properties of Steppe Soils during Climate Aridization. Plant Soil 2023, 491, 265–284. [Google Scholar] [CrossRef]
- Yan, F.; Zhang, F.; Fan, J.; Hou, X.; Bai, W.; Liu, X.; Wang, Y.; Pan, X. Optimization of Irrigation and Nitrogen Fertilization Increases Ash Salt Accumulation and Ions Absorption of Drip-Fertigated Sugar Beet in Saline-Alkali Soils. Field Crops Res. 2021, 271, 108247. [Google Scholar] [CrossRef]
- Chen, H.; Ren, A.; Hu, Z.; Jia, C.; Wang, J. Effects of Irrigation and Fertilization on Soil Salt Migration, Yield, and Water Use Efficiency of Winter Wheat in the Yellow River Delta. Crop Sci. 2022, 62, 1584–1602. [Google Scholar] [CrossRef]
- van Wesemael, B.; Chartin, C.; Wiesmeier, M.; von Lützow, M.; Hobley, E.; Carnol, M.; Krüger, I.; Campion, M.; Roisin, C.; Hennart, S.; et al. An Indicator for Organic Matter Dynamics in Temperate Agricultural Soils. Agric. Ecosyst. Environ. 2019, 274, 62–75. [Google Scholar] [CrossRef]
- Peñuelas, J.; Poulter, B.; Sardans, J.; Ciais, P.; van der Velde, M.; Bopp, L.; Boucher, O.; Godderis, Y.; Hinsinger, P.; Llusia, J.; et al. Human-Induced Nitrogen–Phosphorus Imbalances Alter Natural and Managed Ecosystems across the Globe. Nat. Commun. 2013, 4, 2934. [Google Scholar] [CrossRef] [PubMed]
- Simpson, M.; McLenaghen, R.D.; Chirino-Valle, I.; Condron, L.M. Effects of Long-Term Grassland Management on the Chemical Nature and Bioavailability of Soil Phosphorus. Biol. Fertil. Soils 2012, 48, 607–611. [Google Scholar] [CrossRef]
- Han, J.; Xie, J.; Zhang, Y. Potential Role of Feldspathic Sandstone as a Natural Water Retaining Agent in Mu Us Sandy Land, Northwest China. Chin. Geogr. Sci. 2012, 22, 550–555. [Google Scholar] [CrossRef]
- Morris, M.G. The Effects of Structure and Its Dynamics on the Ecology and Conservation of Arthropods in British Grasslands. Biol. Conserv. 2000, 95, 129–142. [Google Scholar] [CrossRef]
- Kaiser, W.; Avenant, N.L.; Haddad, C.R. Assessing the Ecological Integrity of a Grassland Ecosystem: The Applicability and Rapidity of the SAGraSS Method. Afr. J. Ecol. 2009, 47, 308–317. [Google Scholar] [CrossRef]
- Tsiafouli, M.A.; Thébault, E.; Sgardelis, S.P.; de Ruiter, P.C.; van der Putten, W.H.; Birkhofer, K.; Hemerik, L.; de Vries, F.T.; Bardgett, R.D.; Brady, M.V.; et al. Intensive Agriculture Reduces Soil Biodiversity across Europe. Glob. Chang. Biol. 2015, 21, 973–985. [Google Scholar] [CrossRef] [PubMed]
- Dornelas, M. Disturbance and Change in Biodiversity. Philos. Trans. R. Soc. B Biol. Sci. 2010, 365, 3719–3727. [Google Scholar] [CrossRef] [PubMed]
- Bardgett, R.D.; Wardle, D.A. Aboveground-Belowground Linkages: Biotic Interactions, Ecosystem Processes, and Global Change; Oxford University Press: Oxford, UK, 2010; ISBN 978-0-19-954687-9. [Google Scholar]
- Bengtsson, J. Disturbance and Resilience in Soil Animal Communities. Eur. J. Soil Biol. 2002, 38, 119–125. [Google Scholar] [CrossRef]
- Schneider, M.K.; Lüscher, G.; Jeanneret, P.; Arndorfer, M.; Ammari, Y.; Bailey, D.; Balázs, K.; Báldi, A.; Choisis, J.-P.; Dennis, P.; et al. Gains to Species Diversity in Organically Farmed Fields Are Not Propagated at the Farm Level. Nat. Commun. 2014, 5, 4151. [Google Scholar] [CrossRef] [PubMed]
- Potts, S.G.; Biesmeijer, J.C.; Kremen, C.; Neumann, P.; Schweiger, O.; Kunin, W.E. Global Pollinator Declines: Trends, Impacts and Drivers. Trends Ecol. Evol. 2010, 25, 345–353. [Google Scholar] [CrossRef] [PubMed]
- Sapkota, T.B.; Mazzoncini, M.; Bàrberi, P.; Antichi, D.; Silvestri, N. Fifteen Years of No till Increase Soil Organic Matter, Microbial Biomass and Arthropod Diversity in Cover Crop-Based Arable Cropping Systems. Agron. Sustain. Dev. 2012, 32, 853–863. [Google Scholar] [CrossRef]
- Gkisakis, V.; Volakakis, N.; Kollaros, D.; Bàrberi, P.; Kabourakis, E.M. Soil Arthropod Community in the Olive Agroecosystem: Determined by Environment and Farming Practices in Different Management Systems and Agroecological Zones. Agric. Ecosyst. Environ. 2016, 218, 178–189. [Google Scholar] [CrossRef]
- Uchida, K.; Takahashi, S.; Shinohara, T.; Ushimaru, A. Threatened Herbivorous Insects Maintained by Long-Term Traditional Management Practices in Semi-Natural Grasslands. Agric. Ecosyst. Environ. 2016, 221, 156–162. [Google Scholar] [CrossRef]
- Parker, M.; Mac Nally, R. Habitat Loss and the Habitat Fragmentation Threshold: An Experimental Evaluation of Impacts on Richness and Total Abundances Using Grassland Invertebrates. Biol. Conserv. 2002, 105, 217–229. [Google Scholar] [CrossRef]
- Cloudsley-Thompson, J. Thermal and Water Relations of Desert Beetles. Naturwissenschaften 2001, 88, 447–460. [Google Scholar] [CrossRef]
- Rivnay, E. The Influence of Man on Insect Ecology in Arid Zones. Annu. Rev. Entomol. 1964, 9, 41–62. [Google Scholar] [CrossRef]
- Collinge, S.K. Effects of Grassland Fragmentation on Insect Species Loss, Colonization, and Movement Patterns. Ecology 2000, 81, 2211–2226. [Google Scholar] [CrossRef]
- Moebius-Clune, B.N.; van Es, H.M.; Idowu, O.J.; Schindelbeck, R.R.; Kimetu, J.M.; Ngoze, S.; Lehmann, J.; Kinyangi, J.M. Long-Term Soil Quality Degradation along a Cultivation Chronosequence in Western Kenya. Agric. Ecosyst. Environ. 2011, 141, 86–99. [Google Scholar] [CrossRef]
- Cui, X.; Wang, J.; Zhang, L.; Chen, T.; Zhuge, Y.; Dong, Y. Soil Nutrient Retention and Yield Effect of Nitrogen, Phosphorus Synergists on Wheat/Maize Rotation in Brown Soil. Agronomy 2022, 12, 2445. [Google Scholar] [CrossRef]
- Zheng, X.; Wei, L.; Lv, W.; Zhang, H.; Zhang, Y.; Zhang, H.; Zhang, H.; Zhu, Z.; Ge, T.; Zhang, W. Long-Term Bioorganic and Organic Fertilization Improved Soil Quality and Multifunctionality under Continuous Cropping in Watermelon. Agric. Ecosyst. Environ. 2024, 359, 108721. [Google Scholar] [CrossRef]
- Weyers, S.L.; Archer, D.W.; Johnson, J.M.F.; Wilts, A.R. Management Drives Differences in Nutrient Dynamics in Conventional and Organic Four-Year Crop Rotation Systems. Agronomy 2020, 10, 764. [Google Scholar] [CrossRef]
- Tilman, D. Niche Tradeoffs, Neutrality, and Community Structure: A Stochastic Theory of Resource Competition, Invasion, and Community Assembly. Proc. Natl. Acad. Sci. USA 2004, 101, 10854–10861. [Google Scholar] [CrossRef] [PubMed]
- Hassell, M.P.; Tilman, D. Resource Competition and Community Structure. J. Anim. Ecol. 1984, 53, 697. [Google Scholar] [CrossRef]
- de Vries, F.T.; Hoffland, E.; van Eekeren, N.; Brussaard, L.; Bloem, J. Fungal/Bacterial Ratios in Grasslands with Contrasting Nitrogen Management. Soil Biol. Biochem. 2006, 38, 2092–2103. [Google Scholar] [CrossRef]


| Indicators | Abbreviation | Units | Methods | Instrument Model |
|---|---|---|---|---|
| Total nitrogen | TN | mg/kg | K2SO4, CuSO4, Se boiling + automatic interrupted chemical analyzer | SMARTCHEN 450 Chemistry analyzers, KPM Analysis Group, Rome, Italy |
| Total phosphorus | TP | mg/kg | Ammonium phosphomolybdate + automatic chemical analyzer colorimetry | Agilent ICP-OES 5110, Agilent Technologies, Inc., Kuala Lumpur, Malaysia |
| Total potassium | TK | mg/kg | Hydrofluoric acid cooking-ICP-0ES detection | Agilent ICP-OES 5110, Agilent Technologies, Inc., Kuala Lumpur, Malaysia |
| Alkali hydrolyzable nitrogen | AHN | mg/kg | Alkaline diffusion method | —— |
| Available phosphorus | APK | mg/kg | Sodium bicarbonate extraction + automatic interrupted chemical analyzer | SMARTCHEN 450 Chemistry analyzers, KPM Analysis Group, Rome, Italy |
| Available potassium | APP | mg/kg | Ammonium acetate extraction-ICP-0ES detection | Agilent ICP-OES 5110, Agilent Technologies, Inc., Kuala Lumpur, Malaysia |
| Organic matter | OM | g/kg | TOC analyzer, Elimonta | Elimonta VARIO TOC, Elementar trading Co., Ltd, Frankfurt, Germany |
| Conductivity of the leaching solution | EC | us/cm | Conductivity meter | DDS-307A, Shanghai Yi Electrical Scientific Instruments Co., LTD, Shanghai, China |
| pH | PH | pH meter | PHS-2F, Shanghai Yi Electrical Scientific Instruments Co., LTD, Shanghai, China | |
| Water content | W | % | Gravimetric method | DHG-9075A, Shanghai Yiheng Scientific Instrument Co., LTD, Shanghai, China |
| Abundance | |||||
|---|---|---|---|---|---|
| Pollinator | Detritivore | Herbivore | Omnivore | Carnivore | |
| STZ | 0.60 ± 0.40 a | 1.00 ± 0.77 b | 9.80 ± 4.33 a | 10.40 ± 5.45 b | 17.20 ± 5.44 c |
| NG | 1.00 ± 0.77 a | 1.00 ± 0.77 b | 5.00 ± 1.14 ab | 23.20 ± 5.36 a | 30.80 ± 3.02 bc |
| GPS-1Y | 0.00 ± 0.00 a | 1.60 ± 0.98 ab | 2.40 ± 1.44 b | 0.40 ± 0.40 b | 42.40 ± 8.38 b |
| GPS-5Y | 0.00 ± 0.00 a | 4.00 ± 1.34 a | 1.60 ± 0.68 b | 2.20 ± 0.66 b | 19.20 ± 7.12 c |
| GPS-10Y | 0.20 ± 0.20 a | 0.40 ± 0.24 b | 4.00 ± 2.55 ab | 0.80 ± 0.37 b | 24.20 ± 2.71 c |
| GPS-21Y | 0.00 ± 0.00 a | 0.60 ± 0.60 b | 3.60 ± 1.21 ab | 0.60 ± 0.40 b | 60.00 ± 5.21 a |
| Tillage Year | ||||
|---|---|---|---|---|
| Sum Sq | df | F | p | |
| Arthropod richness | 475.1 | 1 | 96.805 | 1.15 × 10⁻⁸ *** |
| Arthropod abundance | 1962 | 1 | 8.739 | 8.45× 10⁻³ ** |
| Arthropod Margalef | 29.488 | 1 | 129.462 | 1.18 × 10⁻⁹ *** |
| Arthropod Simpson | 1.128 | 1 | 246.438 | 6.01 × 10⁻¹² *** |
| Arthropod Shannon | 9.228 | 1 | 209.911 | 2.3 × 10⁻¹¹ *** |
| Arthropod Pielou | 0.4283 | 1 | 68.27 | 1.54 × 10⁻⁷ *** |
Disclaimer/Publisher’s Note: The statements, opinions and data contained in all publications are solely those of the individual author(s) and contributor(s) and not of MDPI and/or the editor(s). MDPI and/or the editor(s) disclaim responsibility for any injury to people or property resulting from any ideas, methods, instructions or products referred to in the content. |
© 2024 by the authors. Licensee MDPI, Basel, Switzerland. This article is an open access article distributed under the terms and conditions of the Creative Commons Attribution (CC BY) license (https://creativecommons.org/licenses/by/4.0/).
Share and Cite
Zhang, H.; Cao, Z.; Cui, Y.; Xiong, C.; Sun, W.; Wang, Y.; Ban, L.; Zhang, R.; Wei, S. Effects of Different Tillage Years on Soil Composition and Ground-Dwelling Arthropod Diversity in Gravel-Sand Mulching Watermelon Fields. Agronomy 2024, 14, 1841. https://doi.org/10.3390/agronomy14081841
Zhang H, Cao Z, Cui Y, Xiong C, Sun W, Wang Y, Ban L, Zhang R, Wei S. Effects of Different Tillage Years on Soil Composition and Ground-Dwelling Arthropod Diversity in Gravel-Sand Mulching Watermelon Fields. Agronomy. 2024; 14(8):1841. https://doi.org/10.3390/agronomy14081841
Chicago/Turabian StyleZhang, Haixiang, Ziyu Cao, Yifan Cui, Changyu Xiong, Wei Sun, Ying Wang, Liping Ban, Rong Zhang, and Shuhua Wei. 2024. "Effects of Different Tillage Years on Soil Composition and Ground-Dwelling Arthropod Diversity in Gravel-Sand Mulching Watermelon Fields" Agronomy 14, no. 8: 1841. https://doi.org/10.3390/agronomy14081841
APA StyleZhang, H., Cao, Z., Cui, Y., Xiong, C., Sun, W., Wang, Y., Ban, L., Zhang, R., & Wei, S. (2024). Effects of Different Tillage Years on Soil Composition and Ground-Dwelling Arthropod Diversity in Gravel-Sand Mulching Watermelon Fields. Agronomy, 14(8), 1841. https://doi.org/10.3390/agronomy14081841