Abstract
With growing concerns about global warming, it is crucial to adopt agronomic practices that enhance rice yields from paddy fields while reducing greenhouse gas (GHG) emissions for sustainable agriculture. An optimal nitrogen (N) fertilization rate and planting density are vital to ensure high rice yields, minimize GHG emissions, and understand emission behavior for better field management. We hypothesized that optimizing N application rates and planting density to improve nitrogen use efficiency (NUE) in rice cultivation would reduce resource losses and GHG emissions. To test this hypothesis, we implemented five treatments with a rice straw return cultural system: two planting densities (16 hills m−2 (traditional density, D1) and 20 hills m−2 (25% higher density, D2)) and three N application rates (no N fertilizer (N0), 180 kg N ha−1 (N1), and 144 kg N ha−1 (N2)). The control treatment (CK) was traditional planting density with no N fertilizer. The four new cropping modes were N1D1, N1D2, N2D1, and N2D2. We investigated the effects of N application rates and planting density on rice grain yield, NUE, and GHG emissions in multiple rice-growing seasons. The N1D2 treatment exhibited the highest grain yield over the three years, with a value of 10,452 kg ha−1, representing an increase of 12.2% compared to CK. Moreover, N uptake in N1D2 was the highest, averaging 39.2% (p < 0.05) higher than CK, and 8.5%, 3.5%, and 2.8% (p < 0.05) higher than N1D1, N2D1 and N2D2, respectively. N2D2 exhibited the highest NUE, with a value of 58.99 kg kg−1, surpassing all other treatments over the three years. GHG emissions, global warming potential (GWP), and greenhouse gas intensity (GHGI) in N2D2 were lower than in N1D1, N1D2, and N2D1. Additionally, reducing N application (comparing N1D1 to N2D1) and increasing plant density (comparing N1D1 to N1D2) improved N agronomic efficiency (NAE) and N partial productivity (PFPN). The negative correlation between the NAE and PFPN with GWP and GHG emissions further supports the potential for optimized N management and denser planting density to reduce environmental impact. These findings have important implications for sustainable rice cultivation practices in Southwest China and similar agroecosystems, emphasizing the need for integrated nutrient management strategies to achieve food security and climate change mitigation goals.
1. Introduction
The global population is projected to grow by more than 20%, reaching 9.1 billion by 2050, necessitating a substantial reduction in greenhouse gas (GHG) emissions to avert severe climate change consequences [1,2]. The production and overuse of nitrogen (N) resources lead to environmental challenges such as eutrophication, soil acidification, increased energy consumption, and elevated GHG emissions [3,4]. Agriculture, heavily dependent on manure and synthetic N fertilizers, significantly contributes to GHG emissions, including nitrous oxide (N2O), methane (CH4), and carbon dioxide (CO2), which are major drivers of global warming. It was reported that agriculture is responsible for approximately 52% and 84% of global CH4 and N2O emissions, respectively [5]. Emissions from paddy fields account for about 20% of CH4 emissions and 10% of N2O emissions, and they have significant mitigation potential [6]. To meet the projected 70% increase in food production required by 2050, intensive agricultural practices are essential despite their potential to exacerbate global warming [7]. Reducing GHG emissions from agriculture production is crucial for achieving the 1.5 °C global warming target, ensuring food security, and minimizing climate change risk [8].
Rice, the staple food for nearly 50% of the world’s population, is primarily grown in Asia. China alone accounts for 20% of the global rice planting area and 23% of its cultivated land [9]. N fertilizers are extensively used, with application rates exceeding 180 kg N ha−1 in China, significantly higher than the Asian average of 128.1 kg N ha−1 [10]. However, excessive fertilization reduces nitrogen use efficiency (NUE) and increases nitrogen losses, leading to higher GHG emissions and environmental pollution [11,12]. Paddy fields, with their alternating aerobic and anaerobic conditions due to periodic flooding, are significant sources of CH4 and N2O emissions [13,14]. N2O emissions are generated through the activities of ammonia-oxidizing bacteria and archaea via nitrification and denitrification processes within the soil [15,16]. This microbial activity, influenced by the unique soil conditions of paddy fields, complicates the management of GHG emissions in rice cultivation.
Improved N management practices have enhanced NUE in intensive rice cropping systems. For instance, Ju et al. [17] found that reducing N application by 30% during the early vegetative stage increased NUE without significantly lowering rice yield compared to traditional practices in China. Similarly, Bhatia et al. [18] also noted that a 12.5% reduction in N during this stage could increase rice yield. Increasing planting density can boost panicle numbers and rice yield, especially with mechanical rice transplanting, which is becoming prevalent [19]. Previous research has shown that CH4 emissions are influenced by rice cultivars and planting densities [20,21]. A moderate reduction in N application rate, combined with denser planting, may enhance rice yield and NUE. However, the effects of dense planting and reduced N application on rice yield, NUE, and greenhouse gas emissions have yet to be well documented.
We hypothesized that while intensive nitrogen management practices may contribute to yield gains, they could also exacerbate environmental issues, particularly by increasing GHG emissions. Additionally, we hypothesized that optimizing N application rates and planting density to enhance resource use efficiency in rice cultivation could mitigate resource losses and reduce GHG emissions in the region. To test these hypotheses, we measured rice grain yield, resource use efficiency, and GHG emissions in a rice and rapeseed rotation system, evaluating their relationships under varying levels of reduced N application rates and increased planting density. The findings of this study aim to identify effective N management strategies and optimal planting density that achieve sustainable rice yields and high resource use efficiency while minimizing GHG emissions in Southwest China.
2. Materials and Methods
2.1. Site Description and Soil Properties
Field experiments were conducted in 2017, 2018, and 2019 at the Sichuan Agricultural Research Institute Modern Experimental Station in Guanghan City (30°97′71″ N, 104°28′25″ E), Sichuan Province. At the onset of the experiment, soil physical and chemical attributes were assessed by examining four intervals within a 40 cm topsoil layer (0–10 cm, 10–20 cm, 20–30 cm, and 30–40 cm) (see Supplemental Table S1 for details). In summary, the upper 40 cm of the fluvo-aquic soil with loamy clay exhibited an average pH of 6.35 (1:1.25 g/v). Additionally, they contained 20.2 g kg−1 of soil organic matter, 1.28 g kg−1 of total nitrogen (N), 111.3 mg kg−1 of alkali-hydrolyzable N, 8.48 mg kg−1 of available phosphorus (Olsen-P), and 62 mg kg−1 of available potassium (K). Soil organic matter was determined using the Walkley–black method [22], the total N content with the Kjeldahl method [23], available phosphorous with the Olsen method [24], and available potassium with the Dirks–Sheffer method [25]. Air temperature and precipitation data during crop-growing seasons were obtained from the local meteorological station and are presented in Figure 1.
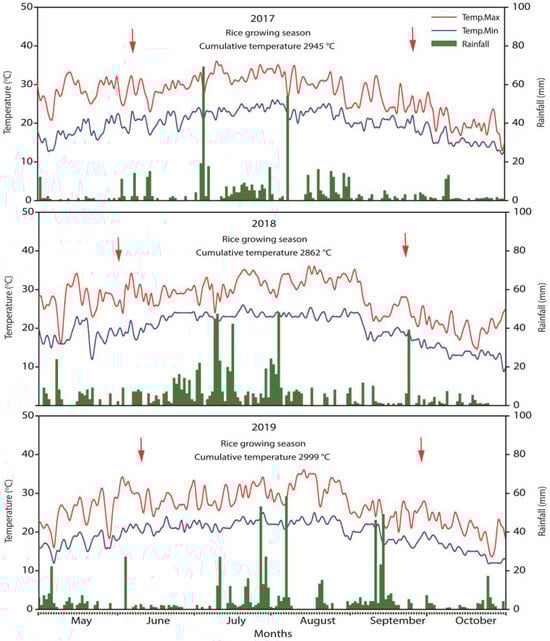
Figure 1.
Daily minimum (min.) and maximum (max.) temperature, and rainfall at the experimental site in 2017, 2018, and 2019. The arrows represent rice was transplanted on 6 June in 2017, 1 June in 2018, and 8 June in 2019, and harvested on 25 September, 23 September, and 28 September in 2017–2019, respectively.
2.2. Experimental Design and Treatment Management
The paddy field was divided into three blocks, each containing five plots (measuring 8 m × 6 m). The five treatments were arranged with each block using a randomized complete block design. The rice (Oryza sativa L.) cultivar, Chuanyou 6203, predominant in Sichuan Province, was planted at two densities, namely 16 hills m−2 (traditional planting density, D1) and 20 hills m−2 (25% higher planting density, D2), with respective spacing of 0.2 m × 0.3 m and 0.16 m × 0.3 m. The three N application rates were as follows: no N fertilizer (control, CK), 180 kg N ha−1 (N1), and 144 kg N ha−1 (N2). The N1 treatment was administered in three stages: 90 kg N ha−1 one day before sowing (as basal fertilizer), followed by 36 kg N ha−1 and 54 kg N ha−1 at the tillering and panicle initiation stages, respectively. The N2 treatment consisted of 72 kg N ha−1 one day before sowing (basal fertilizer), followed by 28.8 kg N ha−1 and 43.2 kg N ha−1 at tillering and panicle initiation stages. Taking the traditional planting density and no N fertilizer application as the control treatment (CK), the four other cropping modes were designated as N1D1, N1D2, N2D1, and N2D2, respectively. Overall, the experiment comprised five different treatments. Additionally, all plots received 75 kg P2O5 ha−1 in the form of calcium superphosphate (12% P2O5) and 75 kg K2O ha−1 in the form of potassium chloride (60% K2O) during the rice season. Rice seedlings were transplanted in the middle of June, and the plants were harvested in late September from 2017 to 2019. Irrigation, mid-season drainage and pre-harvest drainage, pesticide application, weeding, and other operations followed local agricultural practices.
In the rice and rapeseed rotation system, after harvesting both crops, the straw was crushed and incorporated into the soil. During the rice planting season, following rapeseed harvest, all straw was chopped into 8–10 cm pieces and then incorporated into the soil through plowing (to a depth of 15–20 cm), puddling, and mechanical transplanting of rice seedlings. Similarly, during the rapeseed planting season, after the rice harvest, all straw was chopped into 8–10 cm pieces and integrated into the soil through rotary tilling (to a depth of 10–15 cm), furrowing, and direct sowing of rapeseed. For straw return, 6000 kg ha−2 of both rice and rapeseed straw was incorporated back into the soil each June and November.
2.3. Plant Sampling and Analysis
At maturity, ten hills from each subplot were harvested to calculate the mean effective panicle number per hill. Three representative hills were separately sampled to determine yield components. Grain yield was determined by harvesting an area of 5 m2 in the center of each subplot (excluding edge plants) and adjusted to a standard moisture content of 14%.
Three representative hills of plants were separately sampled and separated into stalk and grain. The samples were oven-dried at 70 °C to constant weight; they were then weighed to record dry matter accumulation (DMA, kg ha−1) and milled into a powder for the analysis of total N concentration. Dry samples (0.2 g) were taken for digestion, and the N concentration was calculated using the Kjeldahl method. Nitrogen uptake was calculated by multiplying the nitrogen concentration in the straw and grain by the dry matter accumulation. In addition, the N harvest index (NHI, kg kg−1), N use efficiency (NUE, kg kg−1), N agronomic efficiency (NAE, kg kg−1), and N partial productivity (PFPN, kg kg−1) were calculated using the methods of [26].
2.4. Soil Sampling and Analysis
For the assessment of soil physical and chemical properties, four soil samples (0–40 cm depth) were collected at 10 cm intervals for each treatment near the gas chambers using a steel corer (3 cm diameter) after the rice harvest in 2019. Each sample was a composite of three subsamples taken within the treatment plot and treated as a single replicate. Soil samples were sieved through a mesh (3.0 mm). Soil organic matter, total nitrogen content, available phosphorus, and available potassium were determined using the above-described methods.
2.5. Greenhouse Gas Sampling and Measurements
Gas sampling involved a specially made static transparent chamber method, as outlined by Zou et al. [27]. Within each experimental plot, a plastic frame containing six hills of rice plants, covering an area of 0.25 m2, was permanently embedded into the soil. Chambers, measuring 0.5 m × 0.5 m at the base and with a height of either 0.5 or 1.0 m (adjusted according to plant height), were temporarily affixed to the frame during sampling. To maintain consistent temperatures within the chambers during sampling, they were covered with sponge and retro-reflective sheets and equipped with fans to ensure adequate air mixing. Additionally, wooden boardwalks were positioned in the rice fields to prevent soil disturbance. Gas sampling occurred at four intervals within a 30 min period (0, 10, 20, and 30 min) using a polypropylene syringe (50 mL) fitted with a nylon stopcock between 8:30 and 11:00 am. The chamber air temperature was continuously monitored during gas collection and adjusted for flux calculations. Flux measurements were typically conducted every 10–15 days throughout the two growing seasons (2018 and 2019), excluding periods of drainage close to harvest. The concentrations of greenhouse gases were analyzed using an LGR N2O Analyzer (model 908–0015–0000, Los Gatos Research, San Jose, CA, USA) and an LGR CH4/CO2 Analyzer (model 908–0011–0001, Los Gatos Research, San Jose, CA, USA). CH4, N2O, and CO2 fluxes were determined by calculating the linear regression slope between concentration and time.
where F is the measured gas of N2O (µg m−2 h−1), CH4 (mg m−2 h−1), and CO2 (mg m−2 h−1); H is the height of the chamber (cm); M is the relative molecular mass of N2O (44 g mol−1); CH4 (16 g mol−1) or CO2 (44 g mol−1); P is the atmospheric pressure (1.013 × 10⁵ Pa); R is the molar gas constant (8.315 J K−1 mol−1); T is the air temperature in chamber (°C); 273 is the conversion coefficient between Celsius degree and Kelvin temperature; and dc/dt is the linear regression slope of gas concentration at the time approaching zero.
The seasonal total N2O, CH4, and CO2 emissions were estimated following the equation [28]:
where S represents the seasonal total emissions of N2O (kg N2O ha−1), CH4 (kg CH4 ha−1), or CO2 (kg CO2 ha−1); F is the daily flux values of gas emissions (N2O, CH4, and CO2); is the measurement; indicates the number of days between two adjacent measurements; n denotes the total number of measurements; and 24 is the number of hours in each day.
Global warming potential (GWP) is an indicator used to assess the potential effects of greenhouse gases (GHGs) on global warming. The GWP (kg CO2-eq ha−1) was calculated based on default GWP values per unit mass of N2O (265 times) and CH4 (28 times), measured over a 100-year timeframe compared to that of CO2 emissions [29] as follows:
where YN2O is the seasonal total N2O emissions (kg ha−1), and YCH4 is the seasonal total CH4 emissions (kg ha−1).
The greenhouse gas intensity (GHGI) is a comprehensive indicator of both environmental and economic benefits, representing the balance of GHG per unit of crop productivity (rice grain yield). The GHGI (kg CO2-eq t−1) was calculated using the following equation:
where GWP is the global warming potential, and rice grain yield is the seasonal cumulative rice grain yield (kg ha−1).
2.6. Statistical Analysis
We performed all statistical analyses using the R (3.6.2) software [30]. To test for significant differences in year and treatments, we used a two-way analysis of variance (ANOVA), which was conducted using the “Anova” function as implemented in the “car” package [31]. Differences between treatments were considered significant at p < 0.05. Pearson correlations among the agronomic traits were estimated using the “cor” function in R. The data were visualized using the “ggplot2” package [32].
3. Results
3.1. Precipitation and Temperature
The growth properties of rice varied significantly across the three years (2017–2019, see Table 1), primarily due to the differences in meteorological characteristics (Figure 1). Rainfall during the rice-growing seasons totaled approximately 470 mm, 760 mm, and 487 mm from 2017 to 2019, constituting 59.6%, 79.7%, and 71.0% of the total crop-growing season rainfall. Throughout the rice-growing seasons (June–September), the cumulative temperature was 2945 °C in 2017, 2862 °C in 2018, and 2999 °C in 2019 (Figure 1).

Table 1.
Effect of treatments on grain yield, dry matter accumulation (DMA), N harvest index (NHI), and N uptake during rice harvesting seasons over three years.
3.2. Rice Productivity and Yield Components
The ice grain yield and dry matter accumulation (DMA) noticeably increased with N fertilizer application and higher planting density than control (CK) throughout the study period. Specifically, the N1D2 treatment exhibited higher grain yield (10,452 kg ha−1) over the three years, representing an increase of 12.2% compared to CK. A similar trend was observed for DMA between N1D2 and CK across the three years. Furthermore, treatments N1D1, N1D2, N2D1, and N2D2 demonstrated higher grain N and straw N content compared to CK. However, no significant difference in the N harvest index (NHI) was found between CK and treatments (N1D1, N1D2, N2D1, and N2D2), averaging 0.64 and 0.60, respectively. N uptake in N1D2 exhibited the highest value, averaging 39.3% (p < 0.05) higher than CK, and 8.5% (p < 0.05), 3.5%, and 12.8% (p < 0.05) higher than N1D1, N2D1, and N2D2 (Table 1).
Yield components varied with N fertilizer application and planting density throughout the study period. The N1D2 treatment exhibited the highest number of productive panicles, which was 24.6% (p < 0.05) higher than N1D1, 22.7% (p < 0.05) higher than N2D1, 8.5% higher than N2D2, and 25.9% (p < 0.05) higher than CK (Table 2). On average, there was a 2.9% increase (N1D1, p < 0.05), 2.0% increase (N1D2), 3.0% increase (N2D1, p < 0.05), and 2.7% increase (N2D2) in 1000-grain weight compared to CK over the three years. However, no significant difference in grain-filling percentage was found among the treatments. (Table 2).
Table 2.
Grain yield components across rice growth seasons under different treatments over three years.
3.3. Nitrogen Use Efficiency
N fertilizer application and planting density treatments significantly influenced N agronomic efficiency (NAE), N use efficiency (NUE), and N partial productivity (PFPN) during rice harvesting seasons over three years (Table 3). The PFPN for the N2D1 treatment was 71.5 kg kg−1, a value that was 29.2% (p < 0.05) higher than N1D1, 23.1% (p < 0.05) higher than N1D2, and 1.4% higher than N2D2 over the three years. Additionally, the N2D1 treatment led to the largest NAE among all treatments, 63.2% (p < 0.05) higher than N1D1, 12.8% higher than N1D2, and 11.0% higher than N2D2. The NUE for the N2D2 treatment was 58.99 kg kg−1, exhibiting a larger value than other treatments across the three years (Table 3).
Table 3.
Effect of treatments on N agronomic efficiency (NAE), N use efficiency (NUE), and N partial productivity (PFPN) during rice harvesting seasons over three years.
3.4. Seasonal Pattern and Cumulative GHG Emissions
Seasonal dynamics of methane (CH4) emissions fluxes exhibited a clear pattern across all treatments during 2017 and 2018. CH4 fluxes markedly increased after transplanting and, approximately two weeks later, decreased to negligible amounts in all treatments. Peak CH4 emission fluxes were observed at 35 days after transplanting for the N1D2 treatment (0.95 mg m−2 h−1) in 2017 and 43 days after transplanting for the N1D1 treatment (0.92 mg m−2 h−1) in 2018 (Figure 2). Carbon dioxide (CO2) fluxes followed a similar pattern to CH4 fluxes during rice-growing seasons. CO2 emission fluxes increased gradually in all treatments, approximately 10 days, and reached peak fluxes 41–44 days after transplanting (86.5–116.8 mg m−2 h−1) in 2017. Similarly, the highest CO2 emission fluxes occurred 35 days after transplanting for the N1D1 (147.9 mg m−2 h−1) and N2D1 (143.0 mg m−2 h−1) treatments in 2018 (Figure 2). Unlike the other GHG, nitrous oxide (N2O) fluxes followed a distinct pattern during the rice-growing season in 2017. Initially, N2O fluxes remained lower for all treatments but then sharply increased and reached peak fluxes for the N1D1 treatment (14.9 µg m−2 h−1) with high standard deviation values. However, in 2018, the seasonal dynamics of N2O fluxes showed a clear pattern across all treatments. N2O fluxes gradually increased approximately two weeks after transplanting and reached peak fluxes 48 days after transplanting for the N1D1 (13.0 µg m−2 h−1) and N1D2 (9.2 µg m−2 h−1) treatments (Figure 2).

Figure 2.
Effects of different treatments on seasonal dynamics of CH4, CO2, and N2O fluxes during rice-growing period in 2017 and 2018. Data are presented as the means of three replicates ± SD (n = 3).
N application and the planting density significantly affected the cumulative GHG emissions in both years (Table S2). The cumulative CH4 emissions increased significantly with higher N fertilizer application rates, with the highest emissions observed in the N1D1 treatment in 2017 (790 kg ha−1) and 2018 (823 kg ha−1). In addition, the cumulative CO2 emissions exhibited significant differences between the treatments (N1D1, N1D2, N2D1, and N2D2) and CK in both years. Similarly, the cumulative N2O emissions were highest in the N1D1 treatment, with values of 54.4 kg ha−1 in 2017 and 53.2 kg ha−1 in 2018, compared to the other treatments (Figure 3 and Table S2). The N fertilizer application and planting density significantly affected the global warming potential (GWP) and greenhouse gas intensity (GHGI). The greater GWP (5405 and 7228 kg ha−1) and GHGI (0.51 and 0.75 kg kg−1) values were observed in the N1D1 treatments in both years. Furthermore, N1D1, N1D2, N2D1, and N2D2 exhibited higher GWP and GHGI than CK in both years (Figure 3 and Table S2).

Figure 3.
Effects of different treatments on cumulative greenhouse gas (GHG) emissions, global warming potential (GWP), and greenhouse gas intensity (GHGI) in 2017 and 2018. Data are presented as the means of three replicates ± SD (n = 3). Error bars with different letters indicate significant differences among treatment means based on Tukey’s significant difference test at p < 0.05.
3.5. Relationships of GHG Emissions with Resource Use Efficiency
The GHG emission fluxes showed a significantly negative relationship with the NAE during the rice-growing seasons. Regression analysis revealed a significant negative association of the NAE with CH4 fluxes (R2 = 0.24, p < 0.05) and CO2 emission fluxes (R2 = 0.57, p < 0.001) but a non-significant relationship with N2O fluxes. Additionally, a significant relationship between the NAE and GWP (R2 = 0.62, p < 0.001) and GHGI (R2 = 0.67, p < 0.001) was detected in our study (Figure 4). Moreover, the regression analyses also depicted a significant decline in GHG emissions with increased PFPN in rice. CH4 fluxes (R2 = 0.58), CO2 fluxes (R2 = 0.16), N2O fluxes (R2 = 0.37), GWP (R2 = 0.25), and GHGI (R2 = 0.13) were negatively and linearly associated with PFPN (Figure 4).

Figure 4.
Relationship of CH4, CO2, N2O, GWP, and GHGI with the NAE (n = 24) and PFPN (n = 24). GWP: global warming potential, GHGI: greenhouse gas intensity, NAE: N agronomic efficiency, PFPN: N partial productivity.
3.6. Soil Properties among the Treatments
Soil physicochemical characteristics showed significant differences across the 0 to 40 cm depth. Organic matter, total N, total P, alkali-hydrolyzable N, Olsen-P, and NH4Ac-K gradually decreased with the increasing soil depth (Table S3). In addition, N application and the planting density significantly affected the organic matter, total N, and alkali-hydrolyzable N. Specifically, the N1D2 treatment showed the highest values for organic matter (46 g kg-1), total N (2.41 g kg-1), and alkali-hydrolyzable N (197 mg kg-1) in the top 0–10 cm region (Figure 5 and Table S3). No significant differences were observed in pH, total P, total K, Olsen-P, and NH4Ac-K among the different treatments in the various regions (Table S3). Soil mechanical compositions exhibited significant differences across the depth ranging from 0 to 40 cm. However, there were no significant differences in soil mechanical compositions among the various treatments in different regions (Table S4).
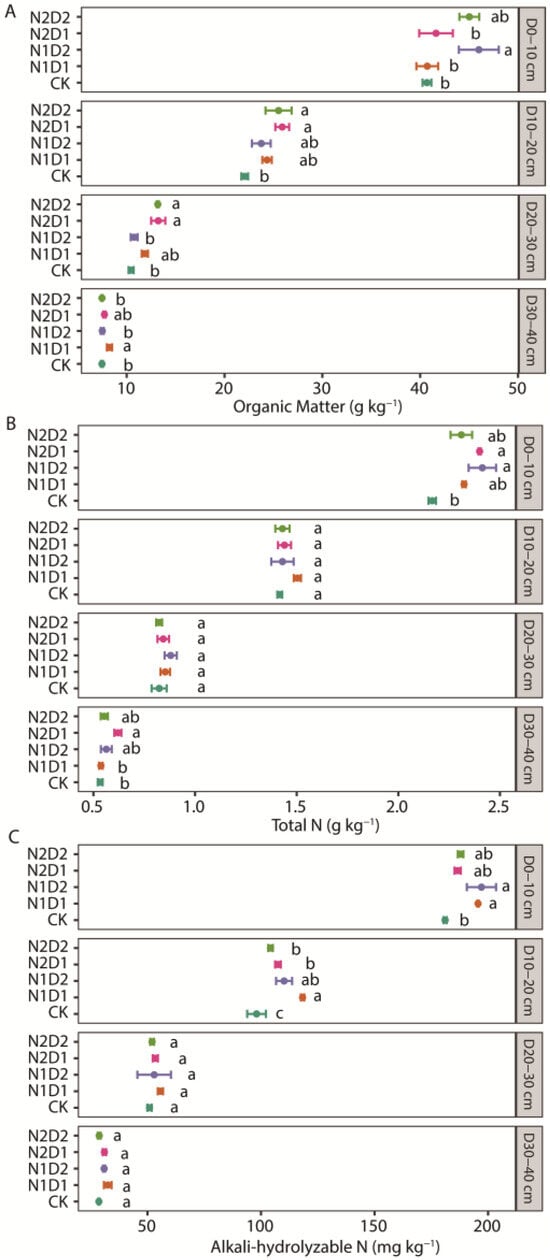
Figure 5.
Effect of treatments on soil (A) organic matter, (B) total N and (C) alkali-hydrolyzable N in the upper 0–40 cm region after rice harvesting season. Data are presented as the means of three replicates ± SD (n = 3). Error bars with different letters indicate significant differences among treatment means based on Tukey’s significant difference test at p < 0.05.
4. Discussion
4.1. Impact of N Management and Planting Density on Rice Yield and N Use Efficiency
Rational N application can significantly increase rice yield, but excessive N input leads to low NUE and severe environmental pollution. Effective N management and optimal planting density are crucial for enhancing both rice yield and NUE. Therefore, reducing N application rates while increasing the planting density is recommended to maintain high rice yields and improve NUE [33]. Our study demonstrates that optimized N management and increased planting density significantly enhance rice yield and N use efficiency in rice cultivation systems (Table 1 and Table 3). Previous results found that reducing the N application rate with a higher planting density increases NUE by 23.3–31.9% and N recovery efficiency by 17.4–24.1% without significantly lowering rice yield compared to conventional practices [33]. Similar results were observed in our study. Compared to the conventional N application rate of 180 kg ha⁻1 in rice [34], our straw return cultural system with the same nitrogen management and planting density treatment (N1D1) achieved a 9.7% higher grain yield. Under a further 20% optimized fertilization (N2D1), nitrogen uptake increased, significantly improving NAE by 63.2% and PFPN by 29.2%, while no significant differences were observed in NUE compared with N1D1. Additionally, the rice yield did not decrease (Table 1 and Table 3), corroborating the findings by Ju et al. [17]. This improvement may be attributed to the implementation of straw return in the rice system, which increased the organic matter content in the soil.
Higher planting densities further contributed to increased rice productivity, particularly with mechanical rice transplanting, which is becoming more prevalent in rice cultivation [19]. The N1D2 treatment consistently resulted in the highest grain yield, dry matter accumulation (DMA), and NUE throughout the study period, underscoring the benefits of combined strategies involving reduced N application and increased planting density (Table 1 and Table 3). Reducing N application enhances NUE, particularly PFPN. The results of the present study also showed that PFPN significantly increased as the N rate decreased (Table 3). However, excessively reducing N application could significantly decrease yield, although dense planting could partially compensate for these negative impacts [33]. Therefore, there is a trade-off between the effects of nitrogen application and planting density on rice yield and NUE.
4.2. Effects on Greenhouse Gas Emissions
The present study also reveals that GHG emissions, particularly CH4 and N2O, are significantly influenced by N management practices and planting density. The seasonal patterns of CH4 and CO2 emissions, which peaked shortly after transplanting, were consistent across treatments and years (Figure 2). The N1D1 treatment, characterized by higher N application rates with traditional planting density, resulted in the highest cumulative CH4 and CO2 emissions. Reducing N application and increasing the planting density (N2D2) could decrease CH4 and CO2 emissions (Figure 3). Similar results were observed by Zhu et al. [35], who found that a 25% increase in planting density combined with a similar decrease in basal N application reduced CH4 emissions. However, further increases in density and decreases in N tended to increase CH4 emissions. A large reduction in basal N application might significantly limit soil N availability for CH4 oxidation during the early and later stages of rice growth [36]. Thus, with a moderate increase in planting density with less N application, a balance between CH4 production and oxidation was achieved, resulting in the lowest CH4 emission levels among the treatments. N2O emissions, while generally lower than CH4 and CO2 emissions, showed a distinct seasonal pattern, peaking later in the growing season. In paddy fields under prolonged flooding, the lack of oxygen results in N2O being primarily produced through denitrification. The N2O produced is further reduced to N2 under strong reducing conditions. During the drainage period, when the paddy fields are not flooded, the well-aerated environment facilitates both nitrification and denitrification, leading to a significant increase in the N2O emission flux [37]. The highest N2O fluxes were observed in treatments with higher N application, particularly N1D1, highlighting the role of nitrification and denitrification processes in N2O production under high N input conditions (Figure 2 and Figure 3). The N2O emissions varied significantly with planting density at the higher nitrogen application rate (N1D1 vs. N1D2) and with nitrogen application rate at the lower planting density (N1D1 vs. N2D1). However, no significant differences were observed at the higher planting density and lower nitrogen application rate (N2D1 vs. N2D2). This indicates that both nitrogen application rate and planting density impact N2O emissions, but the nitrogen application rate has the primary effect (Figure 3).
Despite the nitrogen application rate for N1D2 being 180 kg ha−1, N2O emissions were lower than in other treatments (Figure 3). This may be due to the carbon-to-nitrogen (C/N) ratio of the soil straw. When the C/N ratio of returned crop residues exceeds 40, microorganisms temporarily immobilize soil nitrogen, reducing its availability for nitrification and denitrification, thus decreasing N2O production [38]. Additionally, nitrogen fertilizer can alter straw decomposition rates, and planting density can affect nitrogen use efficiency, influencing CH₄ and N2O emissions. This study shows that optimal fertilization and planting density combined with full straw return can maximize yield and minimize carbon emissions, thus achieving a balance between high yield and low carbon footprint.
4.3. Global Warming Potential and Greenhouse Gas Intensity
During the rice cultivation period, the GWP was primarily influenced by CH₄ fluxes, which accounted for over 60% of the total GWP. N2O fluxes contributed less than 40% (Figure 3). This is consistent with previous studies that have reported CH₄ emissions as the dominant factor in the GWP in rice paddies, often making up more than 90% of the total GWP. The application of N fertilizer significantly increased GWP, with a quadratic response peaking at 130 kg N application before decreasing with further increases [39]. Our findings indicate that both GWP and GHGI are significantly affected by N application rates and planting density. Specifically, the N1D1 treatment exhibited the highest GWP and GHGI. Conversely, treatments with optimized planting density (N1D2) demonstrated lower GWP and GHGI, suggesting that denser planting can mitigate greenhouse gas emissions while sustaining high rice yields (Figure 3).
Additionally, various studies propose methods to reduce GWP and GHGI, including the following: 1. Optimizing fertilizer application rates: The proper management of fertilizer application rates can significantly reduce GHG emissions. Ju et al. [40] demonstrated that optimizing N application rates can mitigate GWP without compromising crop yields. 2. Effective water management: Gao et al. [41] highlighted that water management practices, such as alternate wetting and drying, can reduce CH₄ emissions from rice paddies. 3. Timing and rate of N application using in-season N management: Zhang et al. [42] emphasized the importance of timing and the rate of N application. Adjusting these factors based on crop growth stages can optimize N use efficiency and reduce N2O emissions. 4. Using nitrification inhibitors or slow-release fertilizers: Hu et al. [43] suggested that incorporating nitrification inhibitors or using slow-release fertilizers can decrease N2O emissions by slowing down the conversion of ammonium to nitrate. In summary, while CH₄ remains the predominant contributor to GWP in rice cultivation, strategies such as optimizing N application rates, improving planting density, effective water management, and using advanced fertilization techniques can significantly reduce both GWP and GHGI. These findings underscore the importance of integrated management practices in achieving sustainable rice production with lower GHG emissions.
4.4. Relationship between Resource Use Efficiency and GHG Emissions
The NAE and PFPN are key determinants for identifying rational irrigation, planting density, and N management, as well as improving crop economic benefits [28,44]. In this study, we found that both reducing N application (N1D1 vs. N2D1 and N1D2 vs. N2D2) and increasing plant density (notably in N1D1 vs. N1D2 but not in N2D1 vs. N2D2) improve the NAE and PFPN over the three-year period (Table 3). Moreover, the negative correlation between the NAE and GHG emissions further supports the potential for optimized N management to reduce environmental impact. Higher NAE was associated with lower CH4 and CO2 fluxes, as well as reduced GWP and GHGI. Similarly, PFPN showed a significant inverse relationship with GHG emissions, indicating that improving N use efficiency can effectively decrease GHG emissions in rice cultivation (Figure 4). Previous studies have consistently demonstrated that N2O emissions, CO2 levels, and GWP exhibit a negative and linear correlation with PFPN. This indicates that as PFPN increases, the emissions of N2O and CO2, as well as the overall GWP, tend to decrease in a predictable, proportional manner. In contrast, the GHGI shows a more complex, parabolic relationship with PFPN. Initially, as PFPN increases, GHGI decreases, reaching a minimum point before beginning to increase again, suggesting that there is an optimal PFPN level for minimizing GHGI [28]. Overall, the negative relationship of the GWP and GHGI with the NAE and PFPN indicates that adopting appropriate N application rates and planting densities would enhance the economic benefits of rice production. This is achieved by reducing input costs and mitigating the environmental impacts, as indicated by lowering GWP and GHGI in the paddy field regions of Southwest China.
4.5. Effects of Fertilization and Planting Density on Soil Properties
In this study, organic matter, total nitrogen, and available nitrogen were observed to decrease with soil depth (Figure 5 and Table S3). Our findings indicate that nitrogen application and planting density significantly influenced organic matter, total nitrogen, and alkali-hydrolyzable nitrogen (Table S3). Our results also demonstrate that optimized nitrogen and planting density significantly increase rice yield, nitrogen uptake, and nitrogen agronomic efficiency (Tables S1 and S3). In terms of soil nutrients, the N1D2 treatment showed the highest values for organic matter, total nitrogen, and alkali-hydrolyzable nitrogen in the top 0–10 cm layer (Figure 5 and Table S3). In contrast, reduced nitrogen fertilizer (N2D1 and N2D2) mainly impacted alkali-hydrolyzable nitrogen content in the 0–20 cm soil layer. The analysis of soil mechanical composition across the 0–40 cm layer revealed significant differences in soil particle size distribution between layers (Table S4). These results indicate that selecting appropriate fertilization rates and planting densities can effectively balance yield, environmental sustainability, and soil fertility.
5. Conclusions
Optimizing N application rates and increasing planting density effectively enhance rice yield and resource use efficiency while mitigating GHG emissions. After a 3-year field experiment, we found that both reducing N application (comparing N1D1 to N2D1) and increasing plant density (comparing N1D1 to N1D2) improved the NAE and PFPN. The negative correlation between the NAE and PFPN with the GWP and GHG emissions further supports the potential for optimized N management and denser planting density to reduce environmental impact. Higher NAE and PFPN were associated with lower GWP and GHGI. Moreover, the N1D2 treatment, characterized by a 25% increase in planting density and a similar N application rate with straw return compared to conventional practices, emerged as the most sustainable approach, achieving high yields with lower environmental impact. These findings have important implications for sustainable rice cultivation practices in Southwest China and similar agroecosystems, highlighting the need for integrated nutrient management strategies to achieve food security and climate change mitigation goals. Further research should focus on the long-term impacts and scalability of these practices to ensure their broader adoption and effectiveness.
Supplementary Materials
The following supporting information can be downloaded at: https://www.mdpi.com/article/10.3390/agronomy14081843/s1, Table S1: Soil physicochemical characteristics of the experimental fields used in the study; Table S2: Effect of treatments on cumulative greenhouse gas (GHG) emissions, global warming potential (GWP) and greenhouse gas intensity (GHGI) during rice-growing seasons; Table S3: Soil physicochemical characteristics in the various region after rice harvesting season; Table S4: Effect of treatments on soil mechanical compositions in the upper 0–40 cm region after rice harvesting season.
Author Contributions
Conceptualization, Y.Q. and K.C.; formal analysis, Z.L., M.H., X.L. (Xing Luo) and Y.O.; investigation, S.G., H.Y., X.Z., Y.S. and Z.Z.; resources, X.L. (Xuyi Li), S.L., L.W. and Y.Q.; writing—review and editing, H.Y., X.Z., Y.S., Z.Z., X.L. (Xuyi Li), Z.L., M.H., X.L. (Xing Luo), Y.O., S.L., L.W., Y.Q. and K.C.; project administration, S.G., M.H, K.C., Z.Z. and Y.Q. funding acquisition, K.C. All authors have read and agreed to the published version of the manuscript.
Funding
This research was supported by the National Key R&D Program of China (2023YFD2301901) to G.S., the National Natural Science Foundation of China (42107021) to M.H., the Sichuan Provincial Academy of Agricultural Sciences Provincial Finance Independent Innovation Special Project (2022ZZCX011, 2022ZZCX012) to K.C. and Z.Z., the Sichuan innovation team of national modern agricultural industry technology system (SCCXTD-2024-1) to Y.Q., and the Yibin City external science and technology cooperation project (2024NYHZ004) to K.C.
Data Availability Statement
The data may be made available upon reasonable request.
Conflicts of Interest
The authors declare no conflicts of interest.
References
- Mikhaylov, A.; Moiseev, N.; Aleshin, K.; Burkhardt, T. Global climate change and greenhouse effect. Entrep. Sustain. Issues 2020, 7, 2897. [Google Scholar] [CrossRef]
- Gu, D.; Andreev, K.; Dupre, M.E. Major trends in population growth around the world. China CDC Wkly. 2021, 3, 604. [Google Scholar] [CrossRef] [PubMed]
- Dimkpa, C.O.; Fugice, J.; Singh, U.; Lewis, T.D. Development of fertilizers for enhanced nitrogen use efficiency–Trends and perspectives. Sci. Total Environ. 2020, 731, 139113. [Google Scholar] [CrossRef]
- Gao, Y.; Cabrera Serrenho, A. Greenhouse gas emissions from nitrogen fertilizers could be reduced by up to one-fifth of current levels by 2050 with combined interventions. Nat. Food 2023, 4, 170–178. [Google Scholar] [CrossRef] [PubMed]
- Li, C.; Xiong, Y.; Huang, Q.; Xu, X.; Huang, G. Impact of irrigation and fertilization regimes on greenhouse gas emissions from soil of mulching cultivated maize (Zea mays L.) field in the upper reaches of Yellow River, China. J. Clean. Prod. 2020, 259, 120873. [Google Scholar] [CrossRef]
- Li, D.; Li, H.; Chen, D.; Xue, L.; He, H.; Feng, Y.; Ji, Y.; Yang, L.; Chu, Q. Clay-hydrochar composites mitigated CH4 and N2O emissions from paddy soil: A whole rice growth period investigation. Sci. Total Environ. 2021, 780, 146532. [Google Scholar] [CrossRef]
- Sapkota, A.; Haghverdi, A.; Avila, C.C.; Ying, S.C. Irrigation and greenhouse gas emissions: A review of field-based studies. Soil Syst. 2020, 4, 20. [Google Scholar] [CrossRef]
- Clark, M.A.; Domingo, N.G.; Colgan, K.; Thakrar, S.K.; Tilman, D.; Lynch, J.; Azevedo, I.L.; Hill, J.D. Global food system emissions could preclude achieving the 1.5 and 2 C climate change targets. Science 2020, 370, 705–708. [Google Scholar] [CrossRef] [PubMed]
- Frolking, S.; Qiu, J.; Boles, S.; Xiao, X.; Liu, J.; Zhuang, Y.; Li, C.; Qin, X. Combining remote sensing and ground census data to develop new maps of the distribution of rice agriculture in China. Glob. Biogeochem. Cycles 2002, 16, 1091. [Google Scholar] [CrossRef]
- Ma, W.; Li, J.; Ma, L.; Wang, F.; Sisák, I.; Cushman, G.; Zhang, F. Nitrogen flow and use efficiency in production and utilization of wheat, rice, and maize in China. Agric. Syst. 2008, 99, 53–63. [Google Scholar] [CrossRef]
- Ning, J.; Lou, S.; Guo, Y.; Chang, S.; Zhang, C.; Zhu, W.; Hou, F. Appropriate N fertilizer addition mitigates N2O emissions from forage crop fields. Sci. Total Environ. 2022, 829, 154628. [Google Scholar] [CrossRef]
- Lyu, X.; Wang, T.; Ma, Z.; Zhao, C.; Siddique, K.H.; Ju, X. Enhanced efficiency nitrogen fertilizers maintain yields and mitigate global warming potential in an intensified spring wheat system. Field Crops Res. 2019, 244, 107624. [Google Scholar] [CrossRef]
- Hadi, A.; Inubushi, K.; Yagi, K. Effect of water management on greenhouse gas emissions and microbial properties of paddy soils in Japan and Indonesia. Paddy Water Environ. 2010, 8, 319–324. [Google Scholar] [CrossRef]
- Harriss, R.C.; Gorham, E.; Sebacher, D.I.; Bartlett, K.B.; Flebbe, P.A. Methane flux from northern peatlands. Nature 1985, 315, 652–654. [Google Scholar] [CrossRef]
- Kögel-Knabner, I.; Amelung, W.; Cao, Z.; Fiedler, S.; Frenzel, P.; Jahn, R.; Kalbitz, K.; Kölbl, A.; Schloter, M. Biogeochemistry of paddy soils. Geoderma 2010, 157, 1–14. [Google Scholar]
- Santoro, A.E.; Buchwald, C.; McIlvin, M.R.; Casciotti, K.L. Isotopic signature of N2O produced by marine ammonia-oxidizing archaea. Science 2011, 333, 1282–1285. [Google Scholar] [CrossRef] [PubMed]
- Ju, C.; Zhu, Y.; Liu, T.; Sun, C. The effect of nitrogen reduction at different stages on grain yield and nitrogen use efficiency for nitrogen efficient rice varieties. Agronomy 2021, 11, 462. [Google Scholar] [CrossRef]
- Bhatia, A.; Pathak, H.; Jain, N.; Singh, P.K.; Tomer, R. Greenhouse gas mitigation in rice–wheat system with leaf color chart-based urea application. Environ. Monit. Assess. 2012, 184, 3095–3107. [Google Scholar] [CrossRef]
- Qun, H.; Jiang, W.-Q.; Shi, Q.; Xing, Z.-P.; Hu, Y.-J.; Guo, B.-W.; Liu, G.-D.; Hui, G.; Zhang, H.-C.; Wei, H.-Y. Effect of wide-narrow row arrangement in mechanical pot-seedling transplanting and plant density on yield formation and grain quality of japonica rice. J. Integr. Agric. 2020, 19, 1197–1214. [Google Scholar]
- Chen, W.; Wang, Y.; Zhao, Z.; Cui, F.; Gu, J.; Zheng, X. The effect of planting density on carbon dioxide, methane and nitrous oxide emissions from a cold paddy field in the Sanjiang Plain, northeast China. Agric. Ecosyst. Environ. 2013, 178, 64–70. [Google Scholar] [CrossRef]
- Ma, Y.; Wang, J.; Zhou, W.; Yan, X.; Xiong, Z. Greenhouse gas emissions during the seedling stage of rice agriculture as affected by cultivar type and crop density. Biol. Fertil. Soils 2012, 48, 589–595. [Google Scholar] [CrossRef]
- Nelson, D.W.; Sommers, L.E. Total carbon, organic carbon, and organic matter. In Methods of Soil Analysis: Part 3 Chemical Methods; Sparks, D.L., Page, A.L., Helmke, P.A., Loeppert, R.H., Soltanpour, P.N., Tabatabai, M.A., Johnston, C.T., Sumner, M.E., Eds.; American Society of Agronomy: Madison, WI, USA, 1996; pp. 961–1010. [Google Scholar]
- Bremner, J.M. Nitrogen-total. In Methods of Soil Analysis: Part 3 Chemical Methods; Sparks, D.L., Page, A.L., Helmke, P.A., Loeppert, R.H., Soltanpour, P.N., Tabatabai, M.A., Johnston, C.T., Sumner, M.E., Eds.; American Society of Agronomy: Madison, WI, USA, 1996; pp. 1085–1121. [Google Scholar]
- Olsen, S.R. Estimation of Available Phosphorus in Soils by Extraction with Sodium Bicarbonate; US Department of Agriculture: Washington, DC, USA, 1954.
- Mehlich, A. Determination of P, Ca, mg, K, Na, and NH4. North Carol. Soil Test Div. (Mimeo 1953) 1953, 2, 23–89. [Google Scholar]
- Dobermann, A.R. Nitrogen use efficiency—State of the art. Agron. Fac. Publ. 2005, 316, 1–16. [Google Scholar]
- Zou, J.; Huang, Y.; Jiang, J.; Zheng, X.; Sass, R.L. A 3-year field measurement of methane and nitrous oxide emissions from rice paddies in China: Effects of water regime, crop residue, and fertilizer application. Glob. Biogeochem. Cycles 2005, 19, GB2021. [Google Scholar] [CrossRef]
- Kamran, M.; Yan, Z.; Chang, S.; Chen, X.; Ahmad, I.; Jia, Q.; Ghani, M.U.; Nouman, M.; Hou, F. Enhancing resource use efficiency of alfalfa with appropriate irrigation and fertilization strategy mitigate greenhouse gases emissions in the arid region of Northwest China. Field Crops Res. 2022, 289, 108715. [Google Scholar] [CrossRef]
- Solomon, S.; Qin, D.; Manning, M.; Chen, Z.; Marquis, M.; Averyt, K.; Tignor, M.; Miller, H. (Eds.) IPCC, 2007: Climate Change 2007: The Physical Science Basis; Contribution of Working Group I to the Fourth Assessment Report of the Intergovernmental Panel on Climate Change; Cambridge University Press: Cambridge, UK; New York, NY, USA, 2007. [Google Scholar]
- R Core Team. R: A Language and Environment for Statistical Computing; R Foundation for Statistical Computing: Vienna, Austria, 2013. [Google Scholar]
- Fox, J.; Weisberg, S.; Adler, D.; Bates, D.; Baud-Bovy, G.; Ellison, S.; Firth, D.; Friendly, M.; Gorjanc, G.; Graves, S. Package ‘Car’; R Foundation for Statistical Computing: Vienna, Austria, 2012. [Google Scholar]
- Wickham, H.; Chang, W.; Wickham, M.H. Package ‘ggplot2’. In Create Elegant Data Visualisations Using the Grammar of Graphics; Version 2.1; Citeseer: University Park, PA, USA, 2016; pp. 1–189. [Google Scholar]
- Chen, J.; Zhu, X.; Xie, J.; Deng, G.; Tu, T.; Guan, X.; Yang, Z.; Huang, S.; Chen, X.; Qiu, C. Reducing nitrogen application with dense planting increases nitrogen use efficiency by maintaining root growth in a double-rice cropping system. Crop J. 2021, 9, 805–815. [Google Scholar] [CrossRef]
- Zhou, Z.; Li, Z.; Chen, K.; Chen, Z.; Zeng, X.; Yu, H.; Guo, S.; Shangguan, Y.; Chen, Q.; Fan, H.; et al. Changes in soil physicochemical properties and bacterial communities at different soil depths after long-term straw mulching under a no-till system. Soil 2021, 7, 595–609. [Google Scholar] [CrossRef]
- Zhu, X.; Wang, X.; Li, Z.; Deng, A.; Zhang, Z.; Zhang, J.; Zhang, W. Effects of dense planting with less basal N fertilization on rice yield, N use efficiency and greenhouse gas emissions. Int. J. Agric. Biol. 2015, 17, 1097–1100. [Google Scholar]
- Bodelier, P.L.; Hahn, A.P.; Arth, I.R.; Frenzel, P. Effects of ammonium-based fertilisation on microbialprocesses involved in methane emission from soilsplanted with rice. Biogeochemistry 2000, 51, 225–257. [Google Scholar] [CrossRef]
- Liu, J.; Hou, H.; Sheng, R.; Chen, Z.; Zhu, Y.; Qin, H.; Wei, W. Denitrifying communities differentially respond to flooding drying cycles in paddy soils. Appl. Soil Ecol. 2012, 62, 155–162. [Google Scholar] [CrossRef]
- Benckiser, G. Ants and sustainable agriculture. A review. Agron. Sustain. Dev. 2010, 30, 191–199. [Google Scholar] [CrossRef]
- Kim, G.W.; Gutierrez-Suson, J.; Kim, P.J. Optimum N rate for grain yield coincides with minimum greenhouse gas intensity in flooded rice fields. Field Crops Res. 2019, 237, 23–31. [Google Scholar] [CrossRef]
- Ju, X.; Lu, X.; Gao, Z.; Chen, X.; Su, F.; Kogge, M.; Römheld, V.; Christie, P.; Zhang, F. Processes and factors controlling N2O production in an intensively managed low carbon calcareous soil under sub-humid monsoon conditions. Environ. Pollut. 2011, 159, 1007–1016. [Google Scholar] [CrossRef]
- Gao, B.; Ju, X.; Meng, Q.; Cui, Z.; Christie, P.; Chen, X.; Zhang, F. The impact of alternative cropping systems on global warming potential, grain yield and groundwater use. Agric. Ecosyst. Environ. 2015, 203, 46–54. [Google Scholar] [CrossRef]
- Zhang, W.-F.; Dou, Z.-X.; He, P.; Ju, X.-T.; Powlson, D.; Chadwick, D.; Norse, D.; Lu, Y.-L.; Zhang, Y.; Wu, L. New technologies reduce greenhouse gas emissions from nitrogenous fertilizer in China. Proc. Natl. Acad. Sci. USA 2013, 110, 8375–8380. [Google Scholar] [CrossRef] [PubMed]
- Hu, X.-K.; Su, F.; Ju, X.-T.; Gao, B.; Oenema, O.; Christie, P.; Huang, B.-X.; Jiang, R.-F.; Zhang, F.-S. Greenhouse gas emissions from a wheat–maize double cropping system with different nitrogen fertilization regimes. Environ. Pollut. 2013, 176, 198–207. [Google Scholar] [CrossRef]
- Zhang, X.; Xiao, G.; Li, H.; Wang, L.; Wu, S.; Wu, W.; Meng, F. Mitigation of greenhouse gas emissions through optimized irrigation and nitrogen fertilization in intensively managed wheat–maize production. Sci. Rep. 2020, 10, 5907. [Google Scholar] [CrossRef]
Disclaimer/Publisher’s Note: The statements, opinions and data contained in all publications are solely those of the individual author(s) and contributor(s) and not of MDPI and/or the editor(s). MDPI and/or the editor(s) disclaim responsibility for any injury to people or property resulting from any ideas, methods, instructions or products referred to in the content. |
© 2024 by the authors. Licensee MDPI, Basel, Switzerland. This article is an open access article distributed under the terms and conditions of the Creative Commons Attribution (CC BY) license (https://creativecommons.org/licenses/by/4.0/).