
Optimizing Wheat Planting Density by Adjusting Population Structure and Stabilizing Stem Strength to Achieve High and Stable Yields
Abstract
:1. Introduction
2. Materials and Methods
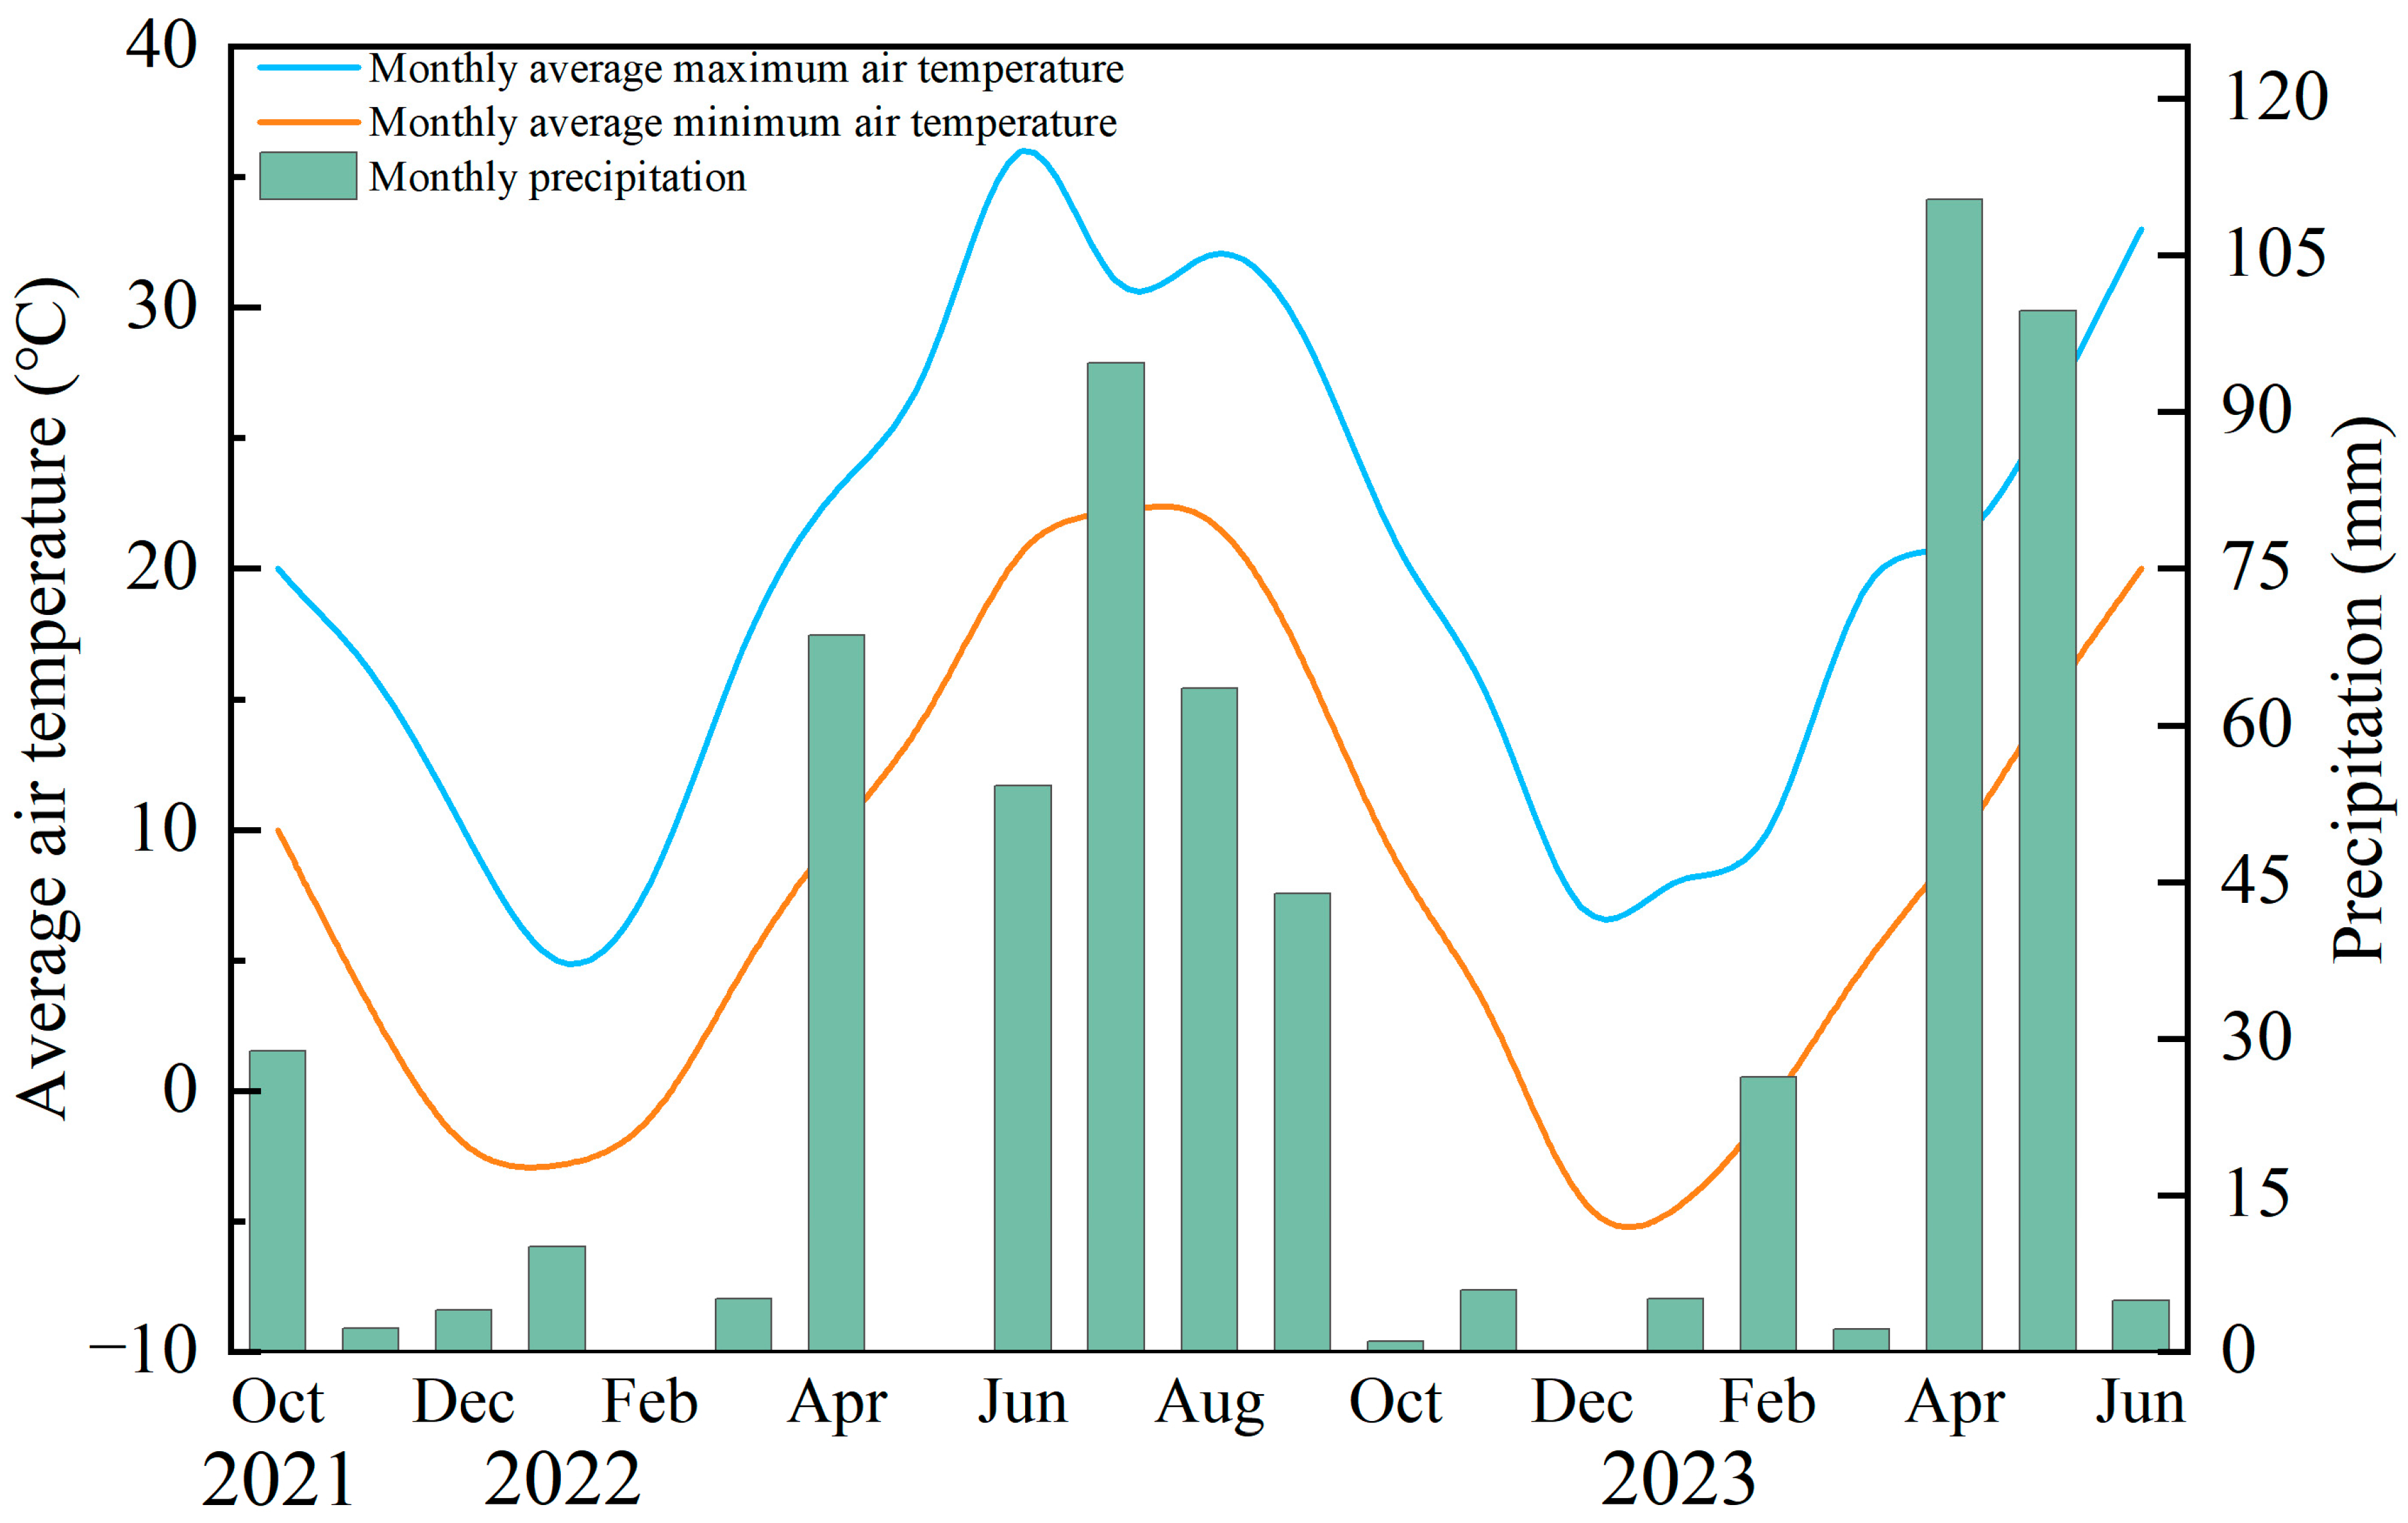
2.1. Experiment Site
2.2. Experimental Design
2.3. Sampling and Determination
2.3.1. Mechanical Strength of the Second Internode of the Stem Base
2.3.2. Stem Storage Assimilate Transport
2.3.3. Fructan Hydrolase Activity
2.3.4. Grain Filling Rate
2.3.5. Yield Components and Grain Yield
2.3.6. Data Analysis
3. Results
3.1. Basal Stem Strength
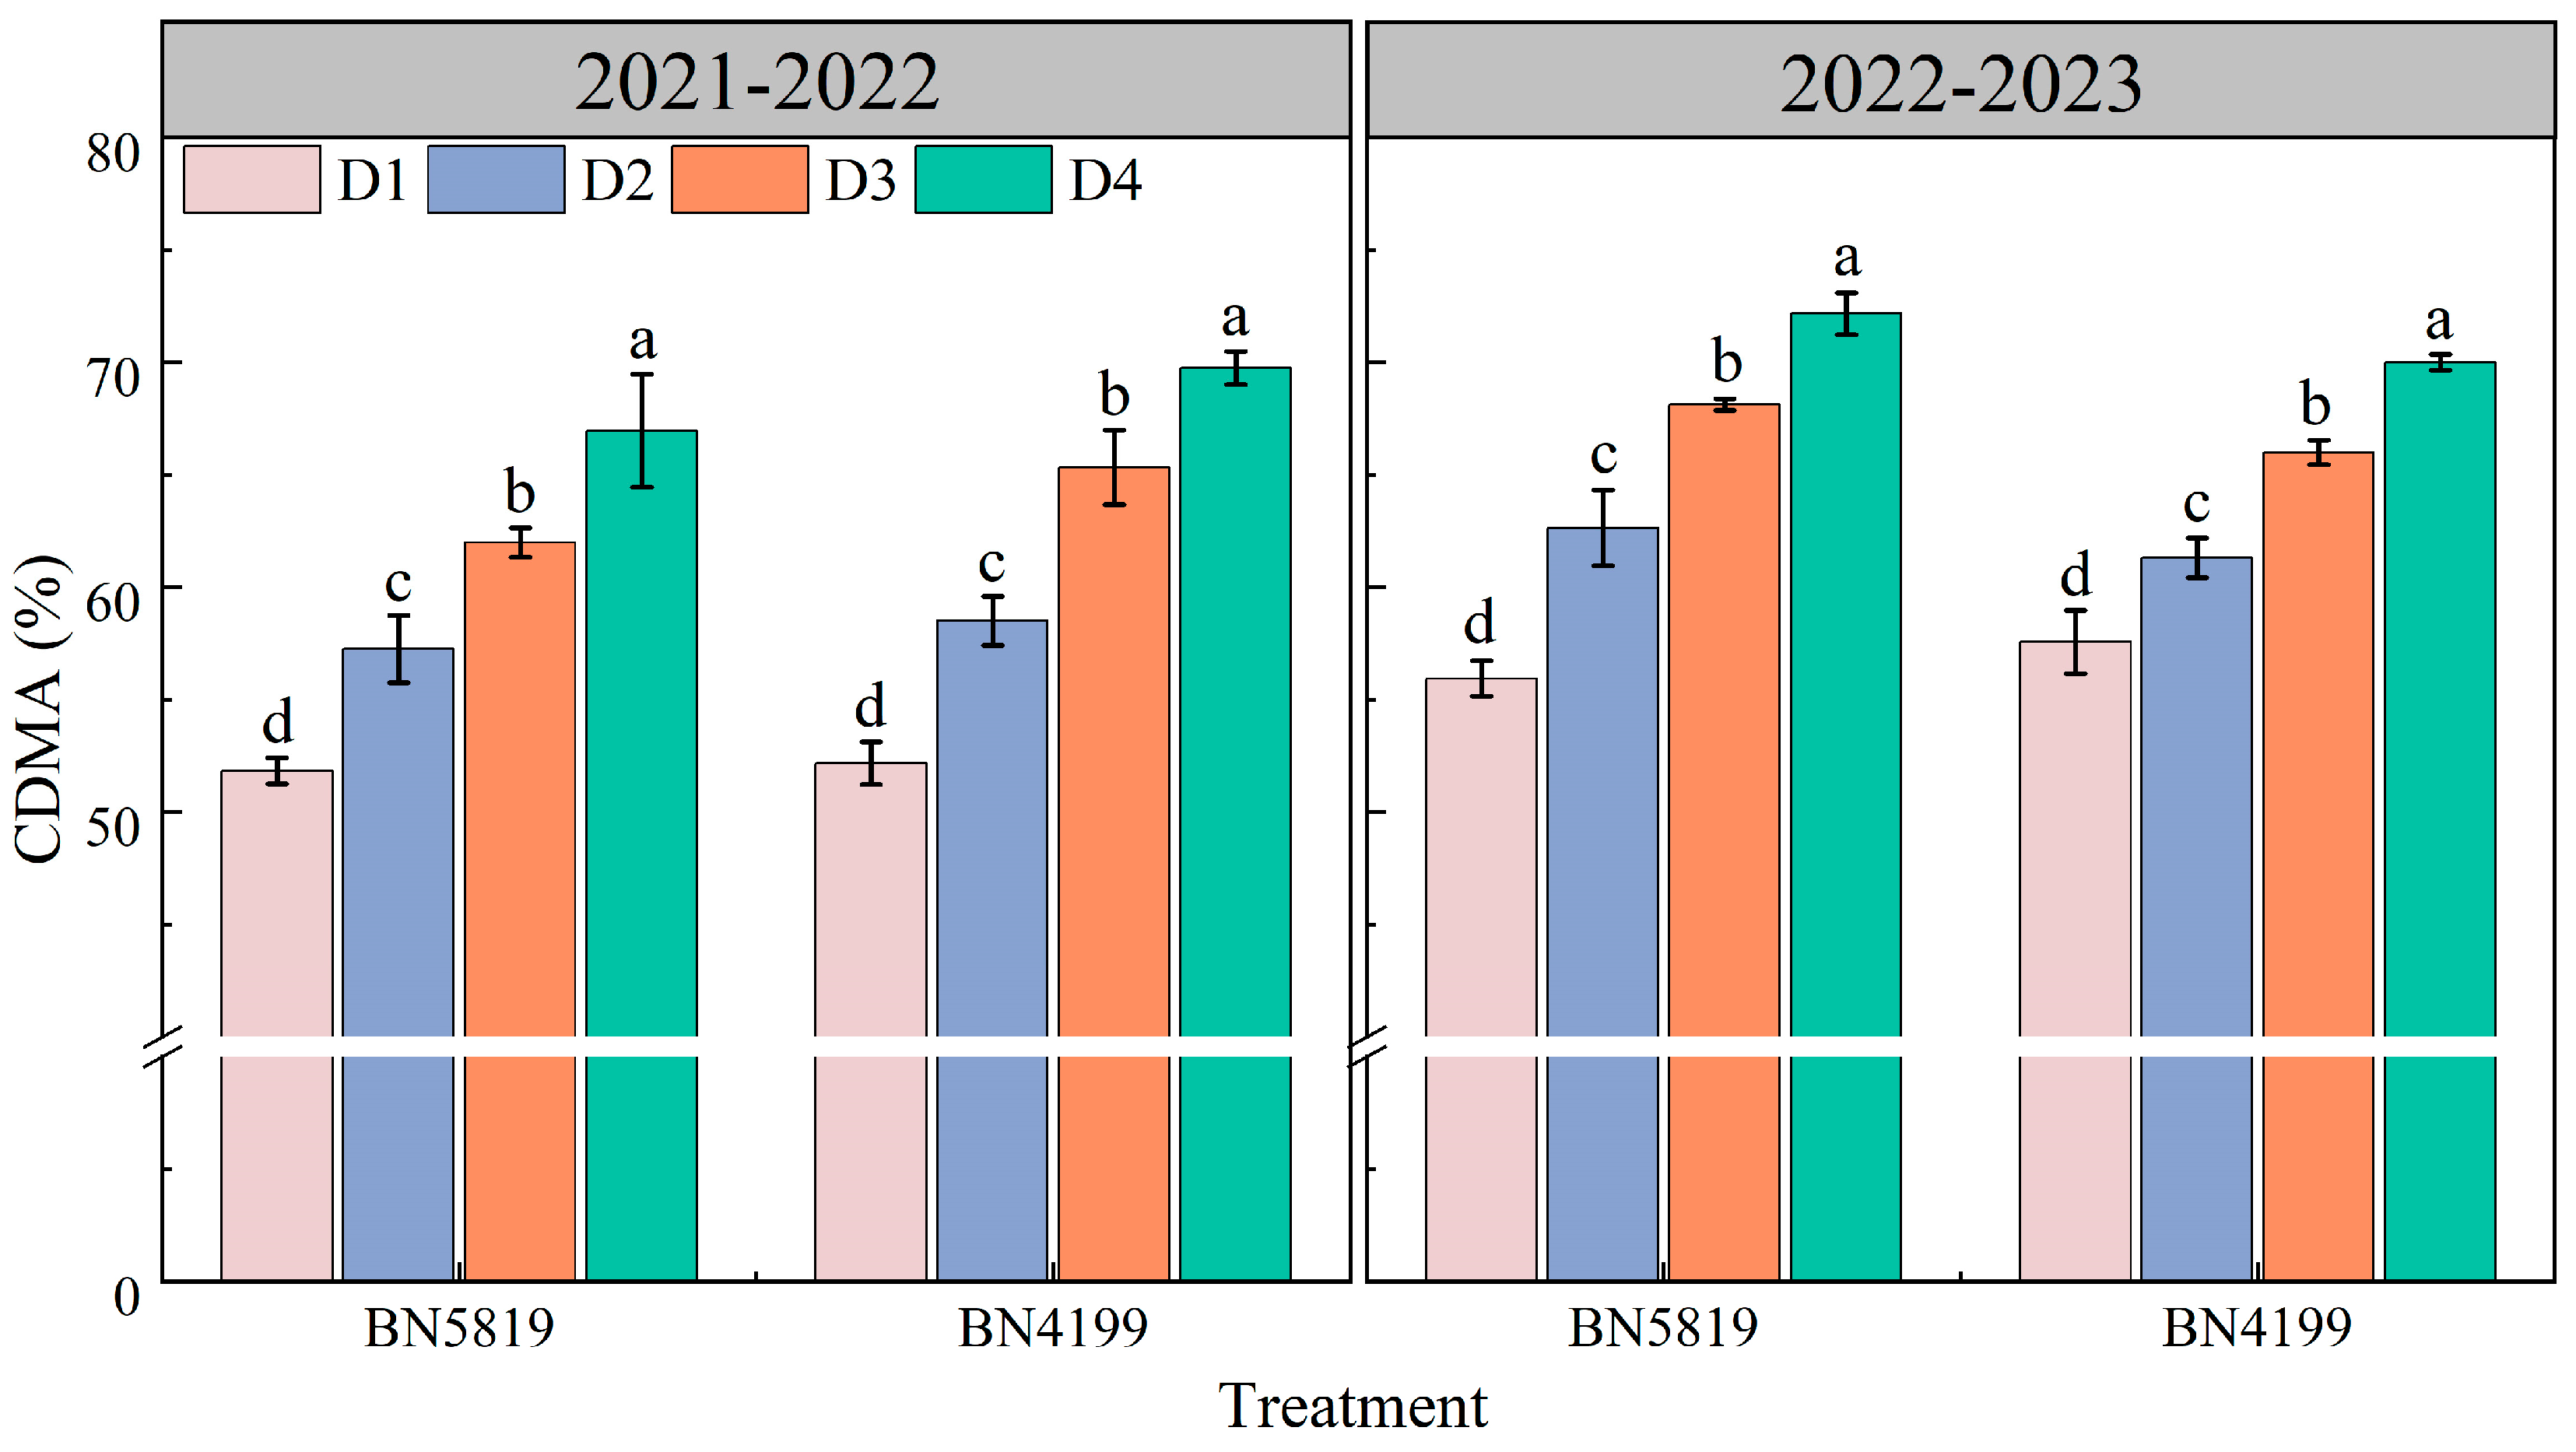
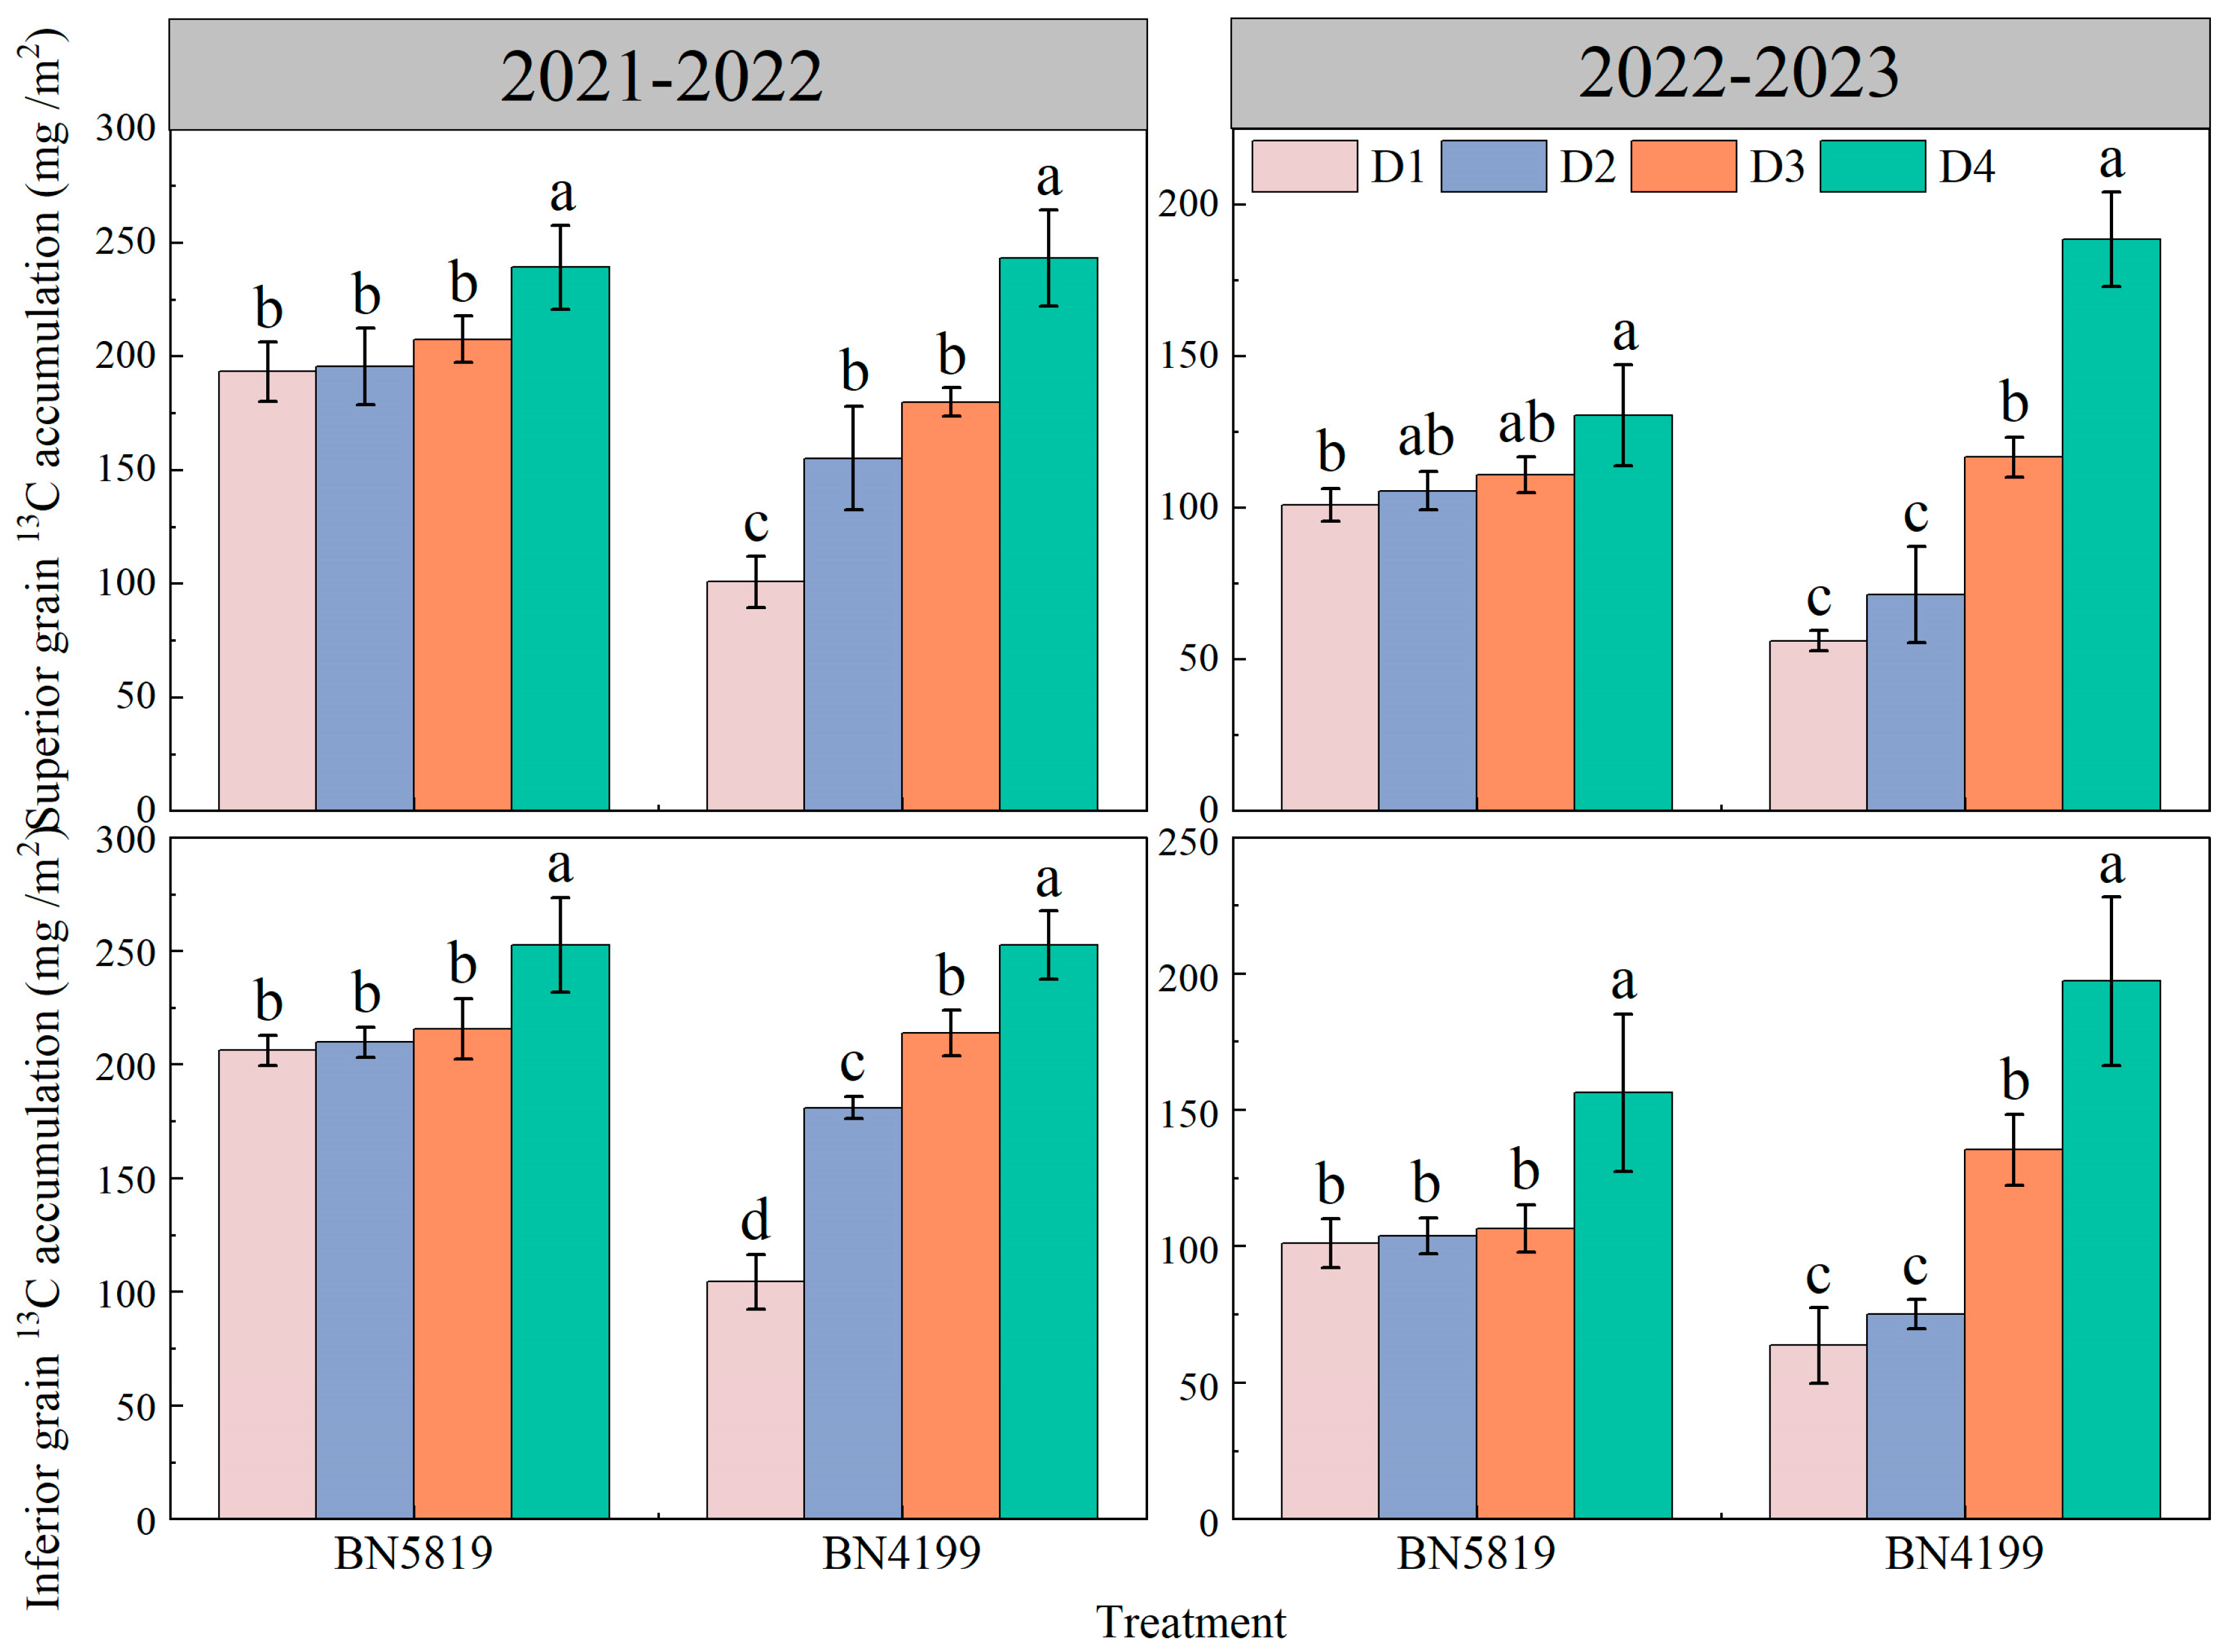
3.2. Reactivation and Transport of Stem Dry Matter
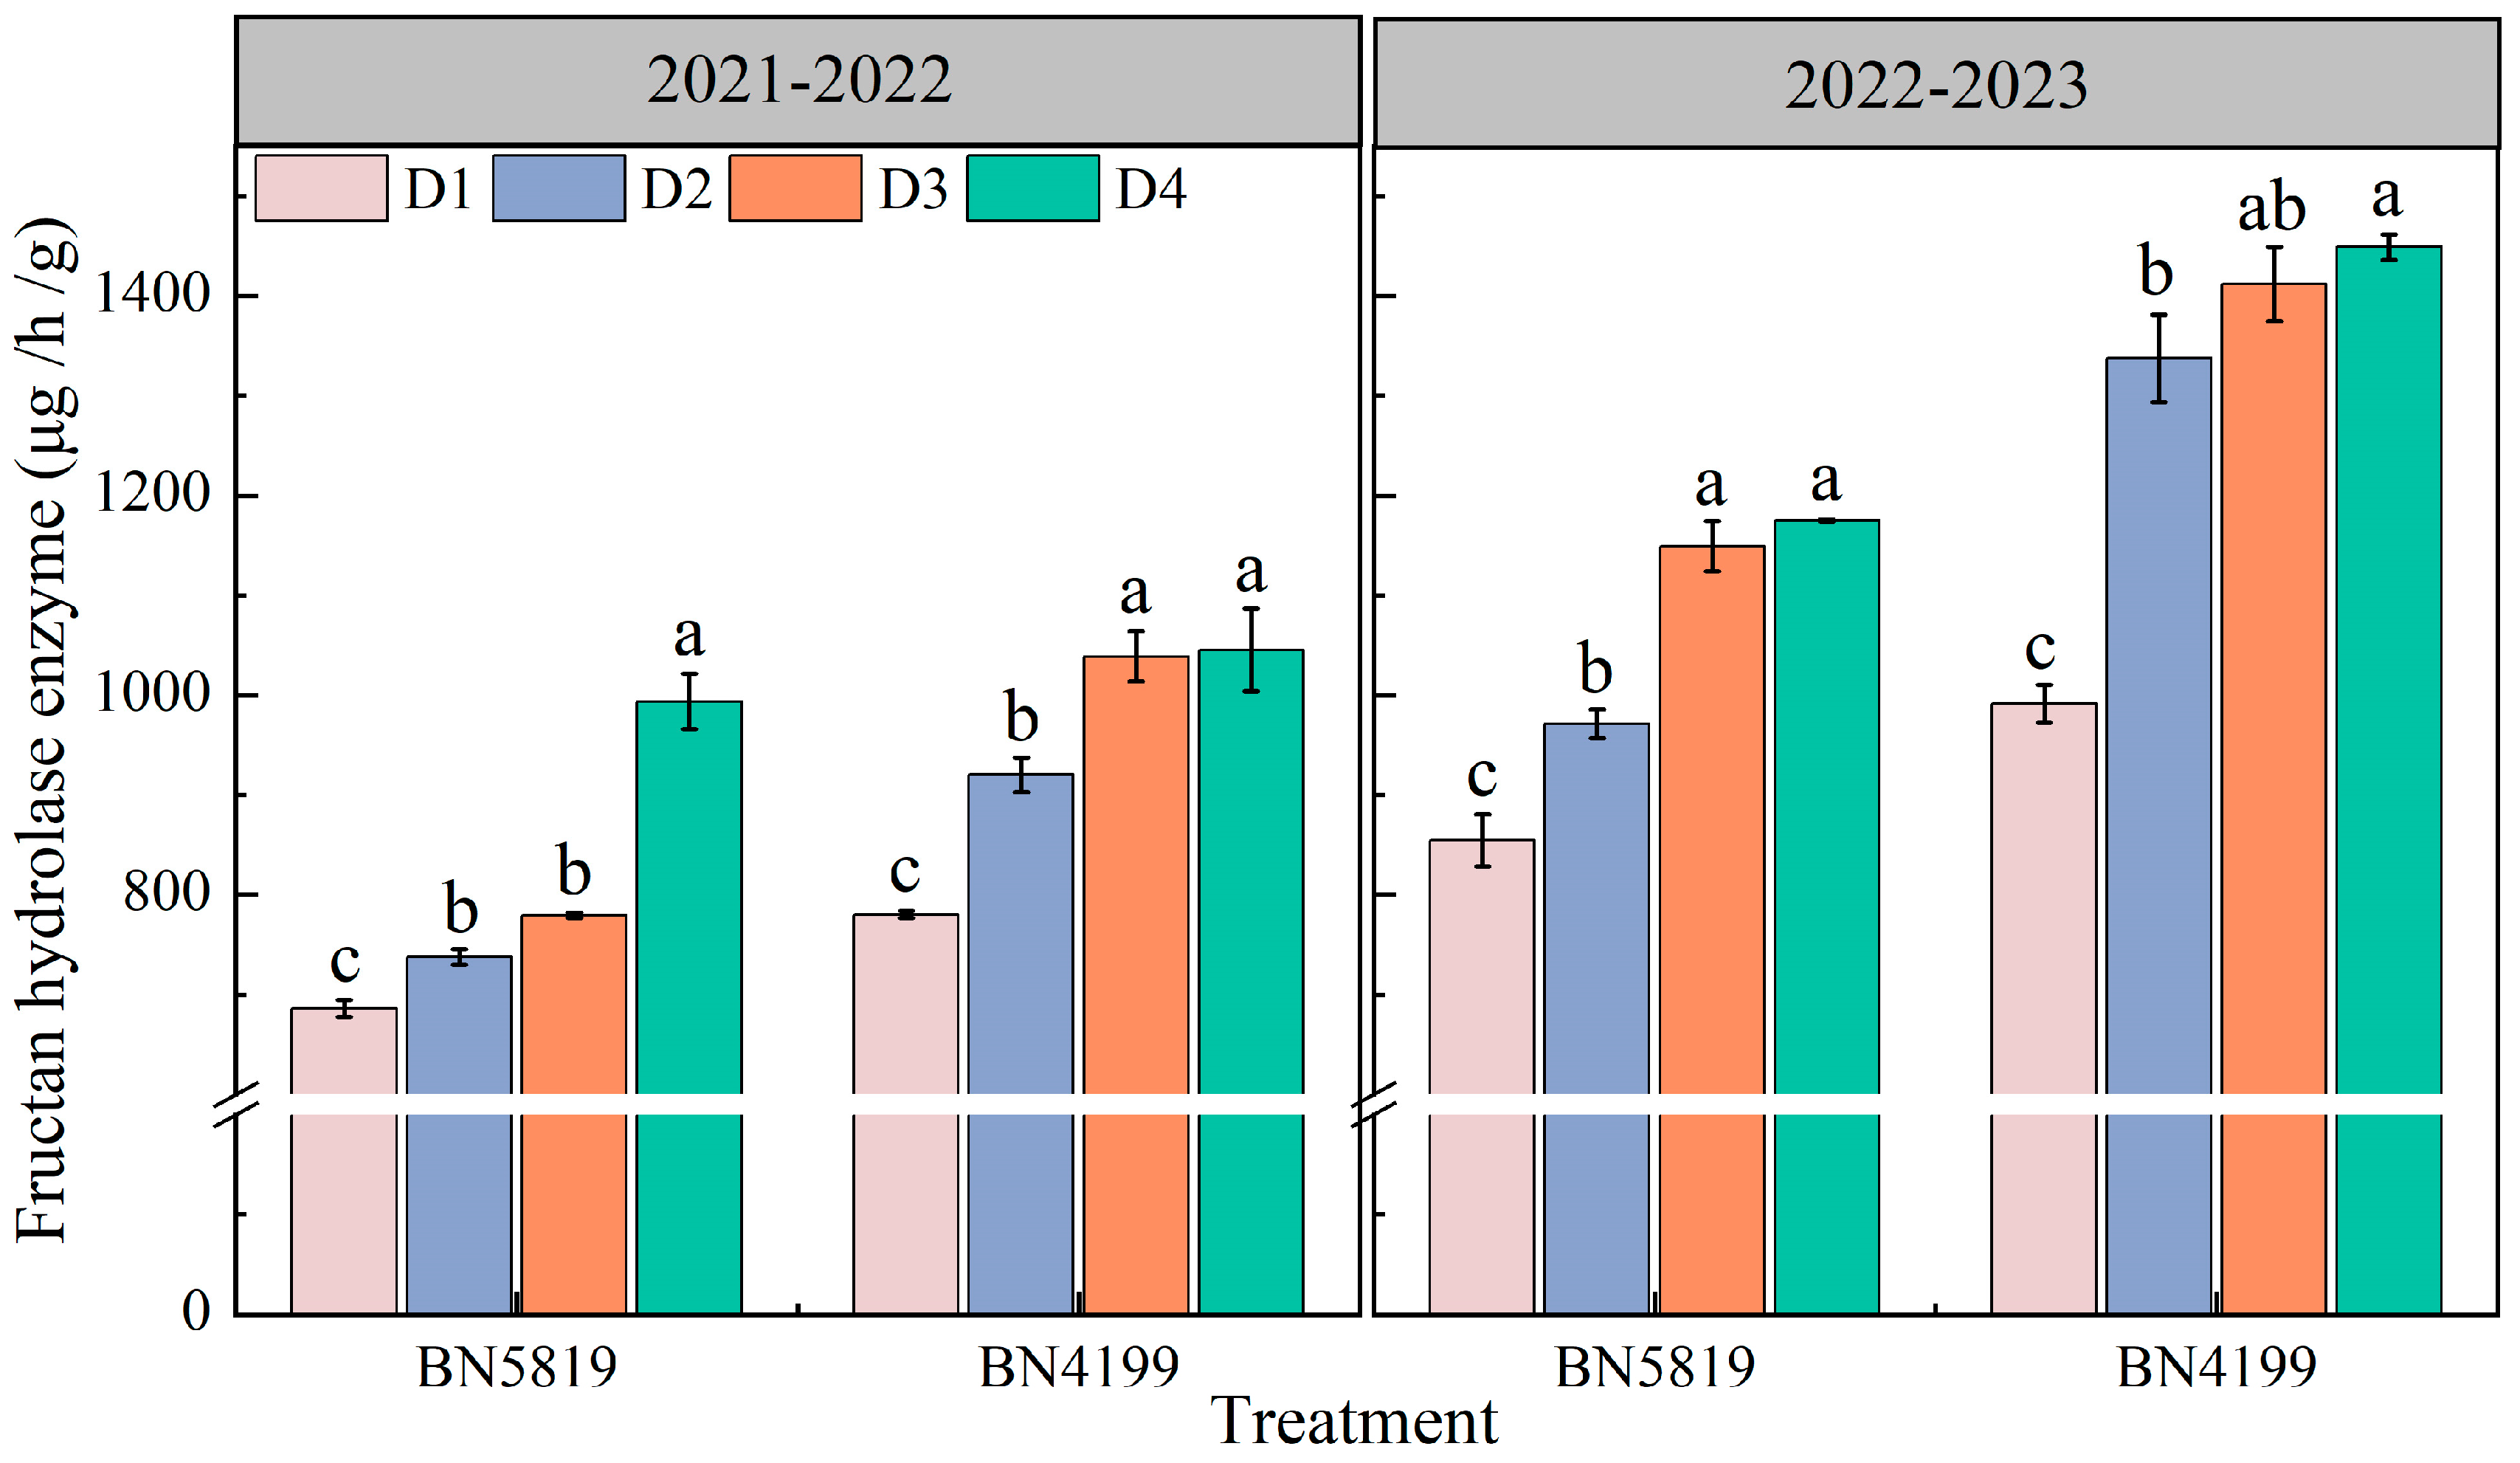
3.3. Stem Fructan Hydrolase
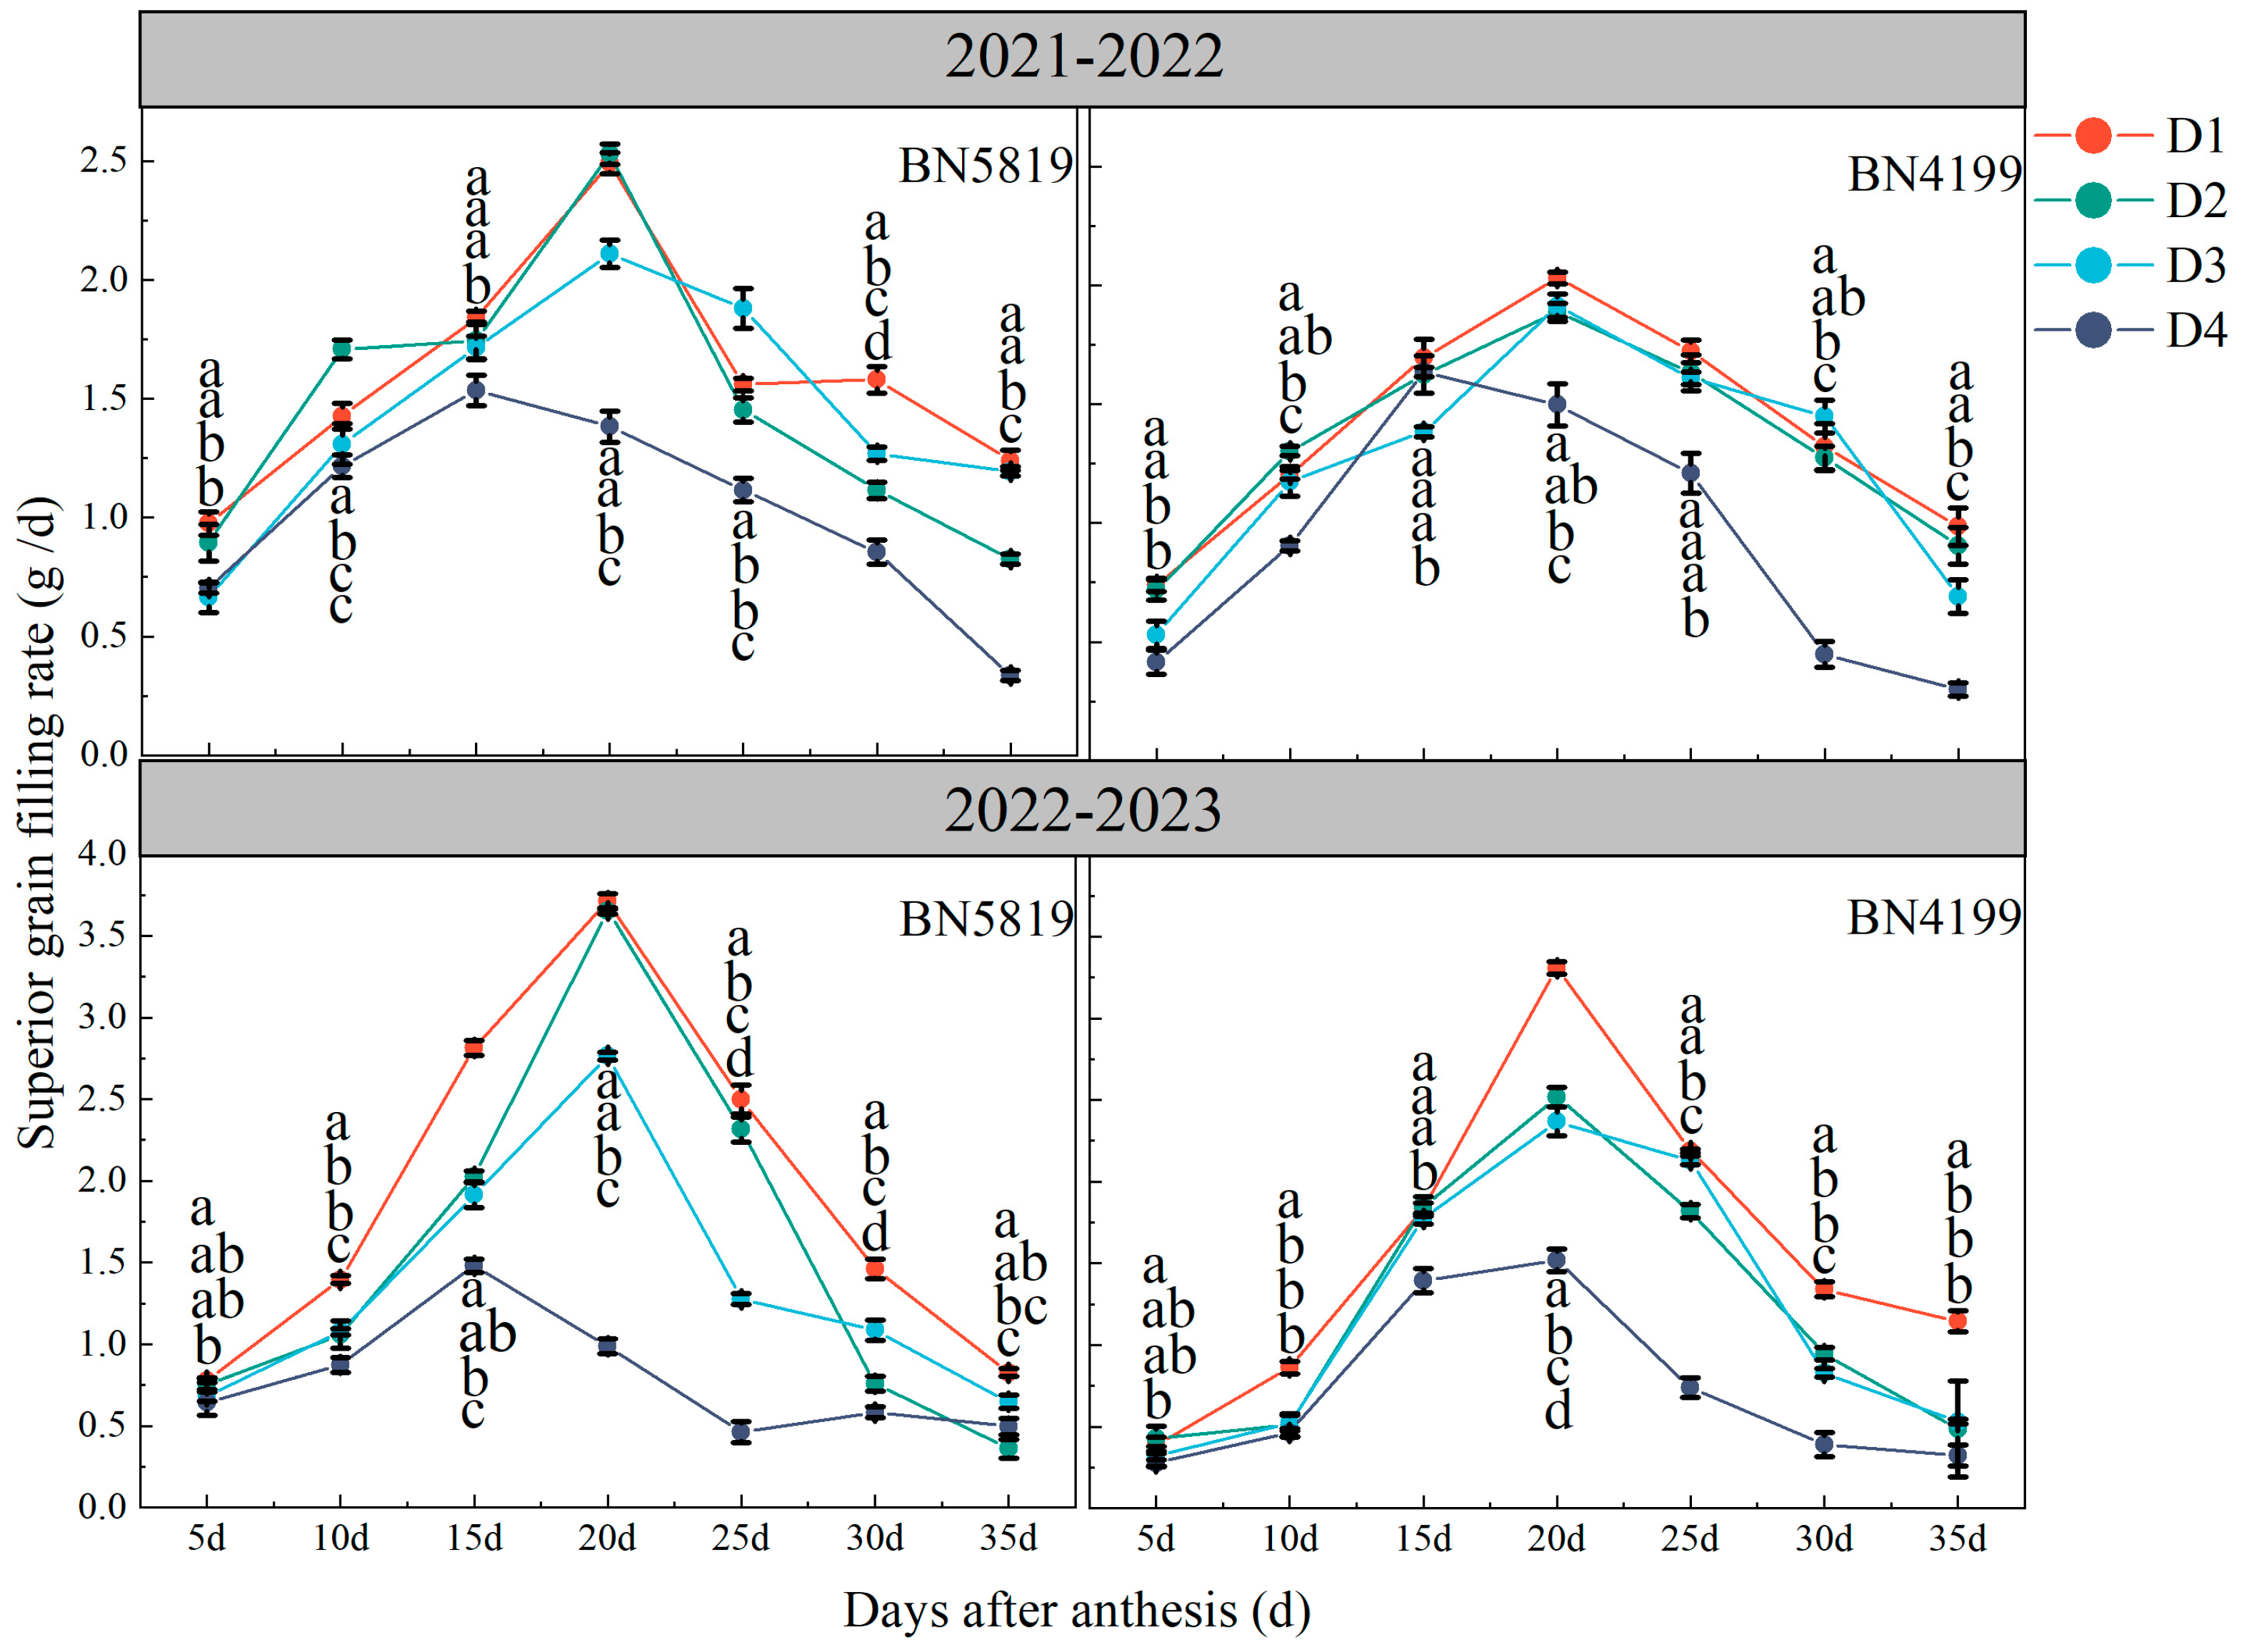
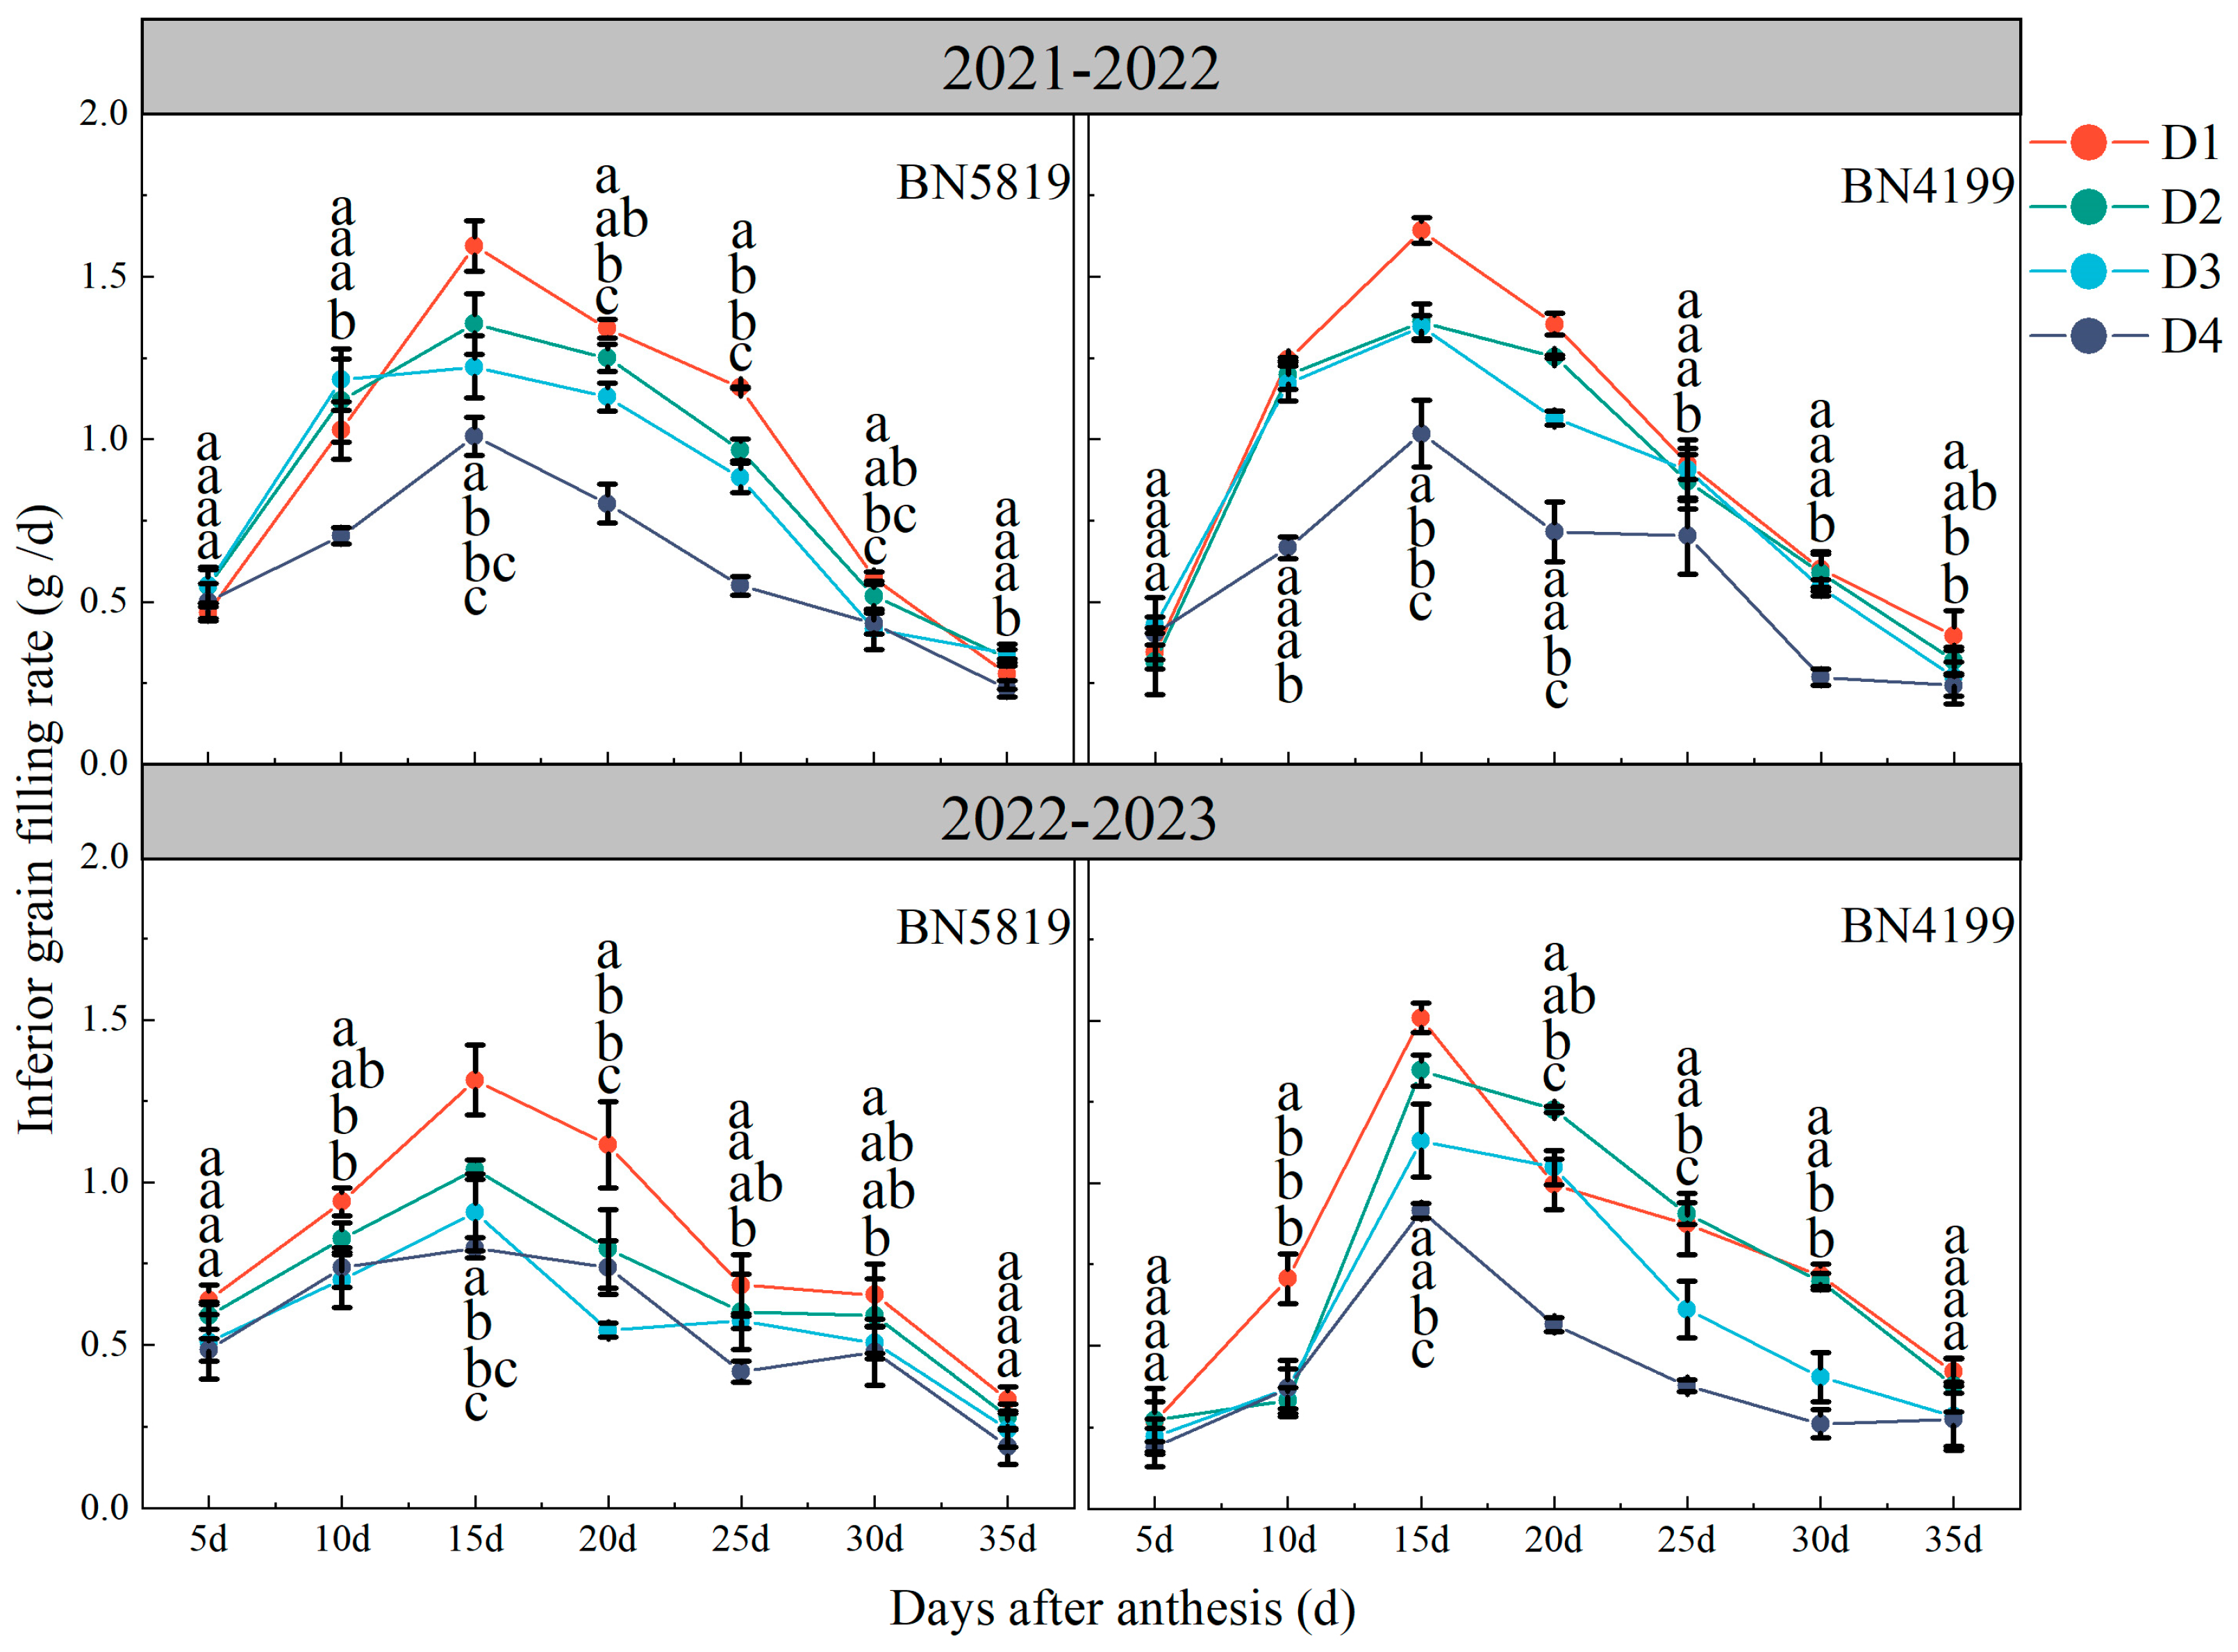
3.4. Grain Filling Rate
3.5. Wheat Spike and Grain Number
3.6. Production Factors and Yield
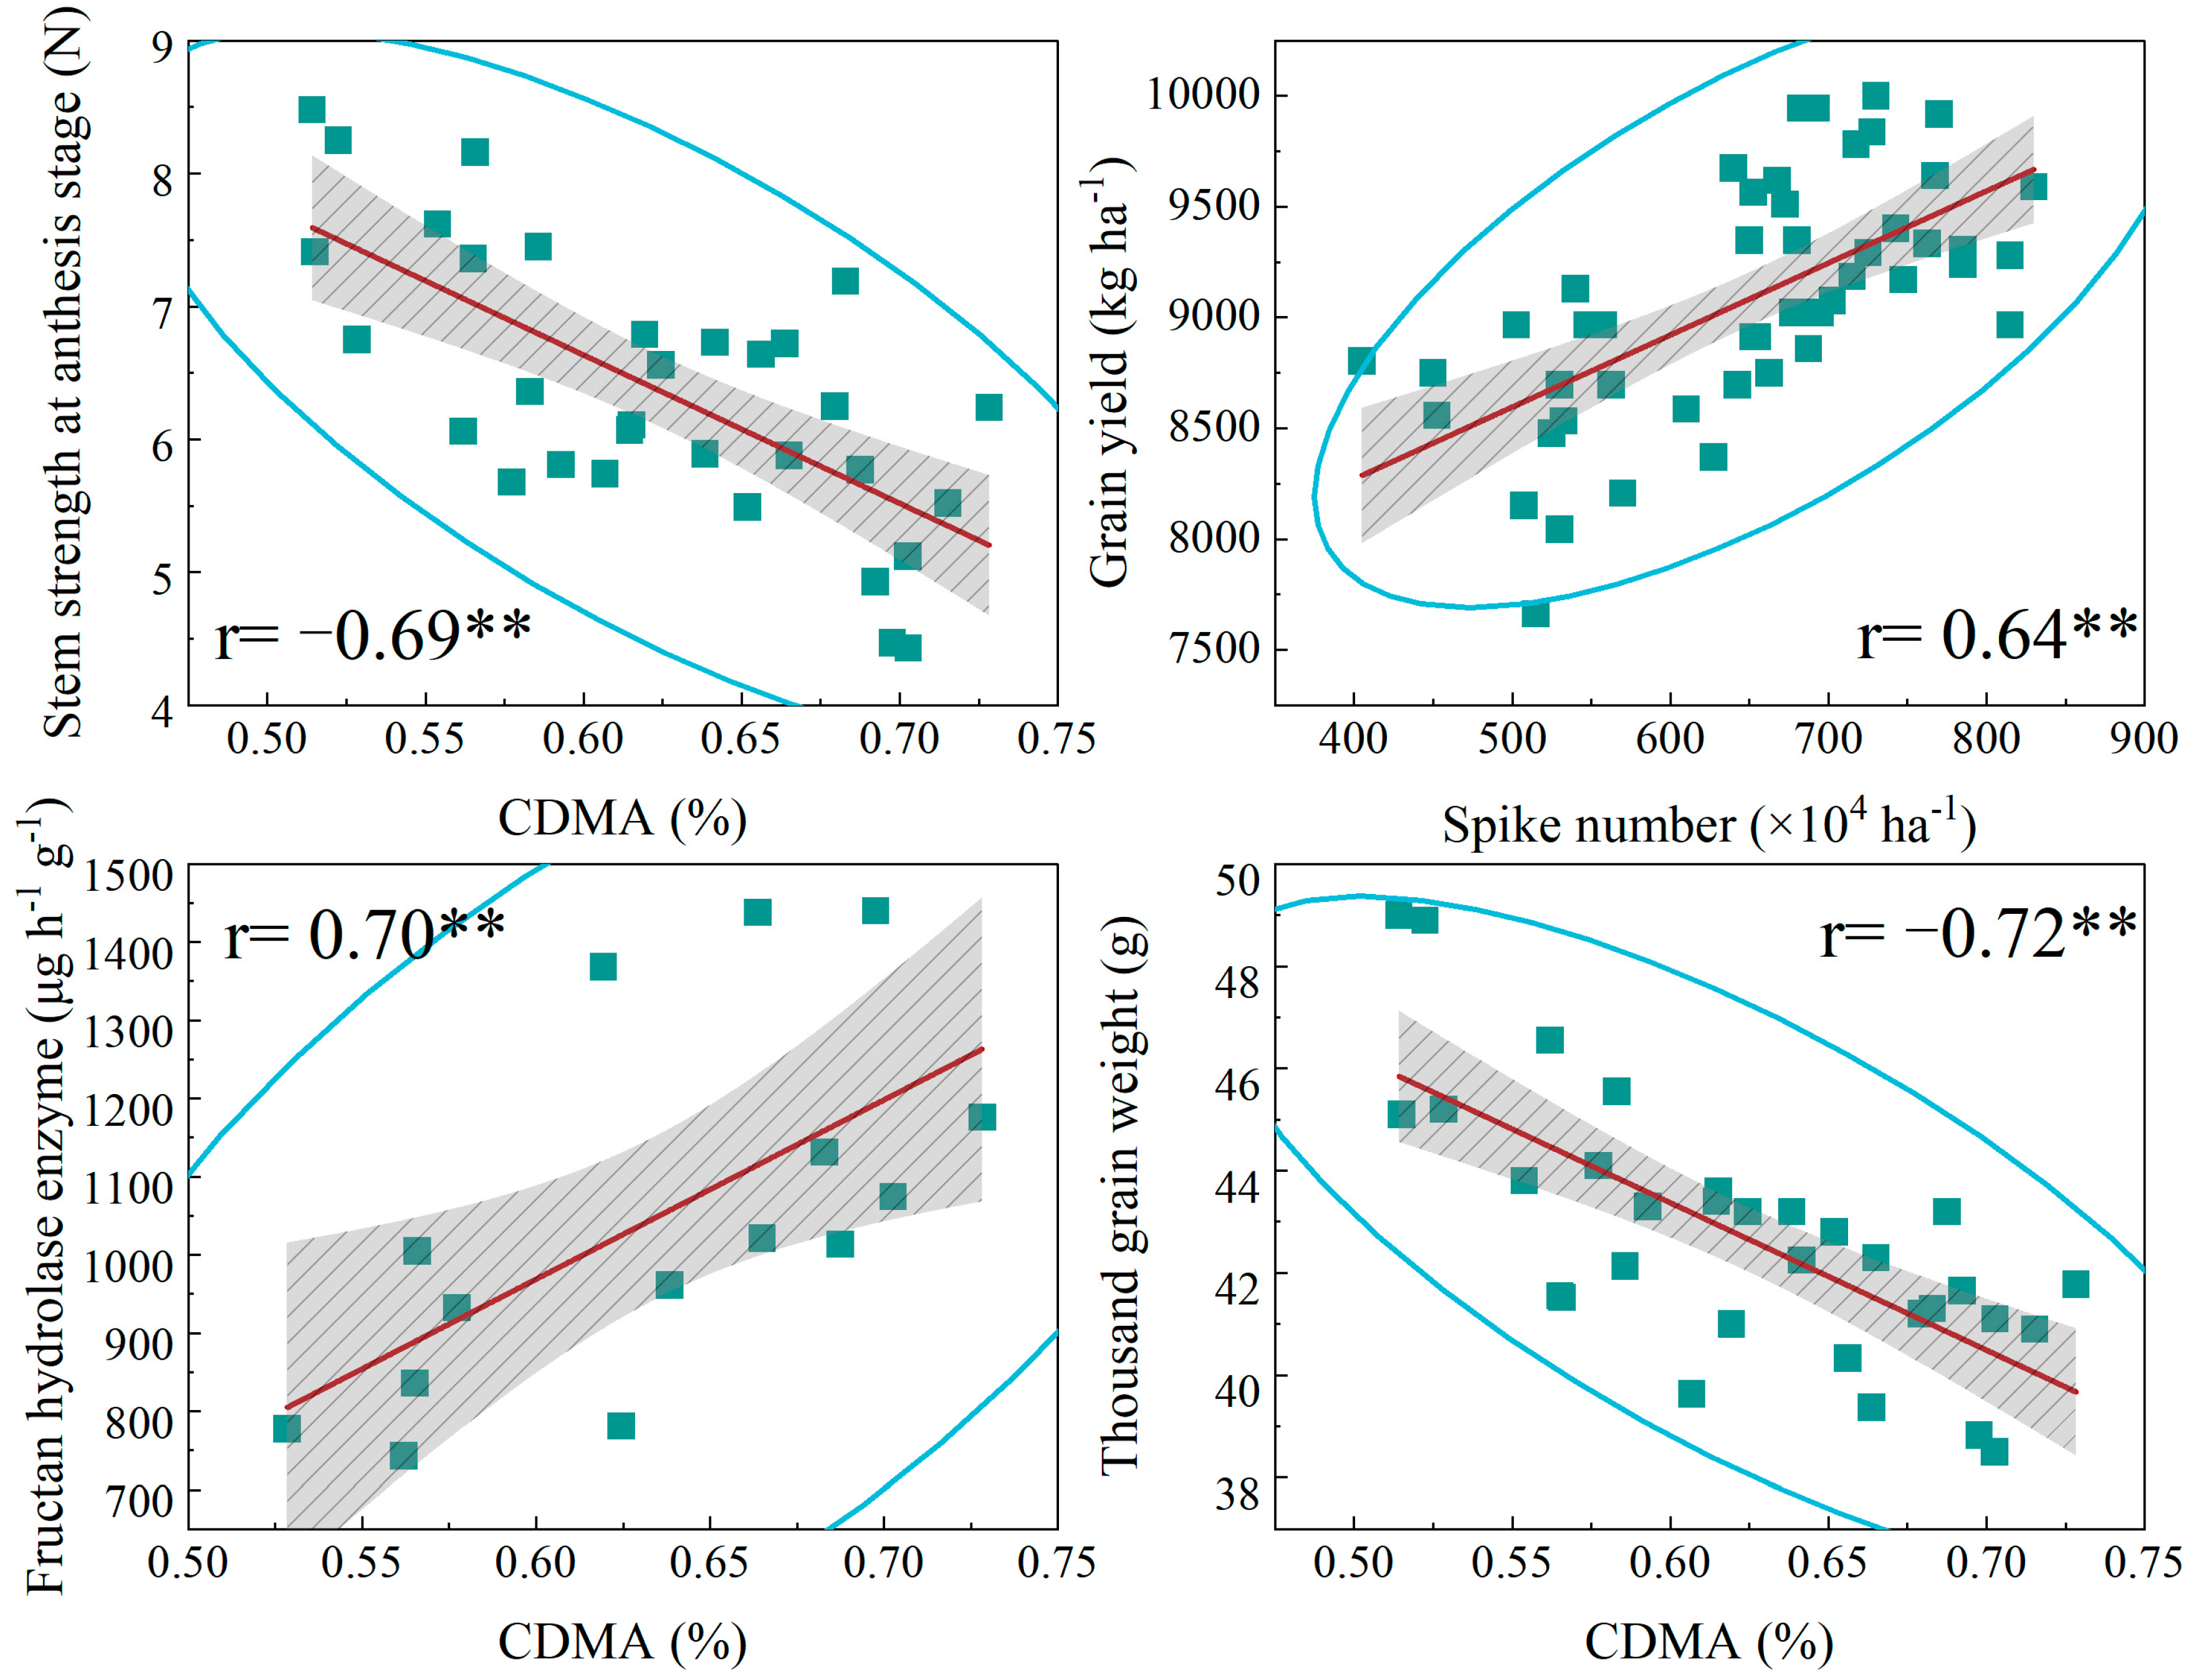
3.7. Correlation Analysis
4. Discussion
5. Conclusions
Author Contributions
Funding
Data Availability Statement
Conflicts of Interest
References
- Lu, J.T.; Peng, Q.Z.; Song, Y.F.; Liu, L.T.; Chen, D.; Huang, P.Y.; Peng, F.C.; Liu, Y.X. Characteristics and effects of global sloping land urbanization from 2000 to 2020. Sci. Total Environ. 2024, 937, 173348. [Google Scholar] [CrossRef] [PubMed]
- Jie, K.; Li, X.Y.; Ji, J.L.; Li, Z.; Xie, Y.; Wang, B.; Zhou, G.S. Response of leaf carbon metabolism and dry matter accumulation to density and row spacing in two rapeseed (Brassica napus L.) genotypes with differing plant architectures. Crop J. 2021, 10, 680–691. [Google Scholar] [CrossRef]
- Brennan, J.; Hackett, R.; McCabe, T.; Grant, J.; Fortune, R.A.; Forristal, P.D. The effect of tillage system and residue management on grain yield and nitrogen use efficiency in winter wheat in a cool Atlantic climate. Eur. J. Agron. 2014, 54, 61–69. [Google Scholar] [CrossRef]
- Rebetzke, G.J.; Ellis, M.H.; Bonnett, D.G.; Condon, A.G.; Falk, D.; Richards, R.A. The Rht13 dwarfing gene reduces peduncle length and plant height to increase grain number and yield of wheat. Field Crops Res. 2011, 124, 323–331. [Google Scholar] [CrossRef]
- Xiang, D.B.; Zhao, G.; Wan, Y.; Tan, M.L.; Song, C.; Song, Y. Effect of planting density on lodging-related morphology, lodging rate, and yield of tartary buckwheat (Fagopyrum tataricum). Plant Prod. Sci. 2016, 19, 479–488. [Google Scholar] [CrossRef]
- Zheng, M.J.; Chen, J.; Shi, Y.H.; Li, Y.X.; Yin, Y.P.; Yang, D.Q.; Luo, Y.L.; Pang, D.W.; Xu, X.; Li, W.Q.; et al. Manipulation of lignin metabolism by plant densities and its relationship with lodging resistance in wheat. Sci. Rep. 2017, 7, 41805. [Google Scholar] [CrossRef]
- Hu, Y.B.; Qin, F.; Wu, Z.; Wang, X.Q.; Ren, X.L.; Jia, Z.K.; Wang, Z.L.; Chen, X.G.; Cai, T. Heterogeneous population distribution enhances resistance to wheat lodging by optimizing the light environment. J. Integr. Agric. 2024, 23, 2211–2226. [Google Scholar] [CrossRef]
- Khan, A.; Liu, H.H.; Ahmad, A.; Xiang, L.; Ali, W.; Khan, A.; Kamran, M.; Ahmad, S.; Li, J.C. Impact of Nitrogen Regimes and Planting Densities on Stem Physiology, Lignin Biosynthesis and Grain Yield in Relation to Lodging Resistance in Winter Wheat (Triticum aestivum L.). Cereal Res. Commun. 2019, 47, 566–579. [Google Scholar] [CrossRef]
- Feng, S.W.; Shi, C.C.; Wang, P.Y.; Ding, W.H.; Hu, T.Z.; Ru, Z.G. Improving stem lodging resistance, yield, and water efficiency of wheat by adjusting supplemental irrigation frequency. Agronomy 2023, 13, 2208. [Google Scholar] [CrossRef]
- Kuai, J.; Sun, Y.Y.; Zhou, M.; Zhang, P.P.; Zuo, Q.S.; Wu, J.S.; Zhou, G.S. The effect of nitrogen application and planting density on the radiation use efficiency and the stem lignin metabolism in rapeseed (Brassica napus L.). Field Crops Res. 2016, 199, 89–98. [Google Scholar] [CrossRef]
- Li, D.X.; Zhang, D.; Wang, H.G.; Li, H.R.; Fang, Q.; Li, H.Y.; Li, R.Q. Optimized Planting Density Maintains High Wheat Yield Under Limiting Irrigation in North China Plain. Int. J. Plant Prod. 2019, 14, 107–117. [Google Scholar] [CrossRef]
- Coetto, E.; Candillo, M.D.; Castelli, F.; Badeck, F.W.; Rizza, F.; Soave, C.; Volta, A.; Villani, G.; Marletto, V. Comparing solar radiation interception and use efficiency for the energy crops giant reed (Arundo donax L.) and sweet sorghum (Sorghum bicolor L. Moench). Field Crops Res. 2013, 149, 159–166. [Google Scholar] [CrossRef]
- Qiu, R.J.; Song, J.J.; Du, T.S.; Kang, S.Z.; Tong, L.; Chen, R.Q.; Wu, L.S. Response of evapotranspiration and yield to planting density of solar greenhouse grown tomato in northwest China. Agric. Water Manag. 2013, 130, 44–51. [Google Scholar] [CrossRef]
- Zhang, H.; Turner, N.C.; Poole, M.L. Source–sink balance and manipulating sink–source relations of wheat indicate that the yield potential of wheat is sink- limited in high-rainfall zones. Crop Pasture Sci. 2010, 61, 852–861. [Google Scholar] [CrossRef]
- Sher, A.; Khan, A.; Ashraf, U.; Liu, H.H.; Li, J.C. Characterization of the effect of increased plant density on canopy morphology and stalk lodging risk. Front. Plant Sci. 2018, 9, 1047. [Google Scholar] [CrossRef]
- Peng, D.L.; Chen, X.G.; Yin, Y.P.; Lu, K.L.; Yang, W.B.; Tang, Y.H.; Wang, Z.L. Lodging resistance of winter wheat (Triticum aestivum L.): Lignin accumulation and its related enzymes activities due to the application of paclobutrazol or gibberellin acid. Field Crops Res. 2014, 157, 1–7. [Google Scholar] [CrossRef]
- Qu, H.J.; Li, J.C.; Shen, X.S.; Wei, F.Z.; Wang, C.Y.; Zhi, S.J. Effects of plant density and seeding date on accumulation and translocation of dry matter and nitrogen in winter wheat cultivar Lankao aizao 8. Acta Agron. Sinica. 2009, 35, 124–131. [Google Scholar] [CrossRef]
- Huang, G.M.; Liu, Y.R.; Guo, Y.L.; Peng, C.X.; Tan, W.M.; Zhang, M.C.; Li, Z.H.; Zhou, Y.Y.; Duan, L.S. A novel plant growth regulator improves the grain yield of high-density maize crops by reducing stalk lodging and promoting a compact plant type. Field Crops Res. 2021, 260, 107982. [Google Scholar] [CrossRef]
- van Loon, M.P.; Adjei–Nsiah, S.; Descheemaeker, K.; Akotsen–Mensah, C.; van Dijk, M.; Morley, T.; van Ittersum, M.K.; Reidsma, P. Can yield variability be explained? Integrated assessment of maize yield gaps across smallholders in Ghana. Field Crop Res. 2019, 236, 132–144. [Google Scholar] [CrossRef]
- Zhi, J.J.; Cao, X.Y.; Zhang, Z.H.; Qin, T.T.; Qu, L.; Qi, L.Y.; Ge, L.W.; Guo, A.X.; Wang, X.T.; Da, C.; et al. Identifying the determinants of crop yields in China since 1952 and its policy implications. Agric. For. Meteorol. 2022, 327, 109216. [Google Scholar] [CrossRef]
- Hachisuca, A.M.M.; Abdala, M.C.; de Souza, E.G.; Rodrigues, M.; Ganascini, D.; Bazzi, C.L. Growing degree-hours and degree-days in two management zones for each phenological stage of wheat (Triticum aestivum L.). Int. J. Biometeorol. 2023, 67, 1169–1183. [Google Scholar] [CrossRef] [PubMed]
- Liu, Y.; Liao, Y.H.; Liu, W.Z. High nitrogen application rate and planting density reduce wheat grain yield by reducing filling rate of inferior grain in middle spikelets. Crop J. 2020, 9, 412–426. [Google Scholar] [CrossRef]
- Zhang, Y.; Dai, X.L.; Jia, D.Y.; Li, H.Y.; Wang, Y.C.; Li, C.X.; Xu, H.C.; He, M.R. Effects of plant density on grain yield, protein size distribution, and breadmaking quality of winter wheat grown under two nitrogen fertilisation rates. Eur. J. Agron. 2016, 73, 1–10. [Google Scholar] [CrossRef]
- Wan, C.X.; Gao, S.; Wang, J.L.; Lei, X.H.; Ge, J.H.; Tao, J.C.; Wang, Q.; Dang, P.F.; Wang, M.; Yang, P.; et al. Optimal planting density combined with phosphorus input promotes common buckwheat resource use efficiency and productivity to increase grain yield. Agric. Water Manag. 2023, 287, 108468. [Google Scholar] [CrossRef]
- Zhu, Y.G.; Liu, J.; Li, J.Q.; Xian, L.S.; Chu, J.P.; Liu, H.; Song, J.; Sun, Y.H.; Dai, Z.M. Delayed sowing increased dry matter accumulation during stem elongation in winter wheat by improving photosynthetic yield and nitrogen accumulation. Eur. J. Agron. 2023, 151, 127004. [Google Scholar] [CrossRef]
- Li, Y.; Cui, Z.Y.; Ni, Y.L.; Zheng, M.J.; Yang, D.Q.; Jin, M.; Chen, J.; Wang, Z.L.; Yin, Y.P. Plant density effect on grain number and weight of two winter wheat cul-tivars at different spikelet and grain positions. PLoS ONE 2016, 11, e0155351. [Google Scholar] [CrossRef]
- Clerget, B.; Bueno, C.; Domingo, A.J.; Layaoen, H.L.; Vial, L. Leaf emergence, tillering, plant growth, and yield in response to plant density in a high-yielding aerobic rice crop. Field Crops Res. 2016, 199, 52–64. [Google Scholar] [CrossRef]
- Yan, Y.; Li, C.S.; Zhang, F.S.; Li, C.J. The causal relationship of the decreased shoot and root growth of maize plants under higher planting density. Plant Nutr. Fert. Sci. 2010, 16, 257–265. [Google Scholar] [CrossRef]
- Antonietta, M.; Fanello, D.D.; Acciaresi, H.A.; Guiamet, J.J. Senescence and yield responses to plant density in stay green and earlier-senescing maize hybrids from Argentina. Field Crops Res. 2014, 155, 111–119. [Google Scholar] [CrossRef]
- Yang, D.Q.; Cai, T.; Luo, Y.L.; Wang, Z.L. Optimizing plant density and nitrogen application to manipulate tiller growth and increase grain yield and nitrogen-use efficiency in winter wheat. PeerJ. 2019, 7, e6484. [Google Scholar] [CrossRef]
- Gao, Y.M.; Zhang, M.; Yao, C.S.; Liu, Y.Q.; Wang, Z.M.; Zhang, Y.H. Increasing seeding density under limited irrigation improves crop yield and water productivity of winter wheat by constructing a reasonable population architecture. Agric. Water Manag. 2021, 253, 106951. [Google Scholar] [CrossRef]
- Xie, Q.; Mayes, S.; Sparkes, D.L. Preanthesis biomass accumulation of plant and plant organs defines yield components in wheat. Eur. J. Agron. 2016, 81, 15–26. [Google Scholar] [CrossRef]
- Naik, B.S.S.S.; Sharma, S.K.; Pramanick, B.; Yadav, S.K.; Reddy, G.K.; Tirunagari, R.; Meena, R.S.; Bamboriya, J.S.; Kumar, M.S.; Gurumurthy, P.; et al. Development of an Improved Silicon Application Protocol for Organic Sweet Corn Cultivation Ensuring Higher Productivity and Better Soil Health. Silicon 2024, 16, 2547–2555. [Google Scholar] [CrossRef]
- Feng, S.W.; Gu, S.B.; Zhang, H.B.; Wang, D. Root vertical distribution is important to improve water use efficiency and grain yield of wheat. Field Crops Res. 2017, 214, 131–141. [Google Scholar] [CrossRef]
- Zhang, H.B.; Han, K.; Gu, S.B.; Wang, D. Effects of supplemental irrigation stage and depth of soil layers expected for water infiltrating on grain yield and water use efficiency in wheat. Master’s Thesis, Shandong Agricultural University, Taian, China, 2015. (In Chinese with an English abstract). [Google Scholar]
- Velikova, P.; Petrov, K.; Petrova, P. The cell wall anchored β-fructosidases of Lactobacillus paracasei: Overproduction, purification, and gene expression control. Process Biochem. 2016, 52, 53–62. [Google Scholar] [CrossRef]
- Yan, S.C.; Wu, Y.; Fan, J.L.; Zhang, F.C.; Guo, J.J.; Zheng, J.; Wu, L.F. Optimization of drip irrigation and fertilization regimes to enhance winter wheat grain yield by improving post-anthesis dry matter accumulation and translocation in northwest China. Agric. Water Manag. 2022, 271, 107782. [Google Scholar] [CrossRef]
- Xu, C.C.; Zhang, P.; Wang, Y.Y.; Luo, N.; Tian, B.J.; Liu, X.W.; Wang, P.; Huang, S.B. Grain yield and grain moisture associations with leaf, stem and root characteristics in maize. J. Integr. Agric. 2022, 21, 1941–1951. [Google Scholar] [CrossRef]
- Arduini, I.; Masoni, A.; Ercoli, L.; Mariotti, M. Grain yield, and dry matter and nitrogen accumulation and remobilization in durum wheat as affected by variety and seeding rate. Eur. J. Agron. 2006, 25, 309–318. [Google Scholar] [CrossRef]
- Xu, C.L.; Gao, Y.B.; Tian, B.J.; Ren, J.H.; Meng, Q.F.; Wang, P. Effects of edah, a novel plant growth regulator, on mechanical strength, stalk vascular bundles and grain yield of summer maize at high densities. Field Crops Res. 2017, 200, 71–79. [Google Scholar] [CrossRef]
- Xue, G.P.; McIntyre, C.L.; Jenkins, C.L.D.; Glassop, D.; van Herwaarden, A.F.; Shorter, R. Molecular dissection of variation in carbohydrate metabolism related to water soluble carbohydrate accumulation in stems of wheat (Triticum aestivum L.). Plant Physiol. 2008, 146, 441–454. [Google Scholar] [CrossRef] [PubMed]
- Wang, X.; Cai, J.; Liu, F.L.; Jin, M.; Yu, H.X.; Jiang, D.; Wollenweber, B.; Dai, T.B.; Cao, W.X. Pre-anthesis high temperature acclimation alleviates the negative effects of post-anthesis heat stress on stem stored carbohydrates remobilization and grain starch accumulation in wheat. J. Cereal Sci. 2012, 55, 331–336. [Google Scholar] [CrossRef]
- Wardlaw, I.F.; Willenbrink, J. Mobilization of fructan reserves and changes in enzyme activities in wheat stems correlated with water stress during kernel filling. New Phytol. 2000, 148, 413–422. [Google Scholar] [CrossRef] [PubMed]
- Zhang, P.; Gu, S.C.; Wang, Y.Y.; Xu, C.C.; Zhao, Y.T.; Liu, X.L.; Wang, P.; Huang, S.B. The relationships between maize (Zea mays L.) lodging resistance and yield formation depend on dry matter allocation to ear and stem. Crop J. 2022, 11, 258–268. [Google Scholar] [CrossRef]
- Jiang, X.L.; Tong, L.; Kang, S.Z.; Li, F.S.; Li, D.H.; Qin, Y.H.; Shi, R.C.; Li, J.B. Planting density affected biomass and grain yield of maize for seed production in an arid region of Northwest China. J. Arid Land. 2018, 10, 292–303. [Google Scholar] [CrossRef]
- Luo, C.L.; Zhang, X.F.; Duan, H.X.; Mburu, D.M.; Kavagi, L.; Naseer, M.; Dai, R.Q.; Nyende, A.B.; Batool, A.; Xiong, Y.C. Allometric relationship and yield formation in response to planting density under ridge-furrow plastic mulching in rainfed wheat. Field Crops Res. 2020, 251, 107785. [Google Scholar] [CrossRef]
- Zheng, J.; Fan, J.L.; Zhang, F.C.; Guo, J.J.; Yan, S.S.; Zhuang, Q.L.; Cui, N.B.; Guo, L. Interactive effects of mulching practice and nitrogen rate on grain yield, water productivity, fertilizer use efficiency and greenhouse gas emissions of rainfed summer maize in northwest China. Agric. Water Manag. 2021, 248, 106778. [Google Scholar] [CrossRef]
- Ferrante, A.; Cartelle, J.; Savin, R.; Slafer, G.A. Yield determination, interplay between major components and yield stability in a traditional and a contemporary wheat across a wide range of environments. Field Crops Res. 2017, 203, 114–127. [Google Scholar] [CrossRef]
- Shah, F.; Coulter, J.A.; Ye, C.; Wu, W. Yield penalty due to delayed sowing of winter wheat and the mitigatory role of increased seeding rate. Eur. J. Agron. 2020, 119, 126120. [Google Scholar] [CrossRef]
- Moreira, A.; Moraes, L.A.C.; Schroth, G.; Mandarino, J.M.G. Effect of nitrogen, row spacing, and plant density on yield, yield components, and plant physiology in soybean-wheat intercropping. Agron. J. 2015, 107, 2162–2170. [Google Scholar] [CrossRef]
- Slafer, G.A.; Savin, R.; Sadras, V.O. Coarse and fine regulation of wheat yield components in response to genotype and environment. Field Crops Res. 2014, 157, 71–83. [Google Scholar] [CrossRef]
- Mondal, S.; Dutta, S.; Crespo-Herrera, L.; Huerta-Espino, J.; Braun, H.J.; Singh, R.P. Fifty years of semi-dwarf spring wheat breeding at CIMMYT: Grain yield progress in optimum, drought and heat stress environments. Field Crops Res. 2020, 250, 107757. [Google Scholar] [CrossRef]
- Feng, F.; Han, Y.L.; Wang, S.N.; Yin, S.J.; Peng, Z.Y.; Zhou, M.; Gao, W.Q.; Wen, X.X.; Qin, X.L.; Siddique, K.H.M. The effect of grain position on genetic improvement of grain number and thousand grain weight in winter wheat in north China. Front. Plant Sci. 2018, 9, 129–138. [Google Scholar] [CrossRef] [PubMed]
- Yang, W.B.; Li, Y.X.; Yin, Y.P.; Qin, Z.L.; Zheng, M.J.; Chen, J.; Luo, Y.L.; Pang, D.W.; Jiang, W.W.; Li, Y.; et al. Involvement of ethylene and polyamines biosynthesis and abdominal phloem tissues characters of wheat caryopsis during grain filling under stress conditions. Sci. Rep. 2017, 7, 46020. [Google Scholar] [CrossRef]
- Tang, Y.L.; Rosewarne, G.M.; Li, C.S.; Wu, X.L.; Yang, W.Y.; Wu, C. Physiological factors underpinning grain yield improvements of synthetic-derived wheat in Southwestern China. Crop Sci. 2015, 55, 98–112. [Google Scholar] [CrossRef]
- Madani, A.; Rad, A.S.; Pazoki, A.; Nourmohammadi, G.; Zarghami, R. Wheat (Triticum aestivum L.) grain filling and dry matter partitioning responses to source: Sink modifications under postanthesis water and nitrogen deficiency. Acta Scientiarum. Agron. 2010, 32, 145–151. [Google Scholar] [CrossRef]
- Fu, J.; Huang, Z.H.; Wang, Z.Q.; Yang, J.C.; Zhang, J.H. Pre-anthesis non-structural carbohydrate reserve in the stem enhances the sink strength of inferior spikelets during grain filling of rice. Field Crops Res. 2011, 123, 170–182. [Google Scholar] [CrossRef]


| Year | Organic Matter (g/kg) | Available N (mg/kg) | Available P (mg/kg) | Available K (mg/kg) | Soil PH |
|---|---|---|---|---|---|
| 2021–2022 | 17.01 | 106.33 | 28.23 | 157.33 | 7.12 |
| 2022–2023 | 16.58 | 104.28 | 30.3 | 164.63 | 7.02 |
| Variety | Planting Density | Sterile Spikelet (Number/Spike) | Inferior Grains (Number/Spike) | Superior Grains (Number/Spike) | Inferior Grains (Number/per Area) | Superior Grains (Number/per Area) |
|---|---|---|---|---|---|---|
| 2021–2022 | ||||||
| BN5819 | D1 | 2.10 d | 10.83 a | 22.88 d | 670.50 a | 2417.00 d |
| D2 | 2.95 c | 8.00 b | 26.63 c | 533.00 b | 2680.00 c | |
| D3 | 3.79 b | 6.50 c | 29.88 b | 526.00 b | 4481.00 a | |
| D4 | 4.41 a | 4.33 d | 35.25 a | 506.00 b | 3214.50 b | |
| BN4199 | D1 | 2.10 c | 12.50 a | 26.13 d | 731.00 a | 1715.00 d |
| D2 | 3.54 b | 11.17 b | 28.00 c | 618.00 b | 2599.00 c | |
| D3 | 4.26 a | 8.33 c | 29.75 b | 437.00 c | 4251.50 a | |
| D4 | 4.49 a | 6.17 d | 32.38 a | 336.00 d | 3085.00 b | |
| F-Value | Variety level (V) | 8.26 ** | 188.48 ** | 3.37 NS | 1.14 NS | 13.26 * |
| Planting density (P) | 115.85 ** | 236.76 ** | 188.94 ** | 166.65 ** | 1316.09 ** | |
| V × P | 2.26 NS | 3.78 * | 20.24 ** | 41.56 ** | 27.76 ** | |
| 2022–2023 | ||||||
| BN5819 | D1 | 2.74 d | 10.33 a | 23.38 d | 1176.00 a | 2509.00 d |
| D2 | 4.44 c | 8.33 b | 25.38 c | 760.50 b | 3097.00 c | |
| D3 | 4.97 b | 7.33 c | 27.50 b | 449.50 c | 4106.50 a | |
| D4 | 6.41 a | 3.67 d | 30.63 a | 418.00 c | 3380.50 b | |
| BN4199 | D1 | 2.23 d | 12.67 a | 25.38 d | 1152.00 a | 3094.50 d |
| D2 | 3.03 c | 10.67 b | 27.13 c | 1106.50 a | 3440.50 c | |
| D3 | 4.46 b | 8.33 c | 30.63 b | 817.00 b | 4095.00 a | |
| D4 | 5.90 a | 7.33 d | 33.63 a | 680.00 c | 3763.00 b | |
| F-Value | Variety level (V) | 40.28 ** | 490.00 ** | 615.31 ** | 48.60 ** | 376.48 ** |
| Planting density (P) | 262.68 ** | 142.65 ** | 479.81 ** | 184.44 ** | 129.91 ** | |
| V × P | 5.50 ** | 6.53 ** | 5.06 ** | 18.80 ** | 6.74 ** |
| Variety | Planting Density | Spike Number (×104 ha−1) | Grains per Spike | 1000-Grain Weight (g) | Grain Yield (kg ha−1) |
|---|---|---|---|---|---|
| 2021–2022 | |||||
| BN5819 | D1 | 435.83 c | 43.77 a | 48.92 a | 8704.39 b |
| D2 | 548.33 b | 40.14 b | 46.23 b | 9021.78 b | |
| D3 | 647.50 a | 38.25 c | 43.40 c | 9529.03 a | |
| D4 | 670.83 a | 36.32 d | 43.03 de | 9094.25 b | |
| BN4199 | D1 | 521.67 d | 43.85 a | 45.20 a | 8731.93 c |
| D2 | 664.17 c | 38.90 b | 43.78 b | 9347.87 b | |
| D3 | 710.00 b | 38.53 b | 42.47 c | 9909.47 a | |
| D4 | 755.00 a | 36.90 c | 41.53 c | 9799.11 a | |
| F-value | Variety level (V) | 108.59 ** | 0.14 NS | 565.31 ** | 50.06 * |
| Planting density (P) | 225.32 ** | 175.96 ** | 278.33 ** | 21.77 ** | |
| V × P | 2.52 NS | 3.01 ** | 22.04 ** | 2.31 NS | |
| 2022–2023 | |||||
| BN5819 | D1 | 517.50 d | 44.27 a | 42.75 a | 7952.94 c |
| D2 | 626.67 c | 40.32 b | 42.07 ab | 8550.77 b | |
| D3 | 706.67 b | 38.92 c | 41.38 b | 9438.45 a | |
| D4 | 749.17 a | 36.13 d | 40.93 b | 9221.06 a | |
| BN4199 | D1 | 552.50 d | 43.70 a | 41.64 a | 8460.19 c |
| D2 | 681.67 c | 39.92 b | 40.38 b | 8876.86 bc | |
| D3 | 763.33 b | 37.98 c | 39.74 bc | 9325.41 a | |
| D4 | 820.00 a | 34.30 d | 38.70 c | 9279.76 ab | |
| F-value | Variety level (V) | 28.53 * | 3.71 NS | 24.95 * | 18.17 NS |
| Planting density (P) | 174.63 ** | 214.75 ** | 6.33 ** | 23.73 ** | |
| V × P | 0.80 NS | 1.64 * | 0.32 NS | 1.56 NS |
Disclaimer/Publisher’s Note: The statements, opinions and data contained in all publications are solely those of the individual author(s) and contributor(s) and not of MDPI and/or the editor(s). MDPI and/or the editor(s) disclaim responsibility for any injury to people or property resulting from any ideas, methods, instructions or products referred to in the content. |
© 2024 by the authors. Licensee MDPI, Basel, Switzerland. This article is an open access article distributed under the terms and conditions of the Creative Commons Attribution (CC BY) license (https://creativecommons.org/licenses/by/4.0/).
Share and Cite
Feng, S.; Shi, C.; Wang, P.; Chang, S.; Liu, C.; Shen, C.; Li, S.; Hu, T.; Ru, Z. Optimizing Wheat Planting Density by Adjusting Population Structure and Stabilizing Stem Strength to Achieve High and Stable Yields. Agronomy 2024, 14, 1853. https://doi.org/10.3390/agronomy14081853
Feng S, Shi C, Wang P, Chang S, Liu C, Shen C, Li S, Hu T, Ru Z. Optimizing Wheat Planting Density by Adjusting Population Structure and Stabilizing Stem Strength to Achieve High and Stable Yields. Agronomy. 2024; 14(8):1853. https://doi.org/10.3390/agronomy14081853
Chicago/Turabian StyleFeng, Suwei, Chenchen Shi, Peiyu Wang, Sujing Chang, Chaoyang Liu, Chenwei Shen, Shilong Li, Tiezhu Hu, and Zhengang Ru. 2024. "Optimizing Wheat Planting Density by Adjusting Population Structure and Stabilizing Stem Strength to Achieve High and Stable Yields" Agronomy 14, no. 8: 1853. https://doi.org/10.3390/agronomy14081853