Abstract
RD6, the most popular glutinous rice in Thailand, is high in quality but susceptible to blast and bacterial blight disease. It was thus improved for disease resistance through marker-assisted backcross selection (MAS). The objective of this study was to evaluate the performance of improved near isogenic lines. Eight RD6 rice near isogenic lines (NILs) derived from MAS were selected for evaluation with RD6, a standard susceptible check variety, as well as recurrent parent for a total of nine genotypes. The experiment was conducted during the wet season under six environments at three locations, Khon Kaen, Nong Khai, and Roi Et, which was repeated at two years from 2019 to 2020. Nine genotypes, including eight RD6 rice near isogenic lines (NILs) selected from two in-tandem breeding programs and the standard check variety RD6, were evaluated to select the high-performance new improved lines. The first group, including four NILs G1–G4, was gene pyramiding of blast and BB resistance genes, and the second group, including another four NILs G5–G8, was gene pyramiding of blast resistance and salt tolerance genes. Field disease screening was observed for all environments. Two disease occurrences, blast (leaf blast) and bacterial blight, were found during the rainy season of all environments. The NILs containing blast resistance genes were excellent in gene expression. On the other hand, the improved lines containing the xa5 gene were not highly resistant under the severe stress of bacterial blight (Nong Khai 2020). Notwithstanding, G2 was greater among the NILs for yield maintenance than the other genotypes. The agronomic traits of most NILs were the same as RD6. Interestingly, the traits of G2 were different in plant type from RD6, specifically photosensitivity and plant height. Promising rice RD6 NILs with high yield stability, good agronomic traits, and disease resistance were identified in the genotypes G1, G2, and G7. The high yield stability G1 and G7 are recommended for widespread use in rain-fed areas. The G2 is specifically recommended for use in the bacterial blight (BB) disease prone areas.
1. Introduction
Glutinous rice (sticky rice) is a type of rice found mainly in Southeast Asia countries (ASEAN), especially along the Me Kong subregion as Thailand, Lao PDR, Myanmar, Vietnam, and Cambodia, including the Southwestern area of China [1]. The unique characteristics of glutinous rice are its opaque appearance (white color grain), low amylose content, and soft texture because of the high amylopectin content, which make it a common staple for food, desserts, and drinks [2]. Amylose content is related to starch, and the loose network structures found in glutinous rice result in a low amylose content [3]. Even though glutinous rice is of low economic value, it is a strategic crop that more than 20 million people consume on a daily basis [1], and it is especially believed to provide basic nutritional security to rice farmers and their families [4]. In Thailand, glutinous rice is omnipresent and mostly consumed in the Northeastern regions where approximately 17% [5] of the land is affected by salt caused by underground salt rock [6]. The glutinous rice variety most famous in Thailand is the RD6 cultivar due to greater cooking and eating quality, like softness, stickiness, and fragrant aroma [7]. The RD6 variety is only one glutinous rice from three cultivars, including Khaw Dwak Mali 105 and RD15, which occupies lowland rain-fed areas the comprise over 70 percent of Northeastern Thailand. The RD6 rice variety has been approved since 1977, which, given its long time in use, is developed from KDML105 by a mutation method using gamma ray treatment. The mutant RD6 variety was changed to be glutinous rice with a low amylose content, but it still presents most of the agronomic traits of the parent, such as plant height, grain shape, and photo sensitivity, while disease susceptibility, including bacterial blight (BB) and blast disease, and saline soil influence plant growth and yield.
RD6 was susceptible to most Thailand local blast isolates collected from a diverse outbreak area [8], which genotype is confirmed by microsatellite franking marker. In addition, blast susceptibility of the RD6 variety was demonstrated under field conditions by natural infection with mixed isolates during 2015–2018 at Khon Kaen province, Thailand. The result indicated that RD6 was susceptible to blast disease [9]. Meanwhile, RD6 is also susceptible to BB disease infection in both greenhouse and field conditions. The greenhouse condition was confirmed during 2015–2016, which evaluated through disease scoring based on lesion length on symptomatic rice leaves at day 14 post-inoculation; the result clearly showed that RD6 varieties were more susceptible to BB disease infection of various isolates compared with resistance varieties [10]. RD6 presented high susceptibility to salinity conditions, which affected plant growth at the seedling stage, confirmed under greenhouse conditions by validating twenty-one day seedlings on a salt solution and artificial soil salinity; the result showed that RD6 was highly susceptible for both conditions with a saline concentration of 12 dS m−1 [7]. After a breeding program, similar to each other, salinity evaluation under paddy field conditions at Northeastern Thailand, the yield of a salinity-susceptible rice variety decreased with increasing salinity levels above 8 dS m−1 [11].
To solve these constraints, Rice Project, Khon Kaen University located at Northeastern of Thailand has developed the glutinous rice RD6 for disease resistance specially focused on BB, blast resistance, and salt tolerance. The RD6 cultivar was bred for resistance to BB and blast disease with tolerance for saline soil by gene pyramiding into the RD6 parent. RD6 blast resistance was improved by pyramiding various resistance genes on chromosomes 1, 2, 11, and 12 into the RD6 cultivar through marker-assisted selection (MAS); the product has strength RD6 NILs [8]. Continuously, RD6 development for various disease resistance was the destination for BB and blast resistance with gene pyramiding using MAS. RD6 NILs were produced from this research and possessed a total of five genes with four blast and one BB resistance genes; the NILs showed a greater resistance level for blast and BB diseases than its parent at the seedling stage [12]. Furthermore, RD6 gene pyramiding was also developed for blast resistance plus saline soil tolerance, using the developed method as mentioned before. MAS was used for genotypic and phenotypic selection through the breeding steps to deliver promising lines. The experiments were conducted under greenhouse conditions by artificial inoculation for blast via the upland-short row and salt tolerance validated in a salt solution and artificial soil salinity. RD6 NILs were satisfied for both blast resistance and salt tolerance validation, and the NILs were greater than RD6, including other susceptible check varieties [7]. After a breeding program, the plant breeder will investigate yield and its contributed performance of new improved genotypes across several environments (multi-environment trials; MET) to select and recommend a superior genotype for a target environment. This is because genotypes respond differently to changing environments, which causes yield instability [13]. This yield instability is referred to as genotype by environment (GE) interaction. To define the presence of GE interaction in a MET, a data visualization tool, namely genotype by environment interaction (GGE biplot), is applied. GGE biplot is an effective tool to evaluate genotype evaluation and mega-environment identification of each genotype [14]. GGE biplot was successfully used for GE interaction and yield stability in several crops [15,16,17], including rice [18]. Therefore, in this study, the NILs were selected for field evaluation in Northeastern Thailand. Field evaluation was conducted at multiple locations in the vicinity of the area. The experiment was specially focused on the performance of NILs, including yield, agronomic traits, and field disease resistance by natural disease infection. The objective of this study was to evaluate RD6 NILs for yield performance under pressure of disease infections.
2. Materials and Methods
2.1. Plant Materials
Rice RD6 NILs obtained from MAS were selected from two breeding programs, with entry numbers 1–4 selected from pyramiding genes of blast and bacterial blight resistance. The line numbers 1–3 contained blast resistance genes on 4 chromosomes [qBLch1, 2, 11, 12] and xa5 recessive gene for BB resistance, whereas line number 4 carried only 4 blast resistance genes [qBLch1 and 2 are major, while qBLch11 and 12 are minor QTLs]. Other groups with entry numbers 5–8 were selected from pyramiding genes of blast resistance plus salt tolerance; the NILs were common in containing salt tolerance gene Salt1 but differed in the number of blast resistance genes, as number 5 contained four genes, qBLch1, 2, 11, and 12; number 6 contained three genes, qBLch1, 11, and 12; number 7 contained two genes, qBLch11, and 12; and number 8 contained two genes, qBLch1, and 11 [7,12]. The eight NILs were evaluated together with the standard check variety RD6. A total of 9 rice genotypes were evaluated in this experiment (Table 1).

Table 1.
Rice genotypes with trait of improvement and genes/QTLs contained.
2.2. Experimental Sites, Experimental Design, and Field Management
The experiment was conducted in Northeastern Thailand under paddy field conditions in the wet season of the years 2019 and 2020. The experiment site was spread over three diverse locations in each year. The first location was Khon Kaen province (16°45′10″ N 102°37′58″), almost the heartland of the region, which reported natural blast disease infection [9]. The second site was Nong Khai province (17°51′0″ N 102°35′6″ E), the uppermost area of the region close to the Mekong River. This area has high rainfall amounts. The last location was Roi Et province (15°36′33″ N 103°48′1″ E), the largest area for high quality jasmine rice production with an arid and saline territory [19].
The experimental design was laid out by a randomized complete block (RCB) design with 3 replications of each individual site. Seedling preparation of individual sites followed the layout of each site; one thousand seeds per plot were prepared in a labeled zip-lock bag. Seeds were soaked for 24 h, drained, and incubated for another 24 h to induce germination. The nursery soil preparation was performed fifteen days before sowing; the soil was prepared by sieving and mixed well, weighed equally, and put into 30 cm diameter submerged pots and soaked until the sowing date. The 30-day seedlings were transplanted into the field plot with three seedlings per hill with a spacing of 25 × 25 cm between plant and row inside a plot size of 2 × 4 m (8 m2). Field management, including weeding, pest, and pathogen, was controlled manually. Fertilizer was applied following the recommendation of the Department of Agriculture of Thailand. The fertilizer formula used was 16-20-0 for clay soil at a rate of 50 kg ha–1:62.5 kg ha–1:0 kg ha–1 (N:P2O5:K2O) and 16-8-8 for sandy loam soil at a rate of 50 kg ha–1:25 kg ha–1:25 kg ha–1 (N:P2O5:K2O).
2.3. Soil Evaluation and Rainfall Measurements
Soil sampling was randomized following soil sampling guidelines [20]. A soil core was used for sampling 30 cm of soil depth. The randomized area was nine points spread around the experimental area of each site. Soil samples were analyzed by the Soil Laboratory of Khon Kaen University; the soil analysis focused on soil texture, EC, and soil nutrients.
The rainfall data used were manually recorded by a rain gauge at each individual experimental site. The rainfall data were an accumulation of twenty-four hours of a daily record for individual rainy days; the rainfall record duration of individual sites started from the transplanting date and finished on the harvest date.
2.4. Morphological Evaluation of Rice Traits
Morphological recording was focused on flowering date, plant height, and tiller number. Flowering date was recorded when the plant of each plot would start flowering; half the amount of flowered plants of each plot were recorded at days to 50% flowering. Plant height of each plot was measured from 4 plants randomly from the plot center at ripening stage, measuring from the ground surface along to the plant tip. Tiller number was recorded at the maximum tiller stage, which averaged 4 hills randomized from the plot center.
2.5. Yield and Yield Components
Yield evaluation data were collected from the data from the harvesting area of the plot inside 4 m2 or 64 hills without border effects. The harvest date of the individual plot was based on 30 days after the 50% flowering date of each plot. Rice grains were collected together with a label inside a net bag, and seed moisture was decreased by sundry under a translucent air flow greenhouse; fourteen percent seed moistures of individual plots were threshed and processed, and perfectly filled seed of each plot were measured by a digital weighing scale, which converted into weight per hectare.
Yield components were recorded for panicle number, harvest index, seed per panicle, sample seed weight, and seed size. Panicle number was recorded by the average from 4 hills randomized on the center of each plot without border effects; record time was conducted on grain filling stage by manual numerate observation. The harvest index was the harvest of 4 whole plants randomized from the harvest area of each plot collected in a net bag together with a label inside; biological yield and economic yield after sundry were measured by a digital weighing scale (HI = Biological yield/Economic yield; Dry grain yield/Total dry weight). Seed per panicle was collected from 4 perfect panicles randomized from each plot after harvest. The yield, harvest index, and number of seeds per panicle were averaged from filled seed of four panicles collected. Sample seed weight was conducted after yield weighing by preparing 1000 perfectly filled seeds per plot from seed yield, which was measured by a digital weighing scale. Seed size was averaged from the measurement of 10 paddy seeds randomized from the seed yield and measured by a vernier caliper.
2.6. Disease Screening/Index
Prior to conducting NILs evaluation, all improved lines were tested for disease resistance via artificial inoculation against some isolate pathogens. This research was in stage of multilocational trial to confirm their resistance to different combinations of natural pathogens in individual sites. The improved lines were preliminarily evaluated by artificial inoculation and then evaluated under natural infection in this study. Disease evaluation followed the severity scale of the Standard Evaluation System for rice (SES) [21,22]. Disease severity scores were recorded from slight symptom to higher severity from ten hills of each plot. The lowest severity scores were based to analyze and categorize resistance levels (Table 2 and Table 3) [23].
Table 2.
Scale for blast disease observation.
Table 3.
Disease severity score for bacterial blight infection on rice under field conditions.
2.7. Statistical Analysis
Individual data were analyzed via analysis of variance (ANOVA) following a randomized complete block (RCB) design. Prior to combined analysis, the normality and homogeneity of the data from all environments were verified. A combined analysis was used to analyze the interaction of genotype and environment (GxE interaction). A least significance difference (LSD) at p < 0.05 [24] was used for mean comparison for quantitative data. Yield stability and yield response were analyzed consistent with the AMMI model (cluster dendrogram and GGE-biplot); yield stability and yield response analyses were carried out using R software Version 4.0.2 [25,26].
3. Results
3.1. Environment Characterizations
Environmental data were collected for climate data and disease occurrence. The climate data collected were rainfall with distribution, soil properties, and altitude; the data were used together from other experiments, such as the field evaluation of KDML105 introgression lines [27] (Figure 1). Disease occurrence of blast and bacterial blight (BB) was found and recorded.
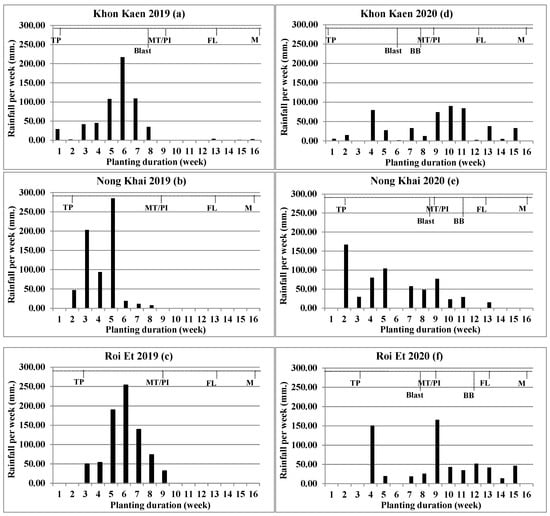
Figure 1.
Rainfall (mm) per week during experimental planting of individual six environments: Khon Kaen 2019 (a), Nong Khai 2019 (b), Roi Et 2019 (c), Khon Kaen 2020 (d), Nong Khai 2020 (e), and Roi Et 2020 (f). TP = Transplant, MT/PI = Maximum tiller number/Panicle primodia initiation, FL = Flowering, M = Maturity, Blast = Blast disease screening, BB = Bacterial blight disease screening.
The altitudes of the experimental area ranged from 120 to 220 m above sea level (MASL); the Khon Kaen site was higher than Nong Khai and Roi Et, respectively. Soil textures were different among the locations; Khon Kaen and Roi Et had sandy loam soil, and Nong Khai had clay soil. Rainfall data among the environments were different for the number of rainy days, number of rainy weeks, and total rainfall value (Table 4).
Table 4.
Environment data: altitude, soil texture, and rainfall during experiments.
Rainfall of all environments had an equivocal difference among the sites. The rain accumulates ranged from 501.1 to 740.5 mm; the higher rainfall accumulate environment is Roi Et 2019, followed by Nong Khai 2019, Nong Khai 2020, Roi Et 2020, Khon Kaen 2019, and Khon Kaen 2020, respectively. Overall, rain accumulates for all three locations in 2019 were higher than those in 2020. However, rainfall distributions were not related to rainfall accumulations. In 2020, there was a wider rain distribution than in 2019. The number of rainy days for Khon Kaen 2020 was higher than 2019 with 41 and 28 days, respectively; the number of rainy days for Nong Khai location in 2020 was higher than 2019 with 34 and 29 days, respectively; but for the Roi Et location, there was no statistically significant difference, with 33 rainy days in both years. In addition, the number of rainy weeks was evidently concerned, which, in 2020, all locations had a wider rain distribution than 2019. The result indicated, in year 2019, there was a short rainfall distribution with heavy rain; the rain accumulation per week showed the highest peak at above 200 mm/week, with less rainfall after the maximum tiller (MT) stage. In year 2020, rainfall was substantially widely distributed, with rainfall accumulation per week showing a wide distribution from the start of planting (TP) until the flowering-grain filling stage.
In this study, two disease occurrences, blast and BB, were encountered. Blast disease infections were found at four environments: Khon Kaen 2019, Khon Kaen 2020, Nong Khai 2020, and Roi Et 2020. BB disease infections were found at three environments conducted in 2020: Khon Kaen 2020, Nong Khai 2020, and Roi Et 2020. The comparison among experiment years showed that the year 2020 was found to be greater than the year 2019 in disease occurrence, which was related to longer rainfall distributions, an important factor for both disease spread and occurrence.
3.2. Blast and Bacterial Blight Disease Virulence
Blast disease score of virulence was found at four environments: Khon Kaen 2019, Khon Kaen 2020, Nong Khai 2020, and Roi Et 2020. The grand mean of severity score was found at Khon Kaen 2020, with an average score of 2.69, followed by Khon Kaen 2019, with an average score of 1.89, while Nong Khai 2020 and Roi Et 2020 had average scores of 1.03 and 0.81, respectively. The effect of experimental site on severity score was highly significant (p ≤ 0.01). The RD6 variety was found to be blast susceptible, as a higher disease score than that of the NILs was observed. All of the blast resistance NILs were great in gene expression for blast resistance, with scores lower than RD6. At the Khon Kaen 2019 site, the NILs were strong in resistance to blast, with a slight score of 1.12–1.50, which is still significant among the NILs due to its difference in genetic introgressed. Meanwhile, the RD6 variety appeared as highly susceptible, with a blast score of 6.42. For the Khon Kaen 2020 site, the rice NILs had scores that ranged from 1.97 to 3.01, which was not different among the lines, while the RD6 variety showed a higher blast score than the NILs at 4.29. At the Nong Khai 2020 site, slight blast disease symptom was shown on the NILs, with scores ranging from 0.57 to 1.17, which slightly differed among the lines, and the RD6 variety showed a higher blast score of 3.13. The last site of blast observation was Roi Et 2020, also having slight blast symptom; the rice NILs had scores ranging from 0.50 to 0.80, which is not different among the lines, and the RD6 variety showed a higher blast score of 2.90 (Table 5).
Table 5.
Disease score for blast and bacterial blight observed from 4 experimental sites in the year 2020.
BB virulence was found at only three sites evaluated in 2020. The BB scoring comparison of each site showed a significant difference (p ≤ 0.05) for Khon Kaen 2020 and highly significant difference (p ≤ 0.01) for Nong Khai 2020 and Roi Et 2020. The highest average BB score was found at Nong Khai, with an average score of 4.44, whereas at the inferior sites, Khon Kaen and Roi Et had average scores of 4.17 and 3.30, respectively. Interestingly, the NIL BC2F5 2-8-2-26-1 was the lowest in severity score over the other lines at all three sites. In contrast, RD6 was the most susceptible over all entries at all three sites. Moreover, NIL BC2F5 2-8-2-26-1 was greater than the other NILs carrying the xa5 gene for BB resistance. It demonstrated the expression of horizontal BB resistance (Table 5).
3.3. Yield Evaluation on Multi-Environments
Yield evaluation over six environments showed a high significance among sites (p ≤ 0.01) but not significant between genotypes. Moreover, an interaction between environment and genotype (GxE effect) was detected at p ≤ 0.05 (Table 6).
Table 6.
Combined analysis for grain yield of rice RD6 NILs.
Yield comparison among the environments showed that Khon Kaen 2019 had a higher yield, followed by Nong Khai 2020, Khon Kaen 2020, Roi Et 2020, Roi Et 2019, and Nong Khai 2019, with grain yields of 3535, 3484, 3195, and 3087 kg/ha−1, respectively, which are not different among the five lines group (Table 7). Khon Kaen 2019 is, thus, the greatest in grain yield compared with the other environments.
Table 7.
Rice grain yield comparison between environments.
Environment (E) and genotype (G) interaction for yield of the nine rice genotypes under six evaluation sites was significant (p ≤ 0.05). Yield comparison among genotype under a particular environment was different. At Khon Kaen 2019, the rice yield among genotype was not significantly different, with an average of 4651 kg ha−1 and a yield ranging from 4174 to 4913 kg ha−1. Whereas, Nong Khai 2019, Roi Et 2019, Khon Kaen 2020, Roi Et 2020, and Nong Khai 2020 had location mean yield and yield ranges of 3087, 2490–3419 kg ha−1; 3149 kg ha−1, 2599–3737 kg ha−1; 3484 kg ha−1, 3206–3745 kg ha−1; 3195 kg ha−1 2669–3467 kg ha−1, and 3535 kg ha−1, 2842–4771 kg ha−1, respectively. Yield among genotype in these environments was not significantly different. Except for the Nong Khai 2020 environment, rice yield among genotype was significantly different at p ≤ 0.05 level. The NIL BC2F5 2-8-2-26-1 gave a yield of 4771 kg ha−1 that was significantly different from the other genotypes. Those genotypes were not significantly different among themselves. In addition, the environment Nong Khai 2020 was found to have a considerable yield range value by yield range of 1929 kg ha−1, and its range was higher than the other five environments (Table 8).
Table 8.
Grain yield of rice 8 RD6 NILs comparison with original RD6 at individual environments.
3.4. Yield Stability and Adoption
Yield stability analyzed by GGE-biplot showed stability of the genotype G1-G8 compared with RD6 under environments E1-E6 (arrow lines). GGE-biplot explained for PC1 with 46.4% and PC2 with 25.9%. The stability map shows that the yields of NILs G1 (Blast + BLB-36), G3 (BC2F5 2-8-2-52), G4 (BC2F5 9-1/15-1-27), G5 (BC4F5 132-12-61), G6 (BC4F5 132-25-18), and G7 (BC4F5 132-98-87) were of greater stability than RD6, and NILs G2 (BC2F5 2-8-2-26-1) and G8 (BC4F5 132-174-54) were of low stability. However, specific adaptation of crop yield was showing for NILs adaptation to various environments: G2 (BC2F5 2-8-2-26-1) was high yield for environment E2 (Nong Khai 2019), E4 (Khon Kaen 2020), and E5 (Nong Khai 2020); G8 (BC4F5 132-174-54) had greater yield for environment E1 (Khon Kaen 2019) and E3 (Roi Et 2019); and RD6 had greater yield for environment E6 (Roi Et 2020) (Figure 2).
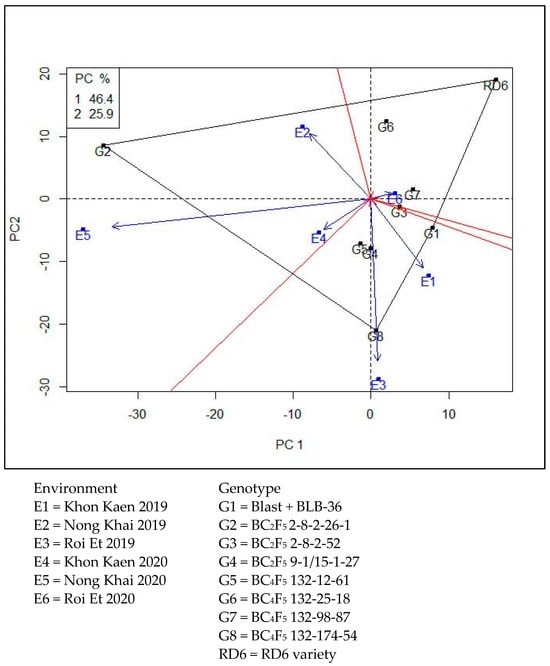
Figure 2.
Yield stability analysis by GGE-biplot.
3.5. Yield Components and Agronomic Traits Evaluation
Yield components and agronomic traits means of individual genotypes for comparison were averaged over six environments. Plant height (PH) average among genotype was highly significant (p ≤ 0.01). RD6 was the highest with 161 cm of plant height, and G2 (BC2F5 2-8-2-26-1) was the lowest plant height with 142 cm; the plant heights of the other NILs were similar among genotypes. Days to flowering (DTF) was highly significant (p ≤ 0.01); almost all genotypes were not significant, with the range of 106–110 days, but only one of its G2 (BC2F5 2-8-2-26-1) was shorter in day to flowering with an average 99 days. The tiller number (TN) and panicle number (PN) were both not significant among genotypes, with means of 10.4 and 10.2 for tiller number and panicle number, respectively. Seed per panicle (SP) was not significantly different, with a mean of 164 seeds per panicle. Thousand seed weight (1000 SW) was significant at 95%; G6 (BC4F5 132-25-18) was higher in seed weight, but the other NILs did not have a different seed weight than that of RD6. Harvest index (HI) was highly significant at p ≤ 0.01; all of the NILs had a higher harvest index than that of RD6. The NILs’ harvest index ranged between 0.37 and 0.40, whereas RD6 was 0.33 in harvest index (Table 9).
Table 9.
Agronomic traits of rice genotypes.
4. Discussion
4.1. Disease Occurrence under Various Environments
Differentiation among environments played an important role in these experiments and is inclusive of disease infection and rain distribution. Infections of the two diseases, blast and BB, were found (Table 5). Disease occurrence was more frequent in the year 2020 than 2019. In the year 2019, only Khon Kaen had blast occurrence. Meanwhile, on some experiment sites, disease infection frequency in year 2020 was more than 2019; in 2019, blast disease infection was found at only one site, Khon Kaen (Table 4). Meanwhile, the year 2020 had both disease infections at all three experimental sites. Alternatively, blast is an airborne disease, while BB is waterborne; this makes blast easier to spread than BB disease during the period of short rain distribution. Blast was found across four sites, while BB was found at three sites (Figure 1). Blast grows rapidly under cloudy days with intermittent rainfall development, and the disease spreads at temperatures 25–30 °C and relative humidity above 90% [28,29]. In some environments, such as Nong Khai (2020), the most resistant line did not show a strong resistance to BB (Table 5). This might be caused by some isolated pathogens that are still virulent. Identification of a new resistant source for further gene pyramiding is the prospect to achieve more durable resistance.
The experimental site for disease screening evaluation was specifically related to disease frequency occurrence and severity. The only experimental site where blast disease was found for both experimental years was the Khon Kaen location, which was appropriate for natural blast disease screening, and serious BB disease infection severity was significant for Nong Khai because of a higher average disease score (Table 5). Moreover, natural disease infection screenings were needed to be conducted under various locations and repeated for more than two years, and climate changes were affected for disease occurrence. Normally, field disease evaluation was based on natural infection under an uncontrollable environment similar to field evaluation of RD6 introgression lines for yield performance, blast, and BB resistance across five environments and found blast at four environments, whereas neck blast and BB occurred at three environments and one environment, respectively [9].
4.2. Adaptability of Rice Genotypes
Environment affected the rice genotype significantly. In terms of yield, the rice genotypes were not significantly different when compared among the NILs and RD6 (Khon Kaen 2019, Nong Khai 2019, Roi Et 2019, Khon Kaen 2020, and Roi Et 2020). The result indicated that the breeding lines were close to the recurrent parent (RD6). Furthermore, comparing among the NILs, no significant difference was found (Table 5) The result was a resemblance with the study of Aung Nan [9], which evaluated RD6 near isogenic blast and BB resistance lines under various environments in 2015 to 2018 and found that the grain yield of rice genotypes had no significant difference for each of five environments when compared with the RD6 standard check variety, in which the environments were conducted under pressure of disease affected as leaf blast, neck blast, and BB; disease screenings were clearly classified for blast resistance and susceptible genotypes but not clearly among BB resistance and susceptible genotype, and the relevant BB resistant xa5 recessive gene was excellent for horizontal resistance, which was influenced by the environments [30].
In general, proper utilization of rice genotypes needs to focus on production area. An environment with low disease infection needs to be recommended for the high yield stability rice genotype. On the other hand, a specific adaptation genotype would need to be recommended for a severe disease infection area. Yield stability of most genotypes, including G1, G3, G4, G5, G6, and G7, was higher than that of RD6. In addition, under a severe disease environment such as Nong Khai 2020, severe BB infection (Table 5) was shown after entering a reproductive stage (Figure 1e); the yield of most genotypes decreased, while G2, the BB resistant line, had a higher yield. The result resembled that of Ansari [31] who studied yield loss assessment due to BB at different resistance levels. The susceptible variety had a lower yield, which was inoculated during the reproductive stage. BB affected plant leaves, photosynthesis, and panicle fertilization [32,33].
4.3. Disease Resistance Levels of Rice RD6 NILs
This study focused on the experimentation of two disease infections, which included leaf blast and bacterial blight. Disease resistance levels of rice genotypes were varied depending on the resistance gene and gene frequency. The blast disease resistance level among resistance and susceptible genotypes was compared; all of the evaluated environments showed significant differences, and all of the NILs that contained the blast resistance gene had greater blast resistance than the RD6 standard check variety (Table 5). Meanwhile, BB disease resistance levels among the genotypes were significant but not strongly different; the NILs that contained the single BB resistance gene xa5 were not highly resistant because the recessive gene xa5 was excellent for horizontal resistance [30]. Moreover, to increase BB resistance levels into rice NILs, other resistant genes need to be added. The dominance genes Xa13 and Xa21 were found to increase the resistance level of the rice genotype, as pyramiding lines harboring multiple BB-resistant genes Xa21 + xa13 + xa5 had higher resistance than those that carried the gene combination of Xa21 + xa13, Xa21 + xa5, xa13 + xa5, and susceptible variety control [34,35,36,37].
4.4. Plant Phenotype of Rice RD6 NILs
The RD6 rice NILs mostly presented a phenotype approximately with the RD6 parental variety, including photosensitivity, plant height, tiller number, and panicle number, which was a result of the backcrossing method. This study has two different phenotype groups of BC2 and BC4. The group BC4 showed a phenotype, including yield, yield stability, and agronomic traits, that was closer to RD6 than BC2. In general, for conveying qualitative traits such as disease resistance, the backcross approach has been widely used for influence over the genetic variance in the segregating population [38]; as the backcrossing approach was used to improve the RD6 variety for blast resistance and salt tolerance through maker-assisted selection, this study had improvements into four cycles (BC4), which the plant phenotype of progeny were not significant with recurrence parent and disease resistance levels were not significant with donor parents [7]. On the other hand, BC2 group was a few significant as G2 showed non-photosensitivity and short plant height. These segregation traits were affected from the donor parent and possible to express on low backcrossing round NILs. Notably, G2 is mostly the same as RD6, except for blast and BB resistance. Furthermore, it is shorter in height and not sensitive to photoperiod. Shorter plant height makes it less in lodging during the harvest period and results in a decreased yield. Moreover, non-photosensitivity makes it able to avoid drought and flooding constraints by fixing suitable planting date as well as harvest date. These are benefits from marker-assisted backcrossing together with modification of conventional selection to deliver a new promising improved line for further utilizing among natural disasters.
5. Conclusions
Rice RD6 NILs evaluation was performed at three locations replicated by two years from 2019 to 2020. NILs promising lines selection for utilization on Northeastern of Thailand was the focus for agronomic traits and yield adaptability under pressure of natural disease infections. The high yield stability genotypes G1, G3, G4, G5, G6, and G7 had greater yield stability than RD6 and are recommended for wider utilization. On the other hand, two genotypes, G2 and G8, had low yield stability; G2 had a greater yield maintained under severe BB disease infection that was appropriate for a severe BB spread area. In contrast, G8 had higher yield under low disease pressure. In addition, G2 expressed segregation traits in non-photosensitivity and lower plant height that could be recommended for an irrigation area or to replace RD6 for early maturity when subjected to drought and flooding avoidance. Furthermore, all of the rice genotypes need more pyramiding BB resistance genes to increase the durable resistance.
Author Contributions
Conceptualization, S.C. and J.S.; methodology, J.Y., S.C. and J.S.; validation, J.Y., T.M., J.L.S., M.S., K.S. and T.T.; writing—original draft preparation, J.Y. and S.C.; writing—review and editing, T.M. and S.C.; supervision, J.S.; project administration, J.S.; funding acquisition, J.Y. and J.S. All authors have read and agreed to the published version of the manuscript.
Funding
Thailand Graduate Institute of Science and Technology (TGIST) from the National Science and Technology Development Agency (NSTDA) for studies scholarship (Contract no. SCA-CO-2562-9717-TH) as well as the research fund by NSTDA grant number P1950205.
Data Availability Statement
The original contributions presented in the study are included in the article, further inquiries can be directed to the corresponding author.
Acknowledgments
This research was supported by the Plant Breeding Research Centre for Sustainable Agriculture, Khon Kaen University, Khon Kaen, Thailand. We wish to express our thanks to Thailand Graduate Institute of Science and Technology (TGIST) for studies scholarship (Contract no. SCA-CO-2562-9717-TH).
Conflicts of Interest
The authors declare no conflicts of interest.
References
- Sattaka, P. Geographical distribution of glutinous rice in the greater Mekong sub-region. J. Mekong Soc. 2016, 12, 27–48. [Google Scholar] [CrossRef]
- Lian, X.; Wang, C.; Zhang, K.; Li, L. The retrogradation properties of glutinous rice and buckwheat starches as observed with FT-IR, 13C NMR and DSC. Int. J. Biol. Macromol. 2014, 64, 288–293. [Google Scholar] [CrossRef]
- Tian, J.; Qin, L.; Zeng, X.; Ge, P.; Fan, J.; Zhu, Y. The role of amylose in gel forming of rice flour. Foods 2023, 12, 1210. [Google Scholar] [CrossRef]
- Naivikul, O. Enhancing food (glutinous rice) and nutritional security through products development and diversification. In Proceedings of the Consultative Meeting on GMS Cooperative Research and Networking on Food Security, Food Safety and Nutritional Security (focusing on Glutinous Rice, Good Agriculture Practice and Food Quality Assurance), Kasetsart University Chalermphrakiet, Sakon Nakhon Province Campus, Sakon Nakhon, Thailand, 4–5 October 2013; pp. 4–5. [Google Scholar]
- Sahunalu, P. Rehabilitation of salt affected lands in Northeast Thailand. Tropics 2003, 13, 39–51. [Google Scholar] [CrossRef][Green Version]
- Gardner, L.S. Salt Resources of Thailand. Report of Investigation-Thailand, Department of Mineral Resources; Thailand Department of Mineral Resources: Bangkok, Thailand, 1967; Volume 11, pp. 1–100. Available online: https://pubs.usgs.gov/publication/70205789 (accessed on 17 August 2024).
- Thanasilungura, K.; Kranto, S.; Monkham, T.; Chankaew, S.; Sanitchon, J. Improvement of a RD6 variety for blast resistance and salt tolerance through maker-assisted backcrossing. Agronomy 2020, 10, 1118. [Google Scholar] [CrossRef]
- Suwannual, T.; Chankaew, S.; Monkham, T.; Saksirirat, W.; Sanitchon, J. Pyramiding of four blast resistance QTLs into Thai rice cultivar RD6 through marker-assisted selection. Czech J. Genet. Plant Breed. 2017, 53, 1–8. [Google Scholar] [CrossRef]
- Aung Nan, M.S.; Janto, J.; Sribunrueang, A.; Monkham, T.; Sanitchon, J.; Chankaew, S. Field evaluation of RD6 introgression lines for yield performance, blast, bacterial blight resistance, and cooking and eating qualities. Agronomy 2019, 9, 825. [Google Scholar] [CrossRef]
- Chumpol, A.; Monkham, T.; Saepaisan, S.; Sanitchon, J.; Falab, S.; Chankaew, S. Phenotypic broad spectrum of bacterial blight disease resistance from Thai indigenous upland rice germplasm implies novel genetic resource for breeding program. Agron. J. 2022, 12, 1930. [Google Scholar] [CrossRef]
- Yang, Y.; Ye, R.; Srisutham, M.; Nontasri, T.; Sritumboon, S.; Maki, M.; Yoshida, K.; Oki, K.; Homma, K. Rice production in farmer fields in soil salinity classified areas in Khon Kaen, Northeast Thailand. Sustainability 2022, 14, 9873. [Google Scholar] [CrossRef]
- Pinta, W.; Toojinda, T.; Sanitchon, J. Pyramiding of blast and bacterial leaf blight resistance gene into rice cultivar RD6 using marker assisted selection. Afr. J. Biotechnol. 2013, 12, 4432–4438. [Google Scholar] [CrossRef]
- Oladosu, Y.; Rafii, M.Y.; Abdullaha, N.; Hussin, G.; Ramlie, A.; Rahimf, H.A.; Miah, G.; Usman, M. Principle and application of plant mutagenesis in crop improvement: A review. Biotechnol. Biotechnol. Equip. 2016, 30, 1–16. [Google Scholar] [CrossRef]
- Yan, W.; Hunt, L.A.; Sheng, Q.; Szlavnics, Z. Cultivar evaluation and mega-environment investigation based on the GGE biplot. Crop Sci. 2000, 40, 597–605. [Google Scholar] [CrossRef]
- Alwala, S.; Kwolek, T.; McPherson, M.; Pellow, J.; Meyer, D. A comprehensive comparison between Eberhart and Russell joint regression and GGE biplot analyses to identify stable and high yielding maize hybrids. Field Crop. Res. 2010, 119, 225–230. [Google Scholar] [CrossRef]
- Jalata, Z. GGE-Biplot Analysis of Multi-Environment Yield Trials of Barley (Hordeium vulgare L.) Genotypes in Southeastern Ethiopia Highlands. Int. J. Plant Breed. Genet. 2010, 5, 59–75. [Google Scholar] [CrossRef]
- Zurweller, B.A.; Xavier, A.; Tillman, B.L.; Mahan, J.R.; Payton, P.R.; Puppala, N.; Rowland, D.L. Pod yield performance and stability of peanut genotypes under differing soil water and regional conditions. J. Crop Improv. 2018, 32, 532–551. [Google Scholar] [CrossRef]
- Abdelrahman, M.; Alharbi, K.; El-Denary, M.E.; Abd El-Megeed, T.; Naeem, E.-S.; Monir, S.; Al-Shaye, N.A.; Ammar, M.H.; Attia, K.; Dora, S.A.; et al. Detection of superior rice genotypes and yield stability under different nitrogen levels using AMMI model and stability statistics. Plants 2022, 11, 2775. [Google Scholar] [CrossRef]
- Kong-ngern, K.; Buaphan, T.; Tulaphitak, D.; Phuvongpha, N.; Wongpakonkul, S.; Threerakulpisut, P. Yield, yield components, soil minerals and aroma of KDML 105 rice in Tungkularonghai, Roi-Et, Thailand. Int. Sch. Sci. Res. Innov. 2011, 5, 204–209. Available online: https://zenodo.org/record/1082841/files/14365.pdf (accessed on 17 August 2024).
- Jason, P.A. Soil Sampling Guidelines; Purdue Extension: West Lafayette, IN, USA, 2018; Volume 368, pp. 1–6. Available online: https://extension.purdue.edu/county/vanderburgh/_media/collecting-soil-samples-for-testing-ho-71-w.pdf (accessed on 17 August 2024).
- International Rice Research Institute (IRRI). Standard Evaluation System for Rice (SES), 5th ed.; International Rice Research Institute: Manila, Philippines, 2013; pp. 12–17. Available online: https://www.scribd.com/document/333585255/SES-5th-Edition (accessed on 17 August 2024).
- Banerjee, A.; Roya, S.; Bagb, M.K.; Bhagata, S.; Karb, M.K.; Mandala, N.P.; Mukherjeeb, A.K.; Maiti, D. A survey of bacterial blight (Xanthomonas oryzae pv. oryzae) resistance in rice germplasm from eastern and northeastern India using molecular markers. Crop Prot. 2018, 122, 168–176. [Google Scholar] [CrossRef]
- Chaudhary, R.C. Internationalization of elite germplasm for farmers: Collaborative mechanisms to enhance evaluation of rice genetic resources. New Approaches Improv. Use Plant Genet. Resour. 1996, 26, 1–26. [Google Scholar]
- Gomez, K.A.; Gomez, A.A. Statistical Procedures for Agricultural Research, 2nd ed.; John Wiley and Sons: New York, NY, USA, 1984; 680p, Available online: https://books.google.co.th/books?hl=en&lr=&id=PVN7_XRhpdUC&oi=fnd&pg=PA1&ots=Ht559inuq5&sig=agimlLxykrXUsP4EA8gmM23AKXU&redir_esc=y#v=onepage&q&f=false (accessed on 17 August 2024).
- Onofi, A.; Ciricfolo, E. Using R to perform the AMMI analysis on agriculture variety trials. R News 2007, 7, 14–19. [Google Scholar]
- R Development Core Team. R: A Language and Environment for Statistical Computing; R Foundation for Statistical Computing: Vienna, Austria, 2020; Available online: www.R-project.org (accessed on 24 April 2020).
- Yangklang, J.; Sanitchon, J.; Siangliw, J.L.; Monkham, T.; Chankaew, S.; Siangliw, M.; Sirithunya, K.; Toojinda, T. Yield performance evaluation of KDML105 rice introgression lines, developed through maker-assisted selection, under BB and blast disease infection in Northeashern Thailand. HSOA J. Agron. Agric. Sci. 2023, 6, 1–9. [Google Scholar] [CrossRef]
- Nagaraja, V.; Matucci-Cerinic, M.; Furst, D.E.; Kuwana, M.; Allanore, Y.; Denton, C.P.; Raghu, G.; Mclaughlin, V.; Rao, P.S.; Seibold, J.R.; et al. Current and future outlook on disease modification and defining low disease activity in systemic sclerosis. Arthritis Rheumatol. 2020, 72, 1049–1058. [Google Scholar] [CrossRef]
- Magarey, R.D.; Sutton, T.B.; Thayer, C.L. A simple generic infection model for foliar fungal plant pathogens. Phytopathology 2005, 95, 92–100. [Google Scholar] [CrossRef]
- Han, J.; Xia, Z.; Liu, P.; Li, C.; Wang, Y.; Guo, L.; Jiang, G.; Zhai, W. TALEN-based editing of TFIIAy5 changes rice response to Xanthomonas oryzae pv. Oryzae. Sci. Rep. 2020, 10, 2036. [Google Scholar] [CrossRef] [PubMed]
- Ansari, T.H.; Ahmed, M.; Ara, A.; Khan, M.A.I.K.; Mian, M.S.; Zahan, Q.S.A.; Tomita, M. Yield loss assessment of rice due bacterial blight at different resistance level. Bangladesh J. Plant Pathol. 2018, 34, 71–76. [Google Scholar]
- Reddy, A.P.K.; Mackenzie, D.R.; Rouse, D.I.; Roa, A.V. Relationship of bacterial leaf blight severity to grain yield of rice. Phytopathology 1979, 69, 967–969. Available online: https://www.apsnet.org/publications/phytopathology/backissues/Documents/1979Articles/Phyto69n09_967.pdf (accessed on 17 August 2024). [CrossRef]
- Elings, A.; Rossing, W.A.H.; Van Der Werf, W. Virtual lesion extension: A measure to quantify the effects of bacterial blight on rice leaf CO2 exchange. Phytopathology 1999, 89, 789–795. [Google Scholar] [CrossRef]
- Huang, N.; Angeles, E.R.; Domingo, J.; Magpantay, G.; Singh, S.; Zhang, G.; Kumaravadevil, N.; Bennett, J.; Khush, G.S. Pyramiding of bacterial blight resistance genes in rice: Marker assisted selection using RFLP and PCR. Theor. Appl. Genet. 1997, 95, 313–320. [Google Scholar] [CrossRef]
- Petpisit, V.; Khush, G.S.; Kauffman, H.E. Inheritance of resistance to bacterial blight in rice. Crop Sci. 1977, 17, 551–554. [Google Scholar] [CrossRef]
- Huang, S.; Antony, G.; Li, T.; Liu, B.; Obasa, K.; Yang, B.; White, F.F. The broadly effective recessive resistance gene xa5 of rice is a virulence effector-dependent quantitative trait for bacterial blight. Plant J. 2016, 86, 186–194. [Google Scholar] [CrossRef]
- Pradhan, K.C.; Mohapatra, S.R.B.; Nayak, D.K.; Pandit, E.; Jena, B.K.; Sangeeta, S.; Pradhan, A.; Samal, A.; Meher, J.; Behera, L.; et al. Incorporation of two bacterial blight resistance genes into the popular rice variety, Ranidhan through marker-assisted breeding. Agriculture 2022, 12, 1287. [Google Scholar] [CrossRef]
- Léon, J. An overview of backcross breeding in plants. Int. Sch. J. 2021, 8, 1. [Google Scholar]


Disclaimer/Publisher’s Note: The statements, opinions and data contained in all publications are solely those of the individual author(s) and contributor(s) and not of MDPI and/or the editor(s). MDPI and/or the editor(s) disclaim responsibility for any injury to people or property resulting from any ideas, methods, instructions or products referred to in the content. |
© 2024 by the authors. Licensee MDPI, Basel, Switzerland. This article is an open access article distributed under the terms and conditions of the Creative Commons Attribution (CC BY) license (https://creativecommons.org/licenses/by/4.0/).