Abstract
The knowledge within wheat production chain data has multiple levels and complex semantic relationships, making it difficult to extract knowledge from them. Therefore, this paper proposes a fine-grained knowledge extraction method for the wheat production chain based on ontology. For the first time, the conceptual layers of ploughing, planting, managing, and harvesting were defined around the main agricultural activities of the wheat production chain. Based on this, the entities, relationships, and attributes in the conceptual layers were defined at a fine-grained level, and a spatial–temporal association pattern layer with four conceptual layers, twenty-eight entities, and forty-two relationships was constructed. Then, based on the characteristics of the self-constructed dataset, the Word2vec-BiLSTM-CRF model was designed for extracting the knowledge within it, i.e., the entity–relationship–attribute model and the Word2vec-BiLSTM-CRF model in this paper were compared with the four SOTA models. The results show that the accuracy and F1 value improved by 8.44% and 8.89%, respectively, compared with the BiLSTM-CRF model. Furthermore, the entities of the pest and disease dataset were divided into two different granularities for the comparison experiment; the results show that for entities with “disease names” and “pest names”, the recognition accuracy at the fine-grained level is improved by 32.71% and 31.58%, respectively, compared to the coarse-grained level, and the recognition performance of various fine-grained entities has been improved.
1. Introduction
In the era of agriculture informatization, agricultural knowledge has become a key element in modern agricultural science, precision operations, and production’s quantitative decision-making. The information service of agriculture no longer remains at the level of data but is transformed into the demand for knowledge. Although the development of big data, the Internet of Things, and other technologies has provided new space for the transformation of agricultural information services, these source data are unprocessed data that cannot be used directly and effectively. The construction of a knowledge graph can extract knowledge from fragmented, uncorrelated, and heterogeneous data from multiple sources, organize knowledge in the form of the “entity–relation–entity” triplet, and make it explicit. Therefore, in the face of a large amount of agricultural data covering the wheat “ploughing”, “planting”, “managing”, and “harvesting” production chain—which involves multi-dimensional information and knowledge such as climate, agronomy, and field management—using knowledge graph construction technology to deeply mine the valuable information hidden therein, extract the knowledge from it, form a semantic knowledge base, and apply it in a timely manner to agricultural production is crucial. Moreover, there are few research results on the construction of knowledge graphs for the fine-grained production chains of crops. Therefore, this paper proposes an ontology-based agricultural knowledge graph construction method, which defines the wheat production chain ontology system at a fine-grained level—and constructs its schema layer on this basis—in order to effectively solve the difficult problem of knowledge extraction with many conceptual levels and complex relationships in the crop production chain.
2. Related Research
In recent years, knowledge graphs have been well-used in various fields. For example, the disease dictionary in the medical field [1], the military intelligence question and answer system [2], the financial knowledge graph [3], and so on. Similarly, the research on knowledge extraction and graph construction in the field of agriculture have also attracted much attention and achieved certain results. For example, Chang et al. [4] constructed an agricultural ontology system based on the Chinese Agricultural Thesaurus [5] and further standardized the relationship between words [6,7,8]. Liu et al. [8] constructed and visualized a knowledge graph of cotton pests and diseases. Based on the constructed citrus fertilizer and water knowledge graph, information technology was used to realize citrus precise fertilization, drainage detection, and disease control [9]. As far as models for knowledge extraction are concerned, deep learning models based on neural networks have become mainstream, such as the BiLSTM-CRF model, which became one of the first classical models for knowledge extraction and is widely used in various fields [10]. The subsequent models are mostly improved on this model, such as the introduction of pre-trained models such as Word2vec and BERT [11,12,13], or the combination of the attention mechanism. Some research results show that the Word2vec-BiLSTM-CRF model is more suitable for small-scale datasets than the BERT-BiLSTM-CRF model [14], which is the main reason why this model is chosen for knowledge extraction on self-constructed datasets in this paper [15].
Ontology-based knowledge extraction and graph construction have achieved many results in the field of agriculture [16]. However, after analysis, it can be concluded that the granularity of ontology system definitions in existing results is relatively coarse and simple, which leads to the extracted knowledge not being comprehensive and detailed enough, and this is difficult to use in practical scenarios. For example, the authors of [17] simply defined the names of cotton pests and diseases and the areas where they occurred and did not elaborate on the properties of the pests themselves, making results difficult to implement. Although in [18], the authors classified the entity types of varieties in a more detailed way, some key factors were missing in the relationship definition, which caused the correlation to be missing and the knowledge chain to not be tight enough. Therefore, this paper proposes a fine-grained knowledge extraction method for the wheat production chain and constructs a corresponding ontology system.
The construction process of the fine-grained wheat production chain knowledge graph in this paper is shown in Figure 1, which is mainly divided into two parts: the schema layer and the data layer. The schema layer is constructed using ontology theory, which mainly defines the conceptual framework of the wheat production chain and normatively expresses the knowledge relations and attributes in it. The second part is the data layer construction, which involves designing a model to extract triplet knowledge from various types of data to instantiate the data layer. Finally, triplet knowledge is imported into the Neo4j graph database for visualization. The main contributions of this paper’s work can be summarized in the following three points:
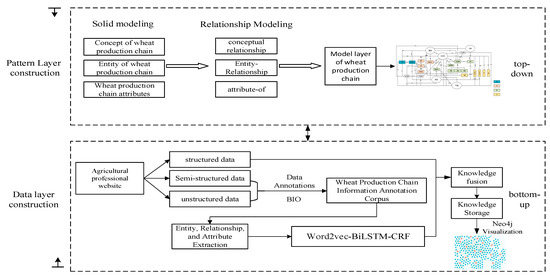
Figure 1.
Flow of knowledge graph construction for fine-grained wheat production chain. (Blue circles represent properties and orange circles represent entities).
(1) For the first time, a fine-grained ontology-based wheat production chain schema layer was constructed, which provides a specialized and detailed delineation of the entity categories and relationships of the wheat production chain, culminating in a schema layer with four conceptual layers, twenty-eight entities (with attributes), and forty-two relationships;
(2) A corpus of wheat production chain data was constructed for the first time. Guided by the defined schema layer, wheat production chain data were acquired from agricultural websites and other sources, and after pre-processing the acquired semi-structured and unstructured data, a corpus of wheat production chain data with 5356 samples was formed to provide a database for further knowledge extraction and graph construction;
(3) A Word2vec-BiLSTM-CRF model was designed to extract entities and attributes from the constructed dataset, and experiments were designed to validate the effectiveness of the model on both public and self-constructed datasets. Further, the design experiment focuses on verifying the accuracy of extracted knowledge at the fine-grained ontology definition, and in terms of “disease name” and “pest name”, compared with coarse-grained, the accuracy at the fine-grained level is improved by 32.71% and 31.58%, respectively.
3. Construction of Production Chain Schema Layers
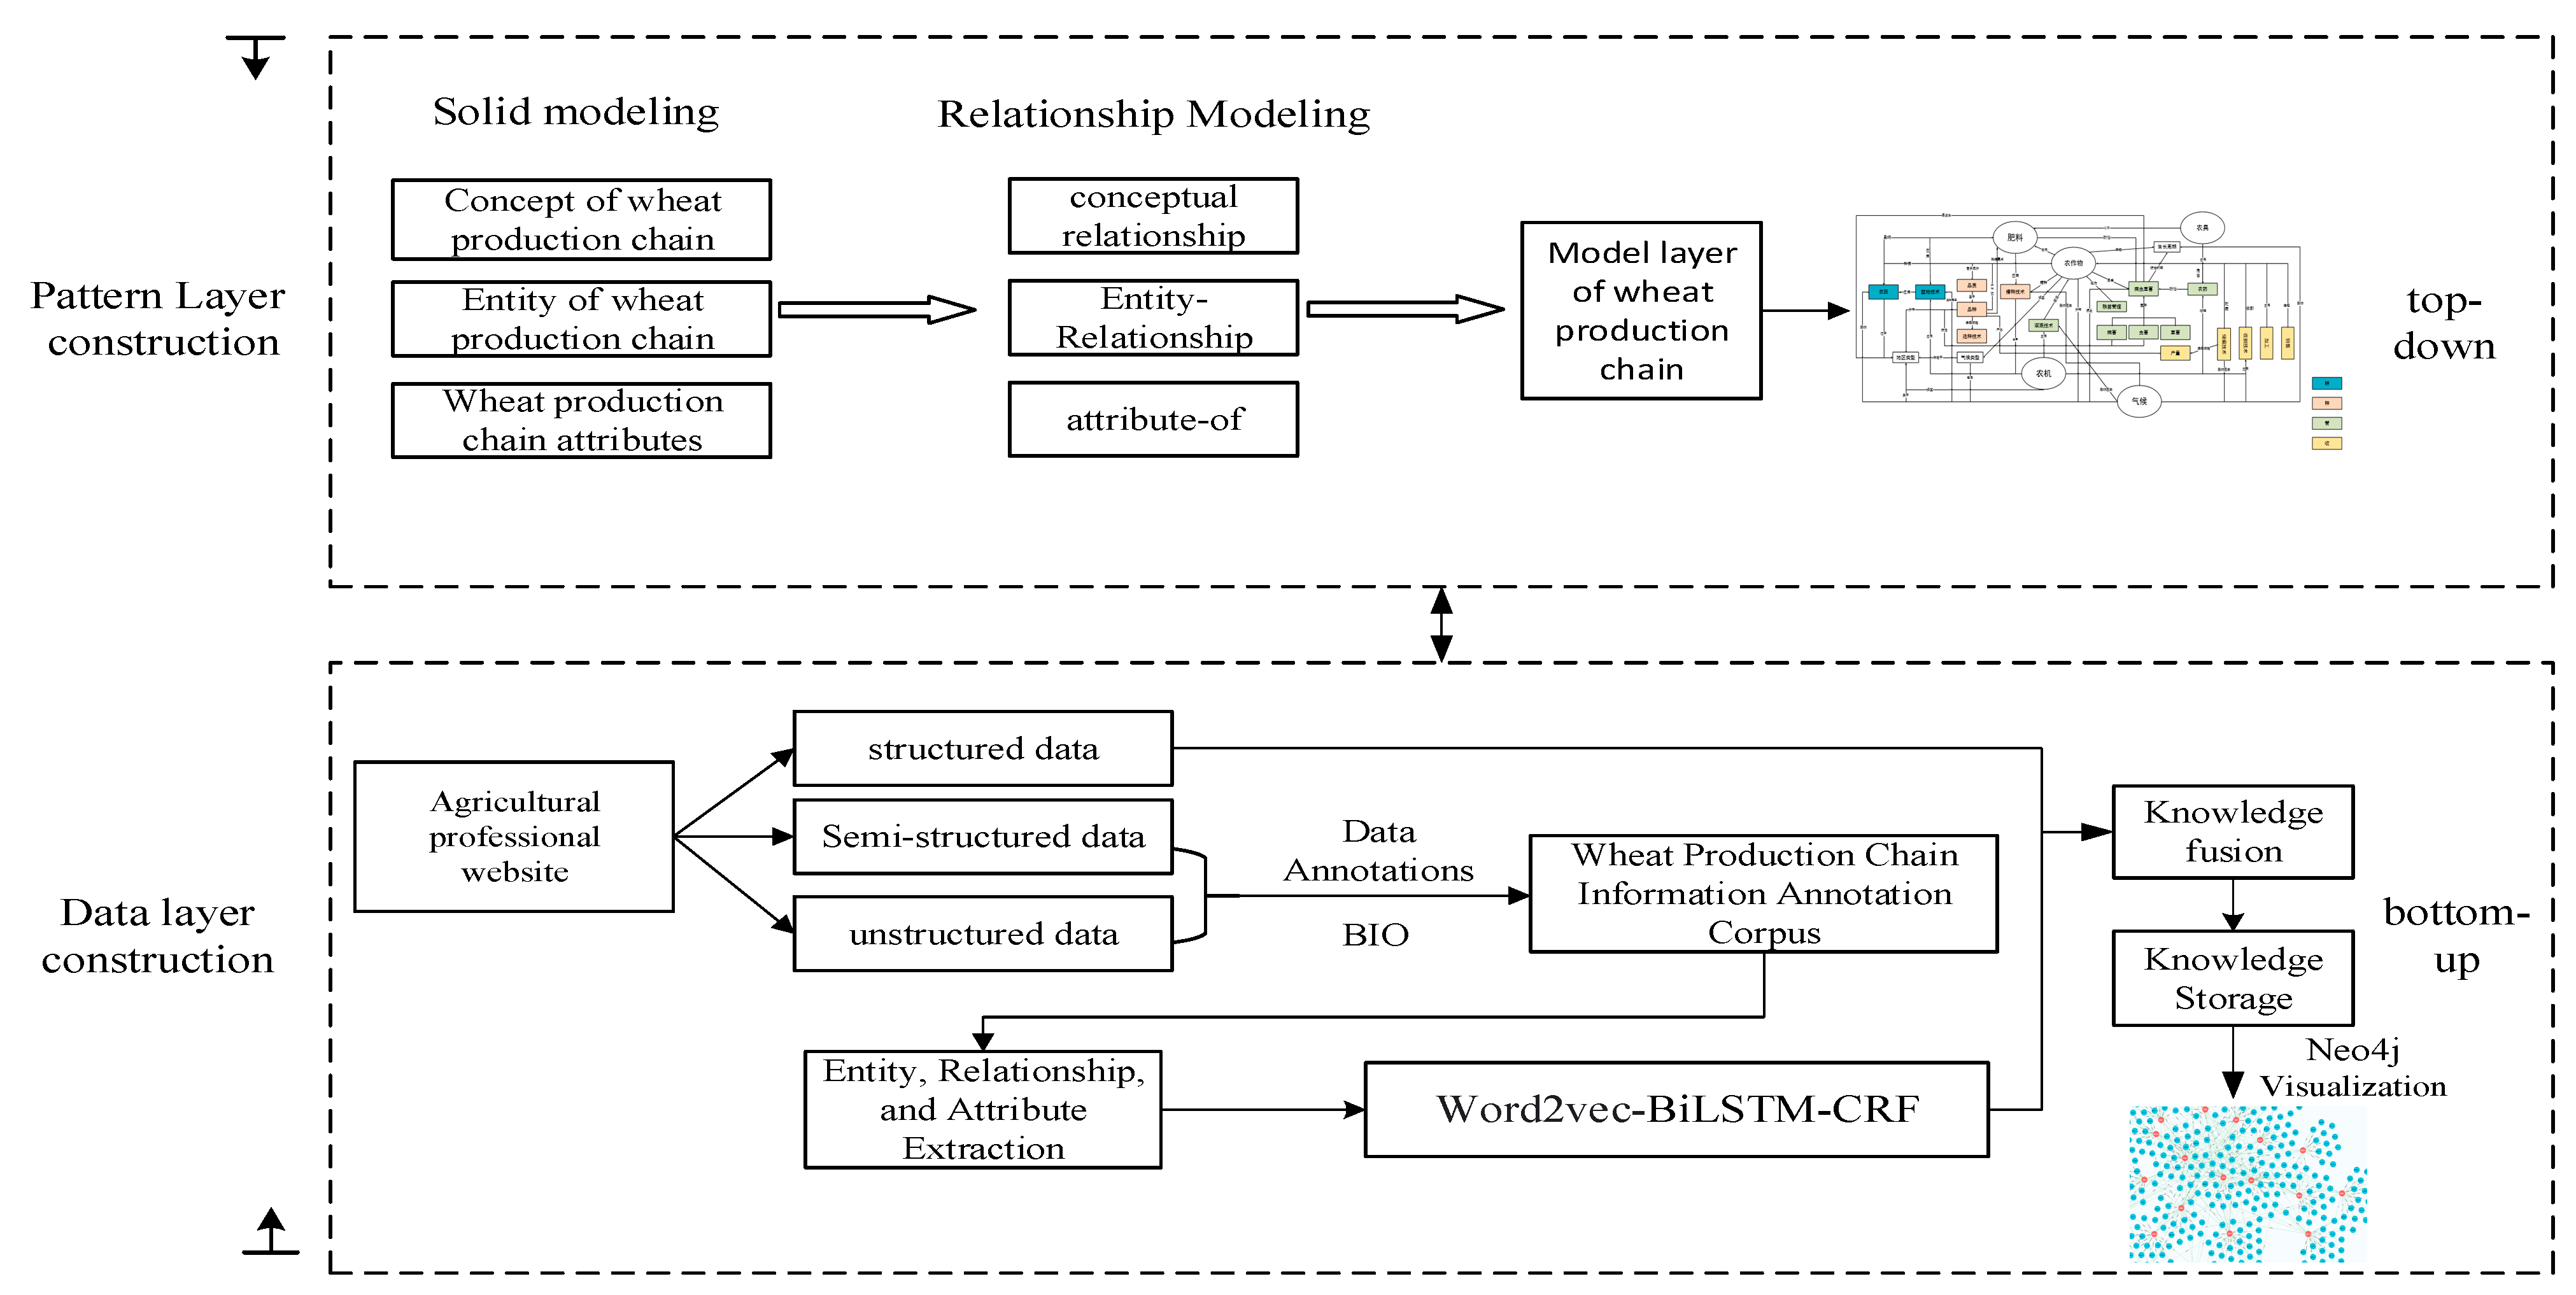
First of all, referring to the “Chinese Agricultural Thesaurus” and the “Special Classification for Agriculture” professional books, we obtained the authoritative agricultural terminology. Based on the recommendations of agricultural experts, we divided the wheat production chain into four segments, namely, “ploughing”, “planting”, “managing” and “harvesting”, and finely defined the entities, relationships, and attributes in each segment. Then, the top-down domain ontology knowledge representation method was used to construct the production chain model layer, and the construction process is shown in Figure 2, with the main contents detailed as follows.

Figure 2.
Flowchart of ontology construction.
3.1. Production Chain Schema Layer Construction
3.1.1. Entity and Attribute Definitions
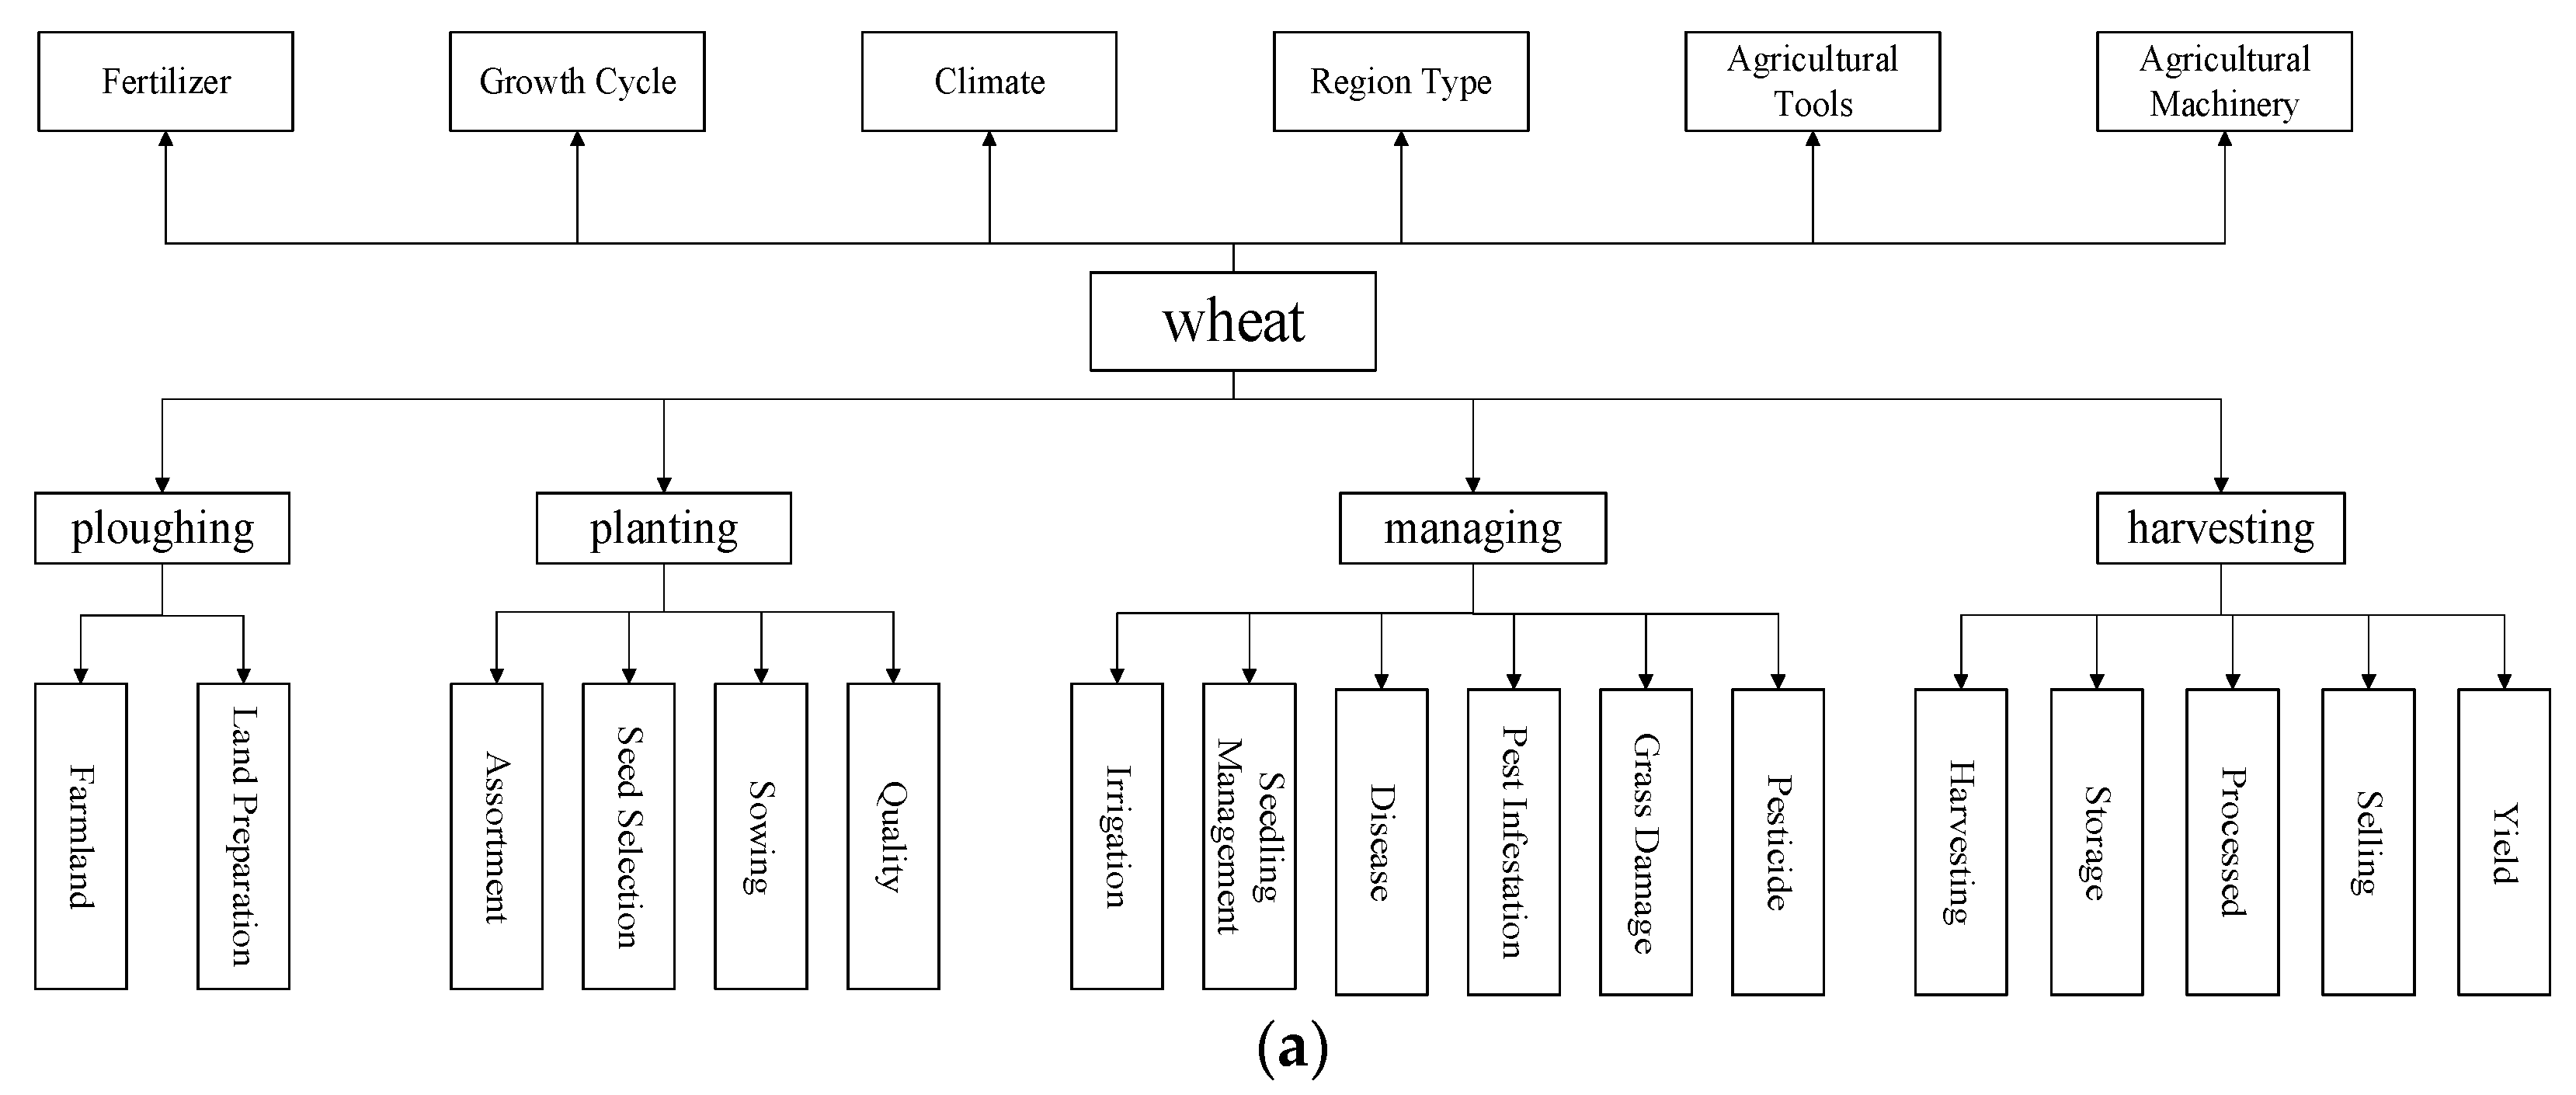
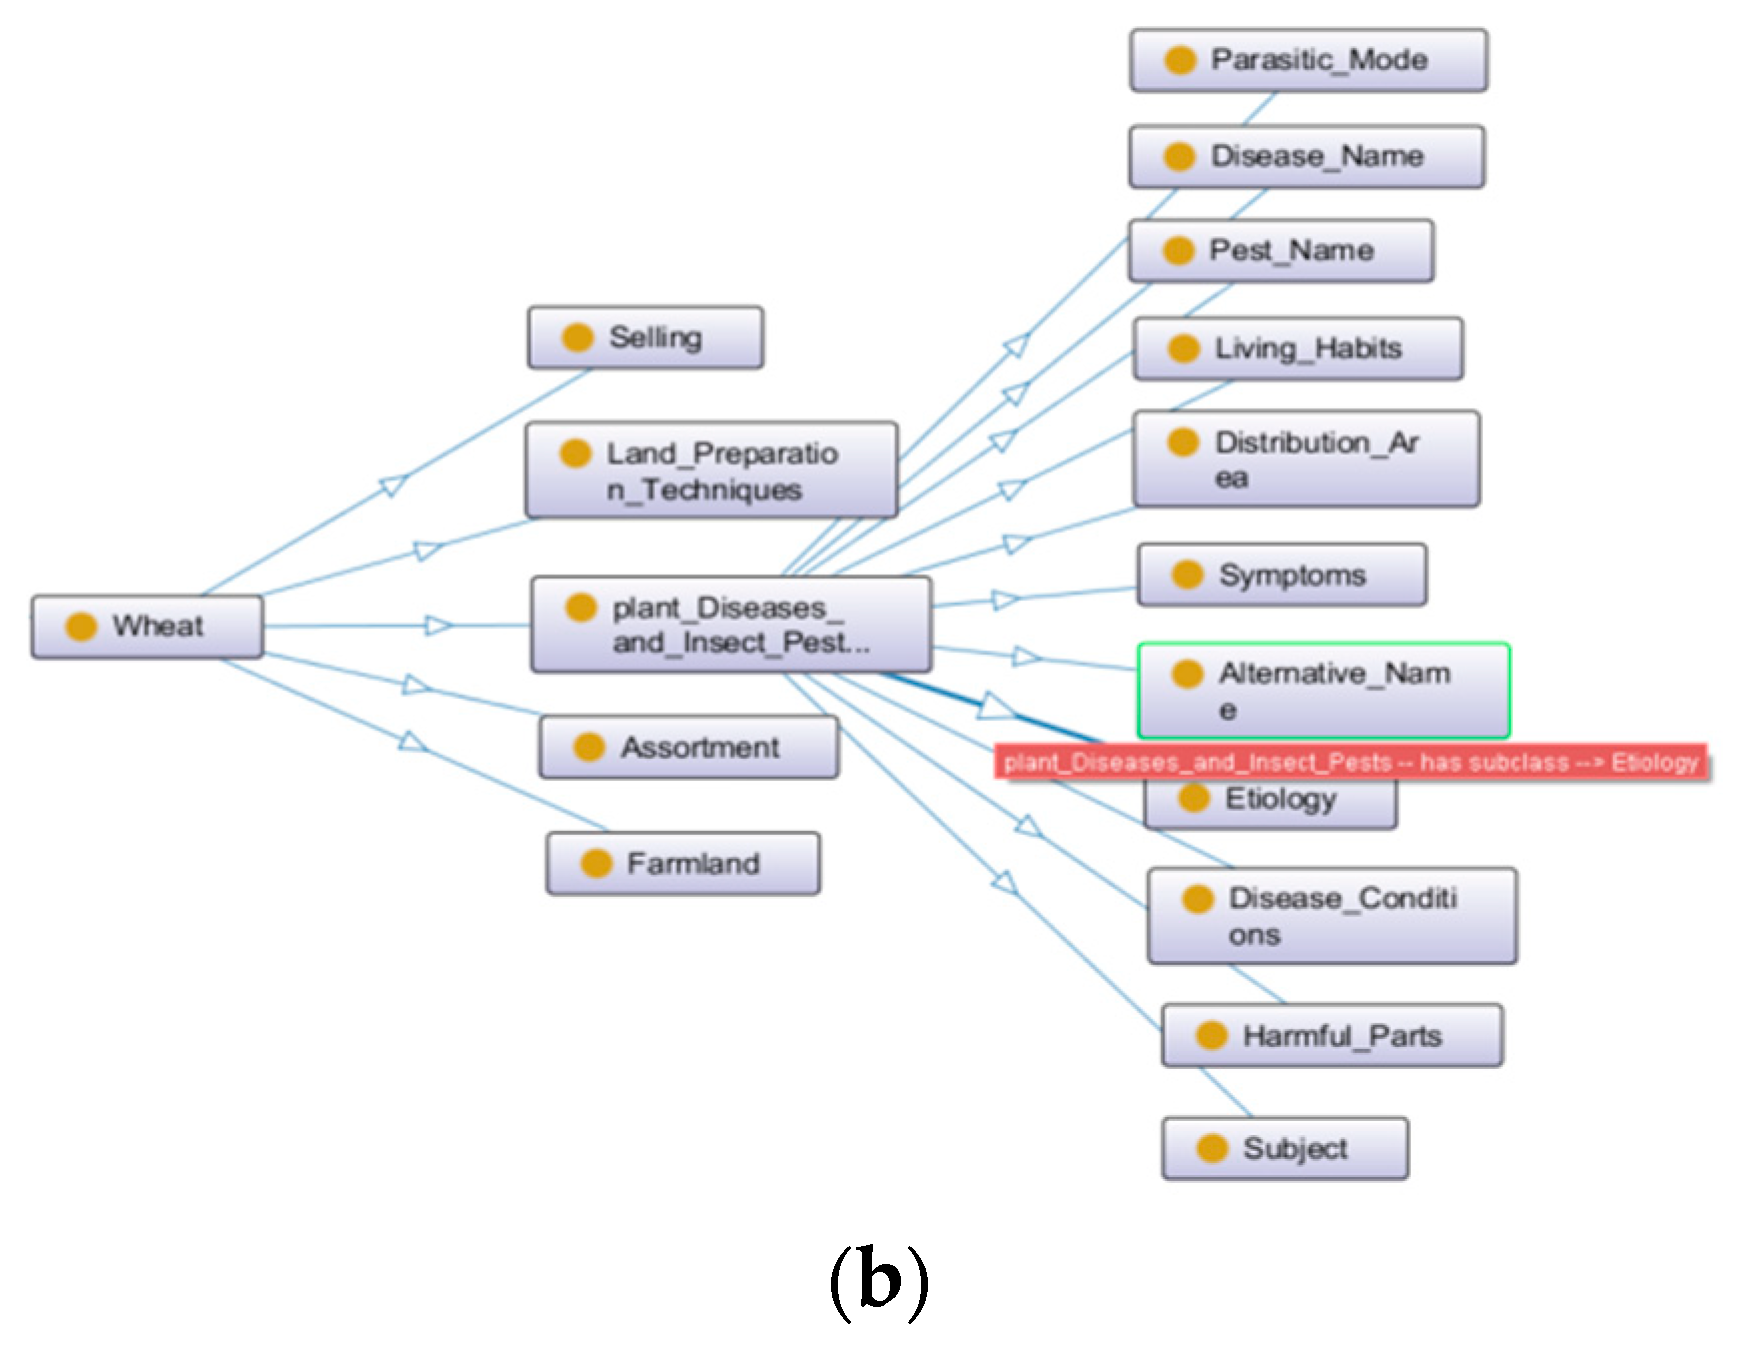
The definition of the wheat production chain entities in this paper is centered on the specific agricultural activities involved in the four links of the “ploughing”, “planting”, “managing”, and “harvesting” of wheat, which is fully compatible with the agricultural production practice. The division of entities in each link is specifically shown in Figure 3a; the screenshot of the protégé part is shown in Figure 3b. Due to the diversity of entities, relationships, and attributes in the field of agriculture, the entities in Figure 3a also relate to agricultural machinery, tools, and supplies. In order to distinguish entities at a fine-grained level, their attributes are further subdivided into data attributes and object attributes [19]. For example, the “Agricultural Machinery” entity contains specific numerical attributes such as a sowing row spacing of 10.21 cm and depth of 15 cm. The “Pests, Diseases, and Weeds” entity contains object attributes such as name, pathogen, alias, and harm. Because the production chain involves more entity attributes, this paper only selects the definition of pest and disease attributes as a sample, as shown in Table 1. As can be seen from Table 1, this paper defines the entities and attributes of the wheat production chain in detail, and its granularity reaches four layers.

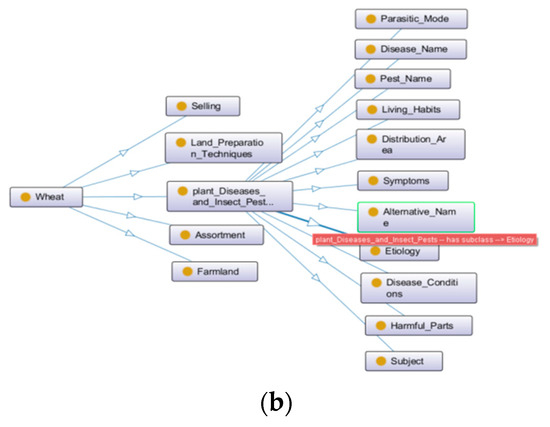
Figure 3.
(a) Classification of entity types in the wheat production chain. (b) Screenshot of protégé part. ((b) in Figure 3 is the ontology diagram example drawn by protege software version 5.5.0. The first layer is wheat, the second layer is wheat-related entities, and the third layer is the attributes separated by one of the entities).

Table 1.
Definition of pest and disease attributes.
3.1.2. Entity and Relationship Definitions Results
In order to better clarify the entities and their relationships in the wheat production chain, the relationships between entities are divided into intra-layer and inter-layer relationships in this paper, where intra-layer has inheritance and instantiation relationships, inter-layer has containment and concomitant relationships, and entities and attributes have association relationships. Some of the entities and relationships in this paper are defined as shown in Table 2. From Table 1 and Table 2, it can be seen that although the entities and relationships of the wheat production chain are multi-layered and complex, the definitions of entities, relationships, and attributes using the method in this paper are clear and professional.
Table 2.
Entity and relationship category details.
A spatio-temporally linked wheat production chain pattern layer was constructed, which contained four conceptual layers, twenty-eight entities, and forty-two relationships, which is shown in Figure 4. It can be seen that the schema layer covers the full range of elements involved in the agricultural activities of the wheat production chain.
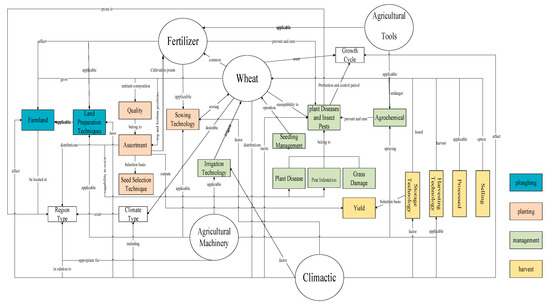
Figure 4.
Wheat production chain pattern layer.
4. Construction of the Data Layer
DataSet Construction
The data in this paper come from three main sources, firstly, encyclopedic websites such as Agricultural Encyclopedia and Wikipedia. Most of the data were obtained from the China Agricultural Information Network (CAIN) (http://www.agri.cn/, accessed on 15 February 2023); the Seed Industry Business Network (SIBN) (https://www.chinaseed114.com, accessed on 15 February 2023); the China Crop Germplasm Information Network (CCPIN) (https://www.cgris.net/, accessed on 15 February 2023); China’s Agricultural Science Data Center (CASDC) (http://region.agridata.cn/, accessed on 15 February 2023); and other professional and authoritative agricultural websites; these provide a wide range of data covering the production chain, such as wheat diseases and pests. In addition, data from specialized books such as “The Crop Disease and Pests in China” are also included. Most of the data obtained in the above three ways are mainly in unstructured and semi-structured structures, and the data are pre-processed by writing programs for cleaning, noise reduction, and de-redundancy, which lays the foundation for the next step of data annotation.
Data annotation is one of the necessary steps before automatically extracting knowledge using deep learning methods, which mainly defines different labels for the text-based data and then adopts suitable annotation methods to annotate the entities; this provides data for the training of the model and helps the model to accurately recognize entities and relationships. Currently, there are three commonly used data annotation methods, BIO, BIOES, and BMES. By experimentally comparing the three methods on the same model, BIO is identified as a suitable annotation method for the dataset in this paper. Because the data volume of the wheat production chain is so large, in this paper, the pest and disease data were selected for the experiments of named entity recognition. The wheat pest and disease corpus used for the experiment after annotation and manual calibration has 312 samples, 100,875 characters, 13 entity categories, and a total of 13,610 entities, as shown in Table 3.
Table 3.
Experimental dataset.
5. Knowledge Extraction and Discussion
Currently, knowledge extraction mainly consists of two segments named entity recognition and relationship extraction. Due to the complex semantic relationships of agricultural text-based data, the neural network-based deep learning model is constructed to recognize the entities in wheat pest and disease datasets and further extracts the relationships based on rules.
5.1. Named Entity Recognition Model Construction
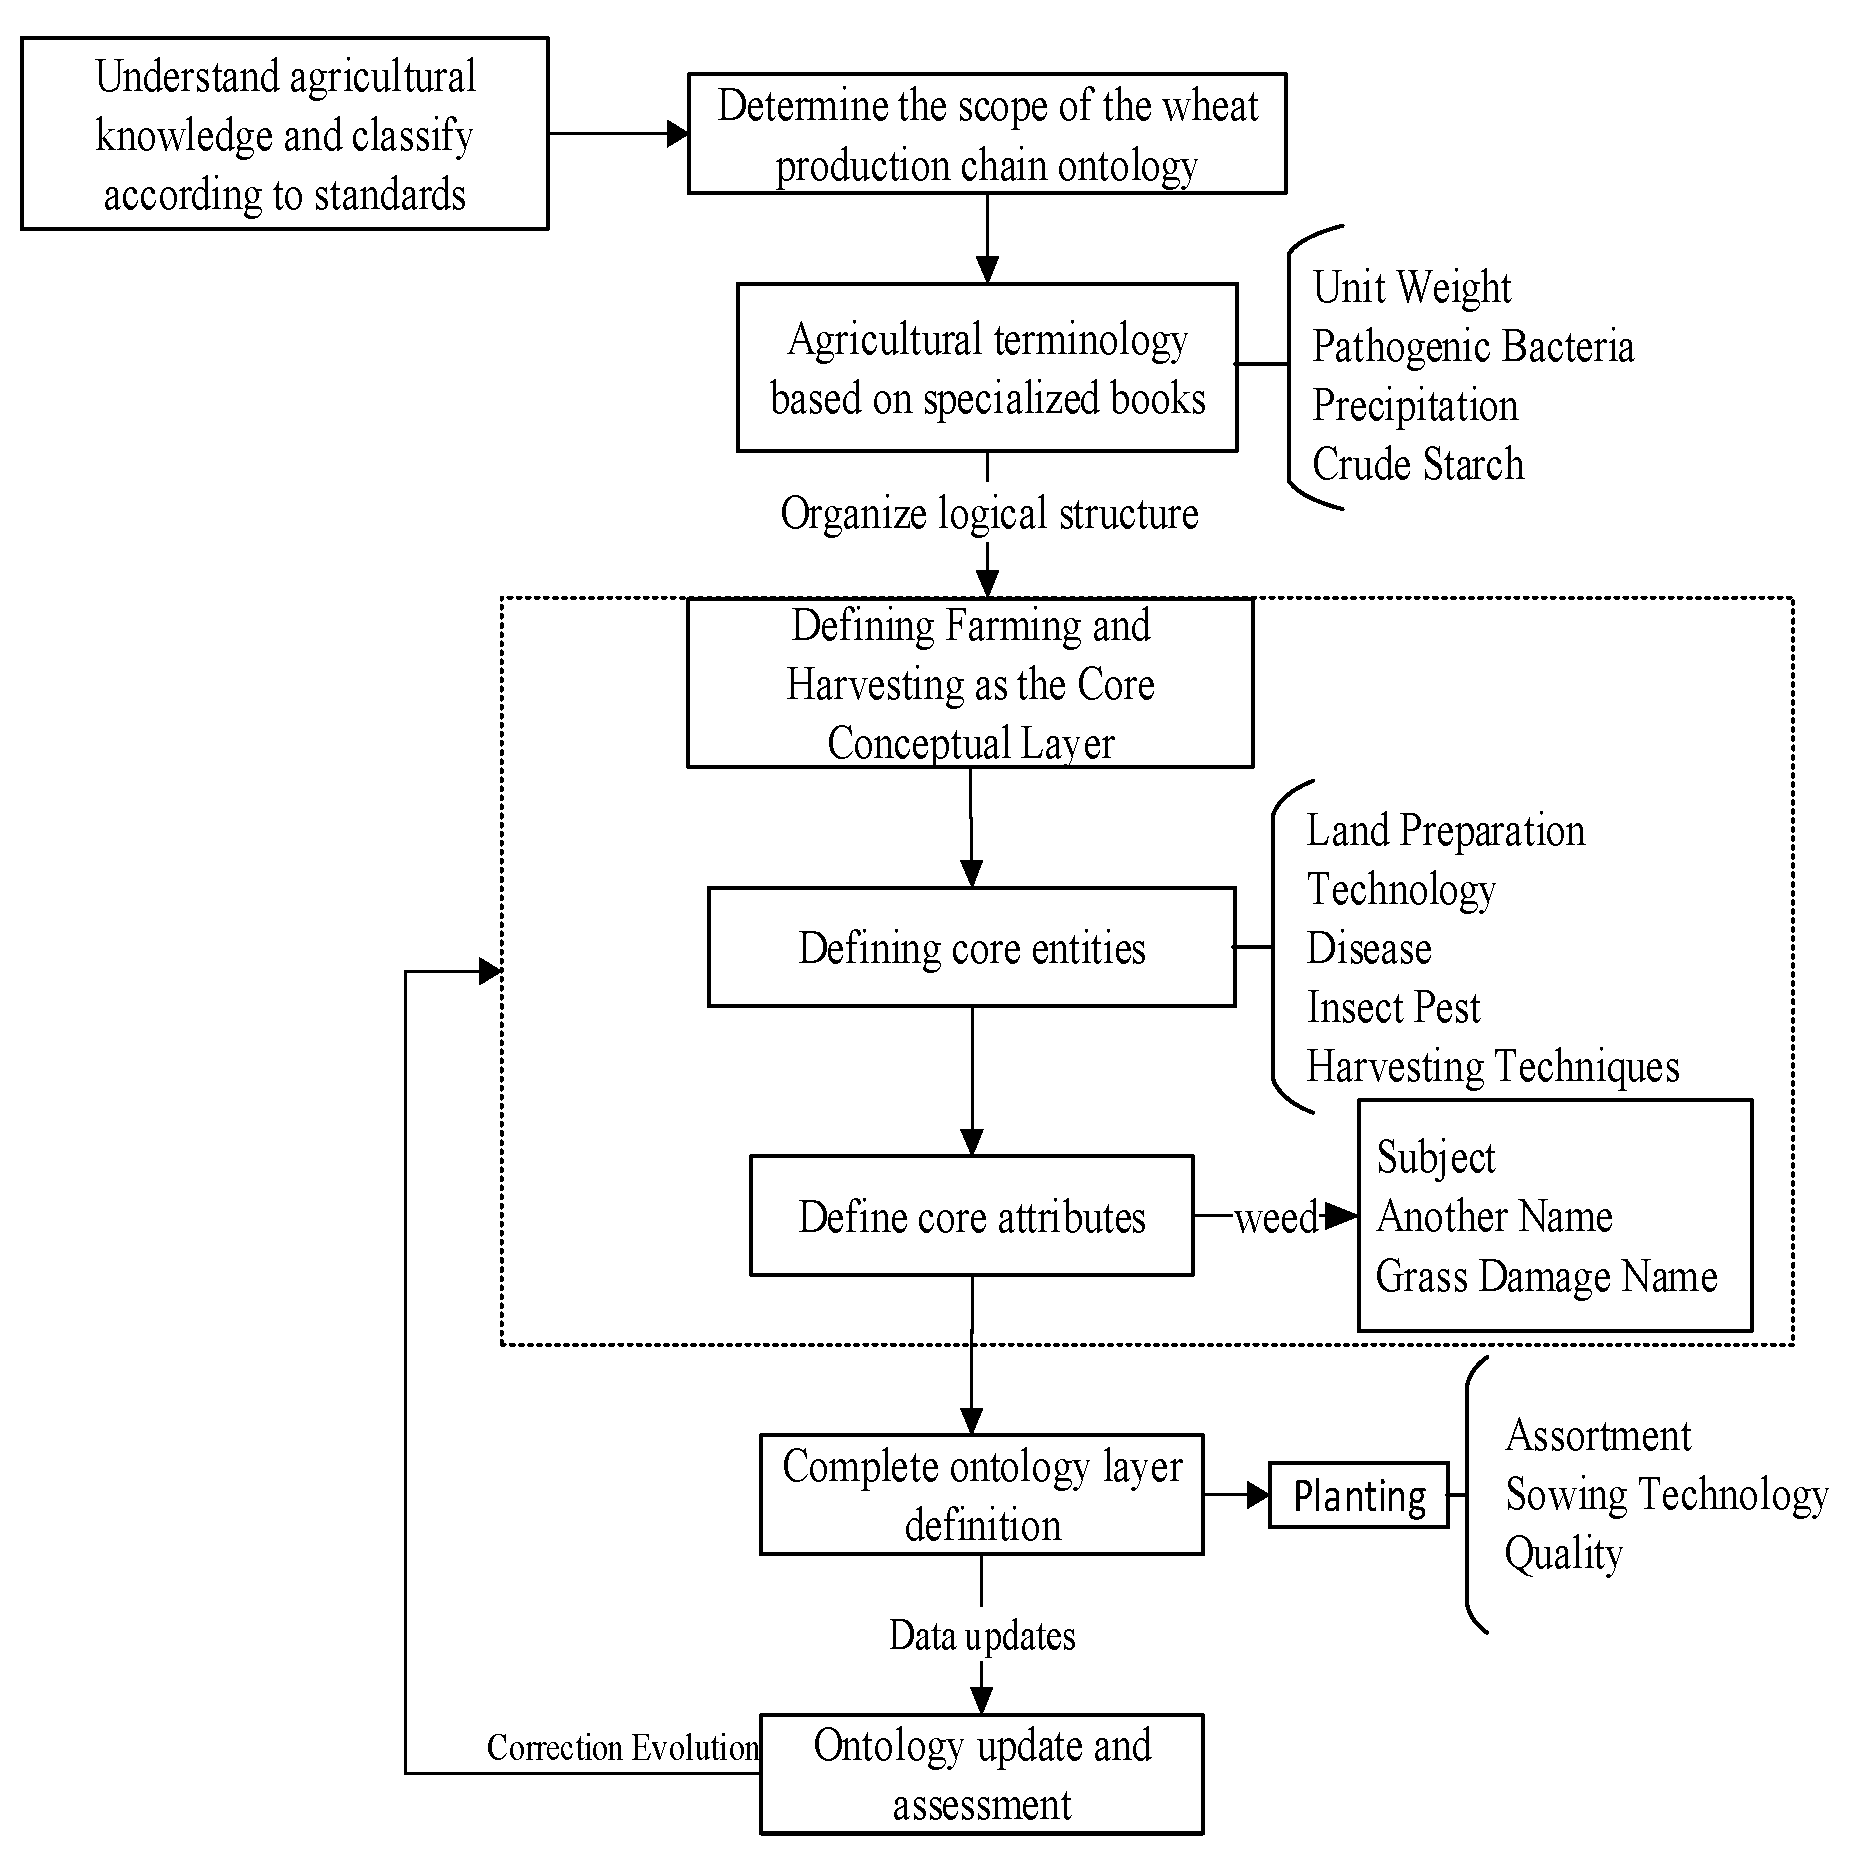
In this paper, a deep learning model based on a pre-trained language model (Word2Vec) combined with a bidirectional long short-term memory model (BiLSTM) and a conditional random field (CRF) (shown in Figure 5) is constructed for the named entity recognition. In this model, Word2Vec is used to generate word vectors and is pre-trained to better capture the semantic and syntactic relationships between words, which in turn increases the semantic understanding ability of the model. A bidirectional network of BiLSTM layers in the time dimension comprehensively captures the contextual information of the input sequence. The CRF mainly annotates the sequence data to better differentiate the interdependencies between the labels and adopts the Viterbi algorithm for global optimization of the whole sequence to obtain the optimal labeled sequence. For example, in the case of “Total Erosion Disease of Wheat, also known as Standing Blight”, if X = {x1,x2,……xn} denotes the text sequence of input CRF and Y = {y1,y2,……yn} denotes the corresponding output label sequence, then the score of the input sequence X on the corresponding predicted sequence Y is score (X, Y), which is calculated as the following (1):
where formula —the ith word is predicted to be the score of labels ; —label transfers the fraction of label .
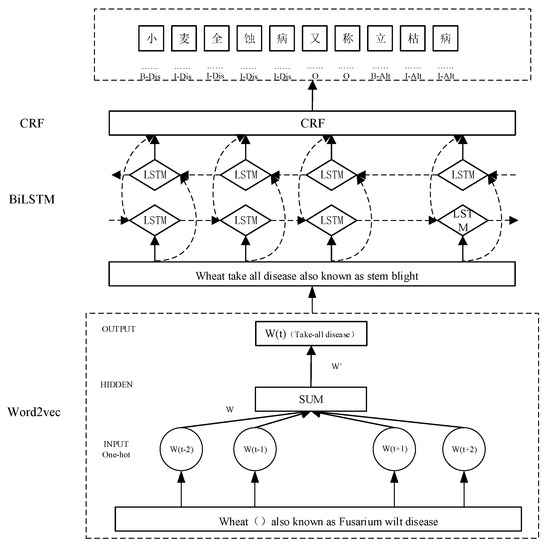
Figure 5.
Structure of Word2vec-BiLSTM-CRF model (Dis and Alt are abbreviations of the following labels: Dis—disease name; Alt—alternative name. The definition of “小麦全蚀病又称立枯病” is “Wheat take-all, also known as standing blight”).
The conditional probability of the predicted labeling sequence Y is P (Y/X), calculated as in Equation (2):
where formula —real labeling sequences;
—all possible labels;
—score for correct path prediction;
—score for a particular path among all paths.
The highest scoring label sequence is used as the final labeling result of the model using Equation (3).
5.2. Experiments and Analysis of Results
In order to make the constructed model more suitable for the data characteristics of this paper and accurately recognize the entities defined in the schema layer, the effect of the annotation method on the model performance is firstly explored. Secondly, the main hyperparameters of the model are experimentally determined. On this basis, the performance of different models on this experimental dataset is compared, and then, the optimal model that is more suitable for the data in this paper is identified. Finally, experiments are designed to verify the extent to which the construction of the fine-grained ontology system in this paper improves the accuracy of entity recognition [20].
The evaluation metrics of the model recognition effect are chosen as Precision (P), Recall (R), and the F1 value, which are commonly used in the entity recognition task, and the calculation of each metric is shown in (4), (5), and (6). In addition, since the division of the dataset has a certain impact on the performance of the entity recognition model, this paper adopts cross-validation to divide the experimental dataset into a training set, validation set, and test set with a ratio of 6:2:2.
5.2.1. Impact of Different Annotation Methods on Model Performance
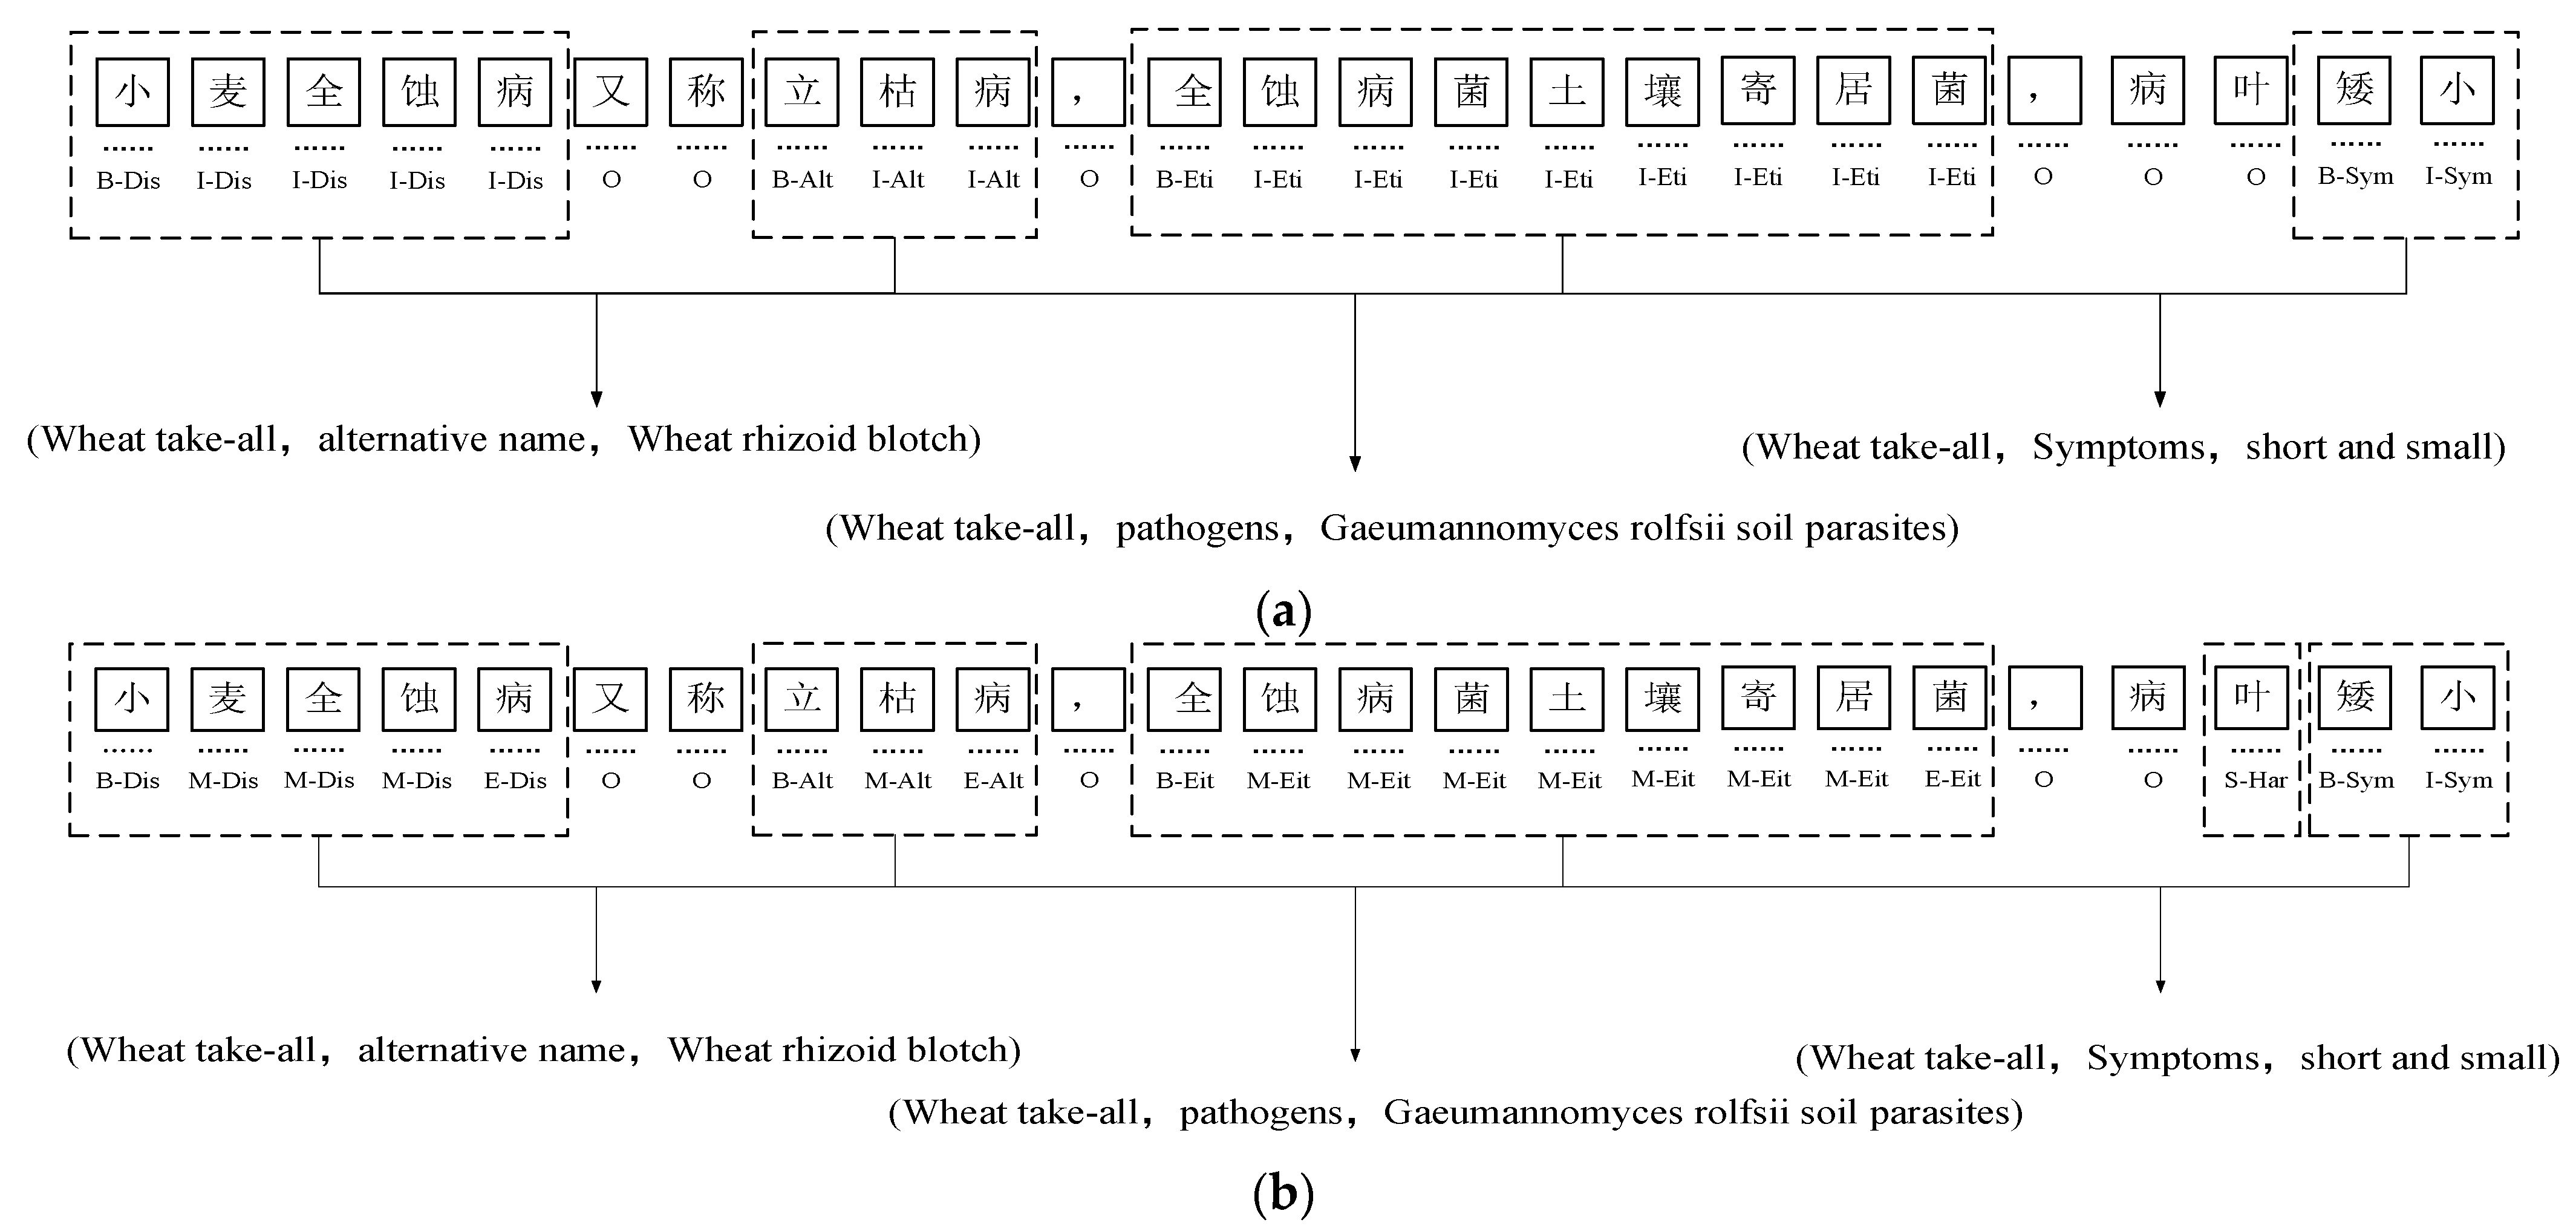
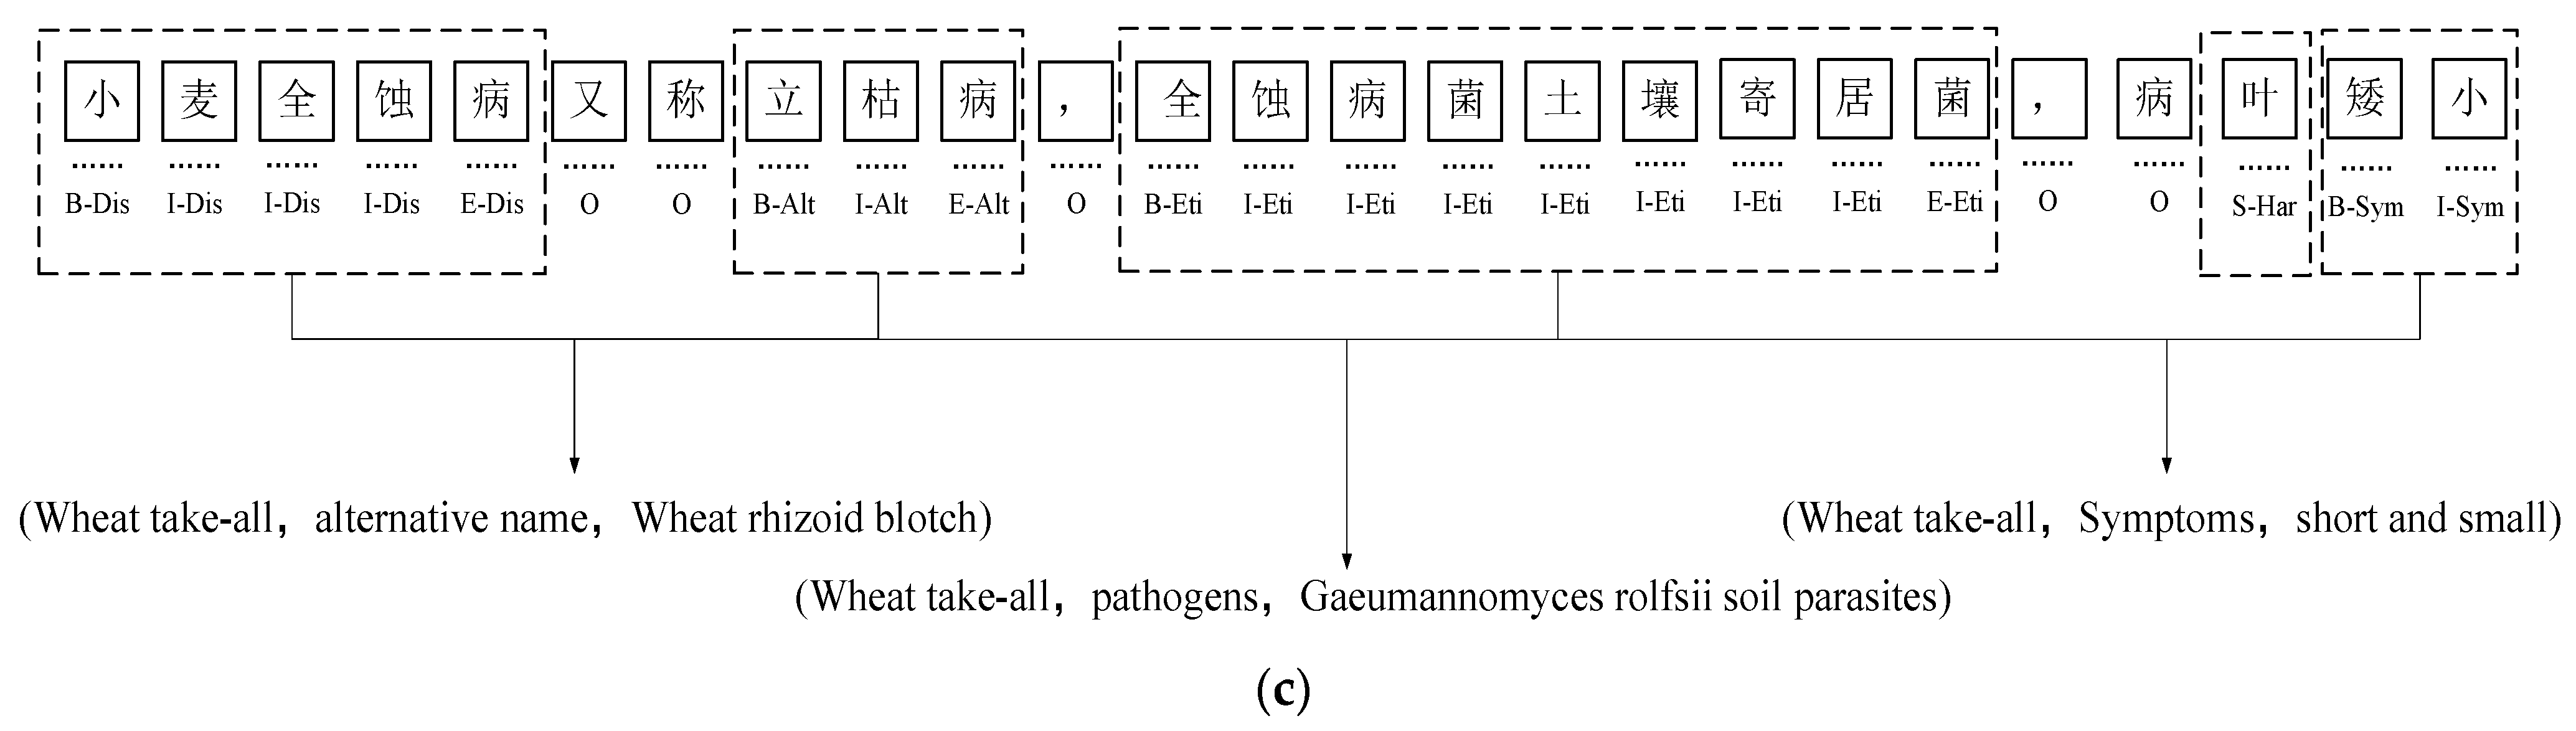
On the dataset constructed in this paper, experiments were conducted to compare the effects of three annotation methods, BIO, BIOES, and BMES, on the performance of the Word2vec-BiLSTM-CRF model for named entity recognition, and the results of the experiments are shown in Table 4. The specific meanings of the three annotation methods are as follows: B in the BIO and BIOES annotations stands for the beginning of an entity; I stand for the inside of an entity; O stands for characters other than entities; E in the BIOES annotation represents the end of the entity; and S denotes a single character as an entity. M in the BMES represents the interior of the entity, and the E represents the end of the entity. The specific labeling forms of the three labeling methods are shown in Figure 6. As can be seen from Table 4, compared with the other two annotation methods, the F1 value of the BIOES annotation method is slightly reduced, which means that BIOES cannot correctly deal with nested entities, leading to missing annotations; for the samples of entities with missing annotations, they will be processed as negative samples by the model, which ultimately leads to a higher number of negative samples and affects the recognition effect. The BMES annotation method is better than the other two methods in terms of both accuracy and the F1 value, but due to the large number of labels in this method, the labeling efficiency is low and not as simple as the BIO method. Therefore, in this paper, the BIO annotation method is used to annotate the wheat pest and disease data.
Table 4.
Experimental results of the effect of different annotation methods on the recognition performance of named entities of the same model.
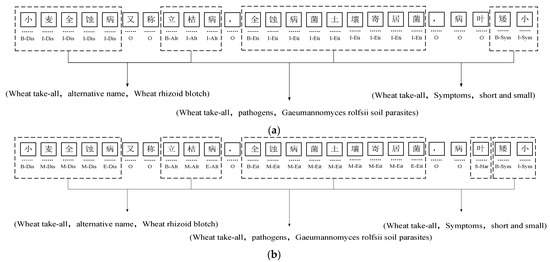
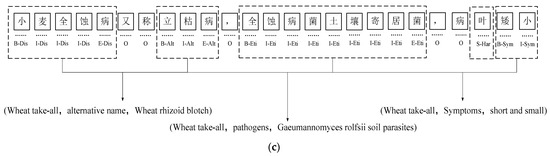
Figure 6.
Example of annotation, Dis, Alt, Eit, Har, and Sym are the abbreviations of the labels: (a) example of BIO annotation; (b) example of BMES annotation; (c) example of BIOES annotation. (Dis—disease name; Alt—alternative name; Eit—etiology; Har—harmful parts; Sym—symptoms. The definition of “小麦全蚀病又称立枯病,全蚀病菌土壤寄居菌,病叶矮小” is “Wheat take-all, also known as standing blight, total erosion bacteria soil-dwelling bacteria, disease leaves dwarf”).
5.2.2. Model Main Hyperparameter Settings
The parameters of batch_size and Epoch have a greater impact on the performance of the model. The batch_size value determines the direction of the model gradient descent, which directly affects the degree of optimization and training speed of the model. Increasing the batch_size value within a reasonable range can improve the memory utilization as well as the parallelization efficiency of large matrix multiplication, but when the training data are small, there may be a large fluctuation in the gradient value. The Epoch value affects the updating and optimization efficiency of the model. Therefore, this experiment selects different batch_size and Epochs for multiple rounds of experimental testing to determine their optimal values. That is to say, the Epoch is increased from 40 to 60 to 100 sequentially, and the corresponding batch_size values are 6, 12, and 16, respectively, to compare the performance of the Word2vec-BiLSTM-CRF model on this dataset; the results are shown in Table 5.
Table 5.
Effect of parameter values on model performance.
Analysis of Table 5 shows that when Epoch is 80 and the batch_size value is 12, the model has the best effect on recognizing entities. At an Epoch value less than 40, the model under-fits. At Epoch values greater than 100, the accuracy of the model decreases; if it continues to increase, the accuracy will continue to decrease. Therefore, the Epoch and batch_size values of the model are selected as 80 and 12, respectively, for the subsequent experiments.
5.2.3. Performance Comparison of Different Models
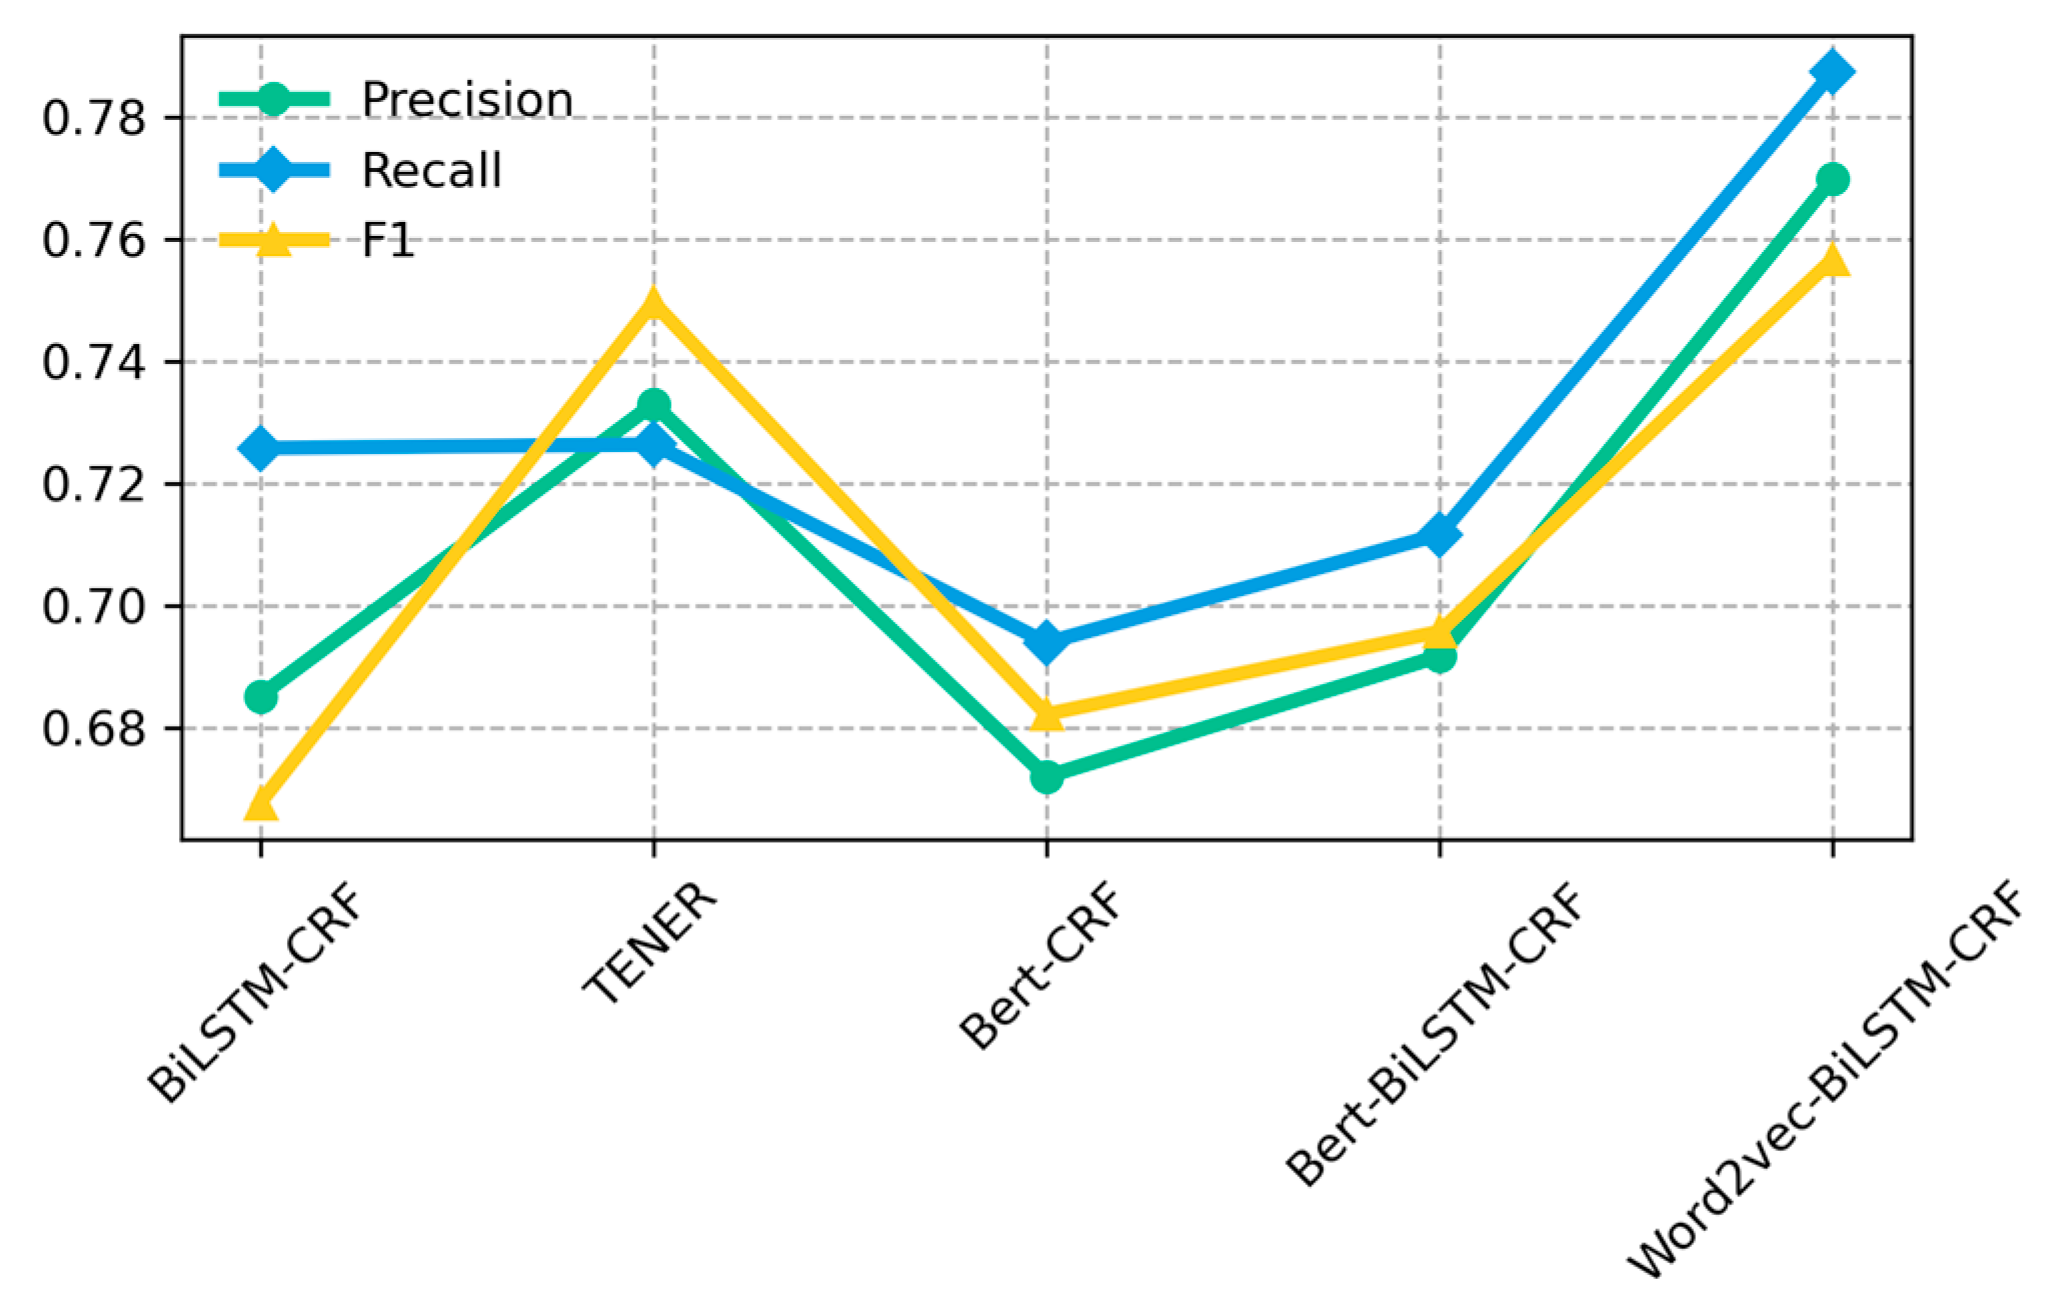
To validate the effectiveness of the Word2vec-BiLSTM-CRF proposed in this paper for named entity recognition on the dataset in this paper, experimental comparisons were made between the proposed model, the BiLSTM-CRF model, and the other models, respectively. In this experiment, the hyperparameter Epoch value of each model is 80, and the batch_size value is 12. The experimental results are shown in Table 6, and the results are displayed using Figure 7 to better visualize the performance of each model on this data.
Table 6.
Results of performance evaluation of different models using datasets in this paper.

Figure 7.
Comparison of different model experiments.
As can be seen from Table 6 and Figure 7, the precision, recall, and F1 value of the BiLSTM-CRF model are significantly improved by adding Word2vec as well as the Bert to the BiLSTM-CRF model. Comparing the Word2vec-BiLSTM-CRF model with the BiLSTM-CRF model, the former improves the accuracy by 8.44%, the recall by 6.15%, and the F1 value by 8.89%; comparing the Bert-BiLSTM-CRF model with the BiLSTM-CRF model, the former improves the accuracy by 0.65% and the F1 value by 2.8%. The reason is that Word2vec word embedding solves the problem of sparse one-hot coding vectors to a certain extent, which represent sentences as character-level feature vectors while retaining contextual semantic information. For the Bert-BiLSTM-CRF model, the slightly inferior performance on this paper’s dataset is because the Bert model is more suitable for large-scale sample sets.
5.2.4. Comparison of Ontology Recognition Effect under Different Granularity
To further validate this conclusion, this paper compares the performance of four models, such as Bert-BiLSTM-CRF, using the large-scale public dataset CMeEE-V2 (the dataset entities are divided into nine categories with a total of 5000 samples) in the medical domain, and the results are shown in Table 7. As can be seen from Table 7, the Bert-BiLSTM-CRF model significantly outperforms the other models on the large-scale dataset. In comparison, Word2vec-BiLSTM-CRF does not improve significantly. In summary, the Word2vec-BiLSTM-CRF model is more suitable for the small sample dataset in this paper.
Table 7.
Results of performance evaluation of different models using public datasets.
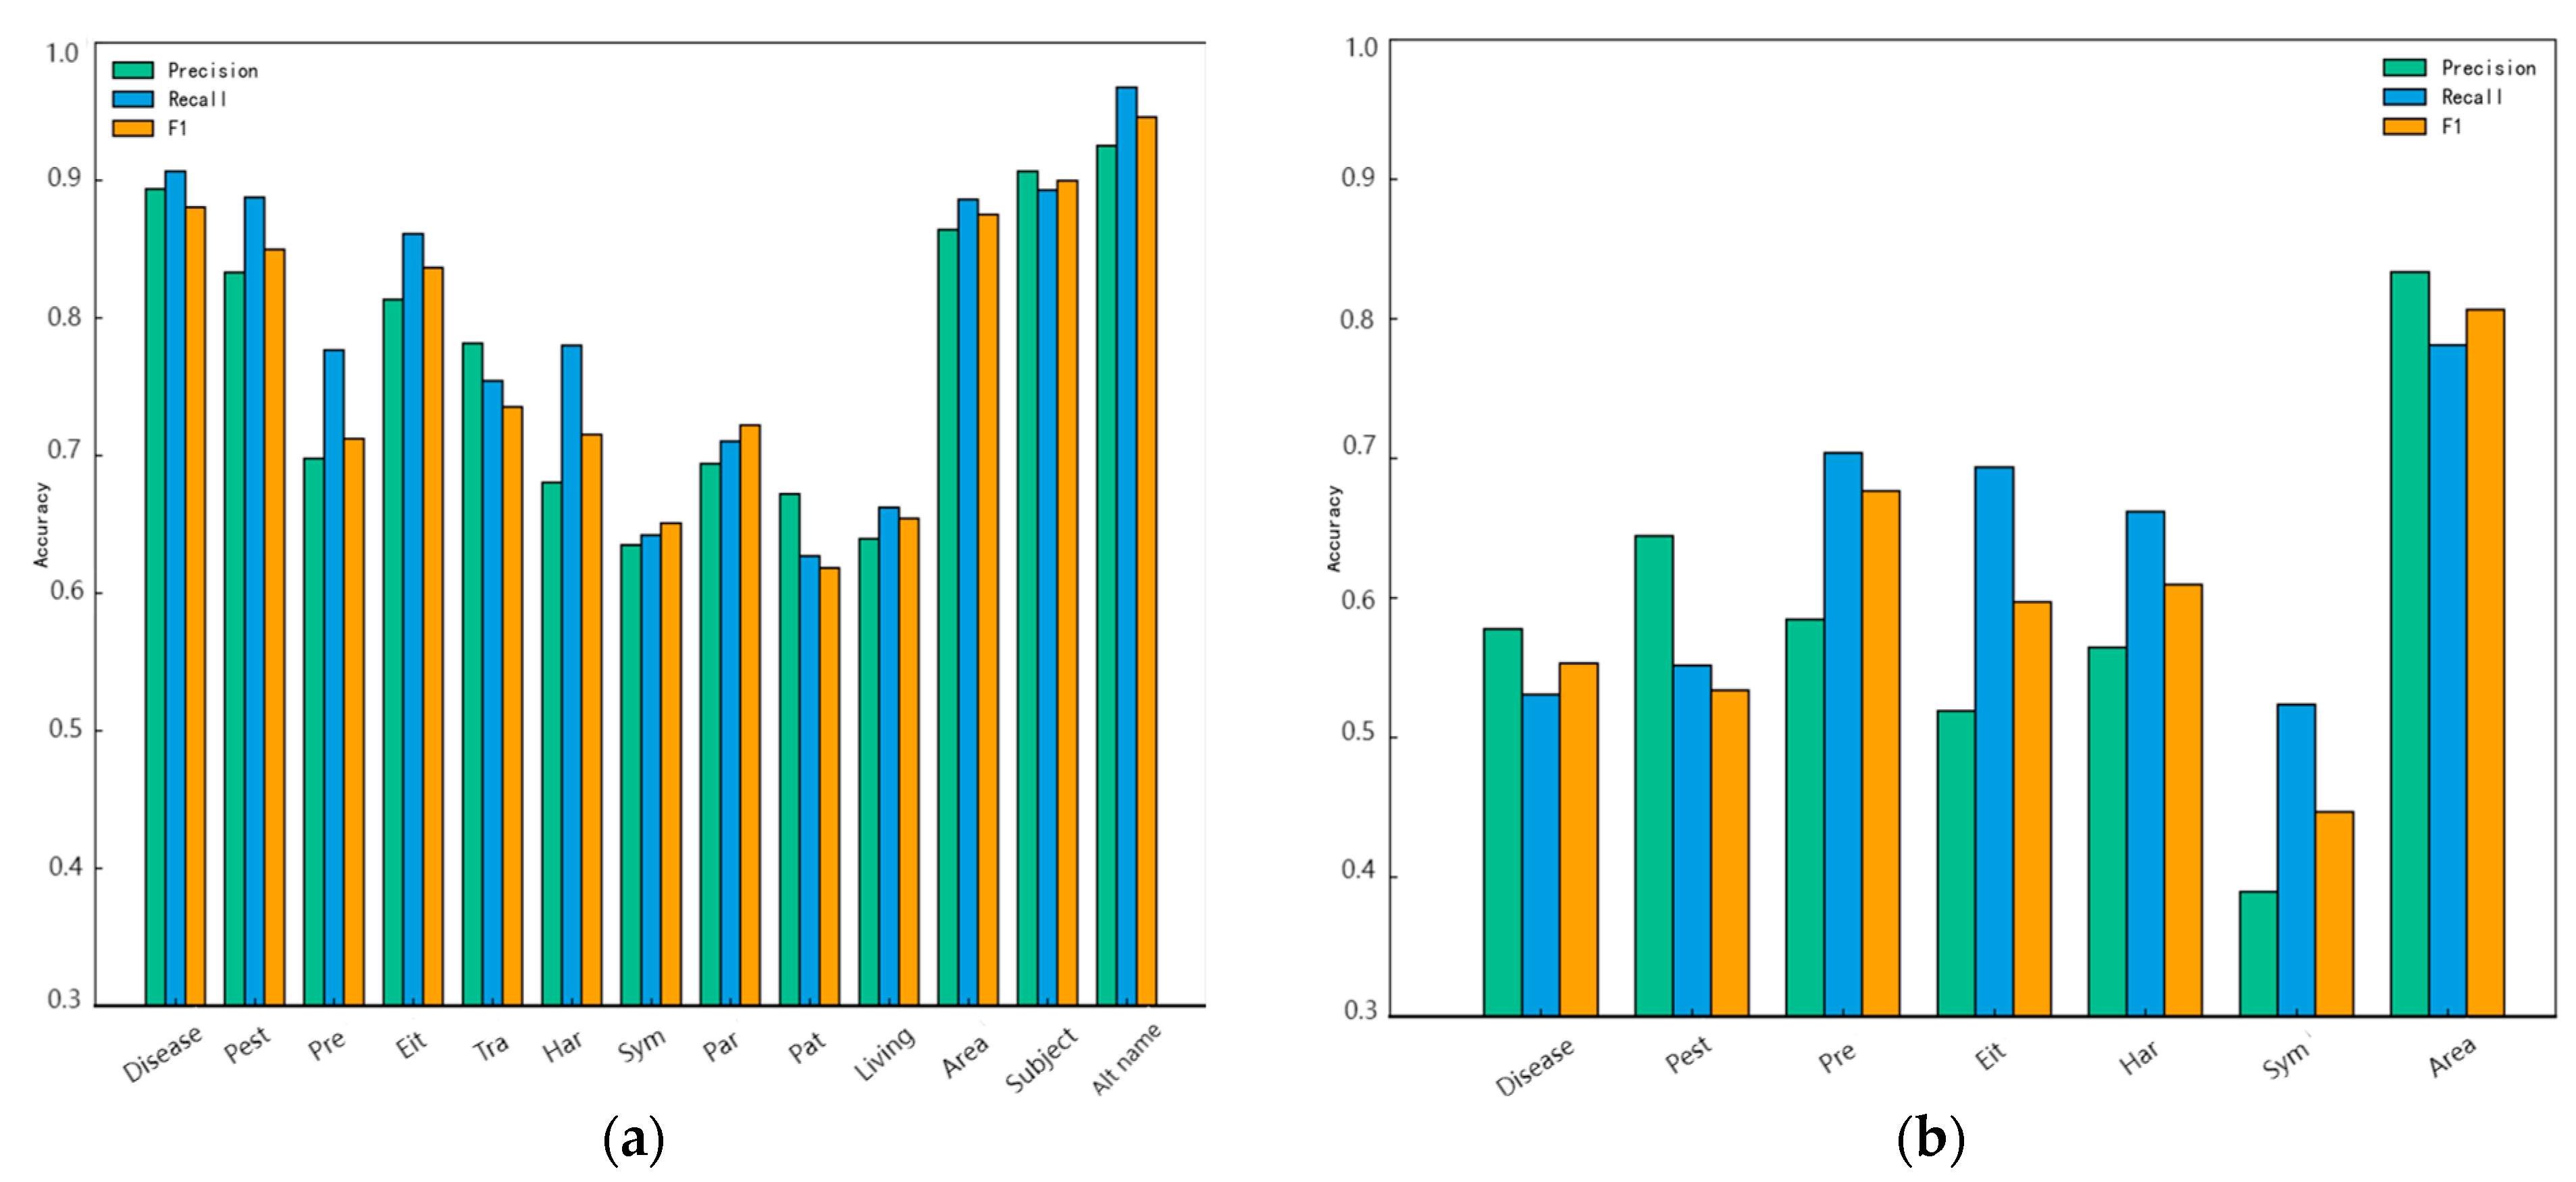
To verify the effect of different granularity of the ontology layer definition on the entity recognition performance of the model, this paper divides the entities of the pest and disease dataset into two kinds of coarse and fine granularity and adopts Word2vec-BiLSTM-CRF to conduct experimental comparisons, whose results are shown in Table 8 (fine granularity) and Table 9 (coarse granularity); the corresponding visualization diagrams are shown in Figure 8a,b. As shown in Table 8 and Table 9, the recognition accuracies of the “disease name” entity are 0.5532 and 0.8803 in coarse and fine granularity, respectively, while the recognition accuracies of the “pest name” entity are 0.5337 and 0.8495 in coarse and fine granularity, respectively, and the accuracy of the two is improved by 32.71% and 31.58%, respectively. In addition, comparing Figure 8a,b, it can be seen that the recognition accuracies of each entity category at the fine-grained ontology are higher than those at the coarse-grained ontology. It is further illustrated that the fine-grained definition of the ontology makes the model’s learning of knowledge more comprehensive and accurate, and greatly improves the accuracy and F1 value of the model’s recognition of entities.
Table 8.
Fine-grained ontology naming recognition results.
Table 9.
Coarse-grained ontology naming recognition results.

Figure 8.
Named entity recognition results: (a) fine-grained ontology; (b) coarse-grained ontology.
In order to further verify the effectiveness of fine-grained entity definitions for entity recognition, this paper conducts comparative tests between entities defined by coarse and fine grains (i.e., Table 8 and Table 9) on several models, and the results are shown in Table 10. From Table 10, it can be seen that the recognition effect of fine-grained entities is better than that of coarse-grained under all four models, and it is quite significant. Among them, the F1 values of the BiLSTM-CRF model are 0.2672 and 0.6678 for coarse and fine grains, respectively, and the difference between them is 0.4006, which is the most obvious compared to the other three models, again indicating that the entity recognition effect under fine grains is better than that of coarse grains.
Table 10.
Entity recognition effect of different models under coarse and fine granularity.
5.3. Knowledge Storage and Visualization
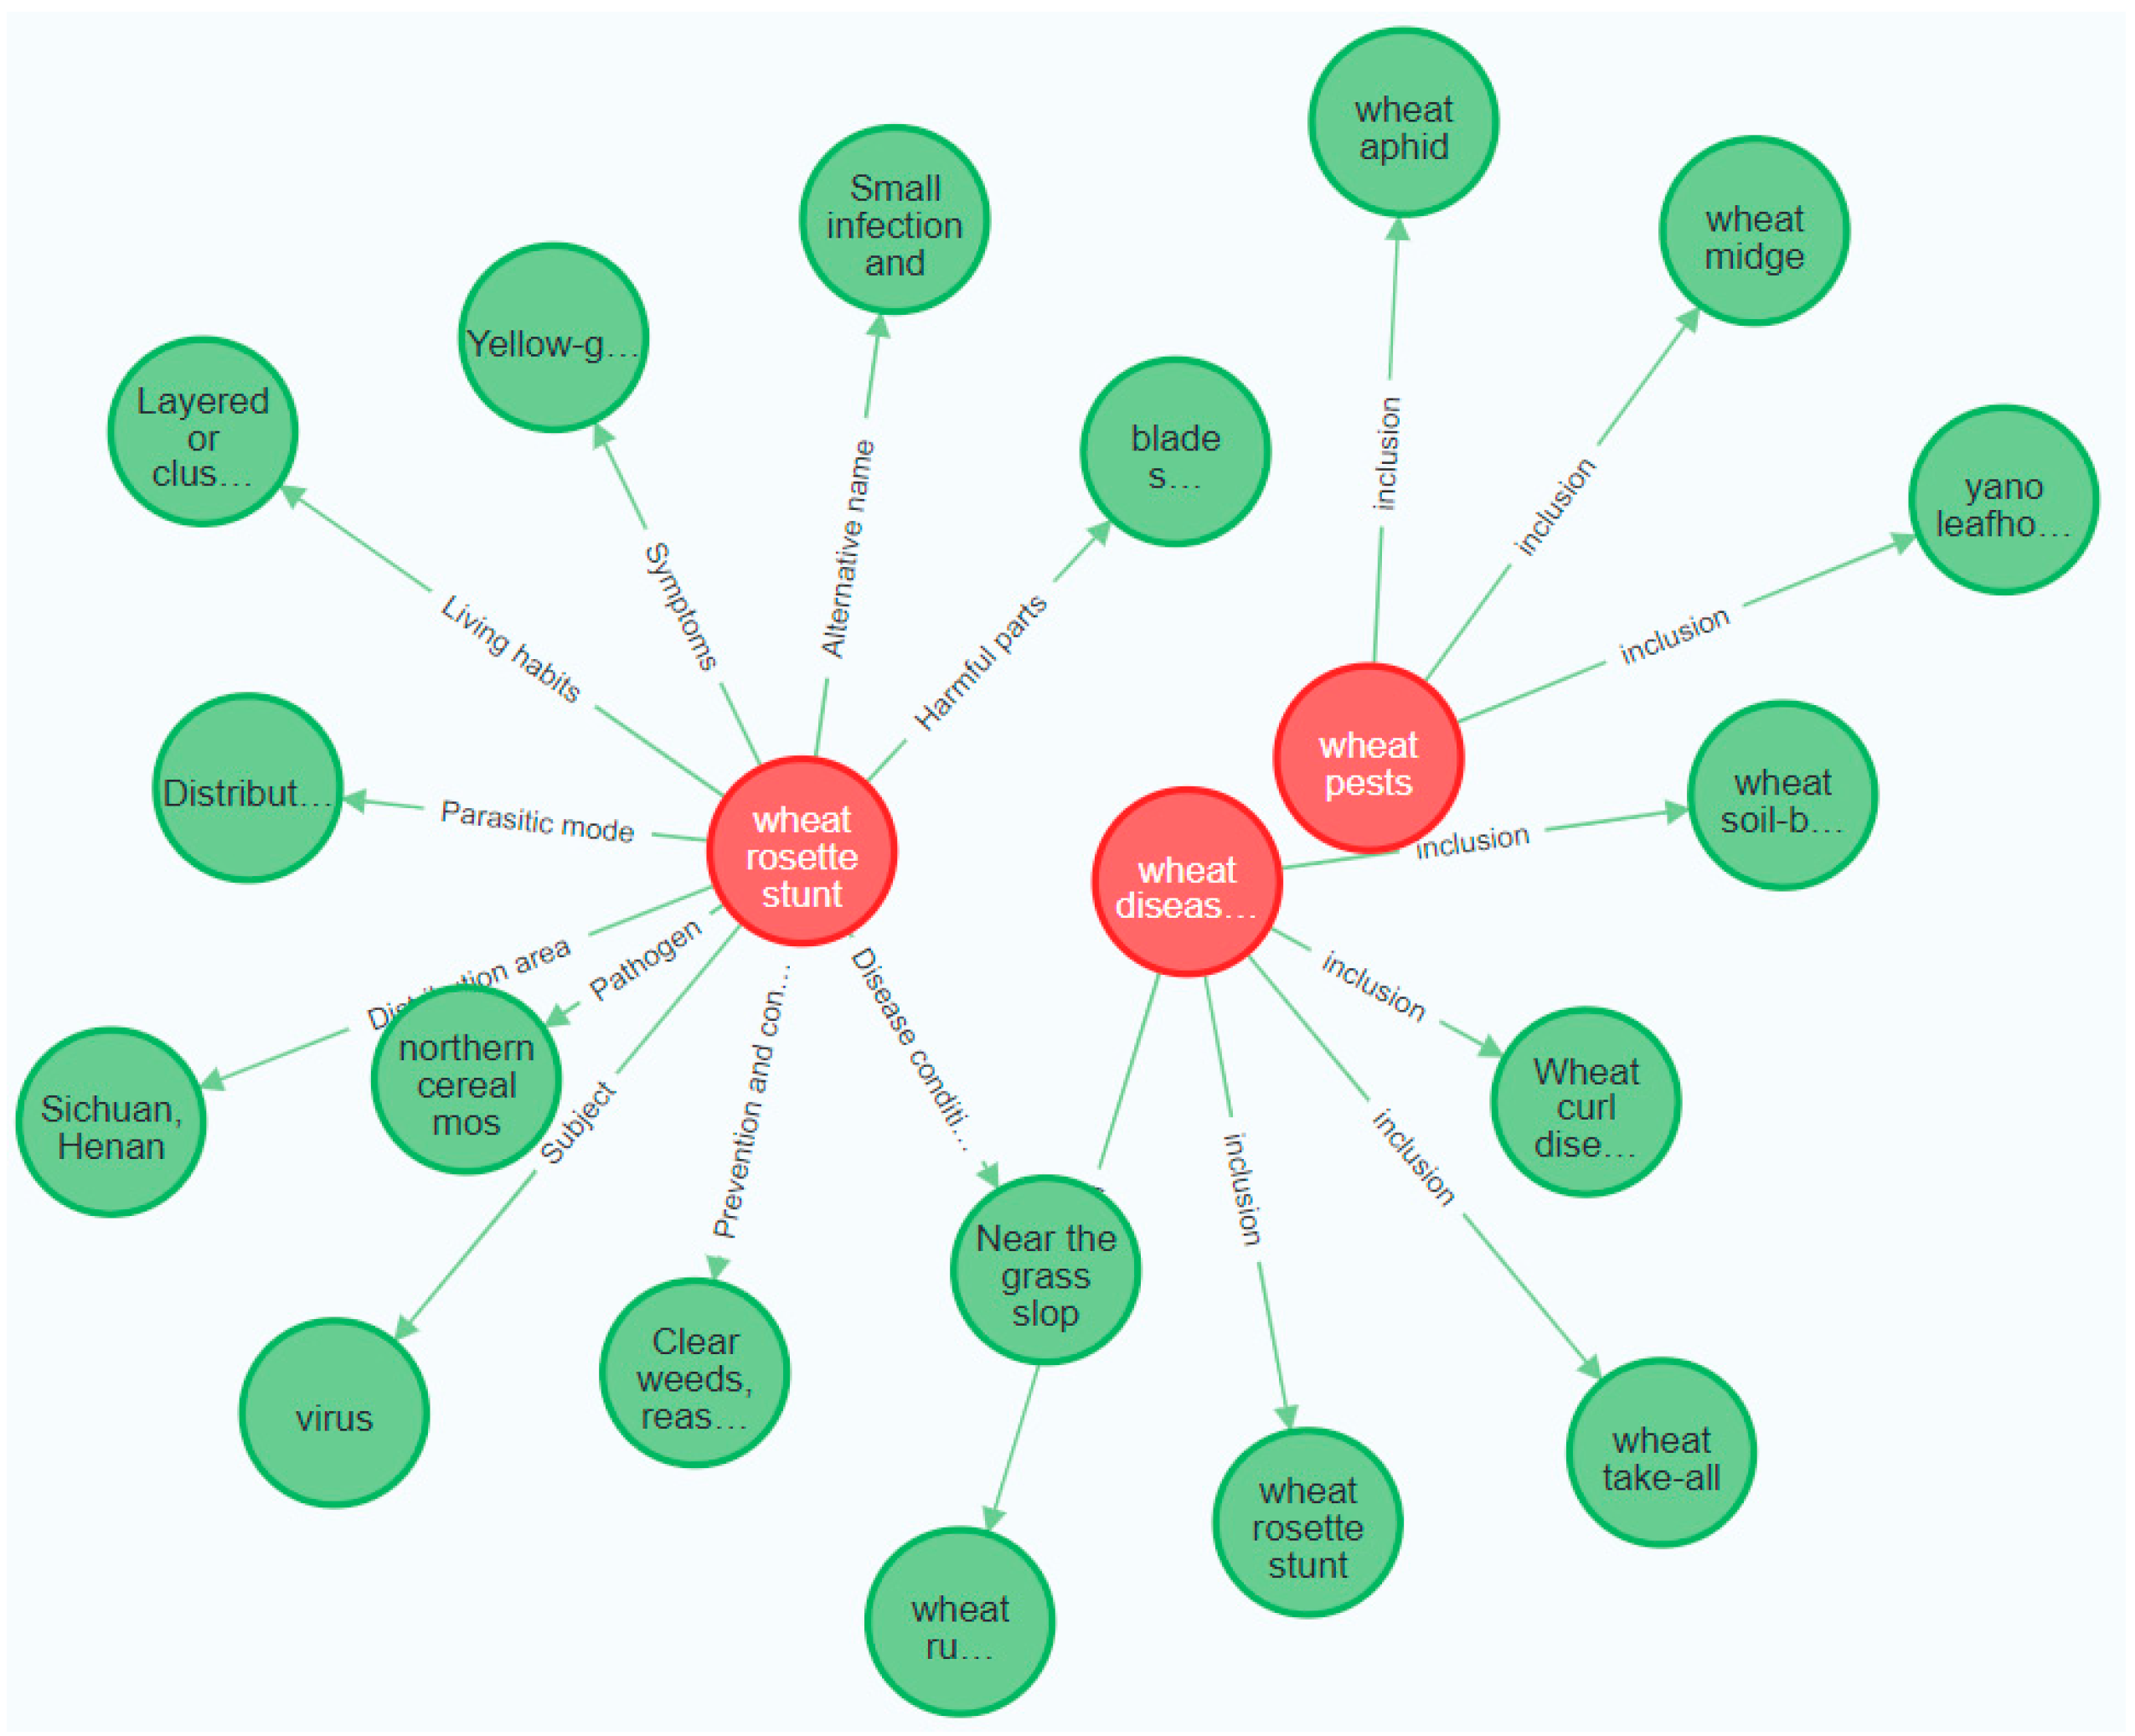
In this paper, we use the Neo4j [21,22] graph database to store and visualize the extracted triplet knowledge [23]. Compared with other storage methods, this graph database is more intuitive and stable. That is to say, the triplet knowledge obtained in the experiment is imported into the graph database through Py2neo, and the Cypher language is used to achieve the visual display of the graph; the partial results are shown in Figure 9.

Figure 9.
Knowledge graph of parts of the wheat production chain. (The red circle represents the pest name in the production chain, the green circle represents the attribute value in the pest entity, the horizontal line represents the attribute, and the arrow indicates the direction).
6. Conclusions
To construct a knowledge graph base for the wheat production chain, this paper proposes a fine-grained knowledge extraction method. Focusing on the ontology-based schema layer construction method and the deep learning model-based knowledge extraction method, its main work can be summarized as follows:
(1) Based on the ontology concept, the wheat production chain is divided into four segments, namely ploughing, planting, managing, and harvesting, which are used as the conceptual layer to construct a spatio-temporal ontology system of the wheat production chain. Based on this system, the entities, inter-entity relationships, and corresponding attributes [24] of each link are defined in detail, forming a fine-grained wheat production chain ontology layer containing four concepts, twenty-eight entities, and forty-two relationships. This layer guides the construction of the data layer to realize the accurate and comprehensive extraction of knowledge. The construction of ontologies serves as the most fundamental aspect of knowledge mapping, and the knowledge base formed through ontology repositories not only has a strong hierarchical structure but also has a low level of redundancy to ensure that the mapping provides guidance;
(2) The wheat production chain database was constructed. Various types of wheat production chain data were comprehensively collected through the Internet, and after pre-processing the obtained data, annotation methods and tools suitable for the characteristics of this dataset were selected. Then, the data in the dataset were annotated based on the entities and relationships defined in the schema layer, forming a database with 5356 samples of a wheat production chain corpus (in this paper, only the pest and disease data were selected for the experiment);
(3) A Word2vec-BiLSTM-CRF model was constructed for entity and relationship extraction in the dataset of this paper. Firstly, the experiment compares the recognition performance of this paper’s model with the other SOTA models on this paper’s dataset, and the results show that the recognition accuracy of this paper’s model is improved by 8.44%, the recall is improved by 6.15%, and the F1 value is improved by 8.89% compared with the BiLSTM-CRF model. Further, the entities of the pest and disease dataset are divided into two granularities, coarse and fine, and Word2vec-BiLSTM-CRF is used to conduct the experiments for comparison. The results show that for the entity “disease name”, the recognition accuracies at the coarse and fine granularity are 0.5532 and 0.8803, respectively; for the entity “pest name”, the recognition accuracies at the coarse and fine granularity are 0.5337 and 0.8495, respectively; and the accuracies are improved by 32.71% and 31.58%, respectively. This indicates that the fine-grained entity definition can enable the model to recognize entities better. In summary, the work in this paper provides a direction for fine-grained knowledge extraction, and the constructed knowledge graph library of the wheat production chain provides knowledge support for agricultural knowledge services.
The next step of the research will continue to expand the data sources and scale, such as adding image data, constructing a cross-modal knowledge base, and providing more knowledge modes for the knowledge graph-based query so that it can be adapted to a wider range of applications.
Author Contributions
Conceptualization, J.L.; methodology, J.L. and W.Y.; software, J.L., L.H. and Q.F.; formal analysis, J.L., S.Y. and T.Z.; data curation, J.L. and S.Y.; writing—original draft preparation, J.L. and S.Y.; writing—review and editing, J.L. and S.Y. All authors have read and agreed to the published version of the manuscript.
Funding
This research was funded by the National Key R&D Program of China (2022ZD0115801); Data Acquisition and Processing and Testing and Analyzing the Knowledge Graph of Smart Farm Brain (GSAU-JSFW-2023-97).
Data Availability Statement
Data are contained within the article.
Conflicts of Interest
The authors declare no conflicts of interest.
References
- Yang, Y.; Lu, Y.; Yan, W. A comprehensive review on knowledge graphs for complex diseases. Brief. Bioinform. 2023, 24, bbac543. [Google Scholar] [CrossRef] [PubMed]
- Meng, X.; Yang, C.; Jin, L.; Bi, J. Research on the Construction and Application of Knowledge Graph in Military Domain. IOP Conf. Ser. Mater. Sci. Eng. 2020, 806, 012053. [Google Scholar]
- Zhang, Z.; Ni, Z.; Liu, Z.; Xia, S. Research on dynamic relationship prediction method for financial knowledge graph. Data Anal. Knowl. Discov. 2023, 7, 39–50. [Google Scholar] [CrossRef]
- Chang, C. The AOS project of the Food and Agriculture Organization of the United Nations. J. Agric. Libr. Inf. 2003, 24, 14–15. [Google Scholar]
- Guo, S.; Wang, X.; Ma, Y. The performance evaluation of comprehensive agricultural information service platform based on ontology research. J. Hubei Agric. Sci. 2022, 21, 249–256. [Google Scholar]
- Qiao, B. Research on Knowledge Map Construction Technology Based on Agricultural Thesaurus; Hunan Agricultural University: Changsha, China, 2021. [Google Scholar]
- Chen, Z. Agricultural production optimization analysis based on cloud platform and multi-source data. Use Maint. Agric. Mach. 2024, 6, 130–132. [Google Scholar]
- Liu, G.; Yang, Q.; Liu, Q. Ontology Construction and Visualization Research on Agricultural Science Datasets—Taking the Field of “Cotton Disease Prevention and Control” as an Example. J. Intell. 2022, 41, 143–149. [Google Scholar]
- Wang, Y.; Wang, Y.; Yuan, Y.; Guo, Y.; Zhang, Z.; Deng, L.; Li, L. A Decision Support System for Citrus Fertilizer and Water Management Based on Semantic Ontology. J. Agric. Eng. 2014, 30, 9. [Google Scholar]
- Jiang, L.; Zhao, R.; Dong, C.; Chao, X.; Xie, N.; Fang, S. Construction and validation of a visual knowledge graph for aquatic diseases based on deep learning. J. Agric. Eng. 2023, 15, 259–267. [Google Scholar]
- Chen, Y.; Xian, J.; Kou, Y.; Guo, S.; Liu, X. Research on the Construction of Knowledge Graph for China’s Apple Industry. China Agric. Resour. Reg. 2017, 38, 40–45. [Google Scholar]
- Deng, Z. Research on Named Entity Recognition of Ornamental Plants Based on BiLSTM-CRF Mode; Hunan Agricultural University: Changsha, China, 2021. [Google Scholar]
- Greff, K.; Srivastava, R.K.; Koutník, J. LSTM: A search space odyssey. IEEE Trans. Neural Netw. Learn. Syst. 2017, 28, 2222–2232. [Google Scholar] [CrossRef] [PubMed]
- Zhang, S.; Wang, Z.; Wang, Z. Prediction of wheat stripe rust by combining knowledge graph and bidirectional long and short-term memory networks. Trans. Chin. Soc. Agric. Eng. 2020, 36, 172–178. [Google Scholar]
- Mikolov, T.; Chen, K.; Corrado, G. Efficient Estimation of Word Representations in Vector Space. arXiv 2013, arXiv:1301.3781. [Google Scholar]
- Xu, X.; Yue, J.; Zhao, J.; Wang, Y.; Ma, X.; Qian, X. Research on the Construction and Visualization of Wheat Variety Knowledge Graph. Comput. Syst. Appl. 2021, 30, 7. [Google Scholar]
- Rotmensch, M.; Halpern, Y.; Tlimat, A. Learning a Health Knowledge Graph from Electronic Medical Records. Sci. Rep. 2017, 7, 5994. [Google Scholar] [CrossRef] [PubMed]
- Chen, S.; Zhao, Y. The Technology of Military Knowledge Graph Construction Based on Multiple Open Data Sources. In Proceedings of the 2020 5th International Conference on Mechanical, Control and Computer Engineering (ICMCCE), Harbin, China, 25–27 December 2020. [Google Scholar] [CrossRef]
- Li, G.; Zhang, P. A Web knowledge extraction model based on agricultural ontology. Jiangsu Agric. Sci. 2018, 46, 5. [Google Scholar]
- Mao, Q.; Li, X.; Peng, H.; Li, J.; He, D.; Guo, S.; He, M.; Wang, L. Event prediction based on evolutionary event ontology knowledge. Future Gener. Comput. Syst. 2020, 115, 76–89. [Google Scholar] [CrossRef]
- Wang, H.; Wang, X. Research on the construction of linguistic term knowledge map based on Neo4j. Chin. J. Sci. Technol. Terminol. 2023, 25, 18–26. [Google Scholar]
- Li, J.; Hou, L. Reviews on Knowledge Graph Research. J. Shanxi Univ. Nat. Sci. Ed. 2017, 40, 454–459. [Google Scholar]
- Ma, F.; Li, X.; Huang, W. The bogie knowledge base based on knowledge atlas secondary building. J. Dalian Jiao Tong Univ. 2023, 44, 79–85. [Google Scholar]
- Li, J. Knowledge Extraction and Graph Construction Technology Based on ontology Database. Sci. Technol. Innov. Appl. 2024, 14, 37–40. [Google Scholar]


Disclaimer/Publisher’s Note: The statements, opinions and data contained in all publications are solely those of the individual author(s) and contributor(s) and not of MDPI and/or the editor(s). MDPI and/or the editor(s) disclaim responsibility for any injury to people or property resulting from any ideas, methods, instructions or products referred to in the content. |
© 2024 by the authors. Licensee MDPI, Basel, Switzerland. This article is an open access article distributed under the terms and conditions of the Creative Commons Attribution (CC BY) license (https://creativecommons.org/licenses/by/4.0/).