
Quantitative Trait Loci Analysis of Maize Husk Characteristics Associated with Gibberella Ear Rot Resistance

 , , and
Abstract
:1. Introduction
2. Materials and Methods
2.1. Genetic Materials and Experimental Design
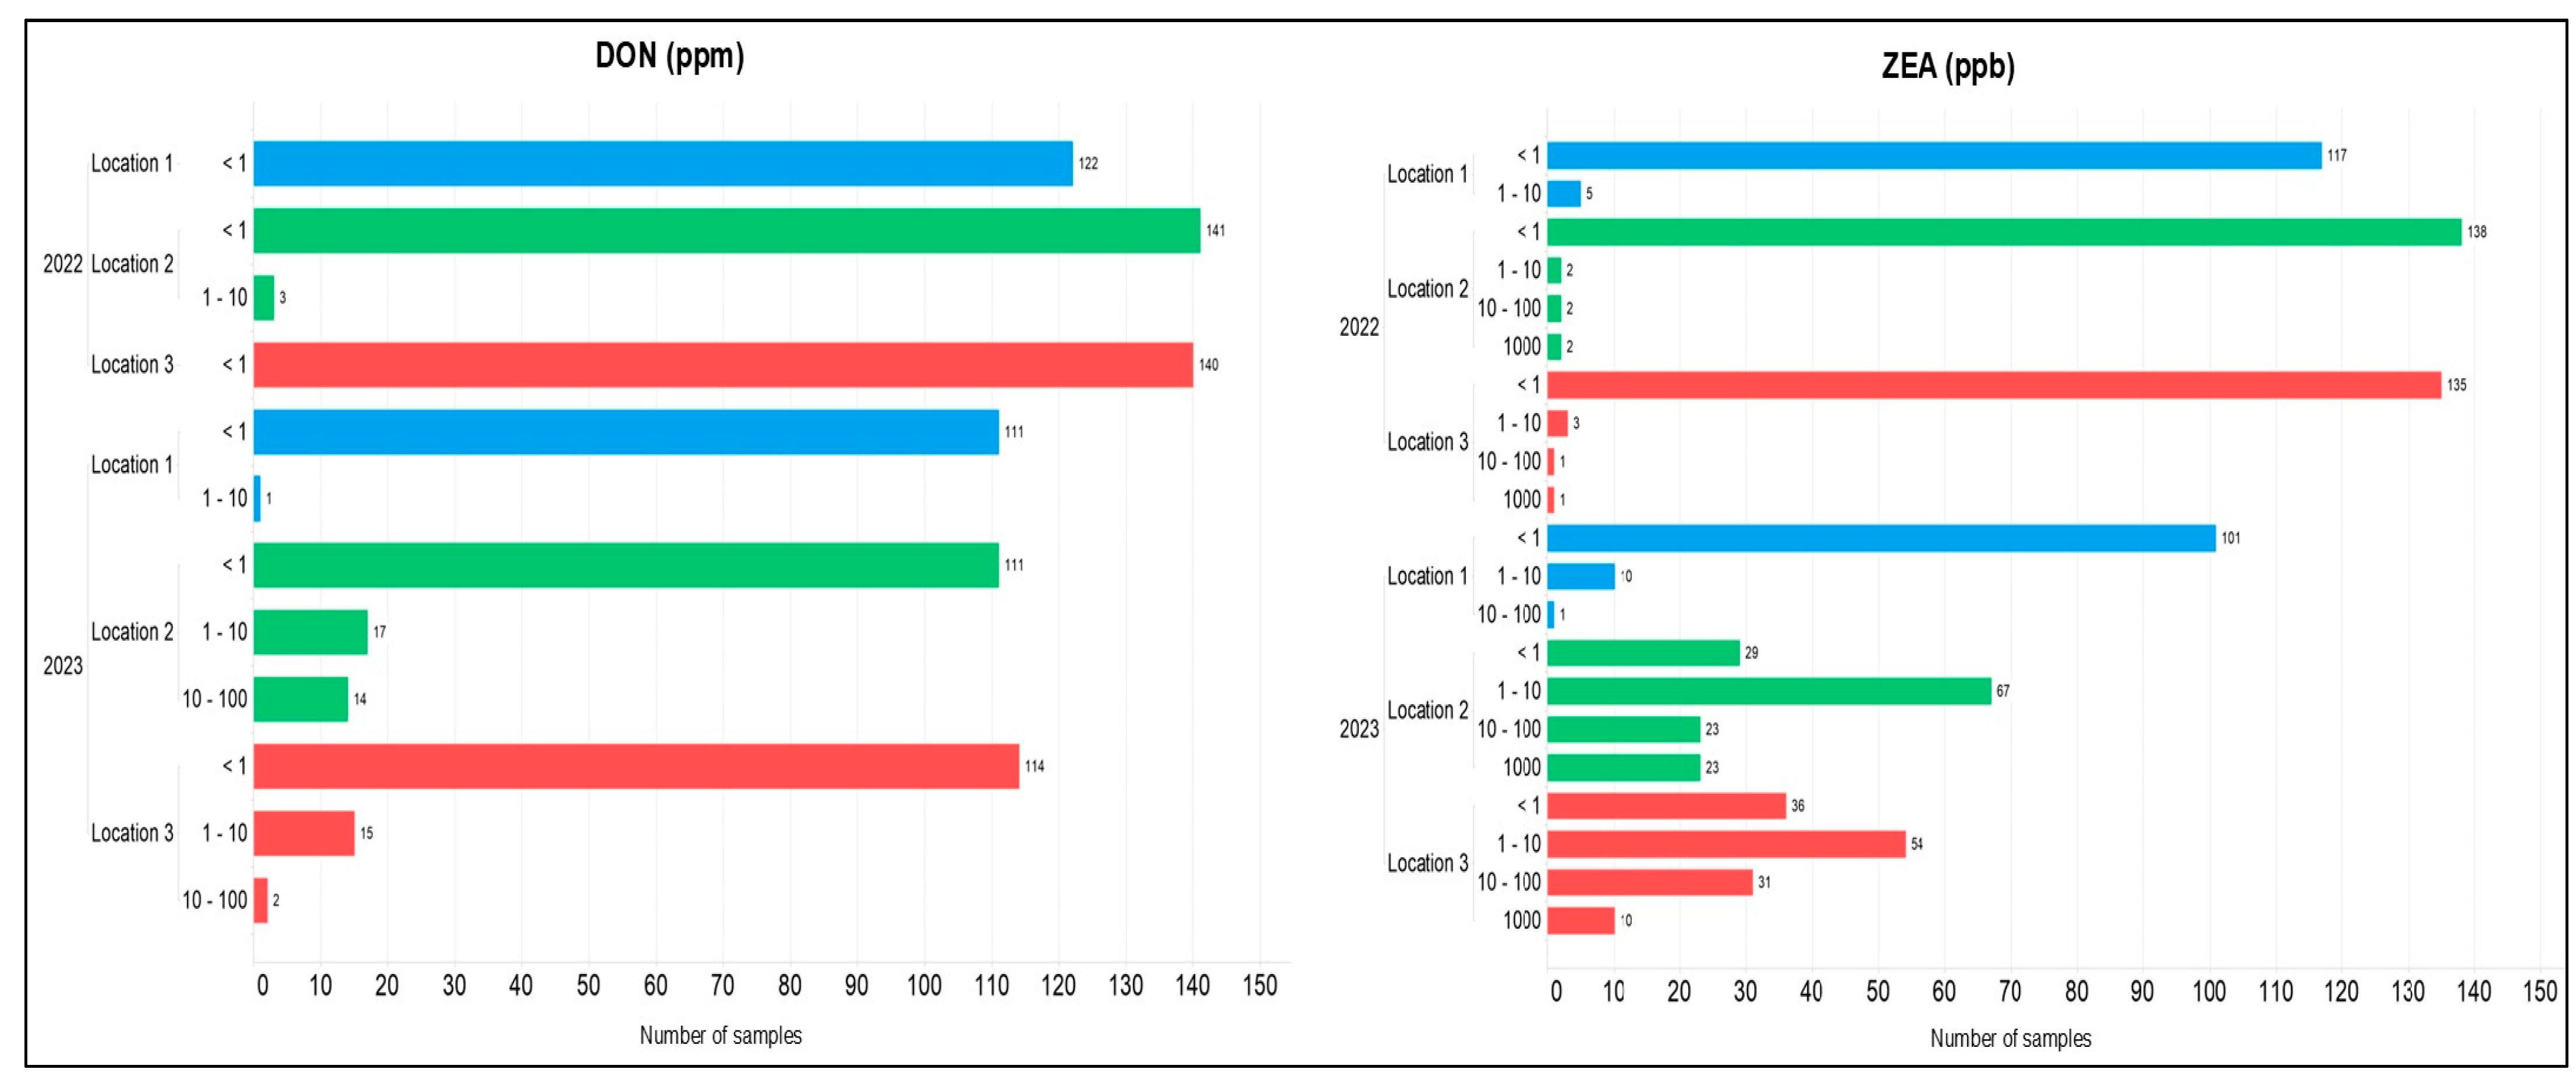
2.2. Mycotoxin Analysis
2.3. Genotyping Data
2.4. QTL Detection
3. Results
3.1. Phenotypic Analysis
3.2. Multi-Year Multi-Site Data Correlation
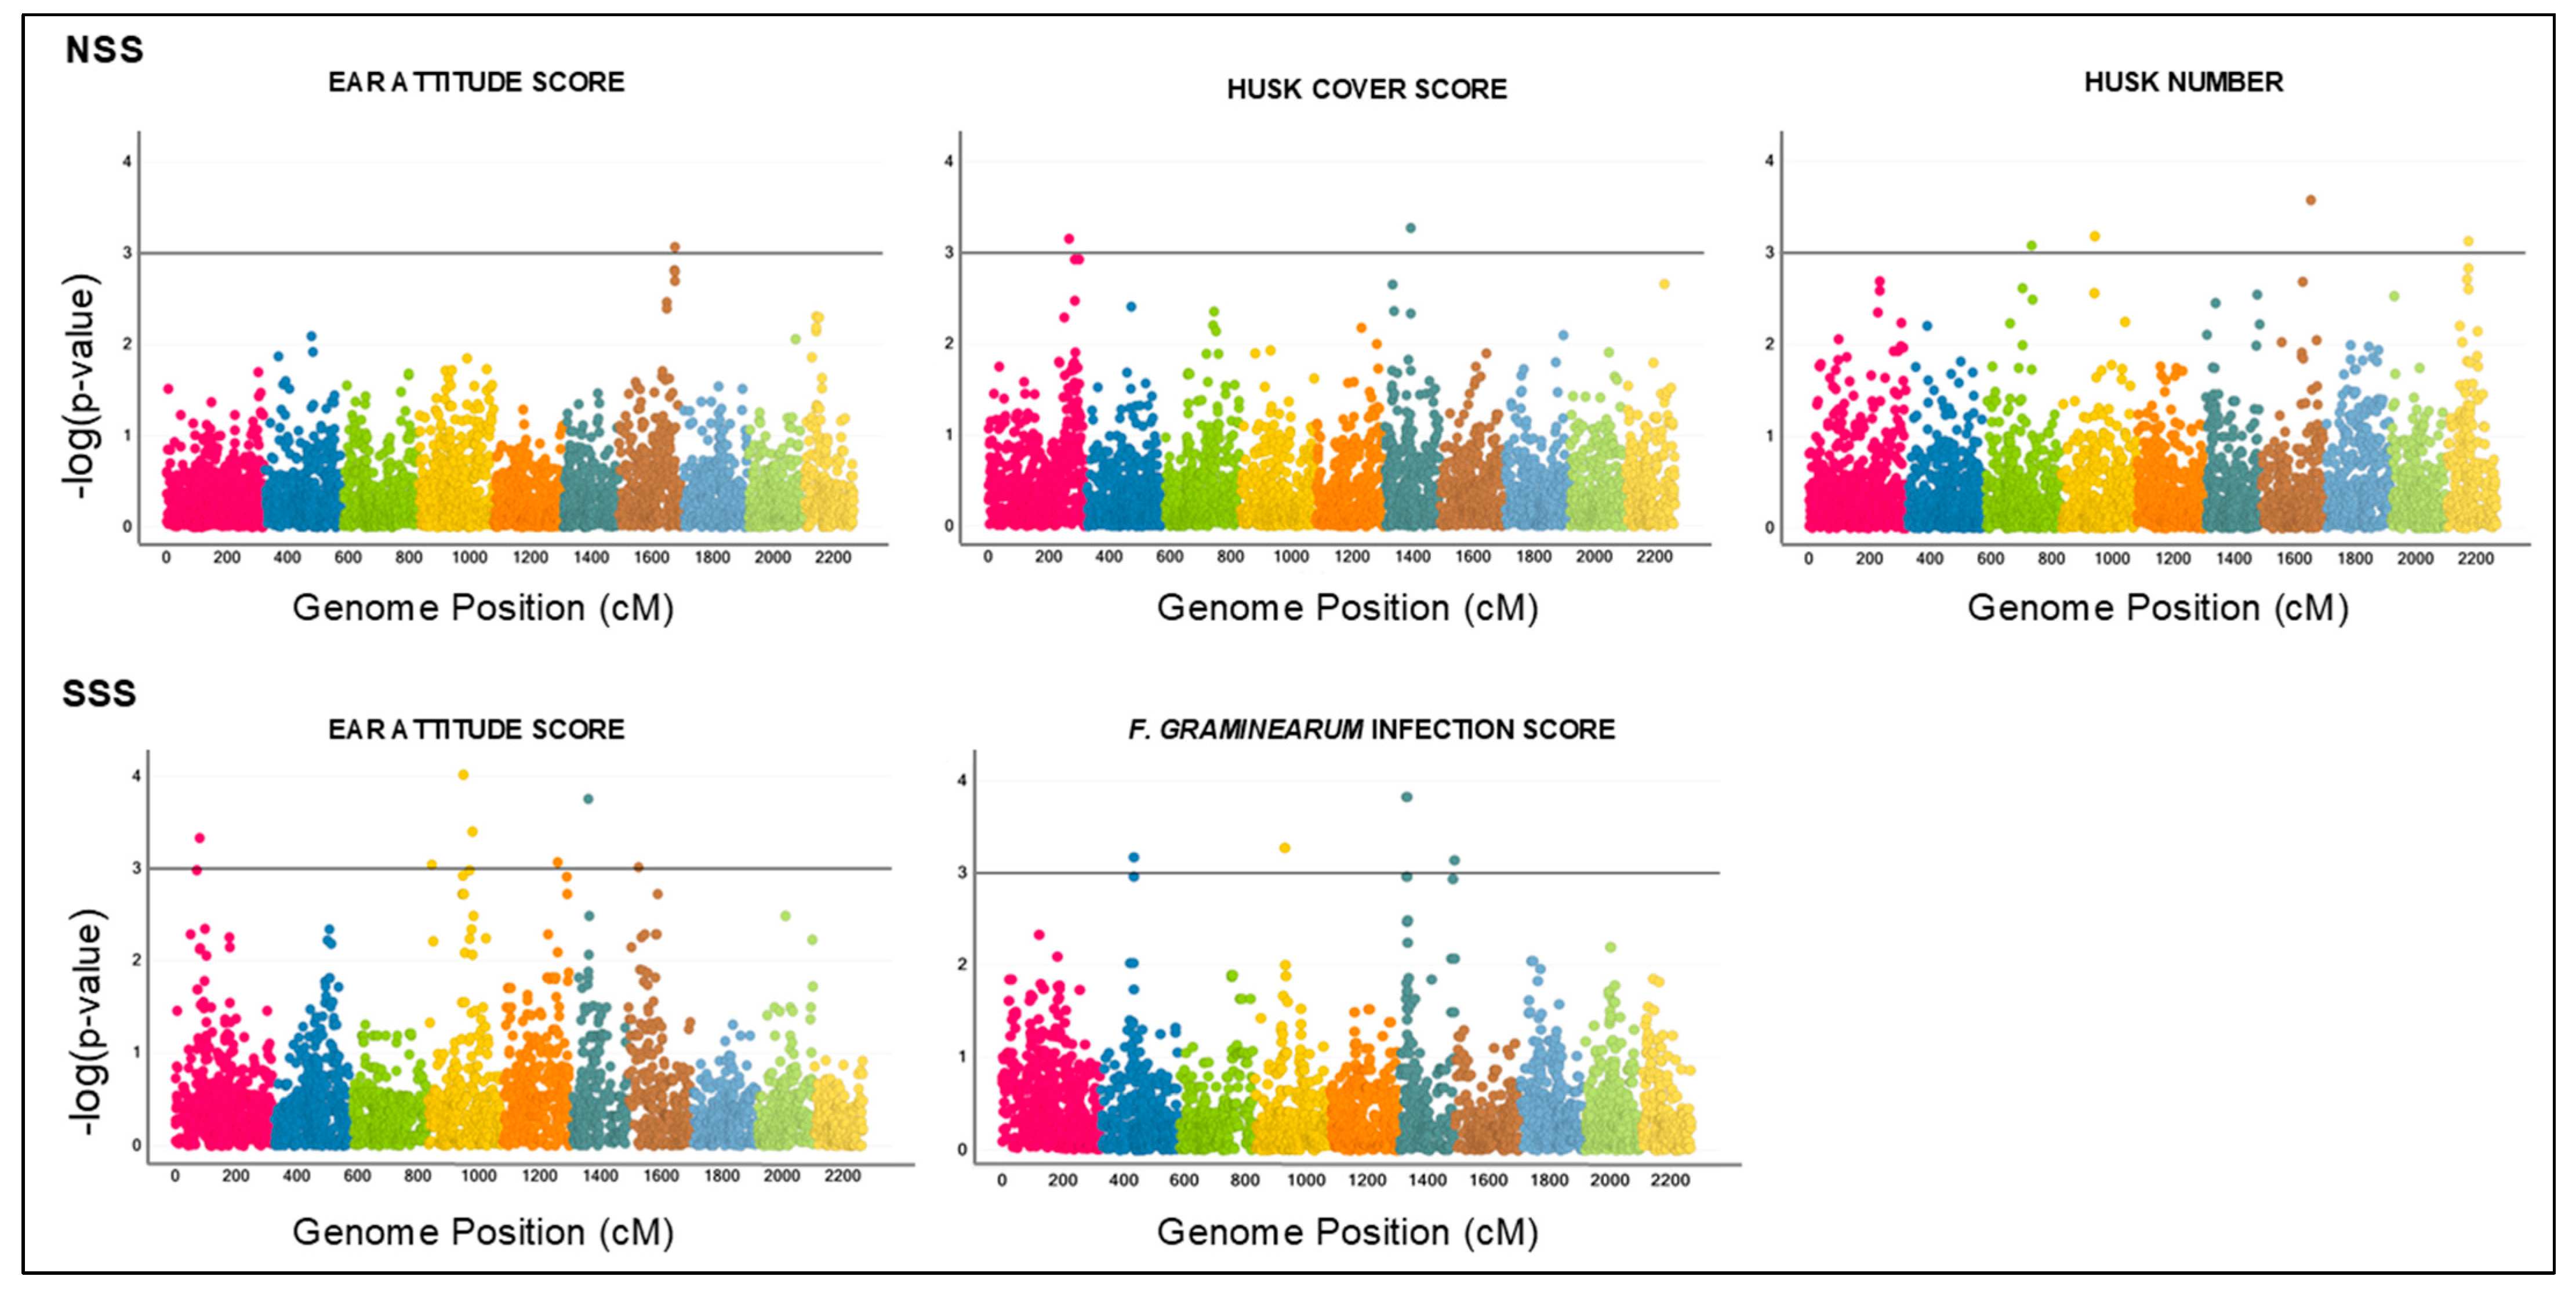
3.3. QTL Analysis
4. Discussion
Supplementary Materials
Author Contributions
Funding
Acknowledgments
Conflicts of Interest
References
- Ranum, P.; Peña-Rosas, J.P.; Garcia-Casal, M.N. Global Maize Production, Utilization, and Consumption. Ann. N. Y. Acad. Sci. 2014, 1312, 105–112. [Google Scholar] [CrossRef] [PubMed]
- Vaughan, M.M.; Block, A.; Christensen, S.A.; Allen, L.H.; Schmelz, E.A. The Effects of Climate Change Associated Abiotic Stresses on Maize Phytochemical Defenses. Phytochem. Rev. 2018, 17, 37–49. [Google Scholar] [CrossRef]
- Miedaner, T.; Juroszek, P. Global Warming and Increasing Maize Cultivation Demand Comprehensive Efforts in Disease and Insect Resistance Breeding in North-western Europe. Plant Pathol. 2021, 70, 1032–1046. [Google Scholar] [CrossRef]
- Yang, Q.; Balint-Kurti, P.; Xu, M. Quantitative Disease Resistance: Dissection and Adoption in Maize. Mol. Plant 2017, 10, 402–413. [Google Scholar] [CrossRef]
- Savary, S.; Willocquet, L.; Pethybridge, S.J.; Esker, P.; McRoberts, N.; Nelson, A. The Global Burden of Pathogens and Pests on Major Food Crops. Nat. Ecol. Evol. 2019, 3, 430–439. [Google Scholar] [CrossRef]
- Bennett, J.S.; Isakeit, T.; Borrego, E.J.; Odvody, G.; Murray, S.; Kolomiets, M.V. Identification of Naturally Occurring Atoxigenic Strains of Fusarium Verticillioides and Their Potential as Biocontrol Agents of Mycotoxins and Ear Rot Pathogens of Maize. Crop Prot. 2023, 167, 106197. [Google Scholar] [CrossRef]
- Miedaner, T.; Boeven, A.L.G.C.; Gaikpa, D.S.; Kistner, M.B.; Grote, C.P. Genomics-Assisted Breeding for Quantitative Disease Resistances in Small-Grain Cereals and Maize. Int. J. Mol. Sci. 2020, 21, 9717. [Google Scholar] [CrossRef]
- Marasas, W.F. Discovery and Occurrence of the Fumonisins: A Historical Perspective. Environ. Health Perspect. 2001, 109, 239–243. [Google Scholar] [CrossRef] [PubMed]
- Stockmann-Juvala, H.; Savolainen, K. A Review of the Toxic Effects and Mechanisms of Action of Fumonisin B1. Hum. Exp. Toxicol. 2008, 27, 799–809. [Google Scholar] [CrossRef]
- Xu, X.; Nicholson, P.; Ritieni, A. Effects of Fungal Interactions among Fusarium Head Blight Pathogens on Disease Development and Mycotoxin Accumulation. Int. J. Food Microbiol. 2007, 119, 67–71. [Google Scholar] [CrossRef]
- Del Ponte, E.M.; Moreira, G.M.; Ward, T.J.; O’Donnell, K.; Nicolli, C.P.; Machado, F.J.; Duffeck, M.R.; Alves, K.S.; Tessmann, D.J.; Waalwijk, C.; et al. Fusarium Graminearum Species Complex: A Bibliographic Analysis and Web-Accessible Database for Global Mapping of Species and Trichothecene Toxin Chemotypes. Phytopathology 2022, 112, 741–751. [Google Scholar] [CrossRef] [PubMed]
- Mesterházy, Á.; Lemmens, M.; Reid, L.M. Breeding for Resistance to Ear Rots Caused by Fusarium spp. in Maize—A Review. Plant Breed. 2012, 131, 1–19. [Google Scholar] [CrossRef]
- Lenc, L. Fusarium Head Blight (FHB) and Fusarium Populations in Grain of Winter Wheat Grown in Different Cultivation Systems. J. Plant Prot. Res. 2015, 55, 94–109. [Google Scholar] [CrossRef]
- Pereyra, S.A.; Dill-Macky, R.; Sims, A.L. Survival and Inoculum Production of Gibberella zeae in Wheat Residue. Plant Dis. 2004, 88, 724–730. [Google Scholar] [CrossRef]
- Rossi, F.; Gallo, A.; Bertuzzi, T. Emerging Mycotoxins in the Food Chain. Med. J. Nutr. Metab. 2020, 13, 7–27. [Google Scholar] [CrossRef]
- Desjardins, A.; Plattner, R.; Shaner, G.; Brown, D.; Buechley, G.; Proctor, R.; Turgeon, G. Field Release of Gibberella zeae Genetically Modified to Lack Ascopores. Phytopathology 2006, 96, S28–S29. [Google Scholar]
- Parry, D.W.; Jenkinson, P.; McLeod, L. Fusarium Ear Blight (Scab) in Small Grain Cereals—A Review. Plant Pathol. 1995, 44, 207–238. [Google Scholar] [CrossRef]
- Pfordt, A.; Ramos Romero, L.; Schiwek, S.; Karlovsky, P.; von Tiedemann, A. Impact of Environmental Conditions and Agronomic Practices on the Prevalence of Fusarium Species Associated with Ear- and Stalk Rot in Maize. Pathogens 2020, 9, 236. [Google Scholar] [CrossRef] [PubMed]
- Alma, A.; Lessio, F.; Reyneri, A.; Blandino, M. Relationships between Ostrinia Nubilalis (Lepidoptera: Crambidae) Feeding Activity, Crop Technique and Mycotoxin Contamination of Corn Kernel in Northwestern Italy. Int. J. Pest Manag. 2005, 51, 165–173. [Google Scholar] [CrossRef]
- Sutton, J.C. Epidemiology of Wheat Head Blight and Maize Ear Rot Caused by Fusarium Graminearum. Can. J. Plant Pathol. 1982, 4, 195–209. [Google Scholar] [CrossRef]
- Vigier, B.; Reid, L.M.; Dwyer, L.M.; Stewart, D.W.; Sinha, R.C.; Arnason, J.T.; Butler, G. Maize Resistance to Gibberella Ear Rot: Symptoms, Deoxynivalenol, and Yield 1. Can. J. Plant Pathol. 2001, 23, 99–105. [Google Scholar] [CrossRef]
- Wetter, M.T. Occurrence and Distribution of Fusarium Graminearum and Deoxynivalenol in Sweet Corn Ears. Food Addit. Contam. 1999, 16, 119–124. [Google Scholar] [CrossRef]
- O’Donnell, K.; McCormick, S.P.; Busman, M.; Proctor, R.H.; Ward, T.J.; Doehring, G.; Geiser, D.M.; Alberts, J.F.; Rheeder, J.P. Marasas et al. 1984 “Toxigenic Fusarium Species: Identity and Mycotoxicology” Revisited. Mycologia 2018, 110, 1058–1080. [Google Scholar] [CrossRef]
- Wang, J.; Zhao, Z.; Yang, X.; Yang, J.; Gong, A.; Zhang, J.; Chen, L.; Zhou, C. Fusarium Graminearum Species Complex and Trichothecene Genotype. In Mycotoxins and Food Safety; IntechOpen: London, UK, 2020. [Google Scholar] [CrossRef]
- Frisvad, J.C.; Thrane, U.; Samson, R.A.; Pitt, J.I. Important Mycotoxins and the Fungi Which Produce Them. Adv. Exp. Med. Biol. 2006, 571, 3–31. [Google Scholar] [PubMed]
- Bennett, J.W.; Klich, M. Mycotoxins. Clin. Microbiol. Rev. 2003, 16, 497–516. [Google Scholar] [CrossRef] [PubMed]
- Ganesan, A.R.; Mohan, K.; Karthick Rajan, D.; Pillay, A.A.; Palanisami, T.; Sathishkumar, P.; Conterno, L. Distribution, Toxicity, Interactive Effects, and Detection of Ochratoxin and Deoxynivalenol in Food: A Review. Food Chem. 2022, 378, 131978. [Google Scholar] [CrossRef]
- Rai, A.; Das, M.; Tripathi, A. Occurrence and Toxicity of a Fusarium Mycotoxin, Zearalenone. Crit. Rev. Food Sci. Nutr. 2020, 60, 2710–2729. [Google Scholar] [CrossRef]
- European Commission Commission Regulation (EC) 1881/2006. Official Journal of the European Union. 2006. Available online: https://eur-lex.europa.eu/legal-content/EN/ALL/?uri=celex%3A32006R1881 (accessed on 10 June 2024).
- Pereyra, S.A.; Dill-Macky, R. Colonization of the Residues of Diverse Plant Species by Gibberella zeae and Their Contribution to Fusarium Head Blight Inoculum. Plant Dis. 2008, 92, 800–807. [Google Scholar] [CrossRef]
- Schaafsma, A.W.; Tamburic-Ilincic, L.; Hooker, D.C. Effect of Previous Crop, Tillage, Field Size, Adjacent Crop, and Sampling Direction on Airborne Propagules of Gibberella zeae/Fusarium graminearum, Fusarium Head Blight Severity, and Deoxynivalenol Accumulation in Winter Wheat. Can. J. Plant Pathol. 2005, 27, 217–224. [Google Scholar] [CrossRef]
- Dill-Macky, R.; Jones, R.K. The Effect of Previous Crop Residues and Tillage on Fusarium Head Blight of Wheat. Plant Dis. 2000, 84, 71–76. [Google Scholar] [CrossRef]
- Blandino, M.; Reyneri, A.; Vanara, F.; Pascale, M.; Haidukowski, M.; Campagna, C. Management of Fumonisin Contamination in Maize Kernels through the Timing of Insecticide Application against the European Corn Borer Ostrinia Nubilalis Hübner. Food Addit. Contam. 2009, 26, 1501–1514. [Google Scholar] [CrossRef] [PubMed]
- Mazzoni, E.; Scandolara, A.; Giorni, P.; Pietri, A.; Battilani, P. Field Control of Fusarium Ear Rot, Ostrinia Nubilalis (Hübner), and Fumonisins in Maize Kernels. Pest Manag. Sci. 2011, 67, 458–465. [Google Scholar] [CrossRef]
- Pilu, R.; Cassani, E.; Sirizzotti, A.; Petroni, K.; Tonelli, C. Effect of Flavonoid Pigments on the Accumulation of Fumonisin B1 in the Maize Kernel. J. Appl. Genet. 2011, 52, 145–152. [Google Scholar] [CrossRef] [PubMed]
- Sangiorgio, S.; Colombo, F.; Ghidoli, M.; Giupponi, L.; Ferro, G.; Ferro, C.G.; Cassani, E.; Landoni, M.; Pilu, R. The Ancient Varieties of Mountain Maize: The Inheritance of the Pointed Character and Its Effect on the Natural Drying Process. Agronomy 2021, 11, 2295. [Google Scholar] [CrossRef]
- Tembo, L.; Asea, G.; Gibson, P.T.; Okori, P. Indirect Selection for Resistance to Stenocarpella Maydis and Fusarium Graminearum and the Prospects of Selecting for High-yielding and Resistant Maize Hybrids. Plant Breed. 2016, 135, 446–451. [Google Scholar] [CrossRef]
- Reid, L.M.; Woldemariam, T.; Zhu, X.; Stewart, D.W.; Schaafsma, A.W. Effect of Inoculation Time and Point of Entry on Disease Severity in Fusarium Graminearum, Fusarium Verticillioides, or Fusarium Subglutinans Inoculated Maize Ears. Can. J. Plant Pathol. 2002, 24, 162–167. [Google Scholar] [CrossRef]
- Munkvold, G.P.; Arias, S.; Taschl, I.; Gruber-Dorninger, C. Mycotoxins in Corn: Occurrence, Impacts, and Management. In Corn; Elsevier: Amsterdam, The Netherlands, 2019; pp. 235–287. [Google Scholar]
- Ali, M.L.; Taylor, J.H.; Jie, L.; Sun, G.; William, M.; Kasha, K.J.; Reid, L.M.; Pauls, K.P. Molecular Mapping of QTLs for Resistance to Gibberella Ear Rot, in Corn, Caused by Fusarium graminearum. Genome 2005, 48, 521–533. [Google Scholar] [CrossRef]
- Gaikpa, D.S.; Kessel, B.; Presterl, T.; Ouzunova, M.; Galiano-Carneiro, A.L.; Mayer, M.; Melchinger, A.E.; Schön, C.C.; Miedaner, T. Exploiting Genetic Diversity in Two European Maize Landraces for Improving Gibberella Ear Rot Resistance Using Genomic Tools. Theor. Appl. Genet. 2021, 134, 793–805. [Google Scholar] [CrossRef]
- Galiano-Carneiro, A.L.; Kessel, B.; Presterl, T.; Gaikpa, D.S.; Kistner, M.B.; Miedaner, T. Multi-Parent QTL Mapping Reveals Stable QTL Conferring Resistance to Gibberella Ear Rot in Maize. Euphytica 2021, 217, 2. [Google Scholar] [CrossRef]
- Giomi, G.M.; Kreff, E.D.; Iglesias, J.; Fauguel, C.M.; Fernandez, M.; Oviedo, M.S.; Presello, D.A. Quantitative Trait Loci for Fusarium and Gibberella Ear Rot Resistance in Argentinian Maize Germplasm. Euphytica 2016, 211, 287–294. [Google Scholar] [CrossRef]
- Han, S.; Miedaner, T.; Utz, H.F.; Schipprack, W.; Schrag, T.A.; Melchinger, A.E. Genomic Prediction and GWAS of Gibberella Ear Rot Resistance Traits in Dent and Flint Lines of a Public Maize Breeding Program. Euphytica 2018, 214, 6. [Google Scholar] [CrossRef]
- Wen, J.; Shen, Y.; Xing, Y.; Wang, Z.; Han, S.; Li, S.; Yang, C.; Hao, D.; Zhang, Y. QTL Mapping of Resistance to Gibberella Ear Rot in Maize. Mol. Breed. 2020, 40, 94. [Google Scholar] [CrossRef]
- Zhou, G.; Li, S.; Ma, L.; Wang, F.; Jiang, F.; Sun, Y.; Ruan, X.; Cao, Y.; Wang, Q.; Zhang, Y.; et al. Mapping and Validation of a Stable Quantitative Trait Locus Conferring Maize Resistance to Gibberella Ear Rot. Plant Dis. 2021, 105, 1984–1991. [Google Scholar] [CrossRef] [PubMed]
- Bolduan, C.; Miedaner, T.; Schipprack, W.; Dhillon, B.S.; Melchinger, A.E. Genetic Variation for Resistance to Ear Rots and Mycotoxins Contamination in Early European Maize Inbred Lines. Crop Sci. 2009, 49, 2019–2028. [Google Scholar] [CrossRef]
- Hasan, N.; Choudhary, S.; Naaz, N.; Sharma, N.; Laskar, R.A. Recent Advancements in Molecular Marker-Assisted Selection and Applications in Plant Breeding Programmes. J. Genet. Eng. Biotechnol. 2021, 19, 128. [Google Scholar] [CrossRef] [PubMed]
- Habier, D.; Fernando, R.L.; Dekkers, J.C.M. The Impact of Genetic Relationship Information on Genome-Assisted Breeding Values. Genetics 2007, 177, 2389–2397. [Google Scholar] [CrossRef] [PubMed]
- Meuwissen, T.H.E.; Hayes, B.J.; Goddard, M.E. Prediction of Total Genetic Value Using Genome-Wide Dense Marker Maps. Genetics 2001, 157, 1819–1829. [Google Scholar] [CrossRef]
- VanRaden, P.M. Efficient Methods to Compute Genomic Predictions. J. Dairy Sci. 2008, 91, 4414–4423. [Google Scholar] [CrossRef]
- Leite, M.; Freitas, A.; Silva, A.S.; Barbosa, J.; Ramos, F. Maize Food Chain and Mycotoxins: A Review on Occurrence Studies. Trends Food Sci. Technol. 2021, 115, 307–331. [Google Scholar] [CrossRef]
- Logrieco, A.; Mulè, G.; Moretti, A.; Bottalico, A. Toxigenic Fusarium Species and Mycotoxins Associated with Maize Ear Rot in Europe. Eur. J. Plant Pathol. 2002, 108, 597–609. [Google Scholar] [CrossRef]
- Andriolli, C.F.; Casa, R.T.; Kuhnem, P.R.; Bogo, A.; Zancan, R.L.; Reis, E.M. Timing of Fungicide Application for the Control of Gibberella Ear Rot of Maize. Trop. Plant Pathol. 2016, 41, 264–269. [Google Scholar] [CrossRef]
- Deepa, N.; Sreenivasa, M.Y. Sustainable Approaches for Biological Control of Mycotoxigenic Fungi and Mycotoxins in Cereals. In New and Future Developments in Microbial Biotechnology and Bioengineering; Elsevier: Amsterdam, The Netherlands, 2019; pp. 149–161. [Google Scholar]
- Magarini, A.; Passera, A.; Ghidoli, M.; Casati, P.; Pilu, R. Genetics and Environmental Factors Associated with Resistance to Fusarium Graminearum, the Causal Agent of Gibberella Ear Rot in Maize. Agronomy 2023, 13, 1836. [Google Scholar] [CrossRef]
- Cui, Z.; Luo, J.; Qi, C.; Ruan, Y.; Li, J.; Zhang, A.; Yang, X.; He, Y. Genome-Wide Association Study (GWAS) Reveals the Genetic Architecture of Four Husk Traits in Maize. BMC Genom. 2016, 17, 946. [Google Scholar] [CrossRef] [PubMed]
- Brewbaker, J.L.; Kim, S.K. Inheritance of Husk Numbers and Ear Insect Damage in Maize 1. Crop Sci. 1979, 19, 32–36. [Google Scholar] [CrossRef]
- Adenike, D.I.; Richard, A.; Allen, O.; Idris, I.A. Combining Ability of Tropical Early Maize (Zea Mays L.) Inbred Lines for Grain Yield and Resistance to Maize Streak Virus Disease. J. Plant Breed. Crop Sci. 2017, 9, 186–194. [Google Scholar] [CrossRef]
- Magarini, A.; Colombo, F.; Cassani, E.; Ghidoli, M.; Landoni, M.; Sangiorgio, S.; Pilu, R. The Role of Husk Traits in Maize Susceptibility to Fusarium Verticillioides: A multi-location Study in Northern Italy. Food Energy Secur. 2024, 13, e537. [Google Scholar] [CrossRef]
- Warfield, C.Y. Importance of the Husk Covering on the Susceptibility of Corn Hybrids to Fusarium Ear Rot. Plant Dis. 1996, 80, 208. [Google Scholar] [CrossRef]
- Munkvold, G.P. Cultural and Genetic Approaches to Managing Mycotoxins in Maize. Annu. Rev. Phytopathol. 2003, 41, 99–116. [Google Scholar] [CrossRef]
- Akohoue, F.; Miedaner, T. Meta-Analysis and Co-Expression Analysis Revealed Stable QTL and Candidate Genes Conferring Resistances to Fusarium and Gibberella Ear Rots While Reducing Mycotoxin Contamination in Maize. Front. Plant Sci. 2022, 13, 1050891. [Google Scholar] [CrossRef]
- Cui, Z.; Xia, A.; Zhang, A.; Luo, J.; Yang, X.; Zhang, L.; Ruan, Y.; He, Y. Linkage Mapping Combined with Association Analysis Reveals QTL and Candidate Genes for Three Husk Traits in Maize. Theor. Appl. Genet. 2018, 131, 2131–2144. [Google Scholar] [CrossRef]
- Kebede, A.Z.; Woldemariam, T.; Reid, L.M.; Harris, L.J. Quantitative Trait Loci Mapping for Gibberella Ear Rot Resistance and Associated Agronomic Traits Using Genotyping-by-Sequencing in Maize. Theor. Appl. Genet. 2016, 129, 17–29. [Google Scholar] [CrossRef] [PubMed]
- Zhang, X.; Lu, M.; Xia, A.; Xu, T.; Cui, Z.; Zhang, R.; Liu, W.; He, Y. Genetic Analysis of Three Maize Husk Traits by QTL Mapping in a Maize-Teosinte Population. BMC Genom. 2021, 22, 386. [Google Scholar] [CrossRef] [PubMed]
- Sopeña-Torres, S.; Jordá, L.; Sánchez-Rodríguez, C.; Miedes, E.; Escudero, V.; Swami, S.; López, G.; Piślewska-Bednarek, M.; Lassowskat, I.; Lee, J.; et al. YODA MAP3K Kinase Regulates Plant Immune Responses Conferring Broad-spectrum Disease Resistance. New Phytol. 2018, 218, 661–680. [Google Scholar] [CrossRef] [PubMed]

| Season | Location | Planting Date | Harvest Date | Flowering of 50% of Plots |
|---|---|---|---|---|
| 2022 | Location 1 | 11 May 2022 | 28 August 2022 | 18 July 2022 |
| Location 2 | 16 May 2022 | 19 October 2022 | 24 July 2022 | |
| Location 3 | 26 May 2022 | 24 October 2022 | 2 August 2022 | |
| 2023 | Location 1 | 24 May 2023 | 2 October 2023 | 28 July 2023 |
| Location 2 | 21 June 2023 | 14 November 2023 | 22 August 2023 | |
| Location 3 | 27 June 2023 | 22 November 2023 | 30 August 2023 |
| Heterotic Group | Inbred | EAS | FGIS | HCS | HN | DON (ppm) | ZEA (ppb) |
|---|---|---|---|---|---|---|---|
| NSS | PHAP9 | 5.00 ± 3.62 abcde | 5.92 ± 2.50 a | 5 ± 1.91 acdfgh | 6.50 ± 0.90 bcfghk | 0.38 ± 1.07 a | 30.14 ± 92.05 a |
| PHG29 | 6.00 ± 3.46 abcde | 5.67 ± 1.30 a | 4.17 ± 1.59 cfh | 6.92 ± 1.51 abcdefghijk | 0.31 ± 0.63 a | 12.36 ± 34.04 a | |
| PHJ90 | 4.33 ± 3.34 abcde | 5.42 ± 2.07 a | 4.17 ± 1.80 cdfh | 6.33 ± 0.98 bcfgk | 0.75 ± 1.24 a | 76.48 ± 185.57 a | |
| PHK42 | 7.17 ± 3.13 bde | 6.25 ± 2.09 a | 4.17 ± 1.59 cfh | 6.08 ± 1.62 bcfgk | 0.04 ± 0.06 a | 1.28 ± 2.25 a | |
| PHKW3 | 4.00 ± 3.36 abcde | 6.00 ± 2.52 a | 8.00 ± 1.35 abeg | 7.25 ± 0.97 abcdefghijkl | 2.32 ± 5.87 a | 93.5 ± 224.41 a | |
| PHR31 | 8.56 ± 0.88 e | 6.13 ± 1.55 a | 4.11 ± 1.05 cdfh | 6.63 ± 0.74 abcdefghijk | 0.09 ± 0.23 a | 2.24 ± 5.45 a | |
| PHT77 | 6.09 ± 3.02 bcde | 7.91 ± 0.70 a | 5.18 ± 1.08 abcdfgh | 6.58 ± 1.44 abcdfghijk | 0.02 ± 0.02 a | 1.44 ± 4.27 a | |
| PH5 HK | 2.67 ± 2.53 abcde | 7.58 ± 1.38 a | 7.17 ± 1.59 abcdefgh | 6.83 ± 1.19 abcdefghijk | 0.17 ± 0.36 a | 6.72 ± 16.53 a | |
| PHK56 | 5.67 ± 3.55 abcde | 6.17 ± 2.21 a | 6.33 ± 1.56 abcdefgh | 7.00 ± 0.85 abcdefghijk | 0.04 ± 0.06 a | 0.94 ± 2.03 a | |
| PHN11 | 7.33 ± 2.67 de | 6.33 ± 2.06 a | 4.00 ± 2.17 cdfh | 5.50 ± 1.57 f | 0.85 ± 1.49 a | 41.00 ± 80.13 a | |
| PHN46 | 4.67 ± 2.53 abcde | 6.67 ± 1.61 a | 5.67 ± 1.3 abcdefgh | 6.09 ± 0.94 bcfk | 0.38 ± 1.28 a | 10.44 ± 32.06 a | |
| PHN73 | 5.00 ± 2.83 abcde | 5.63 ± 2.92 a | 6.20 ± 1.69 abcdefgh | 6.60 ± 0.84 abcfghijk | 0.26 ± 0.54 a | 6.24 ± 10.80 a | |
| PHP76 | 5.67 ± 3.23 bcde | 6.17 ± 1.75 a | 4.00 ± 1.35 ch | 7.33 ± 1.07 abcdefghijkl | 0.24 ± 0.51 a | 5.09 ± 10.15 a | |
| PHPP8 | 4.33 ± 2.99 abcde | 7.08 ± 1.51 a | 6.83 ± 1.80 abcdefgh | 6.83 ± 1.03 abcdefghijk | 0.94 ± 2.94 a | 101.87 ± 235.27 a | |
| PHR62 | 5.17 ± 3.24 abcde | 7.50 ± 1.00 a | 6.50 ± 1.93 abcdefgh | 5.92 ± 0.90 bf | 0.16 ± 0.51 a | 4.60 ± 13.91 a | |
| PHW30 | 6.33 ± 2.99 bde | 7.42 ± 0.90 a | 8.17 ± 1.80 abe | 7.25 ± 1.22 abcdefghijkl | 0.28 ± 0.73 a | 2.49 ± 6.94 a | |
| PHW53 | 2.00 ± 1.81 abcd | 6.25 ± 1.91 a | 6.33 ± 1.56 abcdefgh | 8.25 ± 1.54 abcdefghijkl | 0.05 ± 0.08 a | 0.98 ± 2.40 a | |
| PHZ51 | 1.67 ± 1.30 abc | 6.00 ± 2.41 a | 6.00 ± 1.35 abcdefgh | 8.25 ± 1.29 abcdefghijkl | 0.08 ± 0.19 a | 5.78 ± 11.62 a | |
| PHBE2 | 7.18 ± 3.28 bde | 7.18 ± 0.98 a | 4.82 ± 1.08 cdfgh | 7.50 ± 1.31 abcdefghijkl | 0.21 ± 0.54 a | 3.96 ± 8.18 a | |
| PHJ33 | 2.33 ± 1.78 abcde | 7.91 ± 1.04 a | 5.50 ± 1.51 abcdefgh | 7.17 ± 1.11 abcdefghijkl | 0.10 ± 0.21 a | 2.64 ± 7.22 a | |
| PHPM0 | 1.60 ± 1.35 abc | 7.20 ± 1.62 a | 7.40 ± 1.58 abcdefgh | 8.40 ± 1.58 abcdefghijkl | 0.06 ± 0.08 a | 13.27 ± 28.00 a | |
| PHR03 | 4.17 ± 3.13 abcde | 7.33 ± 1.67 a | 5.67 ± 1.78 abcdefgh | 7.50 ± 1.17 abcdefghijkl | 4.85 ± 11.24 a | 370.64 ± 1021.91 a | |
| PHR55 | 4.33 ± 3.34 abcde | 5.09 ± 2.07 a | 4.17 ± 1.03 ch | 8.64 ± 1.21 adeghijkl | 0.08 ± 0.17 a | 1.11 ± 1.97 a | |
| PHVB2 | 5.17 ± 4.04 abcde | 5.83 ± 1.95 a | 5.67 ± 1.78 abcdefgh | 6.58 ± 1.08 abcfghik | 0.04 ± 0.07 a | 19.47 ± 62.09 a | |
| PHBG4 | 1.00 ± 0.00 a | 6.17 ± 2.33 a | 4.17 ± 1.03 ch | 7.42 ± 1.51 abcdefghijkl | 0.04 ± 0.06 a | 2.25 ± 5.34 a | |
| PHBR2 | 1.83 ± 1.03 abcd | 7.50 ± 1.08 a | 6.83 ± 1.03 abcdefgh | 10.00 ± 2.52 adeijl | 1.16 ± 2.62 a | 7.58 ± 14.73 a | |
| PHBV8 | 4.17 ± 1.8 abcde | 7.55 ± 2.34 a | 6.08 ± 2.15 abcdefgh | 7.82 ± 1.33 abcdefghijkl | 0.03 ± 0.05 a | 3.24 ± 10.72 a | |
| PHGV6 | 1.73 ± 1.85 abc | 8.25 ± 1.04 a | 7.73 ± 1.01 abdefg | 9.45 ± 1.69 adehijl | 2.11 ± 4.59 a | 1.76 ± 1.05 a | |
| PHHH9 | 3.17 ± 2.33 abcde | 6.89 ± 1.96 a | 8.67 ± 0.78 e | 9.83 ± 1.59 del | 0.20 ± 0.48 a | 10.46 ± 34.01 a | |
| PHJ31 | 1.33 ± 0.78 ac | 6.92 ± 1.51 a | 6.83 ± 2.62 abcdefgh | 8.42 ± 1.44 abcdefghijkl | 0.01 ± 0.01 a | 0.55 ± 0.95 a | |
| PHJ65 | 1.20 ± 0.63 ac | 7.17 ± 2.32 a | 7.80 ± 1.40 abdefg | 9.78 ± 2.28 adeghijl | 7.80 ± 18.57 a | 195.58 ± 476.51 a | |
| PHK46 | 2.17 ± 1.80 abcde | 6.08 ± 1.98 a | 8.00 ± 1.35 abeg | 8.67 ± 1.50 acdeghijkl | 0.99 ± 3.29 a | 36.48 ± 122.12 a | |
| PHM57 | 2.00 ± 1.60 abcd | 7.56 ± 0.88 a | 6.83 ± 1.80 abcdefgh | 7.33 ± 1.07 abcdefghijkl | 0.69 ± 1.75 a | 44.63 ± 134.08 a | |
| PHNB7 | 2.33 ± 1.56 abcde | 6.91 ± 1.64 a | 5.50 ± 1.51 abcdefgh | 7.67 ± 1.15 abcdefghijkl | 0.03 ± 0.07 a | 0.69 ± 1.06 a | |
| PHP60 | 1.00 ± 0.00 ac | 7.00 ± 2.00 a | 7.20 ± 1.48 abcdefgh | 9.60 ± 0.70 el | 0.10 ± 0.17 a | 3.04 ± 5.08 a | |
| PHR32 | 1.67 ± 1.03 abcde | 7.00 ± 1.73 a | 8.67 ± 0.82 abeg | 7.67 ± 3.83 abcdefghijk | 0.01 ± 0.01 a | 0.01 ± 0.00 a | |
| PHR58 | 2.33 ± 1.30 abcde | 7.27 ± 1.62 a | 7.00 ± 1.48 abcdefgh | 6.92 ± 1.16 abcdefghijk | 0.01 ± 0.00 a | 0.57 ± 0.80 a | |
| PHR63 | 3.83 ± 1.99 abcde | 6.64 ± 1.63 a | 8.67 ± 0.78 e | 7.67 ± 1.37 abcdefghijkl | 2.04 ± 6.86 a | 433.41 ± 1465.63 a | |
| PHV53 | 1.00 ± 0.00 a | 6.45 ± 2.07 a | 6.00 ± 1.04 abcdefgh | 6.50 ± 1.09 bcfghik | 0.03 ± 0.05 a | 33.75 ± 104.14 a | |
| PHW65 | 2.17 ± 2.33 abcd | 4.44 ± 2.96 a | 7.00 ± 0.00 abcdefgh | 7.00 ± 1.18 abcdefghijkl | 2.19 ± 6.49 a | 165.75 ± 492.88 a | |
| PHW79 | 2.00 ± 1.60 abcd | 6.58 ± 1.78 a | 6.00 ± 2.17 abcdefgh | 6.67 ± 0.78 abcfghik | 0.06 ± 0.11 a | 0.22 ± 0.50 a | |
| PHWG5 | 1.50 ± 0.90 abc | 8.00 ± 1.41 a | 8.50 ± 0.90 be | 10.50 ± 1.73 l | 0.20 ± 0.60 a | 10.41 ± 34.16 a | |
| SSS | PH42B | 5.67 ± 2.99 bcde | 6.08 ± 2.07 a | 5.00 ± 1.71 acdfgh | 8.92 ± 1.98 adeghijkl | 0.13 ± 0.26 a | 4.90 ± 10.20 a |
| PHR47 | 2.17 ± 1.34 abcde | 7.00 ± 1.56 a | 8.00 ± 1.35 abeg | 7.92 ± 0.79 abcdefghijkl | 0.27 ± 0.57 a | 15.22 ± 33.57 a | |
| PHR61 | 2.00 ± 1.04 abcde | 7.67 ± 1.61 a | 7.00 ± 1.21 abcdefgh | 9.83 ± 1.80 dejl | 6.31 ± 20.88 a | 26.50 ± 86.10 a | |
| PHVA9 | 1.17 ± 0.58 ac | 7.33 ± 1.83 a | 7.67 ± 1.56 abdefg | 7.50 ± 0.52 abcdefghijkl | 3.42 ± 11.66 a | 45.91 ± 151.01 a | |
| PHAG6 | 1.50 ± 0.90 abc | 6.17 ± 1.99 a | 7.50 ± 1.51 abcdefg | 6.67 ± 0.78 abcfghik | 0.20 ± 0.42 a | 2.21 ± 6.38 a | |
| PHBW8 | 4.33 ± 2.73 abcde | 5.17 ± 0.98 a | 4.67 ± 0.82 abcdfgh | 7.33 ± 1.21 abcdefghijkl | 0.01 ± 0.01 a | 0.01 ± 0.00 a | |
| PHEW7 | 2.67 ± 1.87 abcde | 7.80 ± 0.79 a | 6.00 ± 1.81 abcdefgh | 8.42 ± 1.56 abcdefghijkl | 0.04 ± 0.08 a | 2.35 ± 5.73 a | |
| PHHB4 | 2.83 ± 1.59 abcde | 5.50 ± 2.50 a | 5.17 ± 1.8 abcdfgh | 6.00 ± 0.45 bf | 0.09 ± 0.16 a | 4.19 ± 8.31 a | |
| PHJR5 | 3.67 ± 2.31 abcde | 6.92 ± 1.73 a | 5.83 ± 1.8 abcdefgh | 8.42 ± 1 acdeghijkl | 0.23 ± 0.69 a | 3.91 ± 12.86 a | |
| PHK29 | 2.00 ± 1.04 abcde | 6.91 ± 1.76 a | 7.33 ± 1.15 abcdefg | 8.00 ± 0.85 abcdefghijkl | 0.07 ± 0.19 a | 0.55 ± 1.00 a | |
| PHK35 | 2.00 ± 1.35 abcd | 8.10 ± 0.99 a | 7.00 ± 1.48 abcdefgh | 6.83 ± 0.94 abcdfghijk | 0.08 ± 0.13 a | 1.79 ± 4.66 a | |
| PHN29 | 5.00 ± 2.56 abcde | 7.55 ± 1.13 a | 6.5 ± 1.24 abcdefgh | 7.18 ± 0.75 abcdefghijkl | 0.09 ± 0.15 a | 3.65 ± 10.29 a | |
| PHNJ2 | 1.17 ± 0.58 ac | 7.78 ± 0.67 a | 7.83 ± 1.34 abeg | 8.08 ± 1.83 abcdefghijkl | 2.59 ± 5.39 a | 520.11 ± 1456.31 a | |
| PHP38 | 3.83 ± 1.80 abcde | 7.64 ± 1.63 a | 6.83 ± 1.99 abcdefgh | 6.83 ± 2.44 abcdefghijk | 0.08 ± 0.17 a | 1.58 ± 3.15 a | |
| PHT10 | 4.00 ± 3.02 abcde | 6.50 ± 2.33 a | 6.00 ± 2.34 abcdefgh | 6.00 ± 0.95 bcf | 2.59 ± 7.69 a | 93.99 ± 243.48 a | |
| PHT11 | 1.91 ± 1.04 abcde | 7.40 ± 1.07 a | 6.82 ± 1.89 abcdefgh | 9.55 ± 1.51 adejl | 0.02 ± 0.02 a | 5.42 ± 8.59 a | |
| PHT47 | 2.50 ± 2.43 abcde | 6.00 ± 1.89 a | 3.50 ± 2.11 h | 6.83 ± 1.03 abcdefghijk | 0.03 ± 0.04 a | 0.56 ± 1.17 a | |
| PHTP9 | 1.00 ± 0.00 a | 6.25 ± 1.42 a | 5.83 ± 1.99 abcdefgh | 8.08 ± 1.08 abcdefghijkl | 0.40 ± 1.06 a | 24.14 ± 60.63 a | |
| PHTV7 | 2.5 ± 2.11 abcde | 6.73 ± 2.05 a | 4.83 ± 2.17 acdfgh | 9.08 ± 1.62 adehijl | 0.11 ± 0.26 a | 1.96 ± 4.11 a | |
| PHV07 | 1.00 ± 0.00 a | 6.58 ± 1.88 a | 5.50 ± 1.51 abcdefgh | 7.17 ± 1.11 abcdefghijkl | 0.92 ± 2.99 a | 88.03 ± 298.01 a | |
| PHBB3 | 1.67 ± 1.56 abc | 6.18 ± 1.94 a | 6.50 ± 0.90 abcdefgh | 7.92 ± 1.73 abcdefghijkl | 0.15 ± 0.28 a | 2.21 ± 3.59 a | |
| PHG86 | 5.00 ± 2.95 abcde | 5.00 ± 2.68 a | 7.33 ± 1.67 abcdefgh | 8.09 ± 0.94 abcdefghijkl | 0.70 ± 1.50 a | 184.56 ± 422.86 a | |
| PHHB9 | 2.17 ± 1.59 abcde | 6.18 ± 1.72 a | 5.00 ± 1.71 acdfgh | 7.33 ± 0.78 abcdefghijkl | 0.07 ± 0.18 a | 0.46 ± 1.56 a | |
| PHP85 | 1.73 ± 1.35 abcd | 6.40 ± 2.01 a | 7.73 ± 1.85 abdeg | 6.91 ± 0.94 abcdefghijk | 0.01 ± 0.00 a | 0.68 ± 0.90 a | |
| PHPR5 | 4.67 ± 3.06 abcde | 7.33 ± 1.30 a | 6.17 ± 1.59 abcdefgh | 7.17 ± 1.53 abcdefghijkl | 0.14 ± 0.36 a | 1.88 ± 3.25 a | |
| PHW51 | 2.50 ± 1.51 abcde | 6.50 ± 1.73 a | 5.00 ± 1.21 acdfgh | 8.75 ± 0.75 adehijl | 0.12 ± 0.26 a | 2.54 ± 5.35 a | |
| PHW52 | 2.50 ± 1.51 abcde | 5.83 ± 1.85 a | 6.33 ± 1.56 abcdefgh | 7.08 ± 1.00 abcdefghijkl | 1.14 ± 3.61 a | 51.89 ± 162.52 a | |
| PHEG9 | 1.17 ± 0.58 ac | 4.91 ± 1.87 a | 4.50 ± 0.90 cdfh | 7.73 ± 0.9 abcdefghijkl | 4.97 ± 15.60 a | 446.73 ± 1468.60 a | |
| PHGF5 | 2.82 ± 3.16 abcde | 6.38 ± 1.85 a | 5.36 ± 1.75 abcdefgh | 8.45 ± 1.04 abcdeghijkl | 0.03 ± 0.04 a | 2.29 ± 5.25 a | |
| PHJ70 | 3.00 ± 2.31 abcde | 7.13 ± 0.99 a | 6.00 ± 1.05 abcdefgh | 9.63 ± 1.77 adehijl | 0.11 ± 0.27 a | 488.22 ± 1379.85 a | |
| PHMK0 | 1.00 ± 0.00 a | 7.40 ± 1.34 a | 8.50 ± 0.90 be | 8.64 ± 1.57 abcdefghijkl | 0.06 ± 0.13 a | 2.62 ± 3.48 a | |
| PHT55 | 2.50 ± 2.28 abcde | 7.90 ± 1.45 a | 7.67 ± 1.30 abdefg | 7.83 ± 1.19 abcdefghijkl | 0.06 ± 0.10 a | 3.10 ± 6.81 a |
| Location | Year | x− | σ |
|---|---|---|---|
| Location 1 | 2022 | 5.16 a | 1.90 |
| 2023 | 6.94 b | 1.97 | |
| Location 2 | 2022 | 6.51 c | 1.71 |
| 2023 | 7.25 d | 1.89 | |
| Location 3 | 2022 | 6.49 e | 1.40 |
| 2023 | 7.36 f | 1.76 |
| Material and Year | Variable | DON (ppm) | EAS | FGIS | HCS | HN | ZEA (ppb) |
|---|---|---|---|---|---|---|---|
| NSS 2022 | DON (ppm) | 1 | |||||
| EAS | 0.05 | 1 | |||||
| FGIS | −0.07 | 0.02 | 1 | ||||
| HCS | −0.02 | −0.22 * | 0.19 * | 1 | |||
| HN | −0.04 | −0.31 * | 0.20 * | 0.34 * | 1 | ||
| ZEA (ppb) | 0.32 * | 0.07 | 0.03 | −0.04 | −0.01 | 1 | |
| NSS 2023 | DON (ppm) | 1 | |||||
| EAS | −0.18 * | 1 | |||||
| FGIS | −0.08 | 0.00 | 1 | ||||
| HCS | 0.02 | −0.19 * | −0.02 | 1 | |||
| HN | 0.09 | −0.17 * | 0.07 | 0.20 * | 1 | ||
| ZEA (ppb) | 0.70 * | −0.18 * | −0.07 | 0.01 | 0.02 | 1 | |
| SSS 2022 | DON (ppm) | 1 | |||||
| EAS | 0.09 | 1 | |||||
| FGIS | −0.12 | −0.06 | 1 | ||||
| HCS | 0.08 | −0.07 | 0.14 | 1 | |||
| HN | −0.04 | −0.03 | 0.21 * | 0.09 | 1 | ||
| ZEA (ppb) | 0.21 * | 0.00 | 0.01 | 0.00 | 0.04 | 1 | |
| SSS 2023 | DON (ppm) | 1 | |||||
| EAS | −0.15 | 1 | |||||
| FGIS | −0.06 | 0.07 | 1 | ||||
| HCS | 0.08 | −0.08 | 0.19 * | 1 | |||
| HN | −0.08 | −0.06 | 0.02 | 0.01 | 1 | ||
| ZEA (ppb) | 0.68 * | −0.19 * | −0.10 | 0.06 | 0.15 | 1 |
| Heterotic Group | Trait | Model | Marker | Chromosome | Chromosome Position (cM) | Genome Position (cM) | Effect | SE Effect | −log (p Value) |
|---|---|---|---|---|---|---|---|---|---|
| NSS | EAS | GWAS | C10550D-001 | 7 | 185.98 | 1675.98 | 1.33 | 0.4 | 3.07 |
| HCS | GWAS | C104E04-001 | 1 | 264.81 | 264.81 | 1.01 | 0.3 | 3.16 | |
| C1052NP-001 | 6 | 86.75 | 1392.75 | −0.86 | 0.25 | 3.27 | |||
| HN | GWAS | C104W1Y-001 | 3 | 153.15 | 732.15 | −1.02 | 0.31 | 3.08 | |
| C104XB3-001 | 4 | 110.41 | 940.41 | −1.07 | 0.31 | 3.19 | |||
| C1054NE-001 | 7 | 163.06 | 1653.06 | −0.96 | 0.26 | 3.58 | |||
| C104PTU-001 | 10 | 71.27 | 2173.27 | −0.88 | 0.26 | 3.13 | |||
| SSS | EAS | GWAS | C104NB1-001 | 1 | 79.39 | 79.39 | −1.48 | 0.42 | 3.33 |
| MZA15082-13 | 4 | 13.06 | 843.06 | −1.57 | 0.47 | 3.04 | |||
| C104XFF-001 | 4 | 117.82 | 947.82 | −1.25 | 0.32 | 4.02 | |||
| C104XTF-001 | 4 | 148.22 | 978.22 | −1.31 | 0.37 | 3.4 | |||
| C105186-001 | 5 | 181.04 | 1259.04 | −1.31 | 0.39 | 3.07 | |||
| MZA15414-29 | 6 | 52.79 | 1358.79 | −1.63 | 0.43 | 3.76 | |||
| C104EJV-001 | 7 | 34.26 | 1524.26 | −1.29 | 0.39 | 3.01 | |||
| SSS | FGIS | GWAS | C104UT6-001 | 2 | 109.39 | 431.39 | 0.19 | 0.06 | 3.17 |
| C105025-001 | 4 | 97.58 | 927.58 | 0.17 | 0.05 | 3.27 | |||
| C1053JV-001 | 6 | 24.03 | 1330.03 | 0.16 | 0.04 | 3.83 | |||
| C1053E9-001 | 6 | 180.5 | 1486.5 | 0.19 | 0.06 | 3.14 |
Disclaimer/Publisher’s Note: The statements, opinions and data contained in all publications are solely those of the individual author(s) and contributor(s) and not of MDPI and/or the editor(s). MDPI and/or the editor(s) disclaim responsibility for any injury to people or property resulting from any ideas, methods, instructions or products referred to in the content. |
© 2024 by the authors. Licensee MDPI, Basel, Switzerland. This article is an open access article distributed under the terms and conditions of the Creative Commons Attribution (CC BY) license (https://creativecommons.org/licenses/by/4.0/).
Share and Cite
Magarini, A.; Pirovano, A.; Ghidoli, M.; Cassani, E.; Casati, P.; Pilu, R. Quantitative Trait Loci Analysis of Maize Husk Characteristics Associated with Gibberella Ear Rot Resistance. Agronomy 2024, 14, 1916. https://doi.org/10.3390/agronomy14091916
Magarini A, Pirovano A, Ghidoli M, Cassani E, Casati P, Pilu R. Quantitative Trait Loci Analysis of Maize Husk Characteristics Associated with Gibberella Ear Rot Resistance. Agronomy. 2024; 14(9):1916. https://doi.org/10.3390/agronomy14091916
Chicago/Turabian StyleMagarini, Andrea, Anna Pirovano, Martina Ghidoli, Elena Cassani, Paola Casati, and Roberto Pilu. 2024. "Quantitative Trait Loci Analysis of Maize Husk Characteristics Associated with Gibberella Ear Rot Resistance" Agronomy 14, no. 9: 1916. https://doi.org/10.3390/agronomy14091916