Article

Effects of Different Living Grass Mulching on Soil Carbon and Nitrogen in an Apple Orchard on Loess Plateau

1
State Key Laboratory of Herbage Improvement and Grassland Agro-Ecosystems, Lanzhou University, Lanzhou 730020, China
2
College of Pastoral Agricultural Science and Technology, Lanzhou University, Lanzhou 730020, China
3
Qingyang National Field Scientific Observation and Research Station of Grassland Agro-Ecosystems, Lanzhou University, Qingyang 745004, China
4
Institute of Soil and Water Conservation Science of Gansu Province, Lanzhou 730000, China
*
Authors to whom correspondence should be addressed.
Agronomy 2024, 14(9), 1917; https://doi.org/10.3390/agronomy14091917
Submission received: 9 July 2024 / Revised: 23 August 2024 / Accepted: 25 August 2024 / Published: 27 August 2024
(This article belongs to the Section Grassland and Pasture Science)

Abstract

:
Living grass mulching (LMG) is a modern, environmentally friendly, practical, and efficient production management technology that improves the ecological environment, quality, and efficiency of the orchard. However, in arid and semi-arid areas, the effects of different grass species mulching on soil carbon composition, carbon pool stability, and nitrogen content are still unclear. Therefore, in order to explore the impact of different LMG on soil carbon, nitrogen, and its component content, as well as the related soil carbon pool management index in an apple orchard located in the semi-arid region of the Loess Plateau, a control experiment was conducted. The experiment involved different grass species cover treatments on an 11-year-old semi-dwarf Qinguan apple orchard from 2019 to 2022. Soil carbon and nitrogen content were measured under each treatment. The results indicated that the application of LMG treatment and depth of the soil had a significant impact on the soil organic carbon (SOC), particulate organic carbon (POC), inactive organic carbon (NAOC), total nitrogen (TN), and carbon-to-nitrogen ratio (C/N). Planting Vulpia myuros mulches significantly enhanced 39.6% surface soil organic carbon, 61.7% surface particulate organic carbon, 20.3% surface dissolved organic carbon (DOC), 75.8% surface inactive organic carbon, and 20.6% surface soil total nitrogen compared to clean tillage. Mulching treatment with the planting of Vulpia myuros boosted surface soil organic carbon and decreased soil carbon pool activity (CPA) and carbon pool activity index (CPAI), ultimately improving the stability of the soil carbon pool. The findings will have a beneficial impact on improving soil quality, carbon sequestration, and emission reduction in arid and semi-arid regions.

1. Introduction

China is the world’s largest apple producer, and apple production has doubled in the past 20 years, providing an important guarantee for Chinese apple exports, and economic development [1]. However, in most apple-growing areas, the considerable economic benefits from apple production come at the expense of orchard soil quality [2]. Therefore, how to improve the soil environment and improve soil quality to promote the sustainable and healthy development of the apple industry is a scientific problem that needs to be solved urgently. As a new type of environment-friendly orchard management technology, orchard grass cultivation can improve soil health and promote the sustainable development of the fruit planting industry [3]. Compared with mulches such as plastic film and straw, living grass mulches have higher activity, and the growth of grass mulches can be adjusted by cutting or crushing, which is an effective measure to improve the physical and chemical properties of orchard soil and improve soil quality [4].
The Loess Plateau, one of China’s two main apple-producing regions, confronts various ecological challenges, including soil erosion. Additionally, traditional orchard management practices, such as ground-clearing tillage, negatively impact soil health by reducing soil organic matter content, diminishing soil microbial diversity, and even causing soil pollution [5]. The extension of orchard grass cultivation and mulching on the Loess Plateau can not only improve the ecological benefits of orchards [6,7] but also improve land use efficiency to a certain extent, thereby increasing economic income.
At present, many studies have been carried out to explore the effects of living grass mulching on the physical and chemical properties of orchard soil and soil health [6,7,8]. Research has demonstrated that living grass mulching can affect soil organic matter, total nitrogen, available nitrogen, and other nutrients and physical and chemical indicators, as well as soil biological activities through above-ground shading, increasing above-ground and underground biomass, improving soil structure, and root activation components [9,10,11]. The impact of living grass mulch on soil organic matter is quite evident [10], particularly concerning soil organic carbon (SOC). Living grass mulch can promote the process of soil organic carbon sequestration by adding organic matter to the soil and minimizing the loss of soil organic carbon, hence reducing greenhouse gas emissions [12]. However, the influence of living grass cover on other soil indicators such as organic carbon components, total nitrogen, available nitrogen, carbon pool index, etc., varies depending on factors such as orchard types, fruit tree varieties, grass types (natural grass or artificially cultivated grass), grass species, and the technology used for different areas, which can lead to different and even contradictory results [7,13]. At the same time, the effects of different living grass mulching on organic carbon components, carbon pool stability, total nitrogen, available nitrogen, and their interactions are still unclear, especially in arid and semi-arid areas, and further research is still needed.
In order to address the above-mentioned research gap, this study focused on an 11-year-old semi-dwarf Qinguan apple orchard located in the arid plateau of Qingyang. Field control experiments were conducted using various grass cultivation species to explore the impact of these species on soil organic carbon and its components, total nitrogen, available nitrogen, pH, carbon pool index, etc. in the apple orchard within the semi-arid region of the Loess Plateau. The aim was to enhance our understanding of how different grass cultivation species affect the soil of apple orchards in arid and semi-arid regions.

2. Materials and Methods
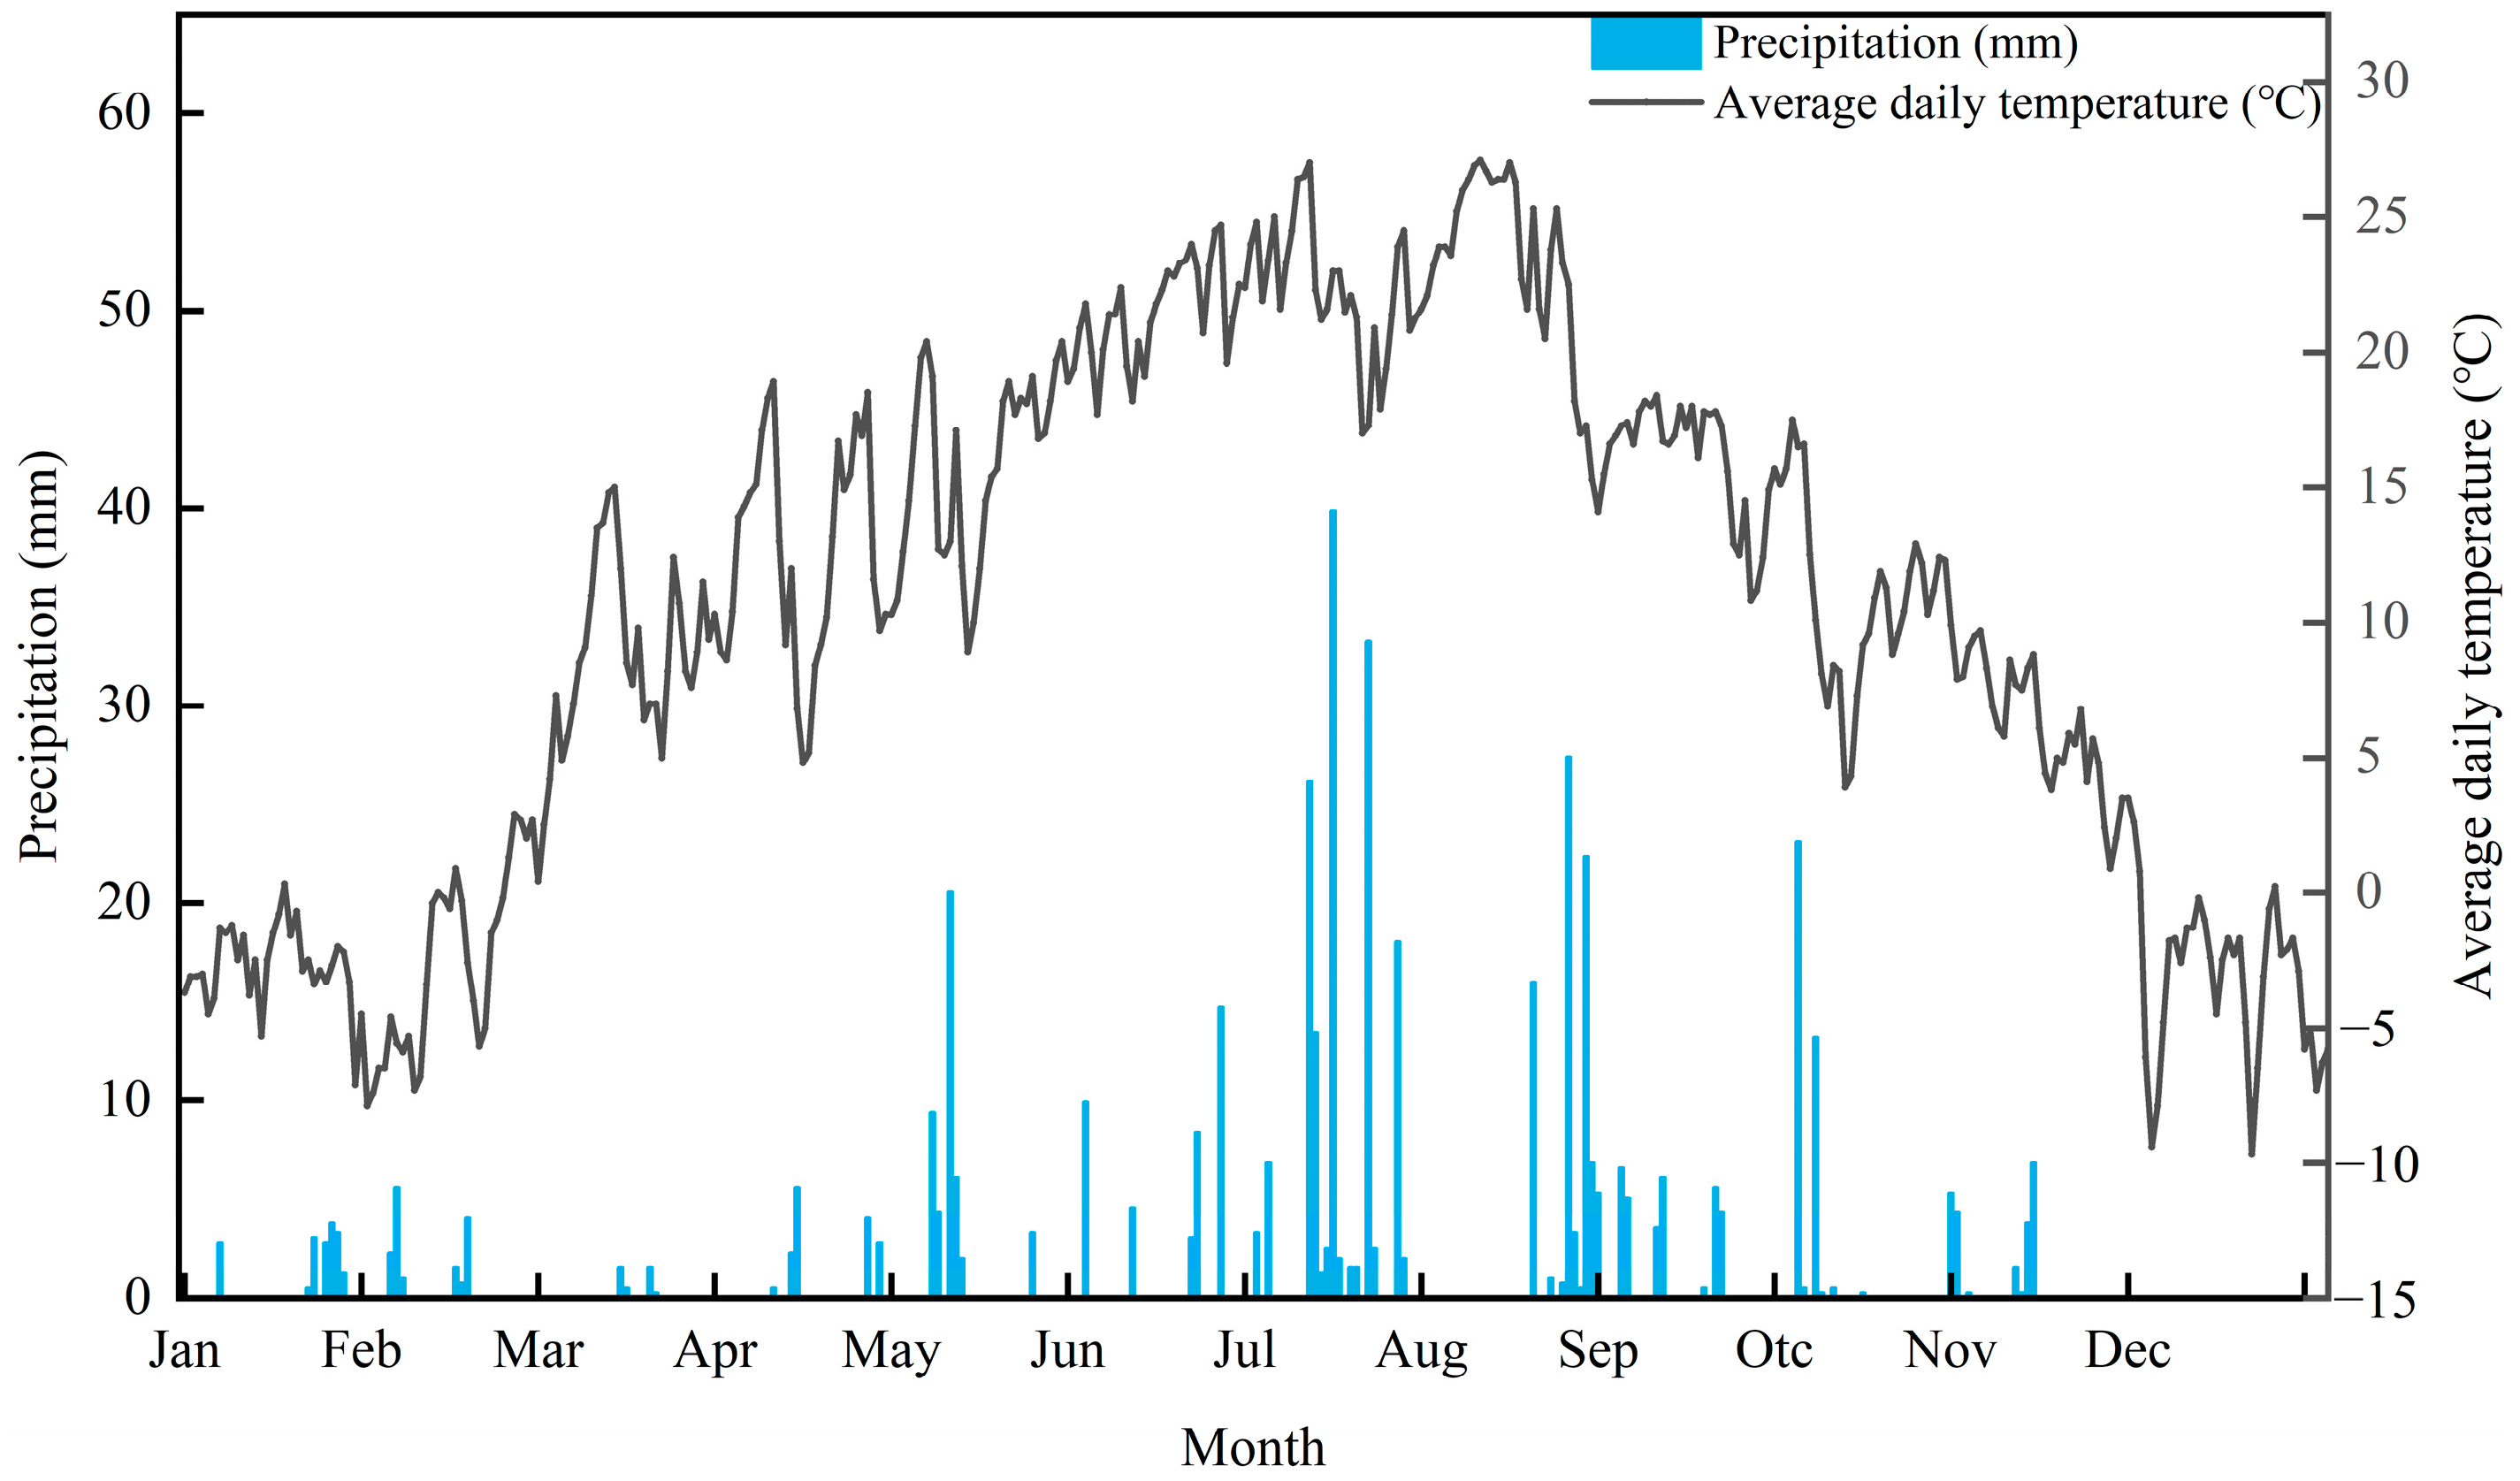
2.1. Study Area

The experimental site is located at the Qingyang National Field Scientific Observation and Research Station of Grassland Agro-ecosystem in Xifeng District, Qingyang City, Gansu Province (35°40′ N, 107°51′ E, 1297 m above mean sea level). The field observation and research station are located in the dry plateau area of the Loess Plateau. The main cash crop in this area is apples, and typical grass species are Stipa bungeana, Potentilla acaulis, Leymus secalinus, and so on. Rainwater is the only water source for regional crop growth. The average temperature of the observation station for many years (i.e., 1961–2021) is 9–10 °C, and the annual precipitation is 500–600 mm. The interannual and interseasonal distribution of rainfall is uneven, and the interseasonal distribution is extremely uneven. In September, the precipitation can reach more than 50% of the total annual precipitation, the frost-free period is 150–190 days, and the annual sunshine hours are 2300–2400 h. The soil type of apple orchard belongs to dark loessial soil. The thickness of the humus layer in the soil profile is between 40 and 95 cm. This soil has a strong lime reaction, with a calcium carbonate content of 12.5–189.5 g kg−1, pH between 8 and 9, SOC between 3.4 and 25.4 g kg−1, and an average of 6.94 g kg−1 (120 cm profile). In the first three years of the experiment, the average annual temperatures in 2019, 2020, and 2021 were 10.77 °C, 10.74 °C, and 10.96 °C, respectively. The annual precipitation in these three years was 668.90 mm, 580.90 mm, and 697.58 mm, respectively. The sampling year of the studied soil is a dry year, with a total annual precipitation of 433.0 mm and an average annual temperature of 10.55 °C. In August, the precipitation dropped abnormally, and a summer drought occurred (Figure 1).

2.2. Experimental Design

Vulpia myuros (L.) C. C. Gmel. and Dactylis glomerata L. were the herbaceous plants of 1-year-old Gramineae and perennial Gramineae, respectively. The experiment consisted of two living grass mulching treatments: Vulpia myuros (VM) mulching, Dactylis glomerata (DG) mulching, and a clear tillage control (CK). Four replicates were set for each treatment in a univariate randomized block design with a plot area of 320 m2 per treatment (including four rows of fruit trees 20 m in length). The plots were 11-year-old apple orchards in the test station, with row spacing of 4 m and plant spacing of 4 m. The apple tree varieties tested in the orchard are semi-dwarf Qinguan (Malus pumila M. cv. Qinguan). Before sowing, the orchard land underwent adjustments, and the forage for the experiments was sown during the spring season (particularly in March 2019), and Vulpia myuros was sown in March every year thereafter. The sowing rate of forage was 15 kg hm−2. The living grass cover treatment presented an interrow band 70 cm apart from the edge of the apple trunk, and the living grass cover transect width was 230 cm. When the natural growth height of Dactylis glomerata was about 55 cm, conventional cutting was carried out, and the frequency was 2 to 4 times per growth period. The weed treatment in the non-grass area of the two-living grass mulching treatment plot was consistent with that of the clear tillage control orchard. This treatment method is manual weeding.

2.3. Soil Sample Acquisition and Measurement Methods

After the fourth growth season of artificially planted Vulpia myuros and Dactylis glomerata, soil samples were collected on 10 September 2022. During sampling, soil drills with a diameter of 5 cm were used to collect soil, and 0–50 cm soil layers were collected in each plot using a three-point method (mix the soil layers of these three points into one soil sample, so the total number of soil samples obtained is 48). The soil samples in the profile are divided into 0–10 cm, 10–20 cm, 20–30 cm, and 30–50 cm. After natural air-drying, it passed through a 2 mm sieve for the determination of soil organic carbon and components, soil nitrogen content, and pH.
The soil organic carbon [14] and dissolved organic carbon (DOC) were determined using the potassium dichromate heating oxidation method (K2Cr2O7-H2SO4 oxidation method) and the potassium sulfate water solubility method (spectrophotometry), respectively. The latter method involves colorimetric analysis using an ultraviolet spectrophotometer (UV-2102C, Unique, Shanghai, China) [15]. The easily oxidizable organic carbon (EOC) content was determined using the potassium permanganate oxidation method (333 mmol L−1 of KMnO4) [16]. The particulate organic carbon (POC) was measured by the sodium hexametaphosphate dispersion method [17]. After the air-dried soil sample was placed in a 5% sodium hexametaphosphate solution, it oscillated. The soil particles of 53–2000 μm were separated by repeated washing with deionized water (the air-dried soil sample has been sieved by 2 mm in advance), and then the organic carbon content of the separated soil is determined by the potassium dichromate heating oxidation method [18]. The Kjeldahl nitrogen determination method was used to quantify the total nitrogen (TN) content of the tested orchard soil (Kjeltech 8400, Foss, Hilleroed, Denmark). To do this, solid CuSO4 hydrate and concentrated H2SO4 were added to the soil samples, which were then boiled with nitrate. After absorbing the distilled NH3 with boric acid, the total nitrogen content of the tested apple orchard soil was calibrated with hydrochloric acid [14]. The soil ammonium nitrogen and nitrate nitrogen were determined by the AMS Alliance SmartChem 450 automatic direct-reading intermittent chemical analyzer (SmartChem 450, AMS Alliance, Guidonia, Italy). Soil pH is obtained by measuring the supernatant of the soil water solution with a pH meter (PHS-3C, Leici, Shanghai, China). All the chemicals mentioned above are from China National Pharmaceutical Group Chemical Reagent Shaanxi Co., Ltd. (Xi’an, Shaanxi, China).
Methods for calculating indicators related to soil carbon pools [16]:
NAOC = SOC − EOC
CPA = EOC/NAOC = EOC/(SOC − EOC)
CPAI = CPAT/CPACK
CPI = SOCT/SOCCK
CMI = CPAI × CPI × 100
where NAOC is soil inactive organic carbon; CPA is soil carbon pool activity; CPAI is the soil carbon pool activity index; CPAT is the soil carbon pool activity of the treatment; and CPACK is the soil carbon pool activity of the control; CPI is the soil carbon pool index; SOCT is the soil organic carbon content of the treatment; and SOCCK is the soil organic carbon content of the control. CMI is a soil carbon pool management index that can be used to measure the sensitivity of soil carbon pool changes. All indicators were measured following the SMAF Soil Management Assessment Framework [19].

2.4. Data Processing

Data curation was performed using Microsoft Excel 2016. The data were analyzed by IBM SPSS Statistics 25 software (SPSS Inc., Chicago, IL, USA). Soil organic carbon and its components, total nitrogen, available nitrogen, ratio of carbon to nitrogen, pH, and carbon pool were analyzed by one-way analysis of variance (ANOVA). The significance level was p < 0.05. Multiple comparisons were made between different treatments using the LSD method. A two-factor ANOVA was used to analyze the effects of treatment, soil depth, and their interaction on the above indicators. The drawing was performed with Origin 2021 software.

3. Results

3.1. Effects of Soil Organic Carbon and Its Components in an Apple Orchard Covered with Different Species of Living Grass

Soil organic carbon (SOC) and particulate organic carbon (POC) were significantly affected by different grass species mulching (p < 0.05, Table 1). There are significant differences in SOC in the surface layer of an apple orchard (Figure 2a). The SOC content of Vulpia myuros mulching (hereinafter referred to as VM) is the highest at 15.03 ± 0.15 g kg−1, the SOC content of Dactylis glomerata mulching (hereinafter referred to as DG) is the lowest at 10.53 ± 0.39 g kg−1, and the SOC content of clear tillage control (hereinafter referred to as CK) is 10.77 ± 0.49 g kg−1. Compared with CK, VM treatment significantly increased surface SOC by 39.6% (p < 0.01), while DG treatment had no significant effect on surface SOC (p > 0.05). In the soil layers of 10–20 cm and 20–30 cm, the SOC of the DG treatment orchard was significantly lower than that of the CK (p < 0.05), which was significantly reduced by 14.8% and 13.9%, respectively. In the whole soil layer, the average SOC content of the apple orchards covered by the two grass species was not significantly different (Figure 2b, p > 0.05), but the SOC of the apple orchards treated with VM was 10.75% higher than that of CK.
Soil POC content is shown in Figure 2c,d. Similar to SOC content, the highest POC content in orchard topsoil in VM treatment was 5.85 ± 0.38 g kg−1, which was significantly higher than that in DG treatment and CK treatment (p < 0.01), and the latter two had no significant difference (p > 0.05). Compared with the control, the POC of orchard topsoil treated with VM increased significantly by 61.7% (p < 0.01). The POC of other soil layers and average level also showed a similar trend, but the difference was not significant (p > 0.05).
The soil DOC was only significantly affected by the depth of the soil layer (Table 1, p < 0.05), and its changes are shown in Figure 2e,f. Compared with CK, there was no significant difference in average DOC content between the VM and DG treatments (p > 0.05). The content of DOC (203.91 ± 15.17 mg kg−1) in 0–10 cm soil under VM treatment was significantly higher than that of DG treatment (p < 0.01) and CK (p < 0.05), the values of which were 151.48 ± 6.54 mg kg−1 and 171.87 ± 7.11 mg kg−1, respectively. Compared with the control, the DOC content of VM-treated apple orchard topsoil significantly increased by 20.3% (p < 0.05), and the difference in DOC content of other soil layers with different grass treatments was not significant (p > 0.05).
Soil EOC was not significantly different among different treatments but was significantly affected by soil depth and the interaction between soil depth and treatments (p < 0.05, Table 1). As shown in Figure 2g,h, contrary to SOC, the EOC content of apple orchard soil treated with VM was the lowest in the surface layers of 0–10 cm and 10–20 cm, the EOC content of DG treatment in the surface layer was the second, and the EOC content of CK orchard was the highest. In the soil layer of 10–20 cm, DG treatment had the highest EOC content, but there was no significant difference between them (p > 0.05). VM and DG treatments reduced the EOC content of orchard topsoil by 19.3% and 9.4%, respectively. Except for the surface layer, the change in soil EOC content did not fluctuate with the change in soil depth, and there was no significant difference between treatments (p > 0.05).

3.2. Effects of Soil Nitrogen Content in Apple Orchard Covered with Different Species of Living Grass

The contents of total nitrogen and nitrate nitrogen in apple orchard soil changed significantly after different living grass mulching treatments (p < 0.05, Table 2, Figure 3). It can be seen that the effect of different living grass mulching treatments on the total nitrogen (TN) content of apple orchard soil is mainly manifested in the surface layer of 0–10 cm and 10–20 cm soil (Figure 3a). The effect on the rest of the soil layer and the overall average soil layer is not significant (Figure 3b, p > 0.05). The highest TN content was 1.95 ± 0.12 g kg−1 in the VM treatment and 1.77 ± 0.05 g kg−1 in the DG treatment (p > 0.05). The lowest TN content in the CK orchard was 1.61 ± 0.07 g kg−1, and there was a significant difference between VM treatment and CK (p < 0.05). Similar results were found in the top 10–20 cm of soil. In general, VM treatment significantly increased the TN content in the 0–10 cm and 10–20 cm soil layers of an apple orchard and significantly increased it by 20.6% and 19.2%, respectively, compared with CK (p < 0.05).
In terms of available nitrogen (Figure 3c,d, the conversion relationship of available nitrogen content in this study is 1 mg L−1 = 10 mg kg−1), no matter in each soil layer or average amount, there is no significant difference in soil ammonium nitrogen ( NH 4 + - N ) content between treatments and clear tillage control and among treatments (p > 0.05). However, the content of nitrate nitrogen ( NO 3 - N ) was different. From the overall average, the soil nitrate nitrogen content of the two treatments was significantly lower than that of CK (p < 0.01), and there was also a significant difference in the nitrate nitrogen content between the two treatments (p < 0.05). Among them, the overall average nitrate nitrogen content of CK was 1.07 ± 0.09 mg L−1, the VM of the two treatments was 0.78 ± 0.06 mg L−1, and the DG was 0.53 ± 0.09 mg L−1 (Figure 3f). Compared with CK, VM and DG treatments significantly reduced the total average content of nitrate nitrogen in soil by 26.7% and 50.6%, respectively (p < 0.01). Specific to each soil layer, except for the surface layer of 0–10 cm soil, the other three soil layers showed the same law: the soil nitrate nitrogen content of CK treatment was significantly higher than that of DG treatment (p < 0.01), and the soil nitrate nitrogen content of VM treatment was between CK and DG treatment, and there was no significant difference between them (Figure 3e, p > 0.05).

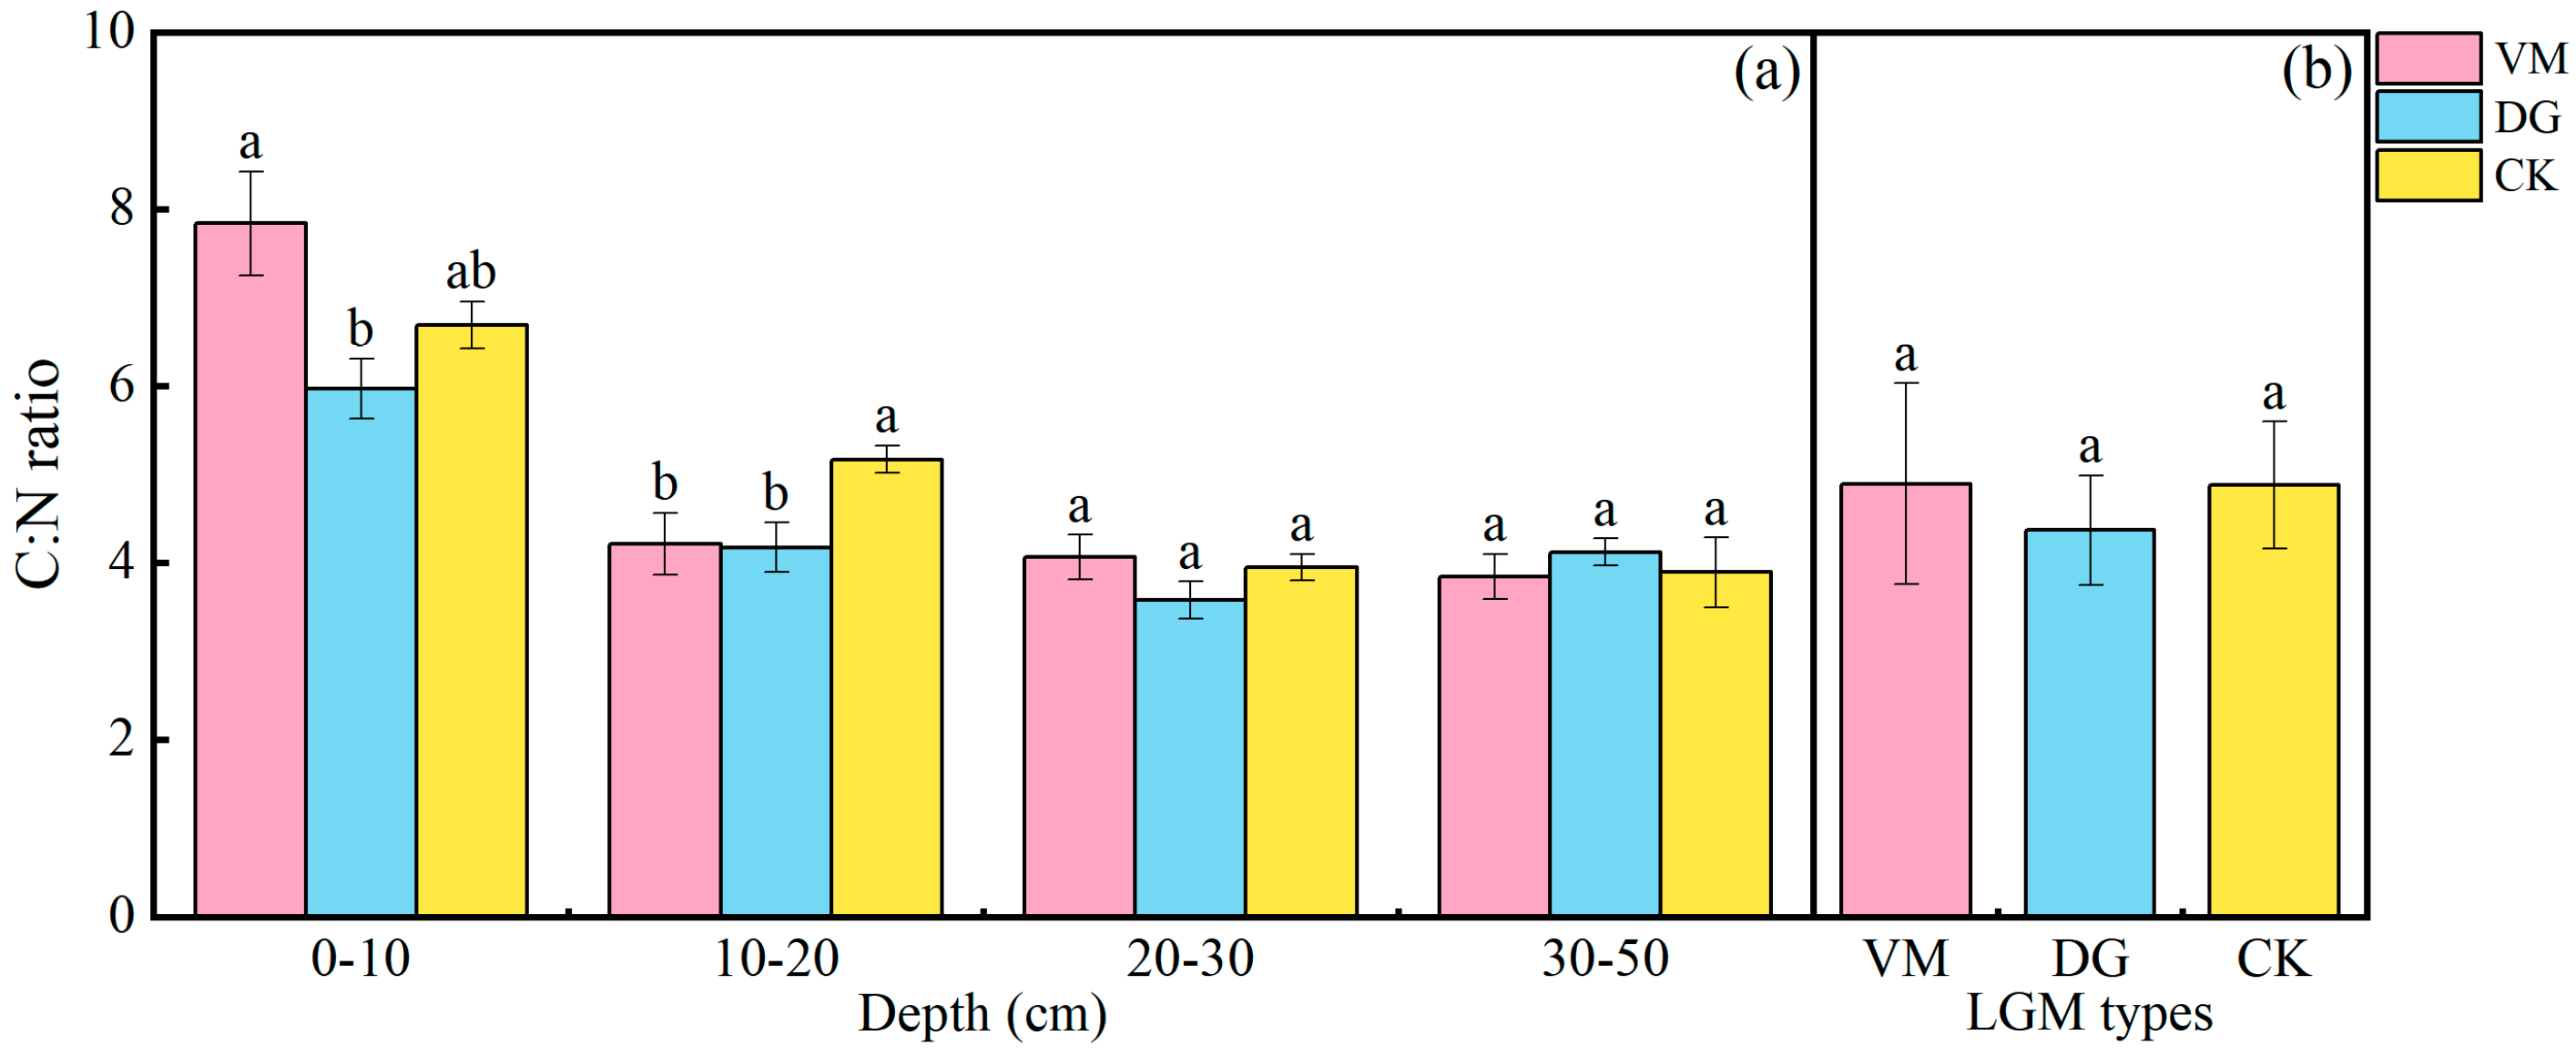
3.3. Effects of Soil C-N Ratio of the Apple Orchard Covered with Different Species of Living Grass

Different living grass mulching treatments significantly affect the change in soil carbon-nitrogen ratio (C/N), and it changes with soil depth (Table 2, Figure 4). In general, there was no significant difference in soil C-N ratio between treatment and control (p > 0.05). In different soil layers, the ratio of carbon to nitrogen was similar to the content of organic carbon in 0–10 cm soil. The ratio of carbon to nitrogen in VM treatment was the highest, and that in DG treatment was the lowest. The ratio of carbon to nitrogen in VM treatment was significantly higher than that in DG treatment (p < 0.05), but the difference in CK was not significant (p > 0.05). In the 10–20 cm soil layer, the two grass treatments significantly reduced soil carbon and nitrogen by 18.5% (VM) and 19.3% (DG) compared with CK (Figure 4a, p < 0.05).

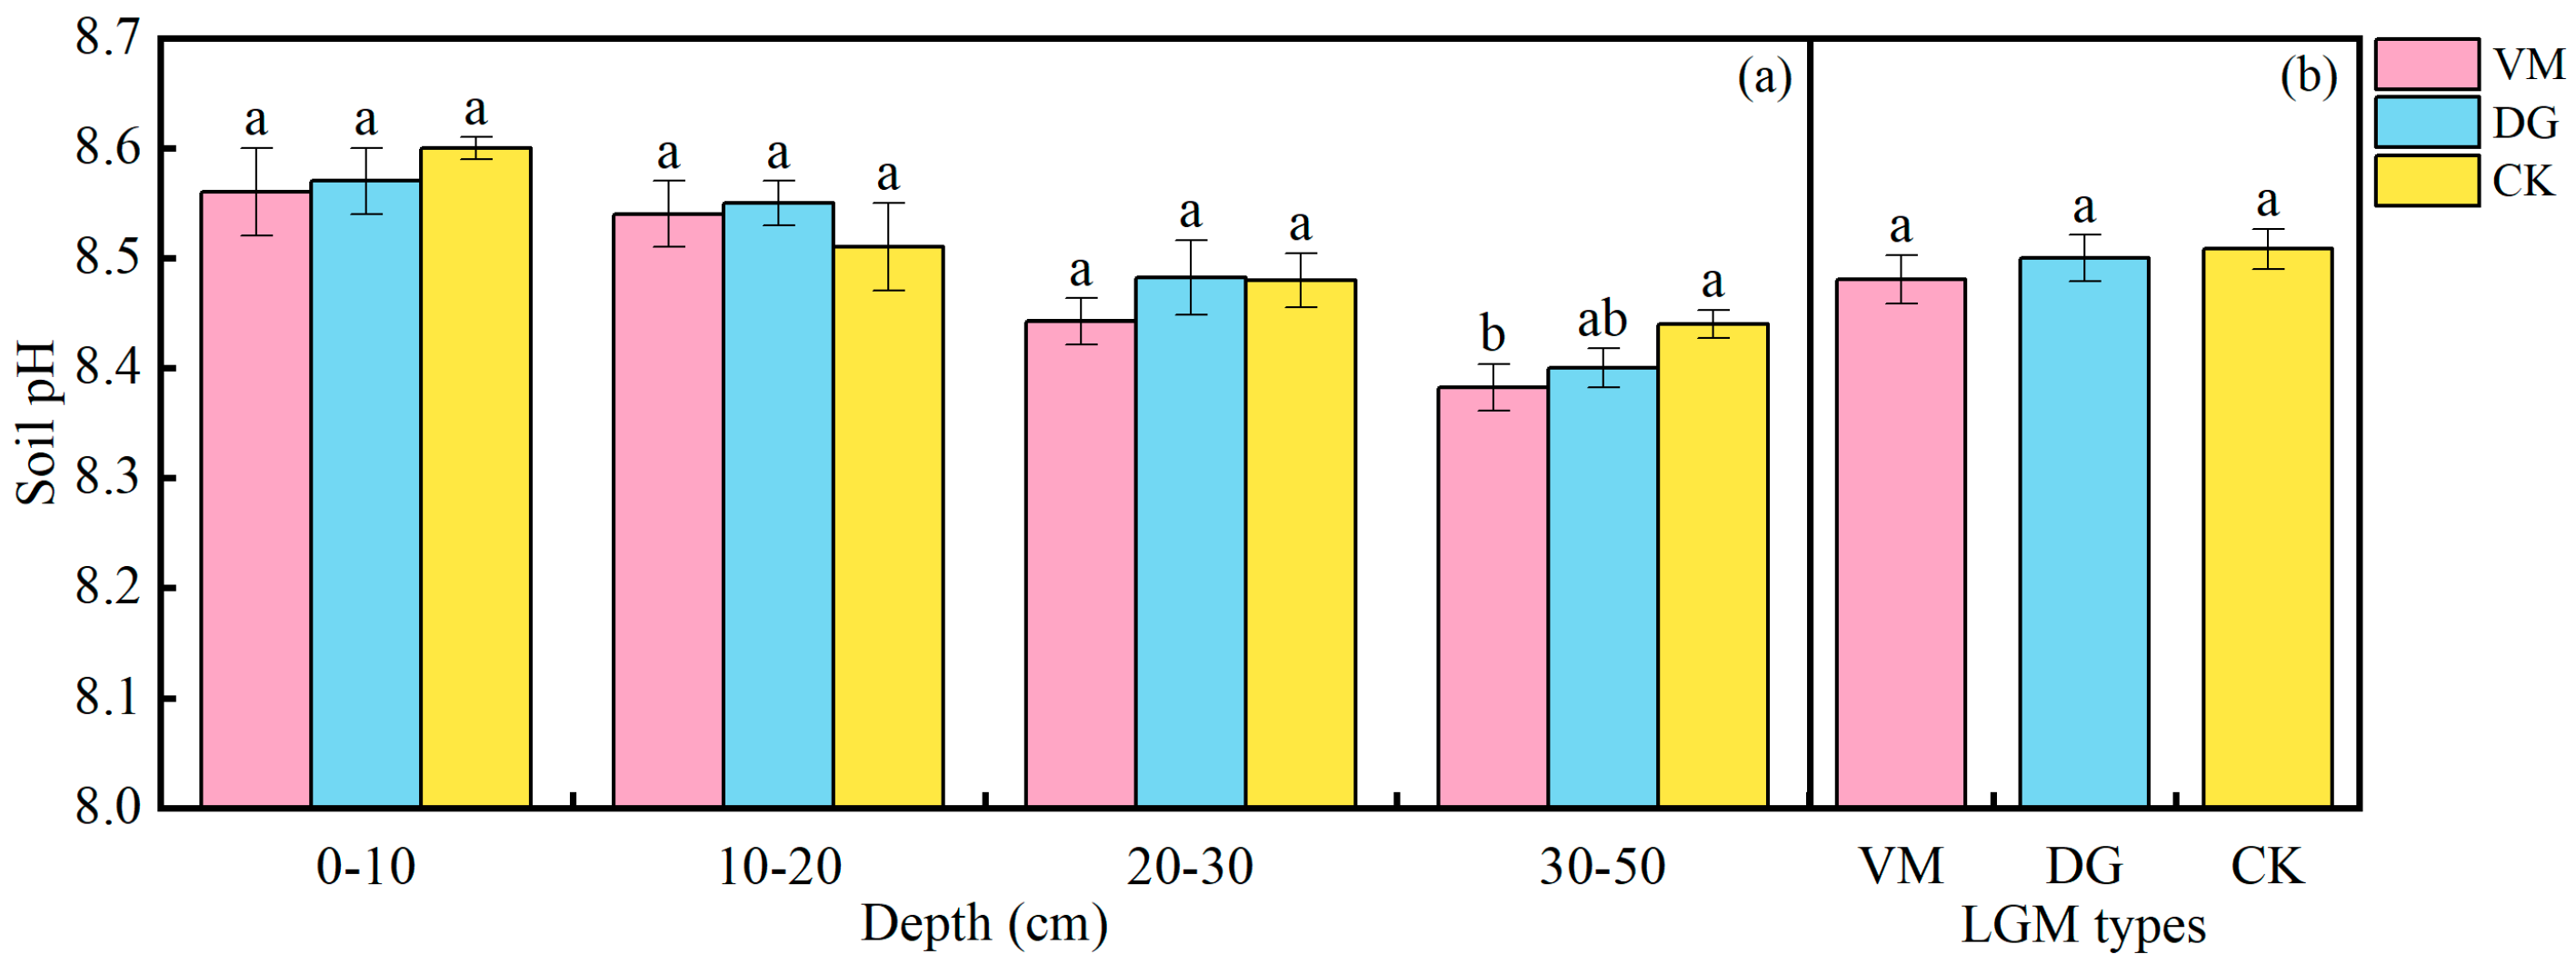
3.4. Effects of Soil pH of the Apple Orchard Covered with Different Species of Living Grass

The soil pH values of apple orchards covered with different grass species are shown in Figure 5. The effects of different treatments on soil pH in apple orchards were not significant, but pH changed with soil depth (Table 2). In general, the effects of different treatments on the soil pH of 0–10 cm, 10–20 cm, and 20–30 cm soil layers were not significant (p > 0.05), showing that the soil pH of CK was slightly higher than that of the two treatments, while the soil pH of the DG treatment was higher than that of the VM treatment. In the soil layer of 30–50 cm, the soil pH of the VM treatment (8.38 ± 0.02) was significantly lower than that of CK (8.44 ± 0.01, p < 0.05).

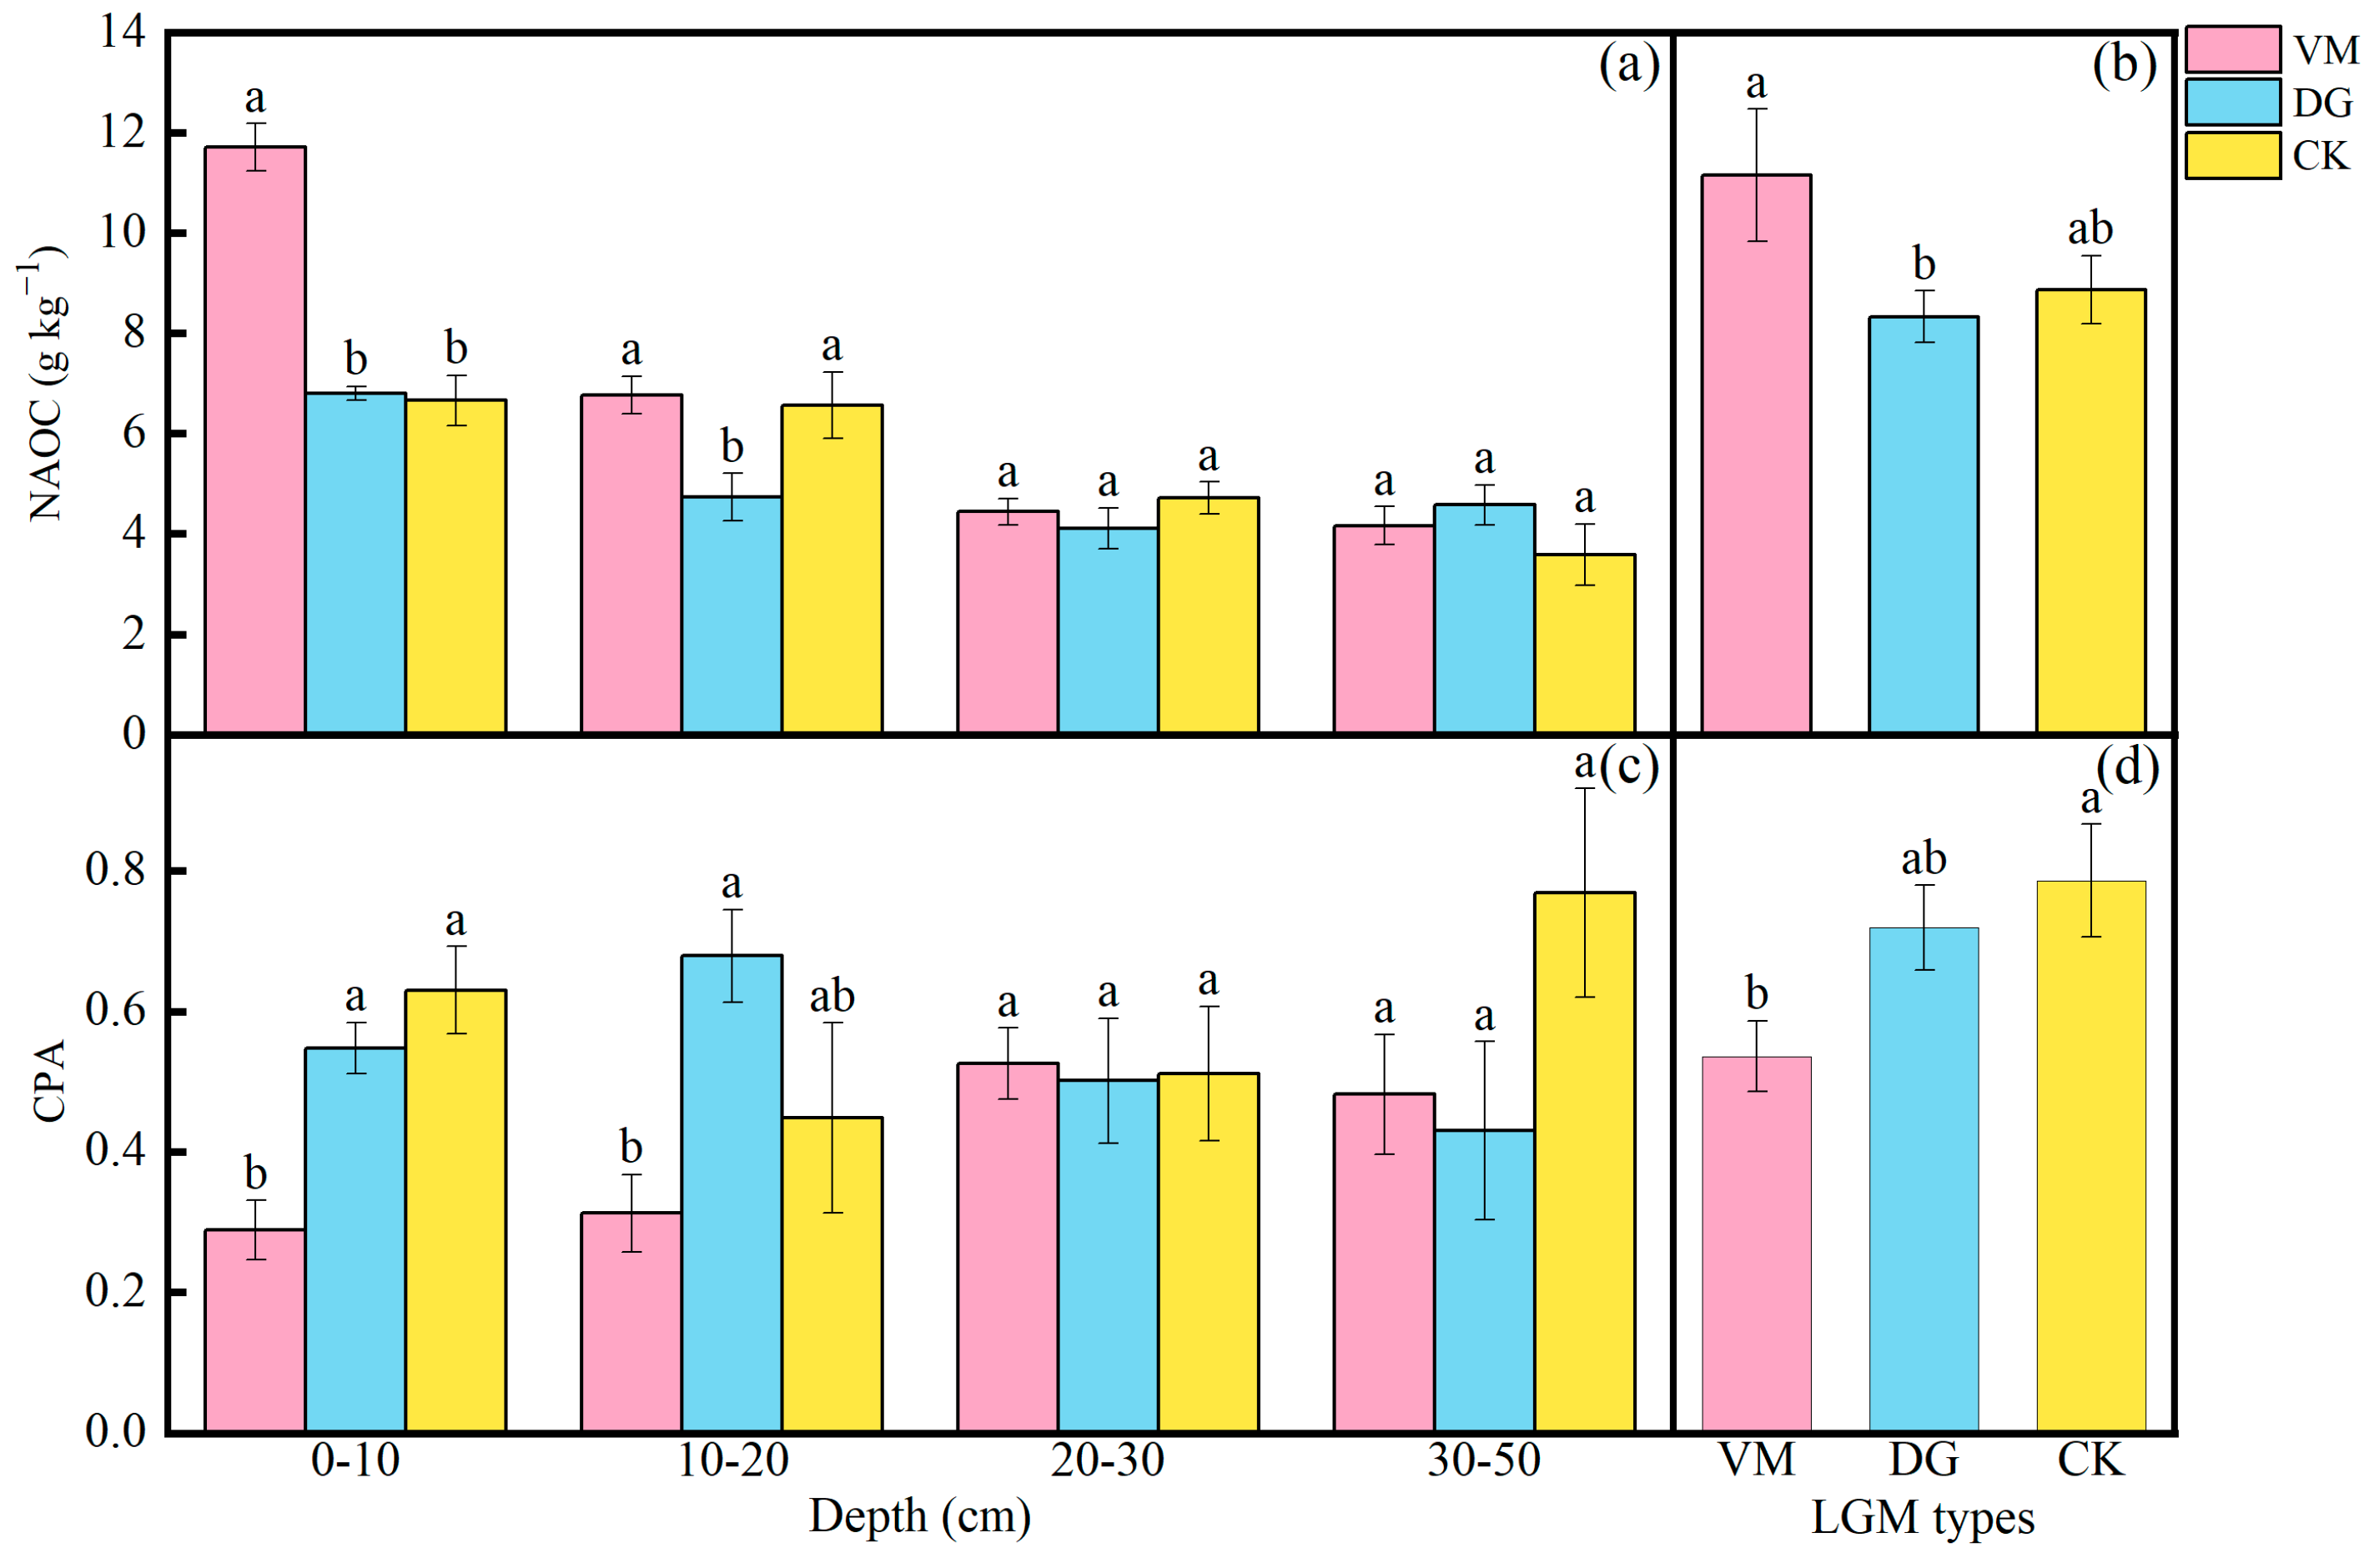
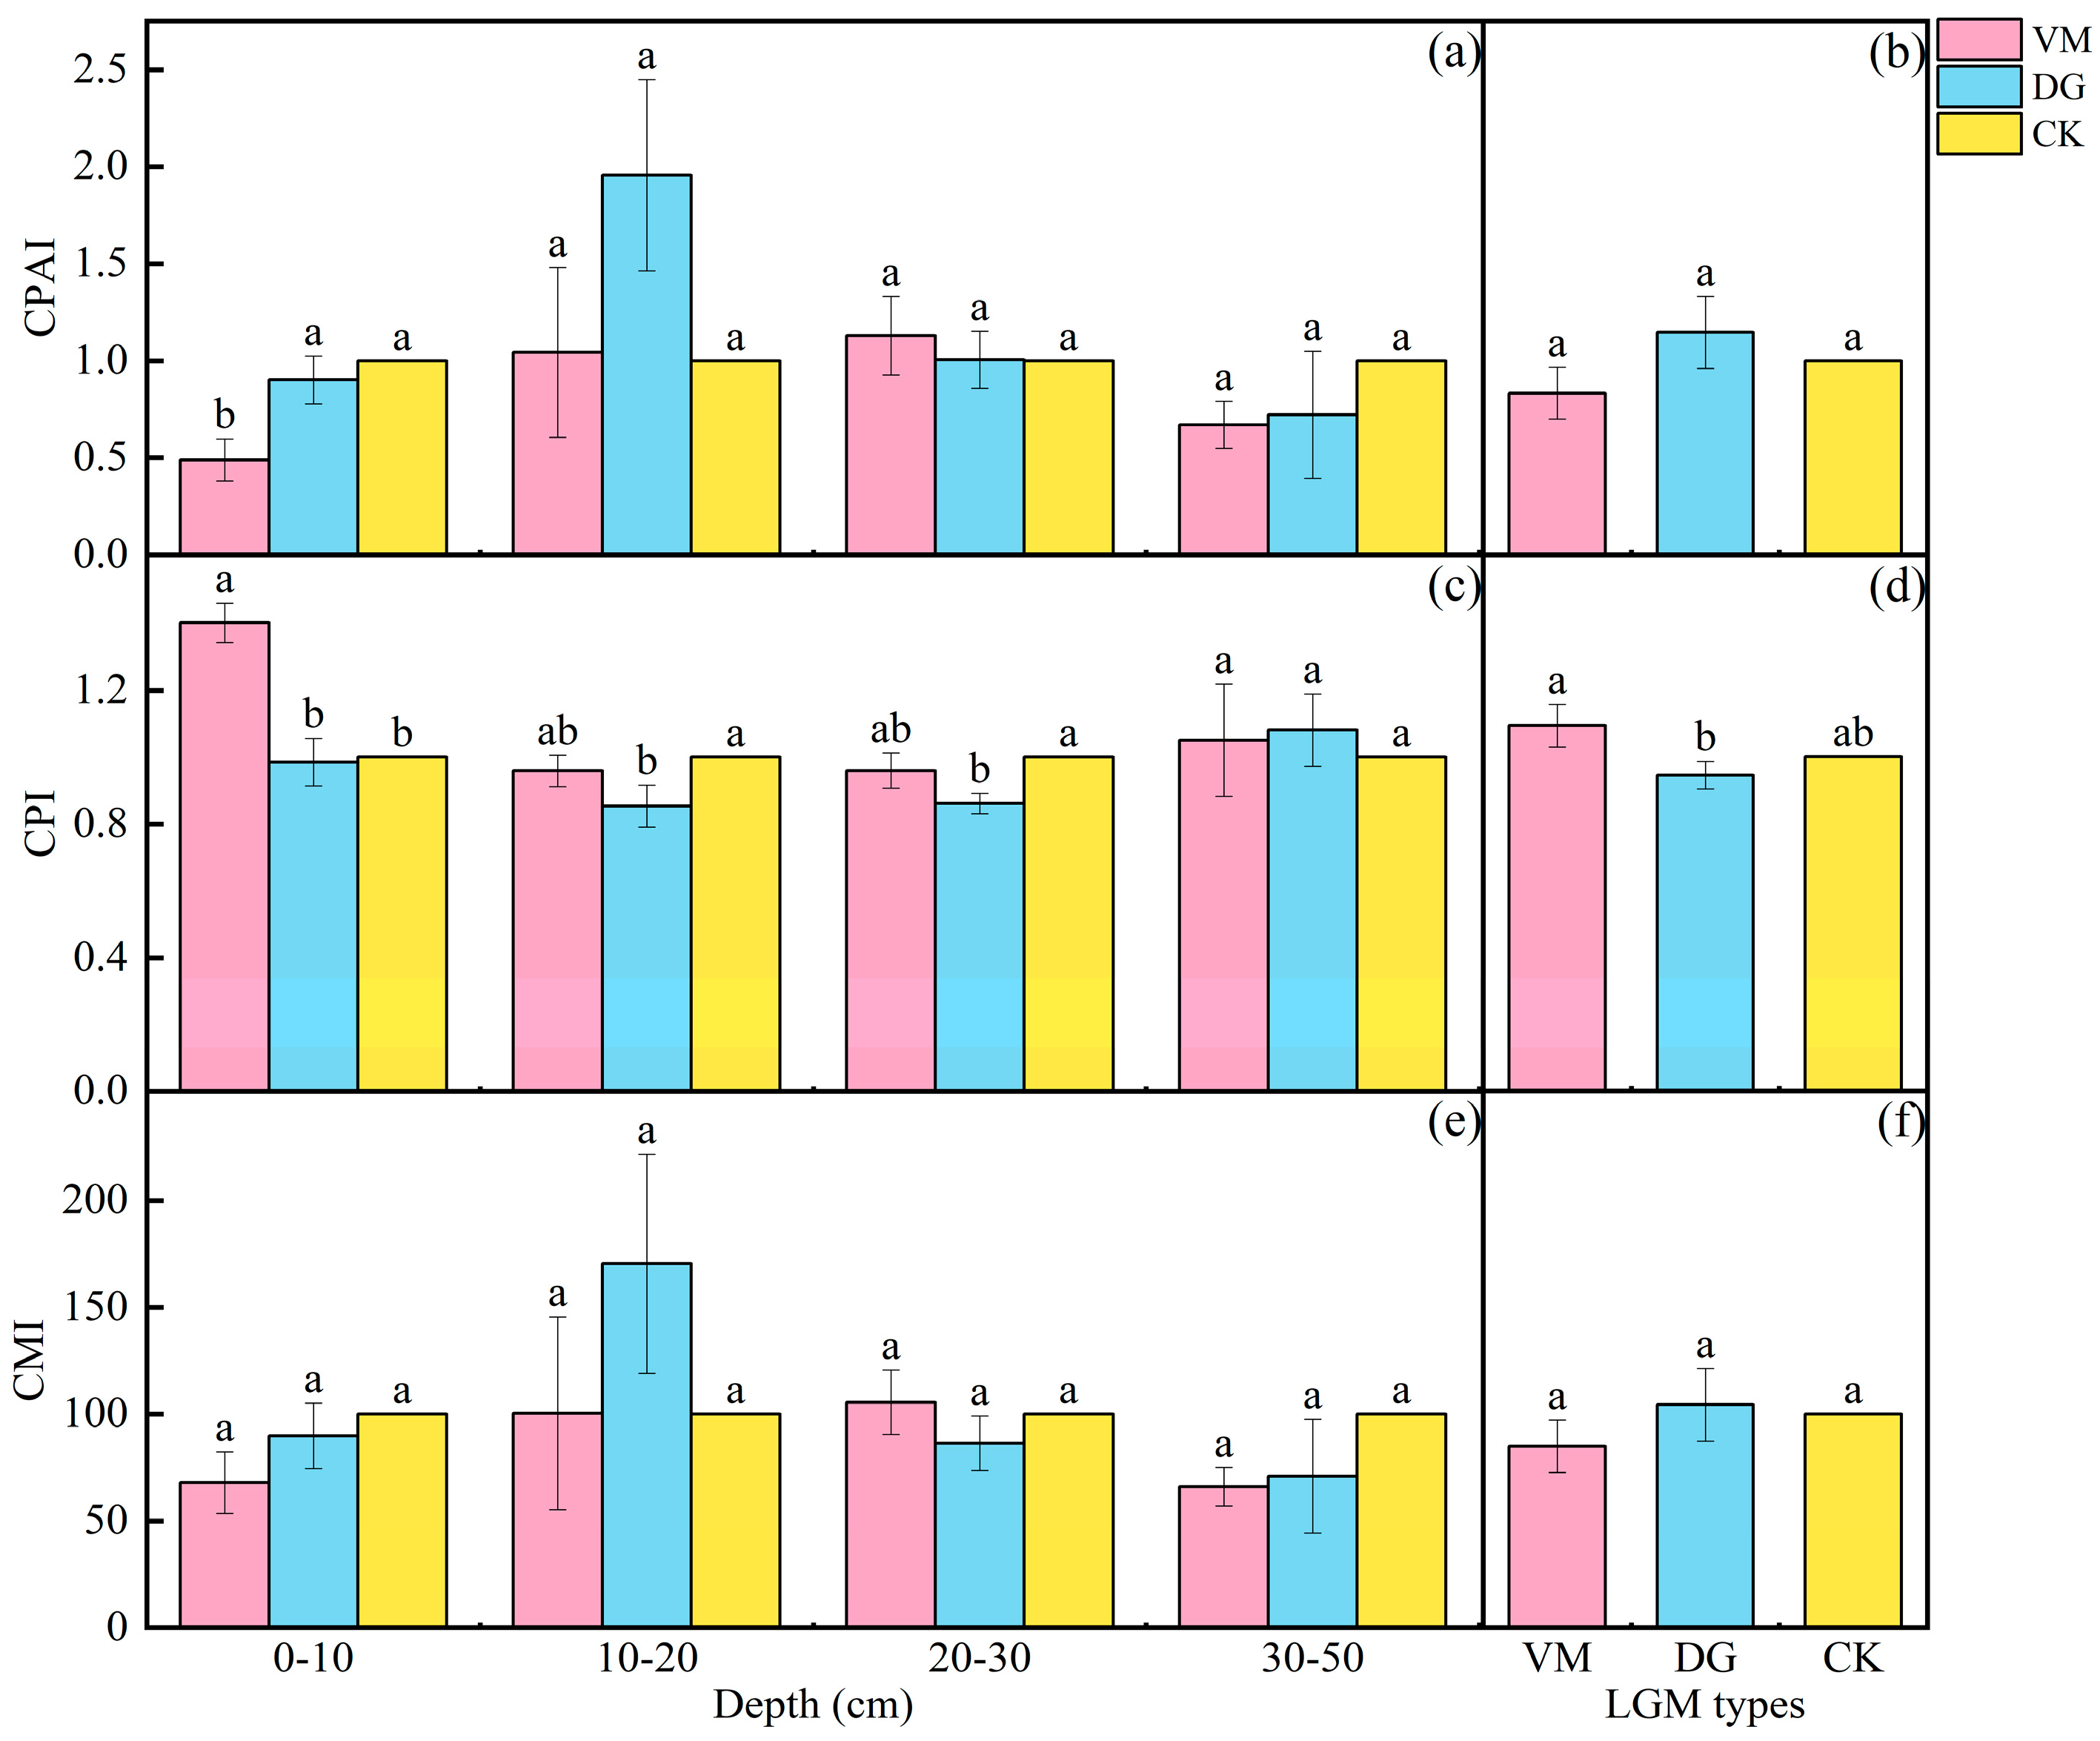
3.5. Effect of Stability of Carbon Pool in the Apple Orchard Covered with Different Species of Living Grass

The inactive organic carbon (NAOC) content and soil carbon pool activity (CPA) of apple orchard soils with different grass species are shown in Figure 6. NAOC is significantly affected by treatment, soil depth, and the interaction between the two. CPA changes significantly with treatment but not with soil depth (Table 3). In the whole soil layer, there was no significant difference in the inactive organic carbon (NAOC) between the two treatments and CK (p > 0.05), but the soil NAOC of the VM treatment was significantly higher than that of the DG treatment (p < 0.05). The NAOC and SOC of 0–10 cm soil in the surface layer were the same; that is, the NAOC of VM treatment (11.71 ± 0.71 g kg−1) was significantly higher than that of CK (6.66 ± 0.50 g kg−1) and DG treatment (6.80 ± 0.14 g kg−1, p < 0.01), and there was no significant difference between CK and DG treatment (p > 0.05). NAOC in the 10–20 cm soil layer was the lowest in the DG treatment and significantly lower than the CK and VM treatments (p < 0.05). Compared with CK, VM treatment significantly reduced soil carbon pool activity (CPA) (p < 0.01) and showed this significant difference in both the overall average and the surface soil. The difference was that there was also a significant difference in CPA between the two treatments in the surface soil (p < 0.05), but there was no significant difference between the overall average of the two treatments (p > 0.05). In the soil layer of 10–20 cm, the CPA of DG treatment was the highest and significantly higher than that of VM treatment (p < 0.05). There was no significant difference between the two treatments and CK (p > 0.05).
The carbon pool activity index (CPAI), carbon pool index (CPI), and carbon pool management index (CMI) of different treatments are shown in Figure 7 and Table 3. Among the three indexes, only CPI changed significantly due to treatment and was significantly affected by soil layer and the interaction between the two, while CPAI was only affected by soil layer depth (Table 3). Compared with the control, VM treatment significantly reduced the CPAI of orchard topsoil (p < 0.01), while DG treatment had no significant effect on the CPAI of orchard topsoil (p > 0.05), and there was a significant difference between the two treatments (p < 0.05), showing that the latter was significantly higher than the former (Figure 7a). At the same time, the two treatments had no significant effect on the CPAI of the remaining soil layers or the overall average (Figure 7b, p > 0.05). As for soil carbon pool index (CPI), VM treatment significantly increased the top soil CPI compared with CK (p < 0.01), while DG treatment had no significant effect (p > 0.05). At the same time, the CPI of orchard topsoil treated with VM was significantly higher than that treated with DG (p < 0.01). In 10–20 cm and 20–30 cm soil layers, DG treatment significantly reduced CPI (p < 0.05), while VM treatment had no significant effect (p > 0.05). There were no significant differences (p > 0.05) between treatments and CK in the 30–50 cm soil layer (Figure 7c). On average, there was no significant difference in the CPI between the treatment and CK (p > 0.05), but the CPI between the two treatments showed that the VM treatment was significantly higher than the DG treatment (Figure 7d, p < 0.05). Different grass treatments did not significantly change the soil carbon pool management index (CMI, p > 0.05, Figure 7e,f, Table 3). Between the two treatments, except for the 20–30 cm soil layer, the soil CMI of the DG treatment was higher than that of the VM treatment. Compared with CK, the CMI of the top soil in the VM and DG treatments decreased by 32.1% and 10.3%, respectively, while the CMI of the soil in the 10–20 cm soil layer increased by 0.4% and 70.4%, respectively (Figure 7e). Overall, the CMI of the VM treatment decreased by 13.2% and that of the DG treatment increased by 4.4% (Figure 7f).

4. Discussion

4.1. Effects of LMG on Soil Organic Carbon and Its Components and Stability of Carbon Pool in Apple Orchard

Living grass mulching can promote SOC sequestration by providing organic matter input and reducing SOC loss, thereby increasing the SOC content in the soil [12], and can also reduce CO2 emissions, reflecting the green environmental protection of orchard grass technology. This regulatory mechanism has been confirmed in studies and reviews of various types of orchards in different regions [6,7]. This study set up two treatments covered with different grass species (Vulpia myuros (VM) and Dactylis glomerata (DG)), in which the VM treatment significantly increased the surface SOC of apple orchards, while the surface SOC of the DG treatment did not change significantly (Figure 2a), which may be due to the increase in soil organic carbon content after grass, which is closely related to the number of years of grass, while Dactylis glomerata is a perennial herb. This is similar to the results of a meta-analysis, which found that perennial crops had a negative impact on soil organic carbon storage shortly after establishment (<5 years). Compared with monoculture and crop rotation, long-term (>10 years) perennialization has a significant positive effect on soil organic carbon storage at depths of 0–30 cm [20]. The contribution to the increase in SOC in orchards is relatively limited when this study is not carried out for a long time. According to relevant meta-analysis studies, it is found that the increase in organic carbon storage in orchards is affected by biotic and abiotic factors to varying degrees, among which the age of grass and soil clay content are the key driving factors [21]. Therefore, it is proposed that covering surface grasses with cultivated grass species for more than 12 months can effectively increase SOC storage (especially for areas with suitable rainfall and temperature conditions (MAP ≥ 400 mm, MAT ≥ 10 °C)) [21]. However, this study was carried out in a dry area, and it coincided with a dry year in 2022. The total precipitation in this year was 433.0 mm, and the soil clay content was low (the clay content in the surface soil was only about 10% in the basal state); therefore, only VM mulching treatment significantly increased the SOC content in the surface layer of the orchard.
Particulate organic carbon is a form of organic carbon that exists in soil particles. It is different from mineral-bound organic carbon (MAOC), another component of SOC. The former is dominated by plant macromolecules, has a higher C/N, and the turnover rate is faster, while the latter is the opposite, and it is mainly composed of microbial-derived components [22]. In this study, the change characteristics of particulate organic carbon are consistent with those of SOC. It is generally believed that particulate organic carbon will increase with the increase in SOC, and MAOC will tend to be saturated in this process because soil microbial biomass will be affected by competition. There are restrictions in the predation relationship, and the formation rate of organic carbon related to mineral binding will decrease with C input at this time [23]. In addition, MAOC is more likely to be limited by soil clay content, resulting in a limited increment. On the whole, it shows that the increase in SOC in this orchard is mainly contributed by particulate organic carbon, and MAOC is not easy to decompose due to mineral protection. It has higher stability [24], and the dynamic balance between accumulation and decomposition is less likely to be destroyed. The content and proportion of POC and MAOC will be different in different ecosystems or vegetation types, which is related to the adsorption of SOM by clay and silt grains in the soil. Compared with forest ecosystems, grassland ecosystems have fewer above-ground biomass components, so they lack litter, an important source of organic carbon. Soil organic carbon is mainly formed by the joint action of subsurface components (fine roots and root exudates) and microorganisms [25], thus it has a higher MAOC component. But a grass orchard is a more complex system, including deciduous woody apple trees and planted understory grassland. The content of SOC components and its relative change law need to be further studied, especially for special climate areas and orchards covered with different grass years and different grass species.
Dissolved organic carbon is a water-soluble carbon-containing organic compound with a particle size of less than 0.45 μm in soil [26]. Although its molecular weight is small and its proportion in soil organic carbon is also small, it is an important component of soil active organic carbon, and it is an organic carbon source required for the growth and reproduction of soil microorganisms and can be directly absorbed and utilized by it [27,28]. Dissolved organic carbon mainly comes from the rhythmic input of fallen objects and the subsequent turnover of soil microbial debris [29,30], hence dissolved organic carbon has a strong seasonal change response and a short turnaround time. At the same time, it is also sensitive to soil properties and land use changes [31], which can reflect the stability of SOC to a certain extent. This study is mainly about land use changes; the sampling time is consistent, there is no seasonal difference, and VM treatment significantly increased the surface soil dissolved organic carbon content, even if the accumulation of dissolved organic carbon was greater than the consumption. In addition, this study was carried out in arid areas, where precipitation has little effect on the loss of dissolved organic carbon; therefore, the impact of external carbon input on soil dissolved organic carbon is greater.
Easily oxidized organic carbon refers to the organic carbon in soil that can be oxidized by KMnO4 and has high activity. The oxidation and decomposition utilization of soil mainly relies on the action of soil microorganisms and various enzymes [16,32]. Easily oxidized organic carbon can sensitively reflect the dynamic changes in aboveground vegetation and organic carbon, and the turnover time is relatively short. Because it accounts for a large proportion of organic carbon, its change can also largely reflect the change in soil carbon pool capacity [33,34]. In this study, although the content of easily oxidized organic carbon was not significantly affected by the treatment, some indexes related to the stability of carbon pools calculated by easily oxidized organic carbon and SOC were significantly affected by the treatment, such as soil inactive organic carbon (NAOC), soil carbon pool activity (CPA), and carbon pool activity index (CPAI). The larger the CPA and CPAI, the worse the stability of the carbon pool, and the easier the organic carbon is decomposed by soil microorganisms or enzymes. In this study, VM treatment significantly reduced the CPA of the surface layer 0–10 cm, 10–20 cm, and the total, and also significantly reduced the CPAI of the surface soil, while significantly increasing the NAOC of the surface soil (Figure 6 and Figure 7), indicating that VM treatment can not only significantly increase the soil surface organic carbon content but also reduce local or overall CPA and CPAI, thereby improving the stability of the soil carbon pool. In addition, the carbon pool management index (CMI), which represents the sensitivity of soil carbon pool changes, was not significantly affected by treatment or soil depth, indicating that short-term living grass mulching will not change CMI, and longer-term experiments need to be carried out and a corresponding grass-soil carbon pool management evaluation system should be established to strengthen the understanding of carbon cycle and turnover utilization in this complex system.

4.2. Effect of LMG on Soil Nitrogen Content in an Apple Orchard

The effect of orchard grass on soil nitrogen content is not the same. For example, a 3-year study was conducted in an apple orchard in Luochuan County, Shaanxi Province, for three species of grass with a grass age. It was found that planting ryegrass (Lolium perenne L.) and small crown flowers (Coronilla varia L.) reduced the content of available nitrogen, while planting white clover (Trifolium repens L.) increased the content of available nitrogen [10].
In terms of available nitrogen, VM and DG treatments reduced soil ammonium nitrogen by 11.3% and 4.9%, respectively, compared with clear tillage, and significantly reduced soil nitrate nitrogen by 26.7% and 50.6%, respectively (Figure 3f, p < 0.05), which is similar to the conclusion of Qian et al. [10]. This study found that planting gramineous pastures reduced soil nitrogen content. The results of this study showed that under this drought condition, the competition relationship of available nitrogen between living grass mulching and trees in the orchard may be formed, especially the effect of nitrate nitrogen, which is more significant. The relationship between the specific mechanisms among the years of grass, the changes in soil microorganisms, and other biological factors remains to be further studied. Soil C/N is usually considered to reflect the mineralization capacity of soil nitrogen [35], and the level of C/N affects the content of soil available nitrogen and plant growth and productivity accumulation by affecting the use of nitrogen by soil microorganisms [36]. Judging from the C/N results, the treatment of VM increased the ratio of carbon to nitrogen in the surface soil (Figure 4a), indicating that the increased rate of surface organic carbon content in the VM treatment was higher than that of total nitrogen, and the surface available nitrogen may be due to the high C/N being limited, which corresponds to the lower nitrate nitrogen content in the treated surface compared with the control, while the ammonium nitrogen content is not limited (Figure 3c,e). The possible reason is that the impact of surface C/N changes is not only reflected in nitrate nitrogen but also in other available nitrogen components, and the specific quantitative relationship needs to be further studied. Compared with clear tillage, DG treatment made the soil C/N decrease, and the surface layer and 10–20 cm soil C/N significantly decreased (Figure 4, p < 0.05), but this reduction did not reflect the change in available nitrogen content. DG treatment made the two available nitrogen contents decrease but not increase compared with the control, indicating that the effect of DG treatment on the accumulation of the available nitrogen may not be reflected in the available nitrogen components but in other components such as the easy hydrolysis of organic nitrogen, which need to be further studied in detail.

5. Conclusions

The presence of LGM treatment in an apple orchard can significantly increase soil organic carbon content, and within a certain period of time, the effect of planting Vulpia myuros is more significant than planting Dactylis glomerata. Planting both of them increased the total nitrogen content of orchard soil, especially in the surface layer and 10–20 cm soil. Planting Vulpia myuros can significantly increase the proportion of soil organic carbon, particulate organic carbon, dissolved organic carbon content, and carbon pool index in the surface soil of apple orchards by 39.6%, 61.7%, 20.3%, and 40.3%, respectively. Simultaneously planting Vulpia myuros can reduce the easily oxidizable organic carbon content in the 0–10 cm and 10–20 cm soil layers to a certain extent, significantly increase the non-active organic carbon content in the surface soil, which can significantly reduce the carbon pool activity and carbon pool activity index of the surface soil, and improve the carbon pool stability of the apple orchard surface soil. On the other hand, planting Dactylis glomerata cover can reduce the carbon-to-nitrogen ratio of apple orchard soil and also reduce the available nitrogen content. This treatment can have a positive impact on apple orchard soil nutrients through easily hydrolyzable organic nitrogen components. Considering the soil degradation and ecological damage on the Loess Plateau, it is recommended to use LMG as a management method for apple orchards in the arid Loess Plateau areas of China.

Author Contributions

Material preparation and data collection, Q.X., L.L., J.L. and R.W.; data analysis, Q.X., T.M., X.W., and Q.Y.; data curation, Q.X. and J.M.; writing—original draft preparation, Q.X.; writing—review, J.M. and T.M. All authors have read and agreed to the published version of the manuscript.

Funding

This research was supported by Technology Innovation Guidance Program, grant number (20CX9NA105), and the Soil and Water Conservation Compensation Fee Project of Gansu Province in 2023 (Gan Shui Bao Fa [2022] No. 467).

Data Availability Statement

Data are contained within the article.

Acknowledgments

We are grateful to Juncheng Li and Houkun Chu for their assistance with the field measurements and instrumentation maintenance. We also would like to thank the editors and anonymous reviewers for their valuable comments and suggestions.

Conflicts of Interest

The authors declare no conflicts of interest.

References

  1. Ma, W.; Abdulai, A. Linking apple farmers to markets. China Agric. Econ. Rev. 2016, 8, 2–21. [Google Scholar] [CrossRef]
  2. Steinmetz, Z.; Wollmann, C.; Schaefer, M.; Buchmann, C.; David, J.; Tröger, J.; Muñoz, K.; Frör, O.; Schaumann, G.E. Plastic mulching in agriculture. Trading short-term agronomic benefits for long-term soil degradation? Sci. Total Environ. 2016, 550, 690–705. [Google Scholar] [CrossRef] [PubMed]
  3. Benbrook, C.M. The Dollars and Cents of Soil Health. In Global Soil Security; Field, D.J., Morgan, C.L.S., McBratney, A.B., Eds.; Springer International Publishing: Cham, Switzerland, 2017; pp. 219–226. [Google Scholar] [CrossRef]
  4. Chen, G.; Liu, S.; Xiang, Y.; Tang, X.; Liu, H.; Yao, B.; Luo, X. Impact of living mulch on soil C:N:P stoichiometry in orchards across China: A meta-analysis examining climatic, edaphic, and biotic dependency. Pedosphere 2020, 30, 181–189. [Google Scholar] [CrossRef]
  5. van Keulen, G. Microbiology challenges and opportunities in soil health. Microbiology 2021, 167, 001001. [Google Scholar] [CrossRef] [PubMed]
  6. Wang, Y.; Liu, L.; Hu, Y.; Zhang, J.; Jia, R.; Huang, Q.; Gao, H.; Awasthi, M.K.; Li, H.; Zhao, Z. The spatio-temporal change in soil P and P-solubilizing bacteria under clover mulching in apple orchards of Loess Plateau. Chemosphere 2022, 304, 135334. [Google Scholar] [CrossRef]
  7. Tang, W.; Yang, H.; Wang, W.; Wang, C.; Pang, Y.; Chen, D.; Hu, X. Effects of Living Grass Mulch on Soil Properties and Assessment of Soil Quality in Chinese Apple Orchards: A Meta-Analysis. Agronomy 2022, 12, 1974. [Google Scholar] [CrossRef]
  8. Griffiths, M.; Delory, B.M.; Jawahir, V.; Wong, K.M.; Bagnall, G.C.; Dowd, T.G.; Nusinow, D.A.; Miller, A.J.; Topp, C.N. Optimisation of root traits to provide enhanced ecosystem services in agricultural systems: A focus on cover crops. Plant Cell Environ. 2022, 45, 751–770. [Google Scholar] [CrossRef] [PubMed]
  9. Yao, S.; Merwin, I.A.; Bird, G.W.; Abawi, G.S.; Thies, J.E. Orchard floor management practices that maintain vegetative or biomass groundcover stimulate soil microbial activity and alter soil microbial community composition. Plant Soil 2005, 271, 377–389. [Google Scholar] [CrossRef]
  10. Qian, X.; Gu, J.; Pan, H.; Zhang, K.; Sun, W.; Wang, X.; Gao, H. Effects of living mulches on the soil nutrient contents, enzyme activities, and bacterial community diversities of apple orchard soils. Eur. J. Soil Biol. 2015, 70, 23–30. [Google Scholar] [CrossRef]
  11. Hill, N.S.; Levi, M.; Basinger, N.; Thompson, A.; Cabrera, M.; Wallace, J.; Saikawa, E.; Avramov, A.; Mullican, J. White clover living mulch enhances soil health vs. annual cover crops. Agron. J. 2021, 113, 3697–3707. [Google Scholar] [CrossRef]
  12. Paustian, K.; Lehmann, J.; Ogle, S.; Reay, D.; Robertson, G.P.; Smith, P. Climate-smart soils. Nature 2016, 532, 49–57. [Google Scholar] [CrossRef]
  13. Bhaskar, V.; Westbrook, A.S.; Bellinder, R.R.; DiTommaso, A. Integrated management of living mulches for weed control: A review. Weed Technol. 2021, 35, 856–868. [Google Scholar] [CrossRef]
  14. Bao, S.D. Soil and Agricultural Chemistry Analysis; China Agricultural Press: Beijing, China, 2000; pp. 355–356. [Google Scholar]
  15. Deflandre, B.; Gagné, J.P. Estimation of dissolved organic carbon (DOC) concentrations in nanoliter samples using UV spectroscopy. Water Res. 2001, 35, 3057–3062. [Google Scholar] [CrossRef]
  16. Blair, G.J.; Lefroy, R.; Lise, L. Soil Carbon Fractions Based on their Degree of Oxidation, and the Development of a Carbon Management Index for Agricultural Systems. Aust. J. Agric. Res. 1995, 46, 1459–1466. [Google Scholar] [CrossRef]
  17. Cambardella, C.A.; Elliott, E.T. Particulate Soil Organic-Matter Changes across a Grassland Cultivation Sequence. Soil Sci. Soc. Am. J. 1992, 56, 777–783. [Google Scholar] [CrossRef]
  18. Six, J.; Paustian, K.; Elliott, E.T.; Combrink, C. Soil structure and organic matter: I. Distribution of aggregate-size classes and aggregate-associated carbon. Soil Sci. Soc. Am. J. 2000, 64, 681–689. [Google Scholar] [CrossRef]
  19. Andrews, S.S.; Karlen, D.L.; Cambardella, C.A. The soil management assessment framework: A quantitative soil quality evaluation method. Soil Sci. Soc. Am. J. 2004, 68, 1945–1962. [Google Scholar] [CrossRef]
  20. Siddique, I.A.; Grados, D.; Chen, J.; Lærke, P.E.; Jørgensen, U. Soil organic carbon stock change following perennialization: A meta-analysis. Agron. Sustain. Dev. 2023, 43, 58. [Google Scholar] [CrossRef]
  21. Xiang, Y.; Li, Y.; Liu, Y.; Zhang, S.; Yue, X.; Yao, B.; Xue, J.; Lv, W.; Zhang, L.; Xu, X.; et al. Factors shaping soil organic carbon stocks in grass covered orchards across China: A meta-analysis. Sci. Total Environ. 2022, 807, 150632. [Google Scholar] [CrossRef]
  22. Lavallee, J.M.; Soong, J.L.; Cotrufo, M.F. Conceptualizing soil organic matter into particulate and mineral-associated forms to address global change in the 21st century. Glob. Chang. Biol. 2020, 26, 261–273. [Google Scholar] [CrossRef]
  23. Craig, M.E.; Mayes, M.A.; Sulman, B.N.; Walker, A.P. Biological mechanisms may contribute to soil carbon saturation patterns. Glob. Chang. Biol. 2021, 27, 2633–2644. [Google Scholar] [CrossRef]
  24. Ashagrie, Y.; Zech, W.; Guggenberger, G.; Mamo, T. Soil aggregation, and total and particulate organic matter following conversion of native forests to continuous cultivation in Ethiopia. Soil Tillage Res. 2007, 94, 101–108. [Google Scholar] [CrossRef]
  25. Sokol, N.W.; Sanderman, J.; Bradford, M.A. Pathways of mineral-associated soil organic matter formation: Integrating the role of plant carbon source, chemistry, and point of entry. Glob. Chang. Biol. 2019, 25, 12–24. [Google Scholar] [CrossRef] [PubMed]
  26. Kalbitz, K.; Solinger, S.; Park, J.H.; Michalzik, B.; Matzner, E. Controls on the dynamics of dissolved organic matter in soils: A review. Soil Sci. 2000, 165, 277–304. [Google Scholar] [CrossRef]
  27. McDowell, W.H.; Zsolnay, A.; Aitkenhead-Peterson, J.A.; Gregorich, E.G.; Jones, D.L.; Joedemann, D.; Kalbitz, K.; Marschner, B.; Schwesig, D. A comparison of methods to determine the biodegradable dissolved organic carbon from different terrestrial sources. Soil Biol. Biochem. 2006, 38, 1933–1942. [Google Scholar] [CrossRef]
  28. Nelson, P.N.; Dictor, M.C.; Soulas, G. Availability of organic carbon in soluble and particle-size fractions from a soil profile. Soil Biol. Biochem. 1994, 26, 1549–1555. [Google Scholar] [CrossRef]
  29. Zsolnay, A. Dissolved organic matter: Artefacts, definitions, and functions. Geoderma 2003, 113, 187–209. [Google Scholar] [CrossRef]
  30. Whalen, J.K.; Parmelee, R.; McCartney, D.A.; Vanarsdale, J.L. Movement of N from decomposing earthworm tissue to soil, microbial and plant N pools. Soil Biol. Biochem. 1999, 31, 487–492. [Google Scholar] [CrossRef]
  31. Bu, X.; Ding, J.; Wang, L.; Yu, X.; Huang, W.; Ruan, H. Biodegradation and chemical characteristics of hot-water extractable organic matter from soils under four different vegetation types in the Wuyi Mountains, southeastern China. Eur. J. Soil Biol. 2011, 47, 102–107. [Google Scholar] [CrossRef]
  32. Yang, X.; Meng, J.; Lan, Y.; Chen, W.; Yang, T.; Yuan, J.; Liu, S.; Han, J. Effects of maize stover and its biochar on soil CO2 emissions and labile organic carbon fractions in Northeast China. Agric. Ecosyst. Environ. 2017, 240, 24–31. [Google Scholar] [CrossRef]
  33. Chen, X.; Chen, H.Y.H.; Chen, X.; Wang, J.; Chen, B.; Wang, D.; Guan, Q. Soil labile organic carbon and carbon-cycle enzyme activities under different thinning intensities in Chinese fir plantations. Appl. Soil Ecol. 2016, 107, 162–169. [Google Scholar] [CrossRef]
  34. Biederbeck, V.O.; Janzen, H.H.; Campbell, C.A.; Zentner, R.P. Labile soil organic matter as influenced by cropping practices in an arid environment. Soil Biol. Biochem. 1994, 26, 1647–1656. [Google Scholar] [CrossRef]
  35. Priess, J.A.; de Koning, G.H.J.; Veldkamp, A. Assessment of interactions between land use change and carbon and nutrient fluxes in Ecuador. Agric. Ecosyst. Environ. 2001, 85, 269–279. [Google Scholar] [CrossRef]
  36. Näsholm, T.; Ekblad, A.; Nordin, A.; Giesler, R.; Högberg, M.; Högberg, P. Boreal forest plants take up organic nitrogen. Nature 1998, 392, 914–916. [Google Scholar] [CrossRef]
Figure 1. Daily precipitation and air temperature at the experimental site in 2022.
Agronomy 14 01917 g001
Figure 2. Contents of soil organic carbon and its components in the apple orchard covered with different species of living grass. Layered content of soil organic carbon (SOC) (a), particulate organic carbon (POC) (c), dissolved organic carbon (DOC) (e), easily oxidizable organic carbon (EOC) (g). Differences in SOC (b), POC (d), DOC (f), EOC (h) among treatments (The average values of various indicators in four soil layers). Different letters represent significant difference at p < 0.05.
Agronomy 14 01917 g002
Figure 3. Soil nitrogen content in the apple orchard covered with different species of living grass. Layered content of total nitrogen (TN) (a), ammonium nitrogen (NH+4-N) (c), Nitrate nitrogen (NO3-N) (e). Differences in TN (b), NH+4-N (d), NO3-N (f) among treatments (The average values of various indicators in four soil layers). Different letters represent significant difference at p < 0.05.
Agronomy 14 01917 g003
Figure 4. Soil carbon to nitrogen ratio of the apple orchard covered with different species of living grass. (a) Soil carbon nitrogen ratio (C/N) in different soil layers. (b) Differences in C/N among treatments (The average values of C/N in four soil layers). Different letters represent significant difference at p < 0.05.
Agronomy 14 01917 g004
Figure 5. Soil pH of the apple orchard covered with different species of living grass. (a) Soil pH in different soil layers. (b) Differences in soil pH among treatments (The average values of soil pH in four soil layers). Different letters represent significant difference at p < 0.05.
Agronomy 14 01917 g005
Figure 6. Inactive organic carbon (NAOC) and soil carbon pool activity (CPA) in the apple orchard covered with different species of living grass. Soil NAOC (a) and CPA (c) in different soil layers. Differences in soil NAOC (b) and CPA (d) among treatments (The average values of various indicators in four soil layers). Different letters represent significant difference at p < 0.05.
Agronomy 14 01917 g006
Figure 7. Soil carbon pool activity index (CPAI), carbon pool index (CPI), and carbon pool management index (CMI) of the apple orchard soil covered with different species of living grass. Soil CPAI (a), CPI (c) and CMI (e) in different soil layers. Differences in soil CPAI (b), CPI (d) and CMI (f) among treatments (The average values of various indicators in four soil layers). Different letters represent significant difference at p < 0.05.
Agronomy 14 01917 g007
Table 1. Variance analysis of the effects of living grass mulching treatment and soil depth on soil organic carbon and its components in the apple orchard.
Source of VariationSOCPOCDOCEOC
FPFPFPFP
T18.347***12.897***1.603NS2.9^
D153.697***73.29***11.927***104.26***
T × D12.392***4.999***1.125NS3.043**
Note: ** and *** indicate significant differences at 0.01, and 0.001 levels, respectively; ^ indicates significant differences <0.1 but >0.05; NS indicates no significant differences. T stands for living grass mulching treatment, and D stands for soil depth.
Table 2. Variance analysis of effects of living grass mulching treatment and soil depth on soil nitrogen composition, carbon to nitrogen ratio, and pH of apple orchard soil.
Source of VariationC/NTN NO 3 - N NH 4 + - N pH
F P F P F P F P F P
T4.132*3.312*4.016*0.186NS0.635NS
D13.009***51.401***1.281NS1.048NS20.06***
T × D2.263^3.487**0.405NS0.954NS0.469NS
Note: *, ** and *** indicate significant differences at 0.05, 0.01 and 0.001 levels, respectively; ^ indicates significant differences <0.1 but >0.05; NS indicates no significant differences. T stands for living grass mulching treatment and D stands for soil depth.
Table 3. Variance analysis of effects of living grass mulching treatment and soil depth on soil carbon pool stability in apple orchards.
Source of VariationNAOCCPACPAICPICMI
FPFPFPFPFP
T17.333***4.635*1.826NS4.594*0.79NS
D59.889***0.479NS3.629*5.231**2.199NS
T × D11.398***2.532*1.881NS3.162*1.227NS
Note: *, ** and *** indicate significant differences at 0.05, 0.01 and 0.001 levels, respectively; NS indicates no significant differences. T stands for living grass mulching treatment and D stands for soil depth.
Disclaimer/Publisher’s Note: The statements, opinions and data contained in all publications are solely those of the individual author(s) and contributor(s) and not of MDPI and/or the editor(s). MDPI and/or the editor(s) disclaim responsibility for any injury to people or property resulting from any ideas, methods, instructions or products referred to in the content.

