Article

Preparation, Characterization, and Testing of Compost Tea Derived from Seaweed and Fish Residues

by
Andrei Moț
1,
Oana Cristina Pârvulescu
2,*,
Violeta Alexandra Ion
1,*,
Ailin Moloșag
1,
Aurora Dobrin
1,
Liliana Bădulescu
1,
Cristina Orbeci
2,
Diana Egri
2,
Tănase Dobre
2,
Anne-Kristin Løes
3,
Joshua Cabell
3,
Athanasios Salifoglou
4,
Sevasti Matsia
4,
Carlos Octavio Letelier-Gordo
5,
Cristian Răducanu
2 and
Alexandra Mocanu
2,6
1
Research Center for Studies of Food and Agricultural Products Quality, University of Agronomic Sciences and Veterinary Medicine of Bucharest, 59 Marasti Blvd., 011464 Bucharest, Romania
2
Faculty of Chemical Engineering and Biotechnologies, National University of Science and Technology POLITEHNICA Bucharest, 1–7 Gheorghe Polizu St., 011061 Bucharest, Romania
3
Norwegian Centre for Organic Agriculture, Gunnarsveg 6, NO-6630 Tingvoll, Norway
4
School of Chemical Engineering, Aristotle University of Thessaloniki, Corner of September 3rd and Egnatia St., 54124 Thessaloniki, Greece
5
National Institute of Aquatic Resources, DTU Aqua, Section for Aquaculture, Technical University of Denmark, 9850 Hirtshals, Denmark
6
National Institute for Research and Development in Microtechnologies—IMT Bucharest, 126A Erou Iancu Nicolae Street, 077190 Voluntari, Romania
*
Authors to whom correspondence should be addressed.
Agronomy 2024, 14(9), 1919; https://doi.org/10.3390/agronomy14091919
Submission received: 8 August 2024 / Revised: 23 August 2024 / Accepted: 24 August 2024 / Published: 27 August 2024

Abstract

:
Non-aerated compost tea (CT) was prepared from compost derived from rockweed (Ascophyllum nodosum) and fish (cod, common ling, haddock, saithe) residues that fermented in water. Electrical conductivity, pH, concentrations of dry matter, ash, C, macronutrients (N, P, K, Ca, and Mg), and micronutrients (Cu, Fe, Mn, Mo, and Zn) of CT prepared under different fermentation conditions were measured. The effects of process factors, i.e., water/compost mass ratio (4.2–9.8 g/g) and fermentation time (4.2–9.8 days = 100–236 h), on the physicochemical properties of CT were quantified using quadratic polynomial models. CT obtained at optimal levels of process factors (4.2 g/g and 5.6 days = 134 h) was tested for lettuce seed germination and seedling growth. Diluted CT (25% CT + 75% ultrapure water) improved seedling growth while achieving a high germination percentage (97%).

1. Introduction

Compost tea (CT) is a fermented compost extract, rich in nutrients, organic molecules (humic acids, amino acids, phytohormones), and microorganisms (bacteria, fungi, protozoa), which can be beneficial to plants and used as a nutrient source and/or disease suppressor [1,2,3,4]. It is either aerated, prepared from a compost–water slurry that has been aerated during the fermentation, or non-aerated, derived from a slurry that has not been aerated or received minimal aeration [1,5,6,7,8,9,10].
The potential of CT to improve plant growth and health depends on various factors, e.g., compost feedstocks and age, fermentation conditions (aeration, water/compost ratio, duration, temperature, pH, nutrient additives), application technology (undiluted/diluted, to roots or/and leaves, equipment, timing, rate, adjuvants, specific microbial antagonists), and type of plant. Compost feedstocks used to prepare CT are typically agro-industrial, municipal, and landscape residues [3,7,8,11,12]. The age of the compost is recommended to be between 2 and 12 months [3,8,9,13,14]. A mature compost typically releases higher amounts of soluble mineral nutrients and lower amounts of phytotoxic organic acids and heavy metals than an immature compost [3]. The levels of water (liquid)/compost (solid) ratio (RLS) and fermentation time (t) are usually as follows: RLS = 3–10 g/g for both aerated CT and non-aerated CT, t = 1–7 days for aerated CT, and t = 3–21 days for non-aerated CT [2,4,7,8,13,15,16]. The compost fermentation is commonly performed at 15–25 °C [5,7,8,9,10,14]. Nutrient additives, e.g., molasses, glucose, sucrose, fish or kelp powder/slurry, yeast powder/extract, plant extracts, humic materials, and rock dust, can be added at the beginning or during fermentation process [1,6,7,8,16,17,18,19].
Numerous studies have reported positive effects of CTs on seed germination as well as on growth, development, and nutrient contents of different seedlings/plants, e.g., baby spinach [20], bean [2], chickpea [2], cowpea [21], cucumber [4,18], kohlrabi [11], lentil [17], lettuce [11,22,23], okra [24], pak choi [3,6], pea [2], pepper [15,25,26], potato [27,28], sweet corn [23], and tomato [12,18,22,29,30,31]. These beneficial effects of CTs are mainly due to their contents of mineral nutrients (especially N, P, K, Ca, Mg, Cu, Fe, Mn, Mo, and Zn), phytohormones (including auxins, cytokinins, gibberellins, abscisic acid and its metabolites), humic and fulvic acids, as well as to the presence of useful microorganisms [1,3,6,8,11,22,23,26,29].
There is debate about the necessity of aeration during CT preparation [5,7,8,10]. Preparation of aerated CT involves a shorter production time, whereas obtaining non-aerated CT is associated with lower energy consumption and cost [7,8,10]. Ingham (2005) [1] recommended aerated CT, but several other researchers concluded that, for a sufficiently long fermentation time (around 7 days), the effects of non-aerated CT on plant growth and health were similar or better than those of aerated CT [6,8,9].
Marín et al. [15] prepared aerated and non-aerated CTs from spent mushroom compost (SMC), grape marc compost (GMC), crop residue compost (CRC), and crop residue vermicompost (CRV). Fermentation tests were performed at 20 °C, t = 5 days, and RLS = 3–4 g/g. The effects of aerated and non-aerated CTs diluted at 1/5 in water on the growth of pepper (Capsicum annuum L.) seedlings were evaluated. Except for aerated CT from CRC, the mean values of the number of leaves (NL), dry masses of root (RDM), stem (SDM), leaf (LDM), and whole plant (PDM) were higher for treatments with aerated and non-aerated CTs than for the control treatment. Compared to the control treatment, the mean values of PDM were significantly higher for pepper plants treated with non-aerated CT from SMC, GMC, or CRV, and aerated CT from SMC. The mean values of relevant plant growth parameters, e.g., RDM, SDM, LDM, PDM, NL, leaf area, stem length, and stem base diameter, were generally higher for the treatment with non-aerated CT from SMC than for the other treatments.
Jarboui et al. [2] prepared non-aerated CT by fermenting compost from food waste (mainly fruits and vegetables) at 25 °C, RLS = 8 g/g, and t = 7 days, using glucose as a nutrient additive. Diluted CT (1/8 in distilled water) applied to the roots improved the height, root diameter, and NL of bean (Vicia faba L.), chickpea (Cicer arietinum L.), and pea (Pisum sativum L.) seedlings.
Many studies have reported that non-aerated CT can prevent/control various diseases (including early/late/leaf blight, grey mold, apple scab, bacterial spot, damping-off, and powdery/downy mildew) of edible and ornamental crops, e.g., apple, cucumber, grape, lettuce, pepper, potato, strawberry, sugar beet, tomato, winter barley, geranium, and rose [5,7,8,9,10,14,32,33].
The marine sector produces significant amounts of materials that are still underutilized. Bone-rich residues from captured fish, which cannot be used for food or feed purposes, can be processed to obtain fertilizers, due to their high concentrations of macronutrients, especially N, P, and Ca [34,35,36,37]. Seaweed residues from extraction processes and seaweed deposited on beaches, which are rich in K, micronutrients, and growth activators, e.g., auxins, cytokines, are valuable sources of soil amendments, fertilizers, and biostimulants [35]. Well-balanced fertilizers for crop plants can be designed by composting seaweed and fish residual materials [35,36]. The application of marine waste-based compost and its derived CT as soil amendments/fertilizers/biostimulants to horticultural crops deserves further attention.
In the present study, non-aerated CT was produced from composted industrial seaweed and fish residues. Relevant fermentation factors (i.e., water/compost mass ratio and fermentation time) were optimized, and CT obtained under optimal conditions was tested for germination of lettuce seeds and subsequent growth of lettuce seedlings. To our knowledge, there have been no published papers on the production and application of CT derived from marine residue-based compost. Therefore, the main novelty of this study is the utilization of seaweed and fish residues for the production of fertilizers/biostimulants for application in sustainable agriculture. These marine residues are currently underutilized and sometimes discarded, thus causing environmental concerns and loss of valuable nutrients and organic matter for soil/plants.

2. Materials and Methods

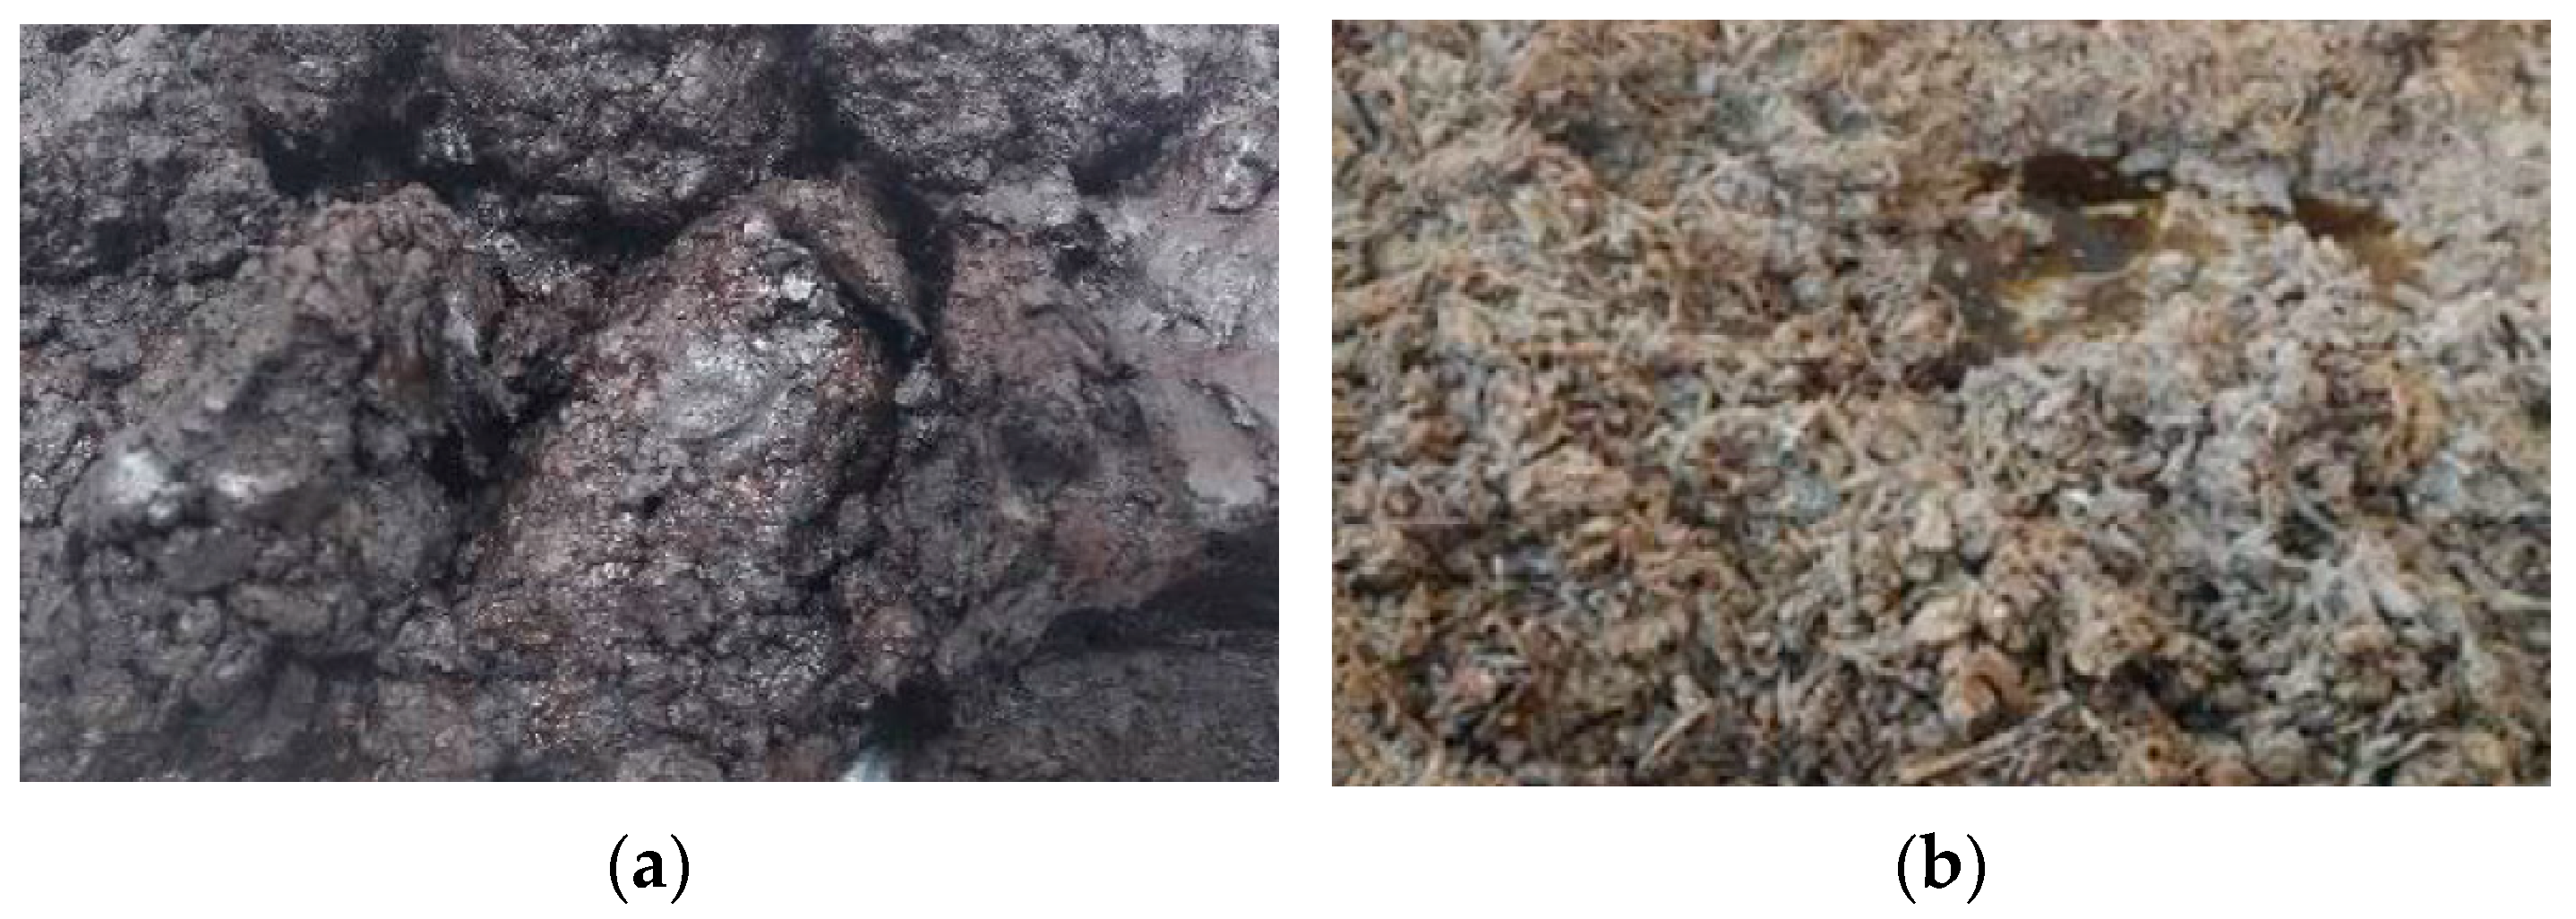
2.1. Marine Residues

In the composting step, seaweed and fish residual materials from the Norwegian industry were applied. Chemical extraction of dried and ground rockweed (Ascophyllum nodosum) to produce biostimulants resulted in a residual filter cake. This rockweed filter cake was a black paste with a content of dry matter (DM) of 25–30% [38,39]. The filter cake was mixed with residual material from the fish industry processing cod and similar fish species for the clipfish. Fish residues such as heads, skin, intestines, and backbones are commonly ground, acidified to pH < 4, and hydrolyzed in a tank. The upper layers of oil and soluble proteins were pumped out and applied as aquaculture feed. For the bone-rich sediment at the bottom of the hydrolysis tank (DM ≈ 50%), a sustainable application is still lacking. This acidified fish sediment was dried and then applied to produce compost. Fresh rockweed and fish residues are shown in Figure 1.

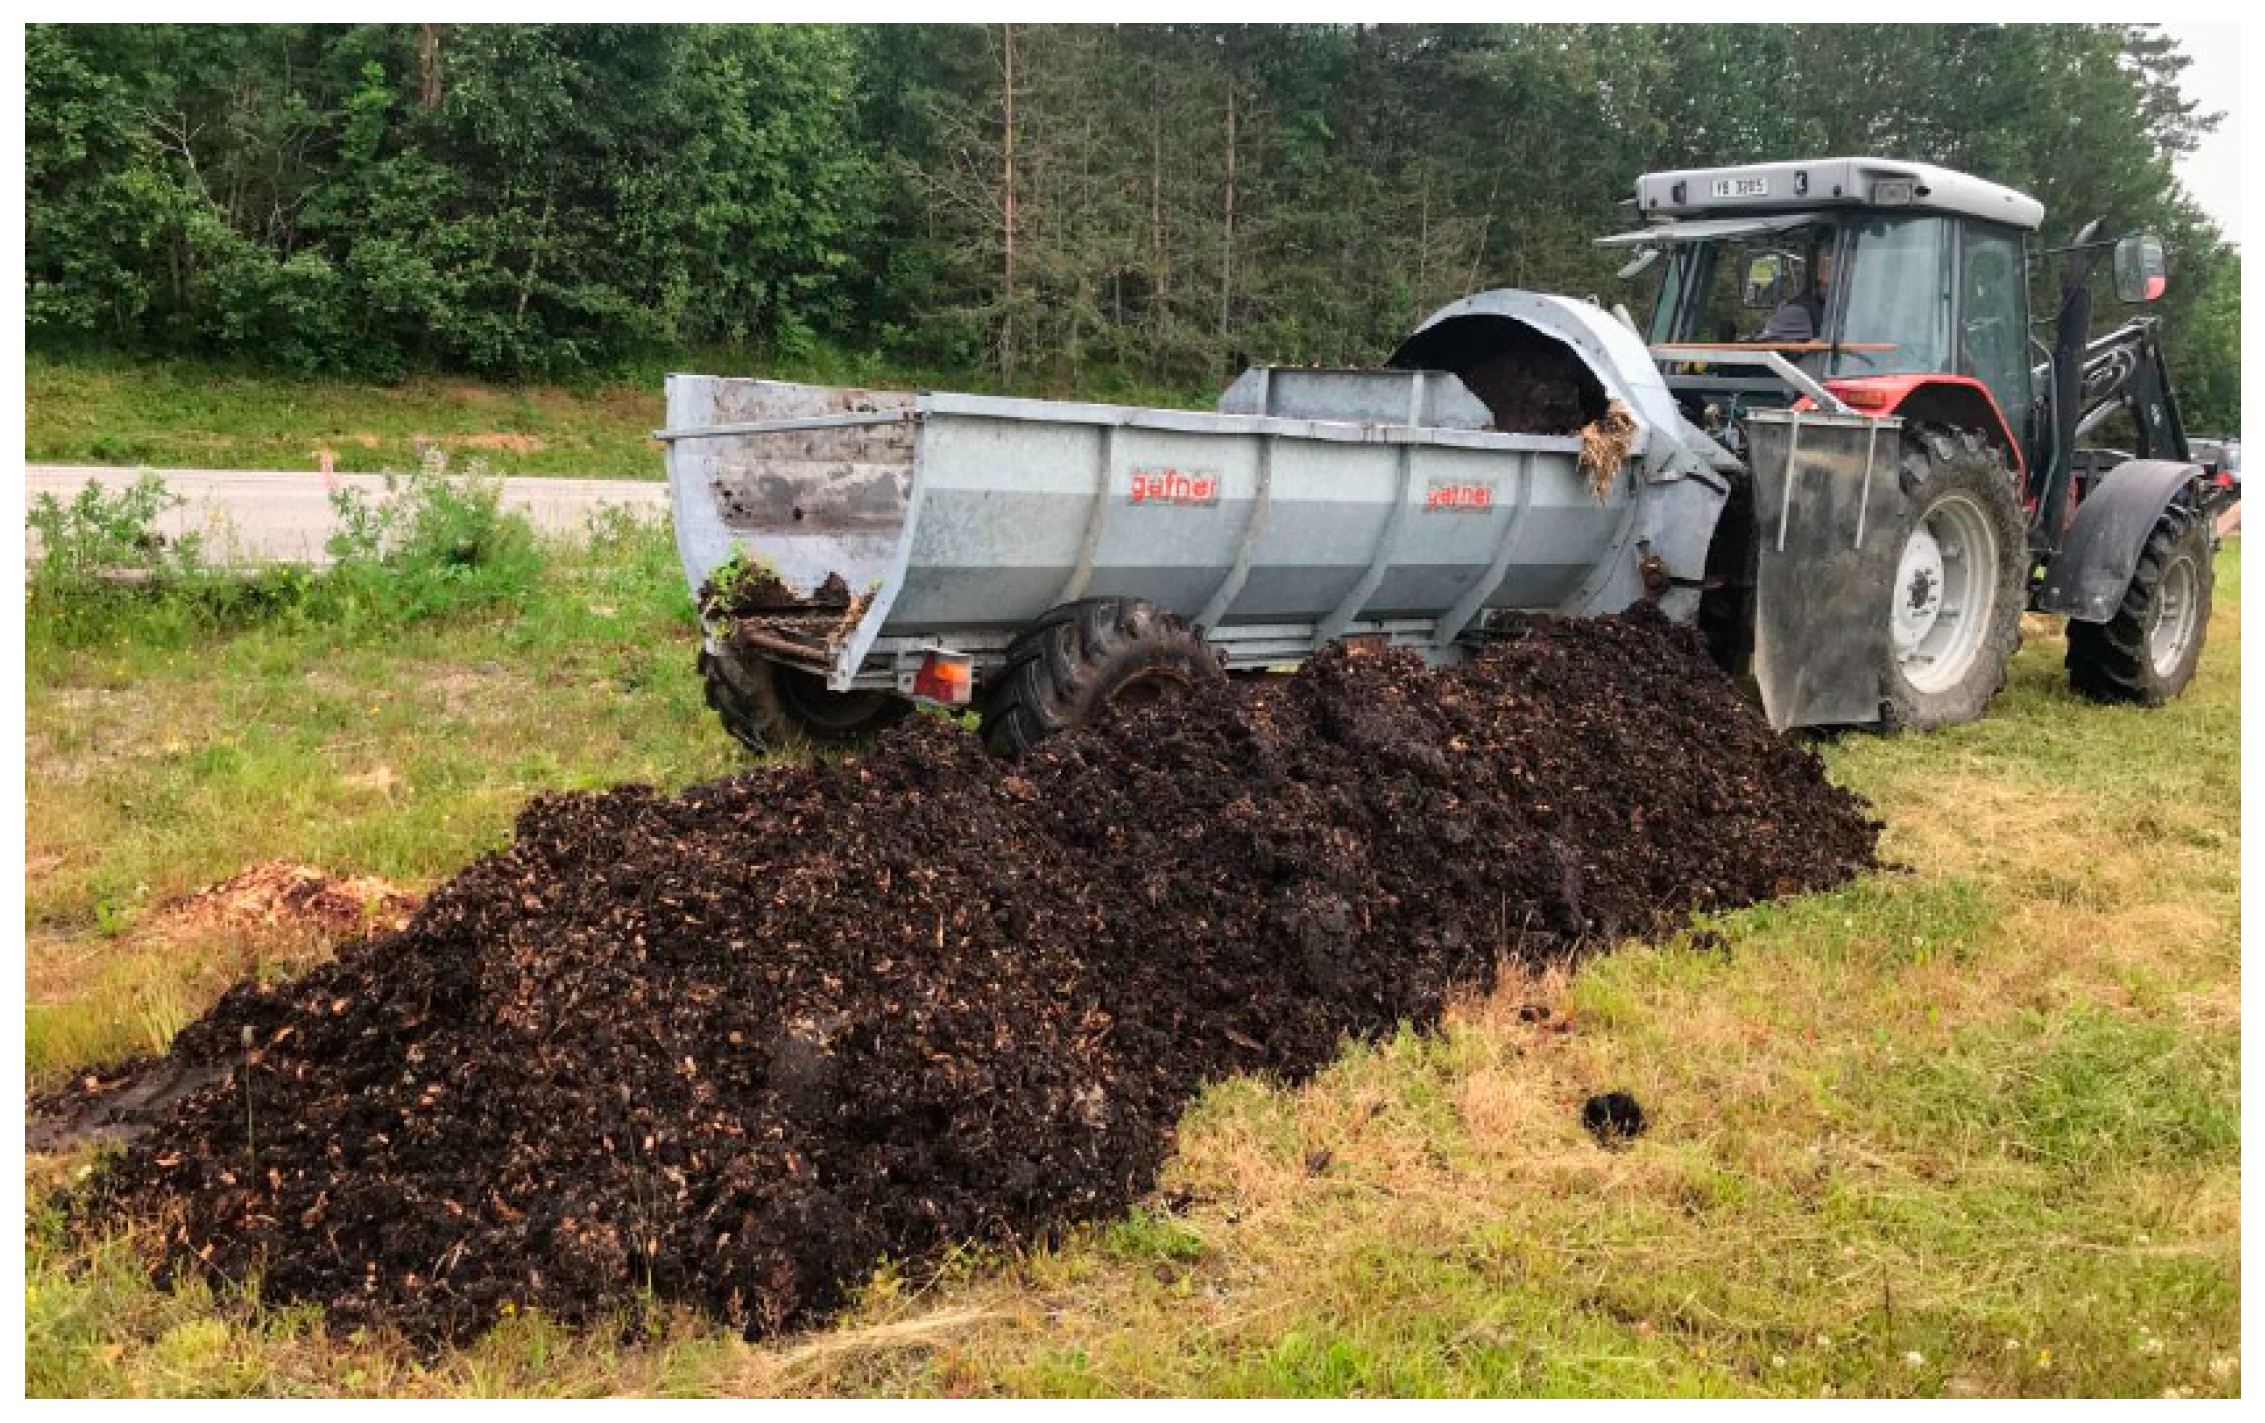
2.2. Compost Preparation

The compost was obtained by windrow composting of marine and non-marine residues according to a procedure described in previous reports [38,39]. The following volume percentages of residual materials were used: 40.8% rockweed filter cake, 9.2% acidified fish sediment, 39.5% woodchips, 6.6% cattle bedding, and 3.9% horse manure. A windrow consisting of marine residual materials, woodchips, cattle bedding, and horse manure is shown in Figure 2.

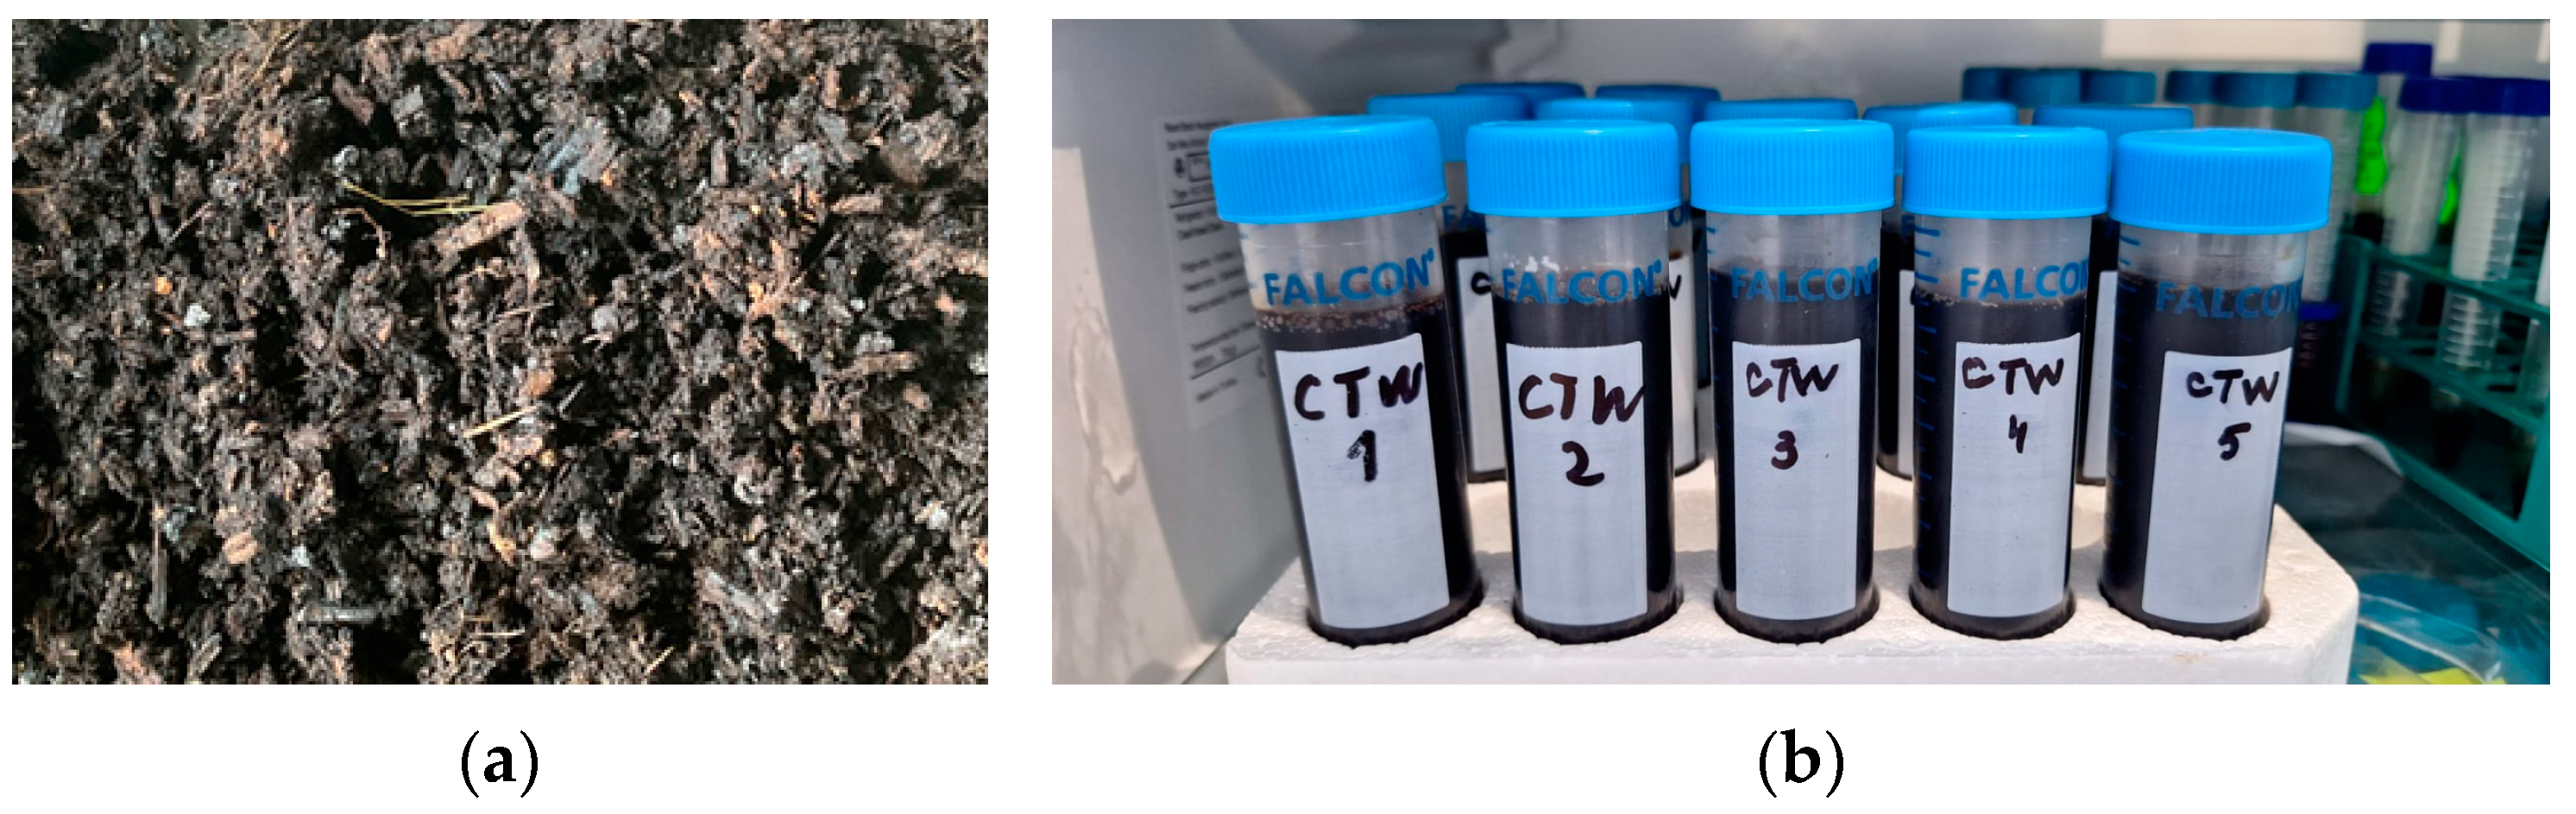
2.3. Compost Tea Preparation

Non-aerated CT was prepared by fermenting the compost derived from marine residues (10-month age) in demineralized water under different operation conditions. Liquid/solid mass ratio (RLS = 4.2–9.8 g/g) and fermentation time (t = 4.2–9.8 days) were selected as process independent variables (factors). Based on a Central Composite Design (CCD) with 2 factors and 4 center point runs, 12 experimental runs were conducted at 5 levels of process factors [40]. The levels of dimensional and dimensionless factors for each experimental run are specified in Table 1, where the dimensionless factors (X1 and X2) were calculated using Equations (1) and (2) [40]. The mixture of compost and water was stirred once at the beginning of the fermentation process and then left in the dark at 25 °C. At the end of each experimental run, the slurry was filtered through a 0.020 mm sieve and the filtrate (CT) was analyzed. Images of the compost derived from marine residues and corresponding non-aerated CT are shown in Figure 3.
X 1 = R L S 7 2
X 2 = t 7 2

2.4. Compost Tea Analysis

Non-aerated CT obtained in each experimental run (Table 1) was analyzed in terms of electrical conductivity (EC), pH, concentrations of dry matter (DM), ash (Ash), carbon (C), macronutrients, and micronutrients. Analysis methods were detailed in previous papers [37,41,42,43]. EC and pH were measured using a Mettler Toledo SevenExcellence pH/Conductivity Meter S470 (Mettler Toledo, Columbus, OH, USA). DM and Ash were determined using a Memmert UN110 oven (Memmert GmbH, Schwabach, Germany) and a Nabertherm B150 oven (Nabertherm GmbH, Lilienthal, Germany), respectively. The percentages of carbon (C) and nitrogen (N) were measured using an EA3100 Elemental Analyzer (Eurovector SRL, Pavia, PV, Italy). Concentrations of phosphorus, potassium, calcium, magnesium, copper, iron, manganese, molybdenum, and zinc (P, K, Ca, Mg, Cu, Fe, Mn, Mo, and Zn) were determined after digestion with nitric acid and hydrogen peroxide (4/1 L/L), using an Agilent 7700 Series ICP-MS (Agilent Technologies, Santa Clara, CA, USA). All measurements were performed in triplicate.

2.5. Compost Tea Testing

Non-aerated CT was tested for lettuce seed germination and seedling growth. Before the tests, lettuce (Lactuca sativa L. var. crispa cv. ‘Lollo Rosso‘) seeds were subjected to a thorough disinfection process using a 1% NaClO solution for 20 min, followed by rinsing with ultrapure water. Four treatments were applied: (T0) 100% ultrapure water (control); (T1) 25% CT + 75% ultrapure water; (T2) 50% CT + 50% ultrapure water; (T3) 100% CT. Each treatment was replicated 4 times (A, B, C, and D replicates), using 50 seeds per replicate (200 seeds per treatment). Two Petri dishes (19 cm diameter, 5 cm height) were used for each treatment, with two replicates per dish (A and B in a dish, C and D in the other dish), as shown in Figure 4. In Petri dishes, the seeds were placed evenly on moistened filter paper, 100 seeds in each dish. The same volume of diluted or non-diluted CT was used to wet the filter papers in each dish. The progress of seed germination and seedling growth was observed for 10 days in a controlled climate chamber maintained at 20 °C, with alternating light cycles mimicking natural conditions. The seeds were considered germinated when the radicle emerged from the seed coat and reached a length of 2 mm [44].
The following parameters were used to characterize the germination process and seedling growth (10 days after sowing): germination percentage (GP), mean germination time (MGT), germination speed (GS), seedling length (SL), seedling vigor index (SVI), seedling mass (SM), root length (RL), and total leaf surface area (LA). Characteristic parameters of lettuce seed germination (GP, MGT, and GS) were determined using Equations (3)(5), where NT represents the total number of tested seeds, ti the time since sowing (1, 2, …, 10 days, i = 1, 2, …, 10), Ng,i the number of germinated seeds at ti, and Ng,T = Ng,10 the total number of germinated seeds [45,46,47]. SL, SM, RL, and LA at t10 = 10 days were measured for the seedlings resulting from 50% of tested seeds, i.e., those from the upper half of each Petri dish (highlighted in red in Figure 4). SVI was calculated depending on GP and SL using Equation (6) [17,47]. Images of seedling samples at t10 = 10 days are shown in Figure 5.
G P = 100 N g , T N T
M G T = i = 1 10 N g , i t i N g , T
G S = i = 1 10 N g , i t i
S V I = S L G P 100

2.6. Data Processing

The values of CT properties obtained at different levels of fermentation factors were processed using Principal Component Analysis (PCA) [37,42,43,48]. The effects of fermentation process factors on physicochemical properties of CT were quantified using quadratic polynomial equations. The desirability function approach was used to optimize the process factors [40,49]. One-way ANOVA was applied to evaluate whether the treatments with diluted and undiluted CT had significant effects (p < 0.05) on the relevant characteristics of lettuce seed germination and seedling growth. Statistical analysis, modelling, and process factor optimization were performed using XLSTAT Version 2019.1 (Addinsoft, New York, NY, USA).

3. Results and Discussion

3.1. Compost Tea Characterization

Indicators of position (minimum, maximum, and mean values) and variability (standard deviation) of CT properties determined in triplicate in all experimental runs are summarized in Table 2. Tabulated data indicate lower variability of pH and C/N (coefficients of variation less than 4%) as well as higher variability of P, Ca, Mg, Cu, Mn, and Zn (coefficients of variation higher than 40%).
Table 3 contains information reported by several authors regarding the physicochemical properties of CT, type of compost feedstock, and fermentation conditions. Tabulated data highlight the following:
-
the mean values of EC, K, Ca, Mg, and Zn obtained in this study were significantly higher than those reported by Zaccardelli et al. [26] for aerated CT prepared from two types of compost derived from agro-industrial residual materials (wood, artichoke, fennel, and escarole residues), whereas the values of pH, Cu, and Mn were similar;
-
the mean values of EC, N, P, K, Ca, Mg, and Fe were significantly higher than those found by Samet et al. [13] for aerated CT obtained from compost produced from olive mill wastewater, olive pomace, and coffee grounds, whereas the values of pH were similar;
-
compared to aerated CT prepared by Morales-Corts et al. [31] from garden waste-based compost, the mean values of EC, Ca, Mg, Fe, Mn, and Zn obtained in this study were significantly higher, that of Cu was significantly lower, whereas the values of pH were similar;
-
the mean values of EC, pH, C/N, and Mg were significantly higher than those reported by González-Hernández et al. [25,27,30] for aerated CT derived from garden waste-based compost, whereas those of Ca were similar;
-
the mean values of EC, pH, and N were significantly higher than those found by Jarboui et al. [2] for non-aerated CT prepared from food waste-derived compost;
-
the mean values of P and K were significantly higher than those obtained by Xu et al. [4] for non-aerated CTs derived from compost based on pig manure and rice straw, whereas those of N were similar.
Accordingly, the mean values of EC (11.74 dS/m), N (0.021%), P (301.5 mg/kg), K (0.406%), Ca (264.1 mg/kg), Mg (110.8 mg/kg), Fe (16.21 mg/kg), and Zn (1.117 mg/kg) for non-aerated CT obtained in this study from marine residue-derived compost were generally significantly higher than those reported in the related literature for CT prepared from terrestrial residue-derived compost (Table 3). This is probably due to the high concentrations of macronutrients (N, P, K, Ca, and Mg) and micronutrients in seaweed and fish residues and their compost [34,35,36,37].

3.2. Results of PCA

A data matrix with 36 rows [number of triplicate samples corresponding to experimental runs 1, 2, …, 12 (CT1, CT2, …, CT12) in Table 1] and 15 columns (number of variables, including EC, pH, DM, Ash, C, N, P, K, Ca, Mg, Cu, Fe, Mn, Mo, and Zn) was used in PCA. The eigenvalues corresponding to the first two principal components (PCs), i.e., 11.63 for PC1 and 1.48 for PC2, were > 1 and these two PCs explained 87.4% (77.5% + 9.9%) of the total variance.
The results presented in Figure 6 (PCA bi-plot), Table 4 (factor loadings), and Table 5 (correlation matrix) highlight the following:
-
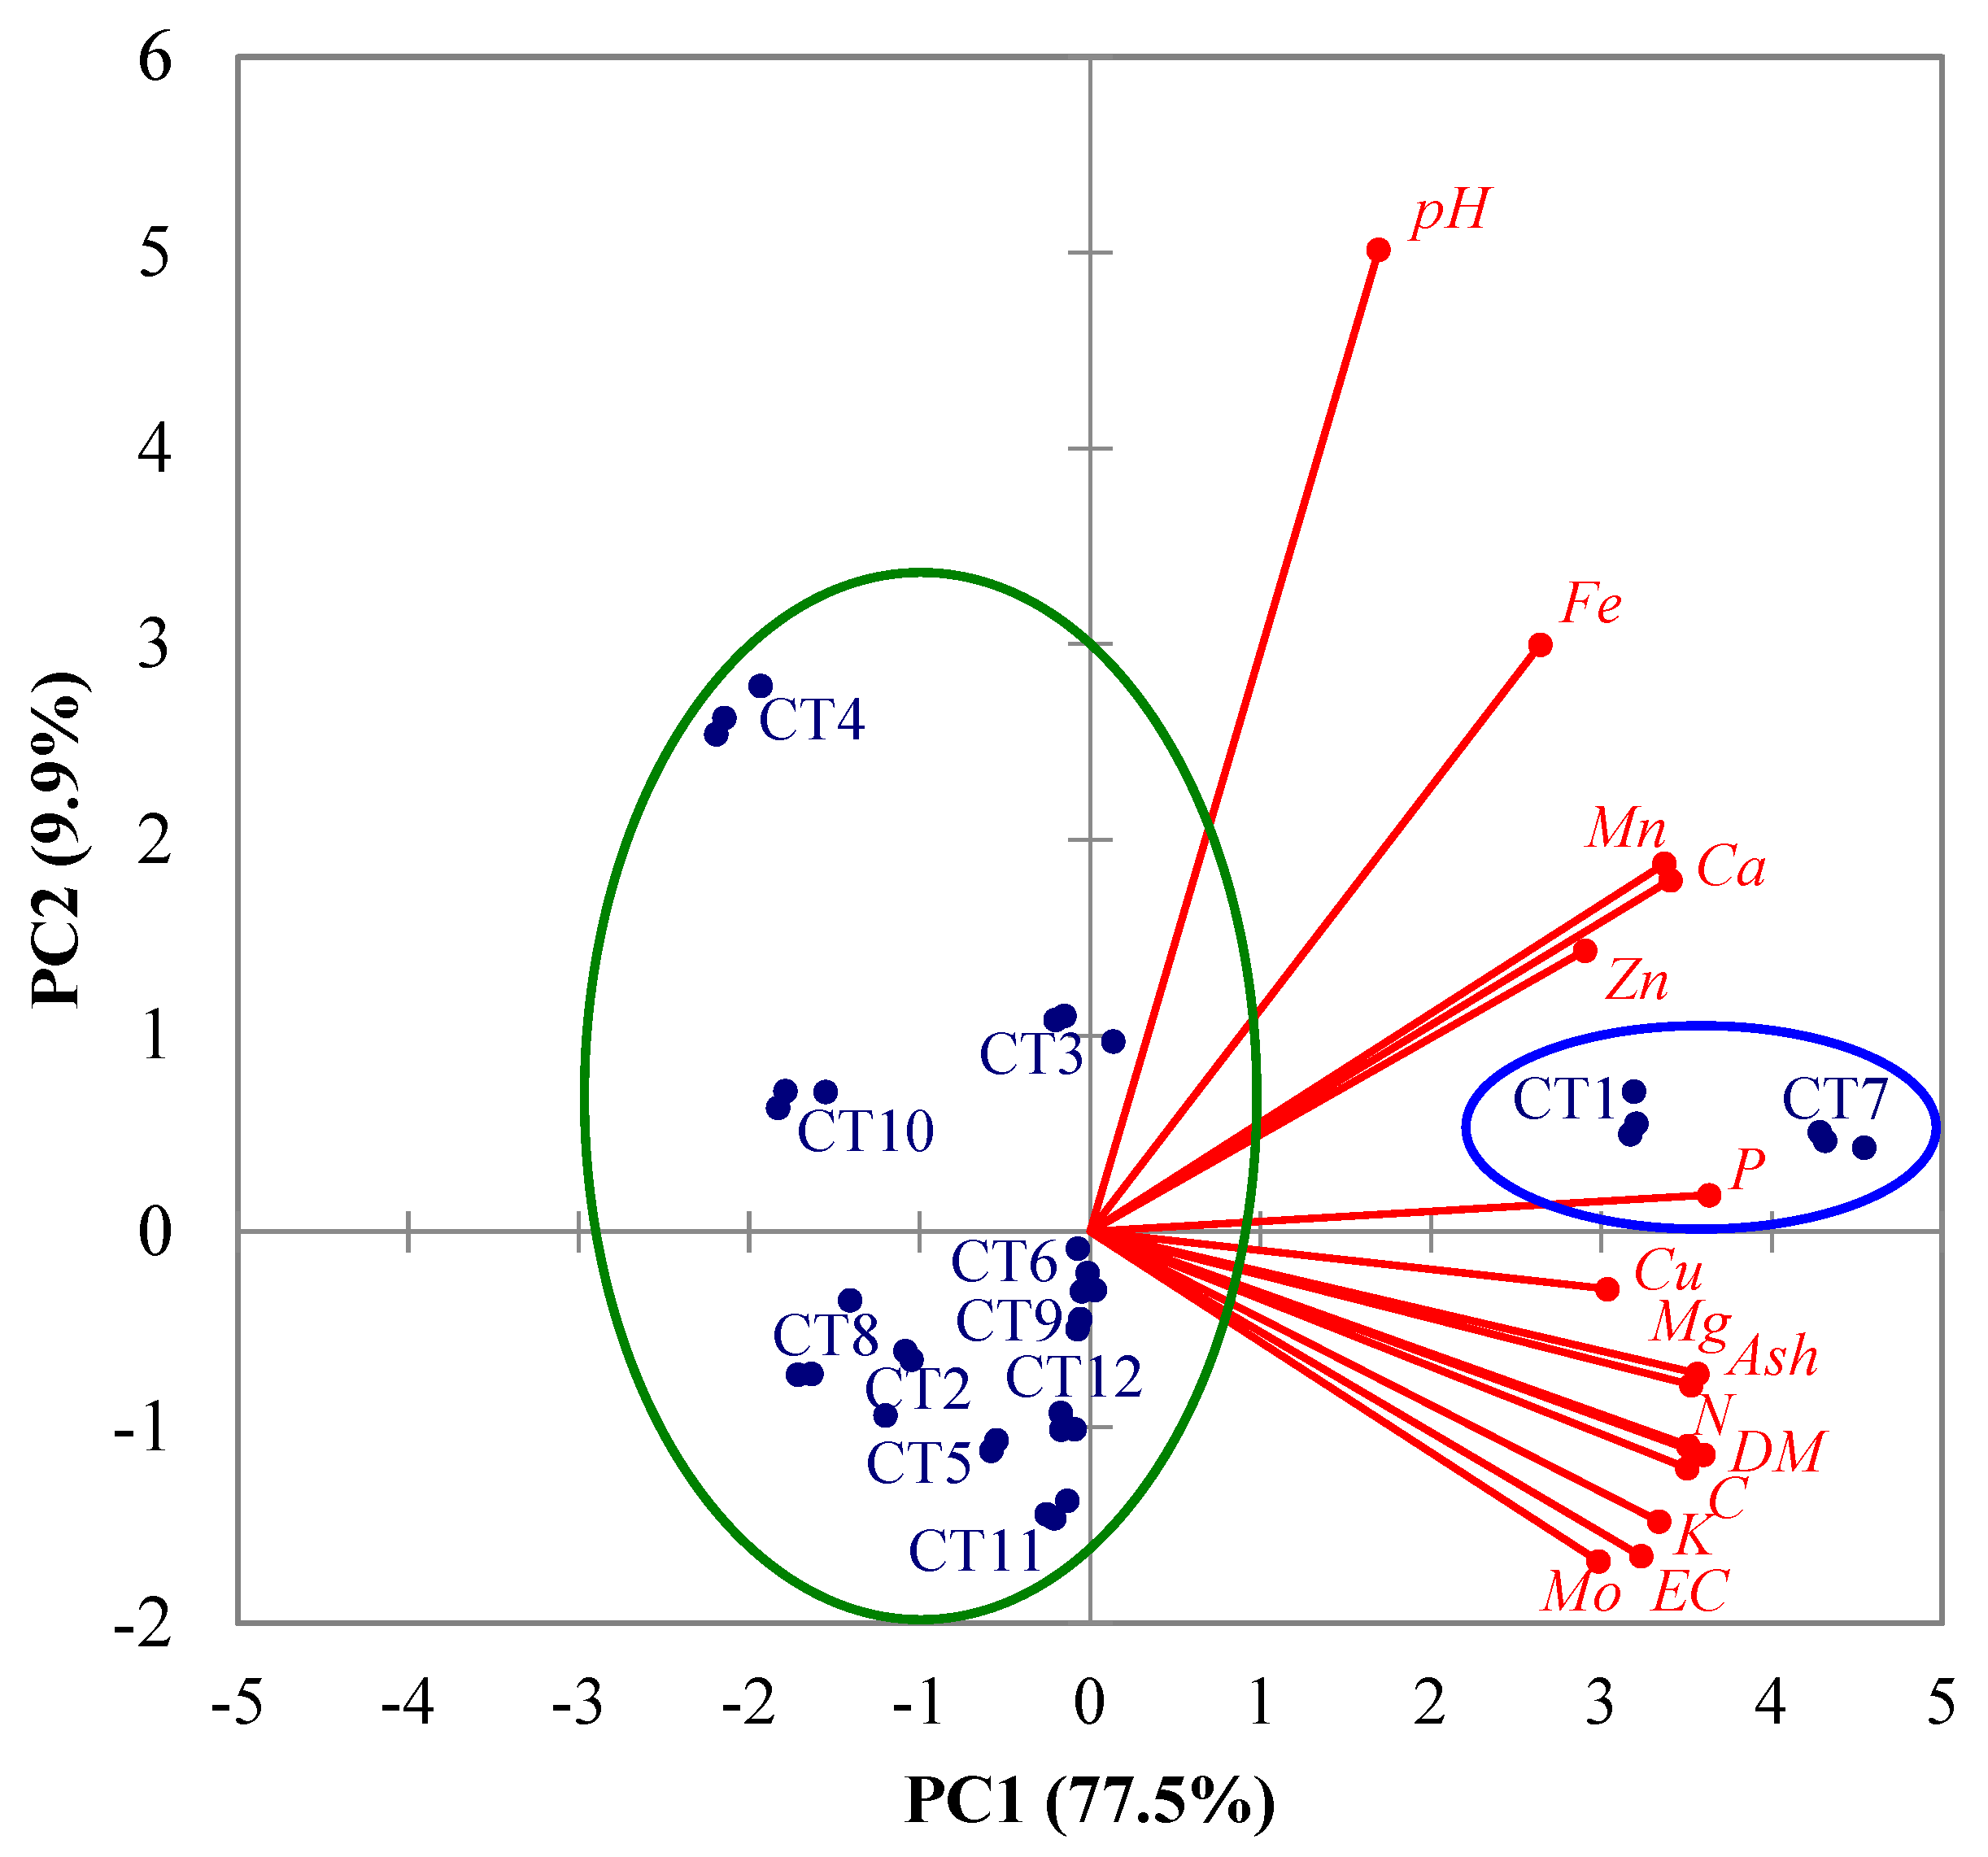
depending on significant levels of factor loadings (highlighted in bold in Table 4), the most important variables are EC, DM, Ash, C, N, P, K, Ca, Mg, Cu, Fe, Mn, Mo, and Zn for PC1 as well as pH for PC2;
-
CT1 and CT7 samples obtained in the experimental runs 1 (X1 = −1 and X2 = −1) and 7 (X1 = −1.414 and X2 = 0) have higher values of EC, DM, Ash, C, N, P, K, Ca, Mg, Cu, Fe, Mn, Mo, and Zn than the other samples [discrimination on PC1 between CT1 and CT7 (inside the blue ellipse in Figure 6) and the other samples (inside the green ellipse), especially CT2 (X1 = −1 and X2 = 1), CT4 (X1 = 1 and X2 = 1), CT8 (X1 = 1.414 and X2 = 0), and CT10 (X1 = 0 and X2 = 1.414)];
-
CT4 samples obtained in the experimental run 4 (X1 = 1 and X2 = 1) have higher values of pH than CT2, CT3, CT5, CT6, CT8–CT12 samples (discrimination on PC2 between CT4 and the other samples inside the green ellipse in Figure 6);
-
EC, DM, Ash, C, N, P, K, Ca, Mg, Cu, Fe, Mn, Mo, and Zn are directly correlated and the corresponding correlation coefficients (0.394 ≤ r ≤ 0.999) are significant at α = 0.05 (Table 5); pH is directly correlated with Ash, P, Ca, Cu, Fe, Mn, and Zn, with the corresponding correlation coefficients (0.358 ≤ r ≤ 0.667) being significant at α = 0.05.

3.3. Prediction of Process Responses

Statistical models described by Equation (7) link the predicted process responses (Yj,pr, j = 1, …, 15), i.e., ECpr, pHpr, DMpr, Ashpr, Cpr, Npr, Ppr, Kpr, Capr, Mgpr, Cupr, Fepr, Mnpr, Mopr, and Znpr, to X1, X12, X2, X22, and X1X2.
Y j , p r = α 0 j + α 1 j X 1 + α 11 j X 1 2 + α 2 j X 2 + α 22 j X 2 2 + α 12 j X 1 X 2 , j = 1 15
Regression coefficients in Equation (7), i.e., a0j, a1j, a11j, a2j, a22j, and a12j, were determined from mean experimental values (corresponding to triplicate measurements) of fermentation process responses (Yj,m, j = 1, …, 15), which are summarized in Table 6 and Table 7. The values of regression coefficients, determination coefficient (Rj2), F statistic (Fj), and pj-value for Fj, which are specified in Table 6 and Table 7, highlight the following relevant aspects:
-
pHpr and Mnpr do not vary significantly with X1, X12, X2, X22, or X1X2 (0.360 ≤ Rj2 ≤ 0.693, 0.675 ≤ Fj ≤ 2.708, and 0.129 ≤ pj ≤ 0.658 for j = 2, 14);
-
ECpr, DMpr, Ashpr, Cpr, Npr, Ppr, Kpr, Capr, Mgpr, Fepr, Mopr, and Znpr vary significantly with at least one of X1, X12, X2, X22, and X1X2, and there is a good agreement between experimental and predicted values of process responses (0.809 ≤ Rj2 ≤ 0.979, 5.080 ≤ Fj ≤ 54.87, and 0.0001 ≤ pj ≤ 0.036 for j = 1, 3, …, 10, 12, 13, 15); ECpr increases significantly with an increase in X12 and a decrease in X1, X2, and X22; DMpr, Cpr, Npr, Ppr, Kpr, and Mgpr increase significantly with a decrease in X1 and X2; Ashpr and Znpr increase significantly with an increase in X12 and a decrease in X1 and X2; Capr increases significantly with an increase in X12 and a decrease in X1; Fepr increases significantly with an increase in X1X2; Mopr increases significantly with a decrease in X1, X2, and X22;
-
Cupr increases significantly with a decrease in X2, but the statistical model defined by Equation (7) for j = 11 is statistically non-significant (F = 2.326 and p = 0.167).

3.4. Optimization of Fermentation Process Conditions

Optimization of fermentation process factors, aiming at maximizing the process responses in terms of ECpr, DMpr, Ashpr, Cpr, Npr, Ppr, Kpr, Capr, Mgpr, Fepr, Mopr, and Znpr was performed based on the desirability function approach. The optimal levels of dimensionless factors were X1,opt = −1.414 and X2,opt = −0.707, corresponding to RLS,opt = 4.2 g/g and topt = 5.6 days = 134 h, and the value of desirability function at X1,opt and X2,opt was 0.988. The values of the process responses predicted by Equation (7) at X1,opt and X2,opt, i.e., Yj,pr,opt (j = 1, …, 15), are summarized in Table 8.

3.5. Validation of Statistical Models

To validate the statistical models defined by Equation (7), three fermentation experiments were performed at optimal levels of process factors (RLS,opt = 4.2 g/g and topt = 5.6 days = 134 h). The mean values of experimental responses at RLS,opt and topt, i.e., Yj,m,opt (j = 1, …, 15), related standard deviations (SDj), and values of percentage prediction error (εj) defined by Equation (8) are presented in Table 8. The values of percentage prediction error (−3.8% ≤ εj ≤ 4.2%) and results of equal and unequal variance t-test (pj ≥ 0.07) indicate that Yj,m,opt and Yj,pr,opt were not significantly different, which proves the validity of statistical models described by Equation (7).
ε j = 100 Y j , m , o p t Y j , p r , o p t Y j , m , o p t , j = 1 15

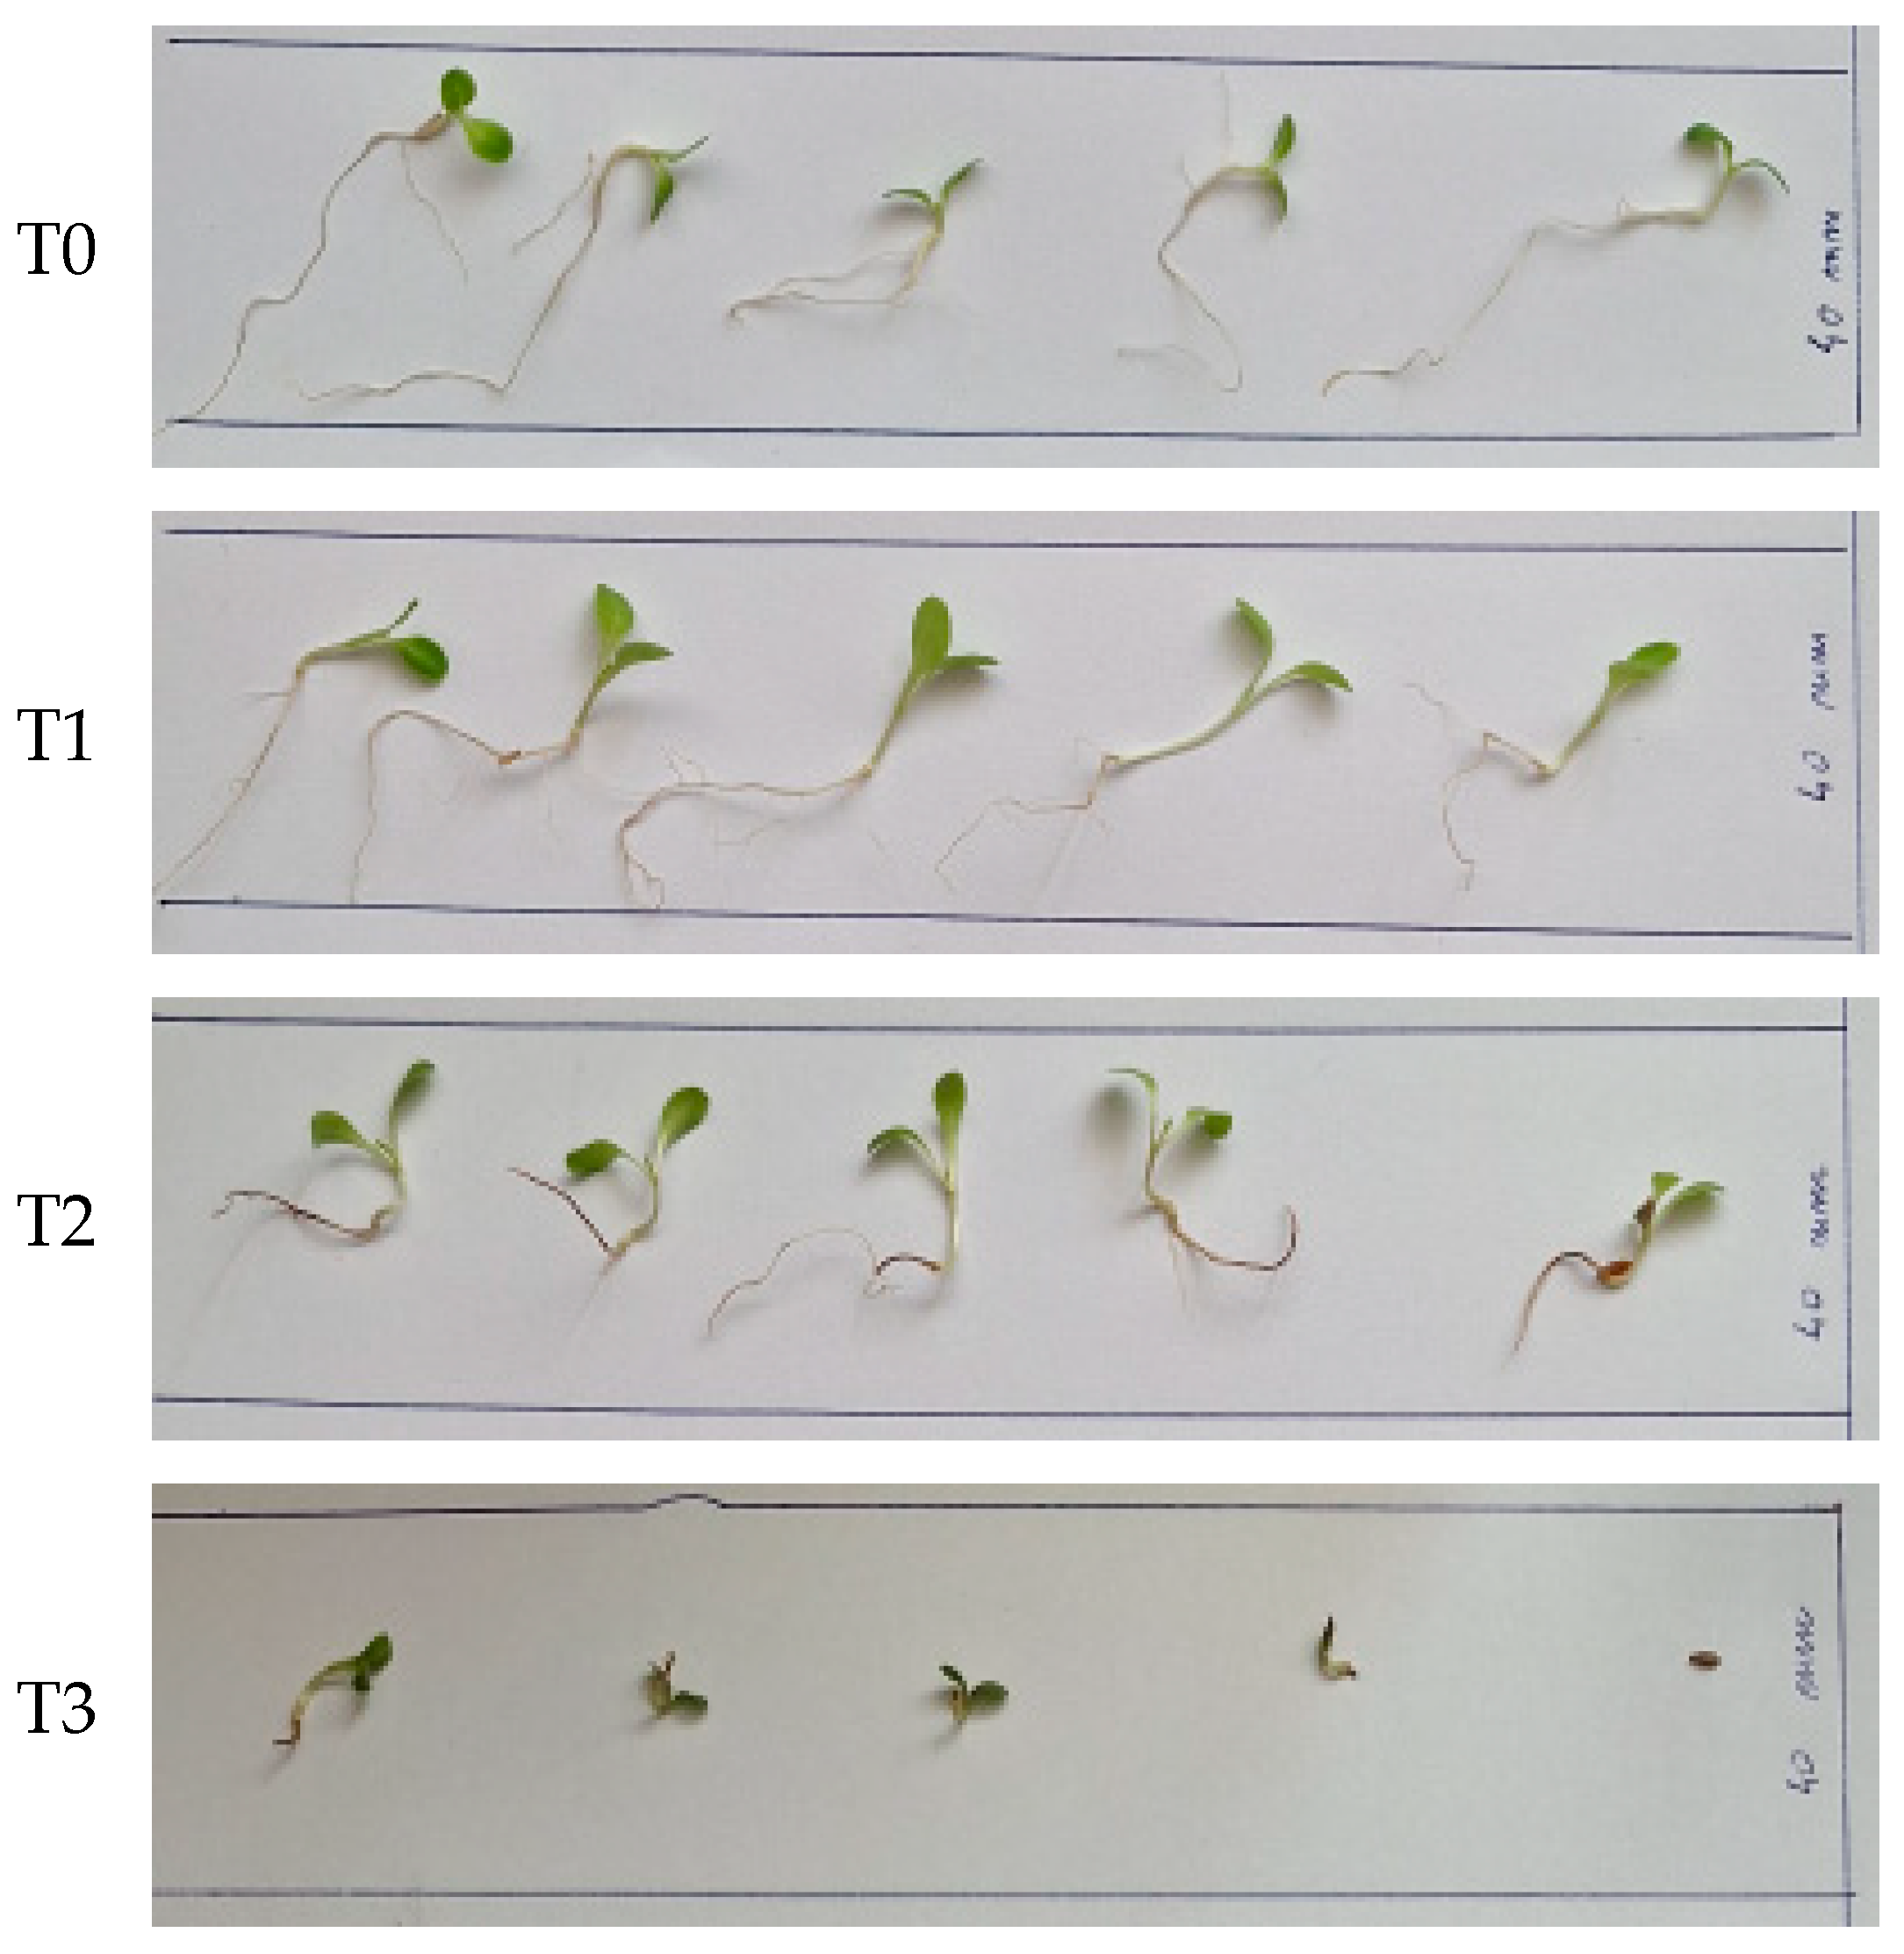
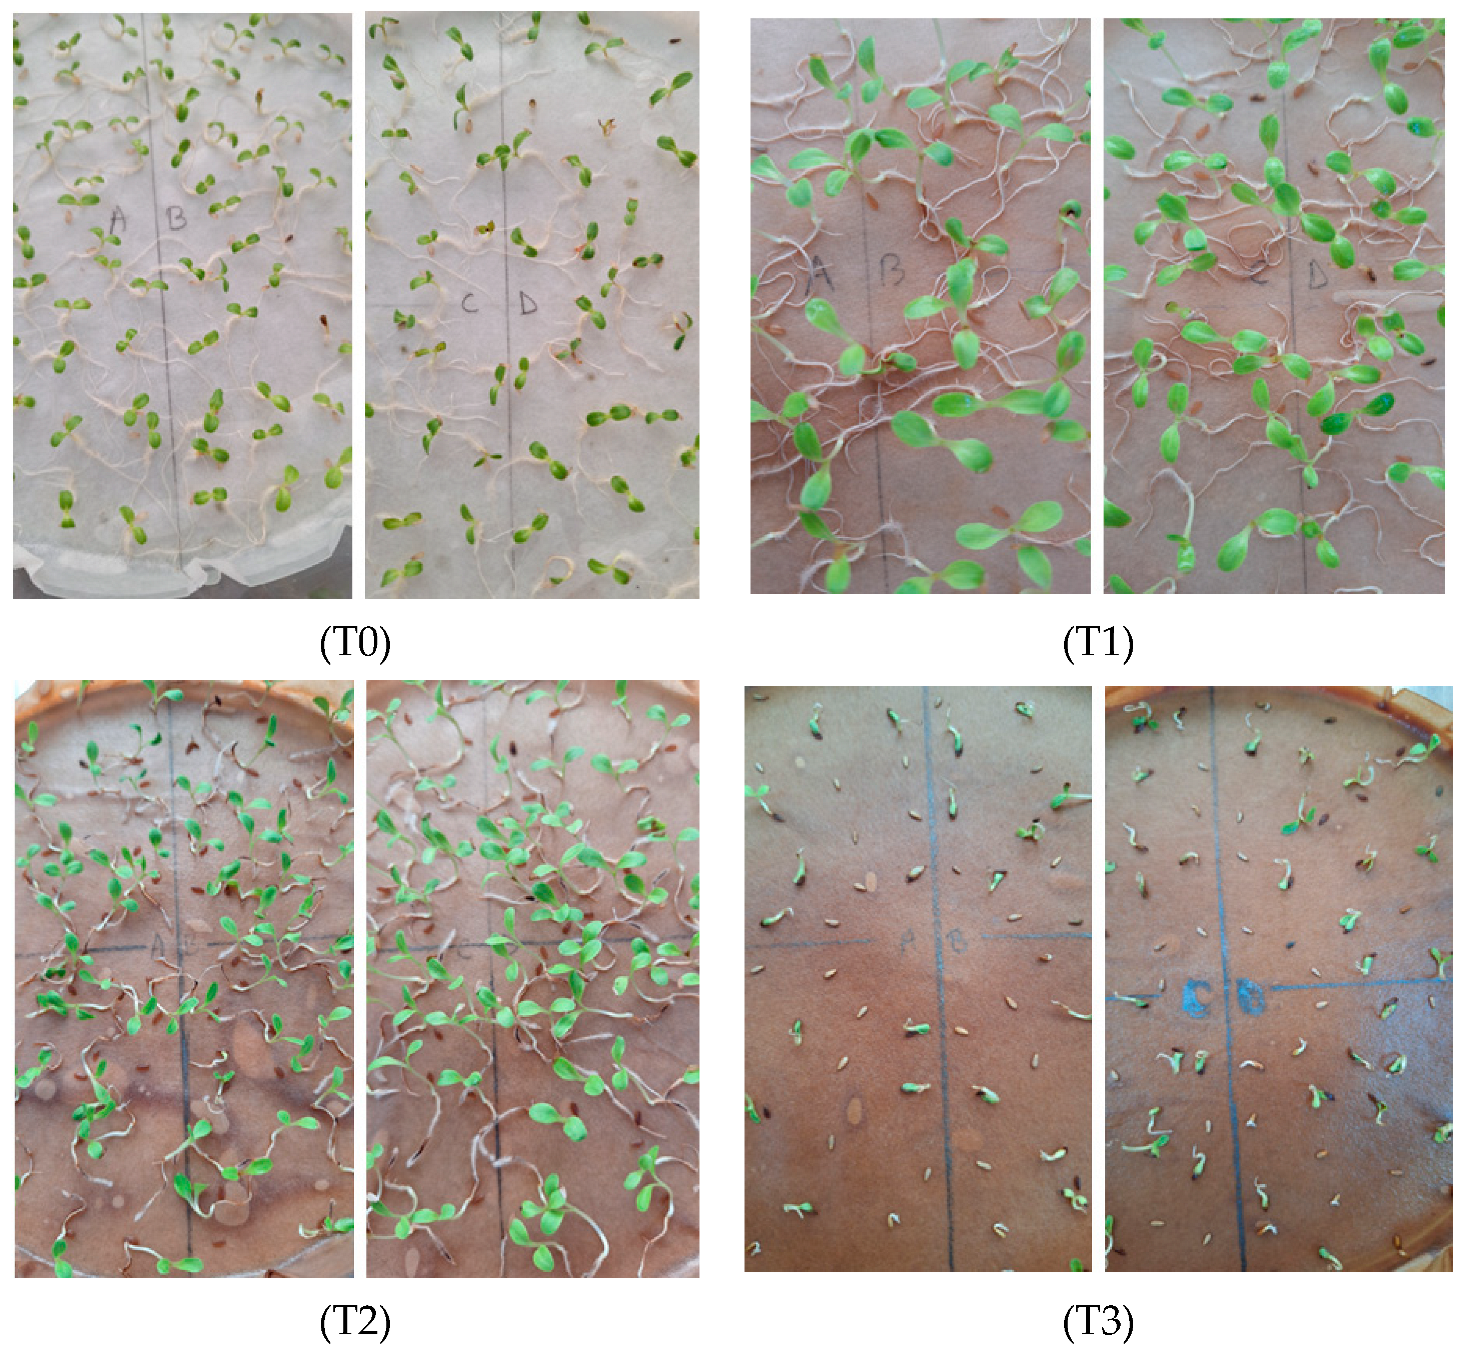
3.6. Testing Compost Tea for Lettuce Seed Germination and Seedling Growth

Non-aerated CT obtained at optimal levels of process factors (RLS,opt = 4.2 g/g and topt = 5.6 days = 134 h) was tested for lettuce seed germination and seedling growth. Images of lettuce seedling, 10 days after sowing, are shown in Figure 7. The mean values (for four replicates) of relevant characteristics of germination and seedling growth for treatments T0 (100% ultrapure water) (control), T1 (25% CT + 75% ultrapure water), T2 (50% CT + 50% ultrapure water), and T3 (100% CT) are summarized in Table 9.
CT had a negative effect on the germination of lettuce seeds. Even though there were no statistically significant differences (p > 0.05) between the values of germination percentage (GP) for treatments T0 (98%), T1 (97%), and T2 (97%), CT application delayed the germination, i.e., mean germination time (MGT) increased and germination speed (GS) decreased with an increase in CT concentration from 25% to 100%.
However, the treatment T1 (25% CT) had significant (p < 0.05) positive effects on seedling length (SL), seedling vigor index (SVI), seedling mass (SM), and total leaf surface area (LA) compared with the other treatments. Moreover, the treatment T3 (100% CT) had significant adverse effects on seed germination and seedling growth characteristics.
Consequently, it is possible to add diluted CT (25% CT + 75% ultrapure water) to lettuce growth medium to improve seedling growth while obtaining a high level of GP as well as reasonable values of MGT and GS.
Seed germination is a critical process in the growth cycle of a plant, as it can significantly affect seedling establishment and plant production [50]. This process begins with imbibition, i.e., the water uptake by the seed, and ends with radicle protrusion [51]. Germination is regulated by internal factors, e.g., hormones (gibberellins, abscisic acid, auxins, cytokinins), proteins, seed age, size, and structural components, and external factors, including salinity, temperature, acidity, light, and nutrient and moisture concentration [51]. Salinity is a major stress that may negatively affect the germination process by decreasing the amount of gibberellins (that stimulate germination), increasing the amount of abscisic acid (that promotes seed dormancy and inhibits germination), and altering membrane permeability and water uptake [51]. Depending on the salt tolerance of the plant, salinity can cause the inhibition of seed germination or a decrease in GP and an increase in MGT [50,51,52]. Lettuce is a salinity sensitive plant (glycophyte) and its seed germination can be delayed or inhibited, even under conditions of moderate salinity (EC = 4–8 dS/m), by both osmotic stress and ionic toxicity stress (caused by excess Na+ and Cl) [50,51,52].
Nasri et al. [50] studied the effects of NaCl concentration (0–150 mM, corresponding to EC = 0–16 dS/m) on GP for four lettuce varieties (Romaine, Augusta, Vista, and Verte). For the Romaine variety, the values of GP were similar (92–93%) for EC = 0–10.6 dS/m and about 45% higher than the value obtained for EC = 16 dS/m, whereas for the other varieties GP decreased with an increase in EC. Moreover, for the Vista and Verte varieties, germination was inhibited at higher levels of EC (16 dS/m for Vista, 10.6 dS/m and 16 dS/m for Verte). Inhibition of seed germination could be an effect of altered activity of hydrolytic enzymes, e.g., phytase [50]. Rosas et al. [52] evaluated the influence of NaCl concentration (0–100 mM, corresponding to EC = 0–10.6 dS/m) on lettuce seed germination. For EC levels higher than 2.8 dS/m, they found a decrease in GP and GS with an increase in EC. Germination can be delayed by a forced dormancy, caused by a decrease in water uptake by the seeds, which has negative effects on cell elongation and division [52]. These findings are consistent with those obtained in our study. The mean value of EC for undiluted CT (treatment T3) was 16.9 dS/m (Table 8). Assuming EC = 0 dS/m in ultrapure water, this implies EC values of 4.23 dS/m and 8.46 dS/m for diluted CT in the treatments T1 and T2. The values of GP were similar (97–98%) for EC = 0–8.46 dS/m (treatments T0–T2) and about 30% higher than the value obtained for EC = 16.9 dS/m (treatment T3). For the treatments T1–T3, MGT increased and GS decreased with an increase in EC (4.23–16.9 dS/m).
Salinity can have significant negative effects on seedling/plant growth and development. Nasri et al. [50] evaluated the influence of salinity on the lettuce seedling growth, 4 days after sowing. In the presence of 100 mM NaCl (EC = 10.6 dS/m), masses and lengths of radicles and shoots were diminished, the decrease being more pronounced in the Vista variety (more salt sensitive) than in the Romaine variety (more salt tolerant). Rosas et al. [52] reported a decrease in SL and RL of lettuce seedlings (7 days after sowing) with an increase in EC (2.8–10.6 dS/m). In our study, the treatment T1 (EC = 4.23 dS/m) had a significant beneficial effect on SL, SVI, SM, and LA compared to the other treatments, whereas the treatments T0 (EC = 0 dS/m) and T1 had similar positive effects on RL. Moreover, all seedling growth characteristics (SL, SVI, SM, RL, and LA) decreased significantly with an increase in EC (4.23–16.9 dS/m). Ünlükara et al. [53] studied the influence of irrigation water salinity on the growth and yield of lettuce (Lactuca sativa L.). EC in the growing medium (soil) increased from 1.3 to 11.8 dS/m and the yield decreased from 144.8 to 30.6 g per lettuce with an increase in water salinity from 0.75 to 7.0 dS/m. A similar trend was observed for okra (Abelmoschus esculentus L.) [54].
In a review on salt stress in crop plants, stress was assessed using sodium chloride (NaCl) solutions of 80–150 mM, corresponding to about 9–16 dS/m [55]. At such concentration levels, leaf and root elongation decreased. Plants seem to cope with high concentrations up to a certain level, being able to maintain much lower concentrations of toxic ions inside the plant cells than in the saline root environment. However, when the mechanisms to avoid toxic levels are exceeded, the plant dies by dehydration (when salt accumulates in cell walls, causing cell shrinkage) or poisoning (when cell cytoplasm concentrations become too high for enzyme activity) [55]. The salt concentrations in the treatments T2 and T3 applied in our study, corresponding to about 8.5 and 17 dS/m, clearly had negative effects, highlighting the risk of applying too strong fertilizer solutions to sensitive crops.
Macronutrients, micronutrients, humic and fulvic acids, phytohormones, or other microbial metabolites present in CT are responsible for higher levels of GP and enhanced seedling growth [22,29,56,57,58]. The availability and balance of essential mineral nutrients in the growing substrate play a crucial role in the germination process and subsequent seedling/plant growth and development [57,59]. All essential nutrients are equally important to plants and an imbalance or an excess of nutrients in the substrate solution can significantly affect germination and growth stages [57,60,61].
Determining optimal levels of N, P, and K in the growing substrate is essential for proper seed/seedling/plant growth and development. For lettuce grown in hydroponics, the N supply should be 100–150 mg/L [62]. In our study, the mean value of N for undiluted CT (treatment T3) was 0.041% ≈ 410 mg/L (Table 8) and those for diluted CT were about 102.5 and 205 mg/L in the treatments T1 and T2. Accordingly, the level of N for the beneficial treatment T1 is within the recommended value range. The mean values of P and K were about 600 and 6280 mg/L in treatment T3, 150 and 1570 mg/L in treatment T1, and 300 and 3140 mg/L in treatment T2. Xu et al. [61] studied the effect of five levels of K (0, 3, 6, 9, and 12 mM, corresponding to 0–468 mg/L) on apple dwarf rootstock seedling (M9T337) growth. Root and shoot dry masses were significantly higher for a K supply of 6 mM (234 mg/L) than for the other treatments. Moreover, this optimal level of K led to an increase in N use efficiency (NUE). Karimmojeni et al. [56] evaluated the effect of five levels of KNO3 concentration (0, 0.2, 2, 20, and 200 mM, corresponding to K = 0–7800 mg/L) on GP of perennial pepperweed (Lepidium latifolium) seeds and found an optimal level of 20 mM (K = 780 mg/L). Niu et al. [63] hydroponically grew two eucalyptus species (Eucalyptus dunnii and Corymbia citriodora) at six levels of P (0, 0.01, 0.1, 0.5, 1, and 2 mM, corresponding to 0–62 mg/L). Eucalyptus seedlings had optimal growth for P levels of 0.1–1 mM (3.1–31 mg/L).
Yap et al. [64] studied the influence of Ca in nutrient solution (150, 250, and 350 mg/L) on hydroponic lettuce (Lactuca sativa L.) growth. They reported that a Ca level of 150 mg/L improved lettuce growth and reduced tip burn compared to the other treatments. This optimal level is quite close to the mean level of Ca corresponding to treatment T1 in this study, i.e., Cam = 222 mg/kg, for which the highest values of growth characteristics were obtained. Higher levels of Ca result in reduced Mg uptake, which is one of the causes of slower plant growth.
Some metals like Zn and Fe are essential for plants, but they can become toxic at high concentrations [57]. Their toxic effect is more significant in the growth stage than in the germination stage, because the absorption of minerals is much more accentuated with the appearance of the radicle [60]. Levels of Zn in the nutrient solution of 0.05–0.50 mg/L usually meet the needs of most crops [65,66]. Higher levels of Zn can produce physiological and biochemical dysfunctions that can lead to a slow plant growth by hindering uptake of water and essential nutrients (N, P, K, Ca, Mg, Fe), affecting carbohydrate metabolism, lowering the rate of photosynthesis, and causing oxidative damage to cell membranes [66,67]. In this study, treatment T1 with 25% CT (Znm = 0.629 mg/kg) led to significantly higher levels of seedling growth characteristics than treatments with 50% CT (Znm = 1.258 mg/kg) and undiluted CT (Znm = 2.516 mg/kg).
The mean values of macronutrient and micronutrient concentrations in diluted and undiluted CT used in treatments T1, T2, and T3 are summarized in Table 10. The results represented in Figure 8, i.e., characteristic variables of lettuce seed germination and seedling growth vs. N, indicate the following:
-
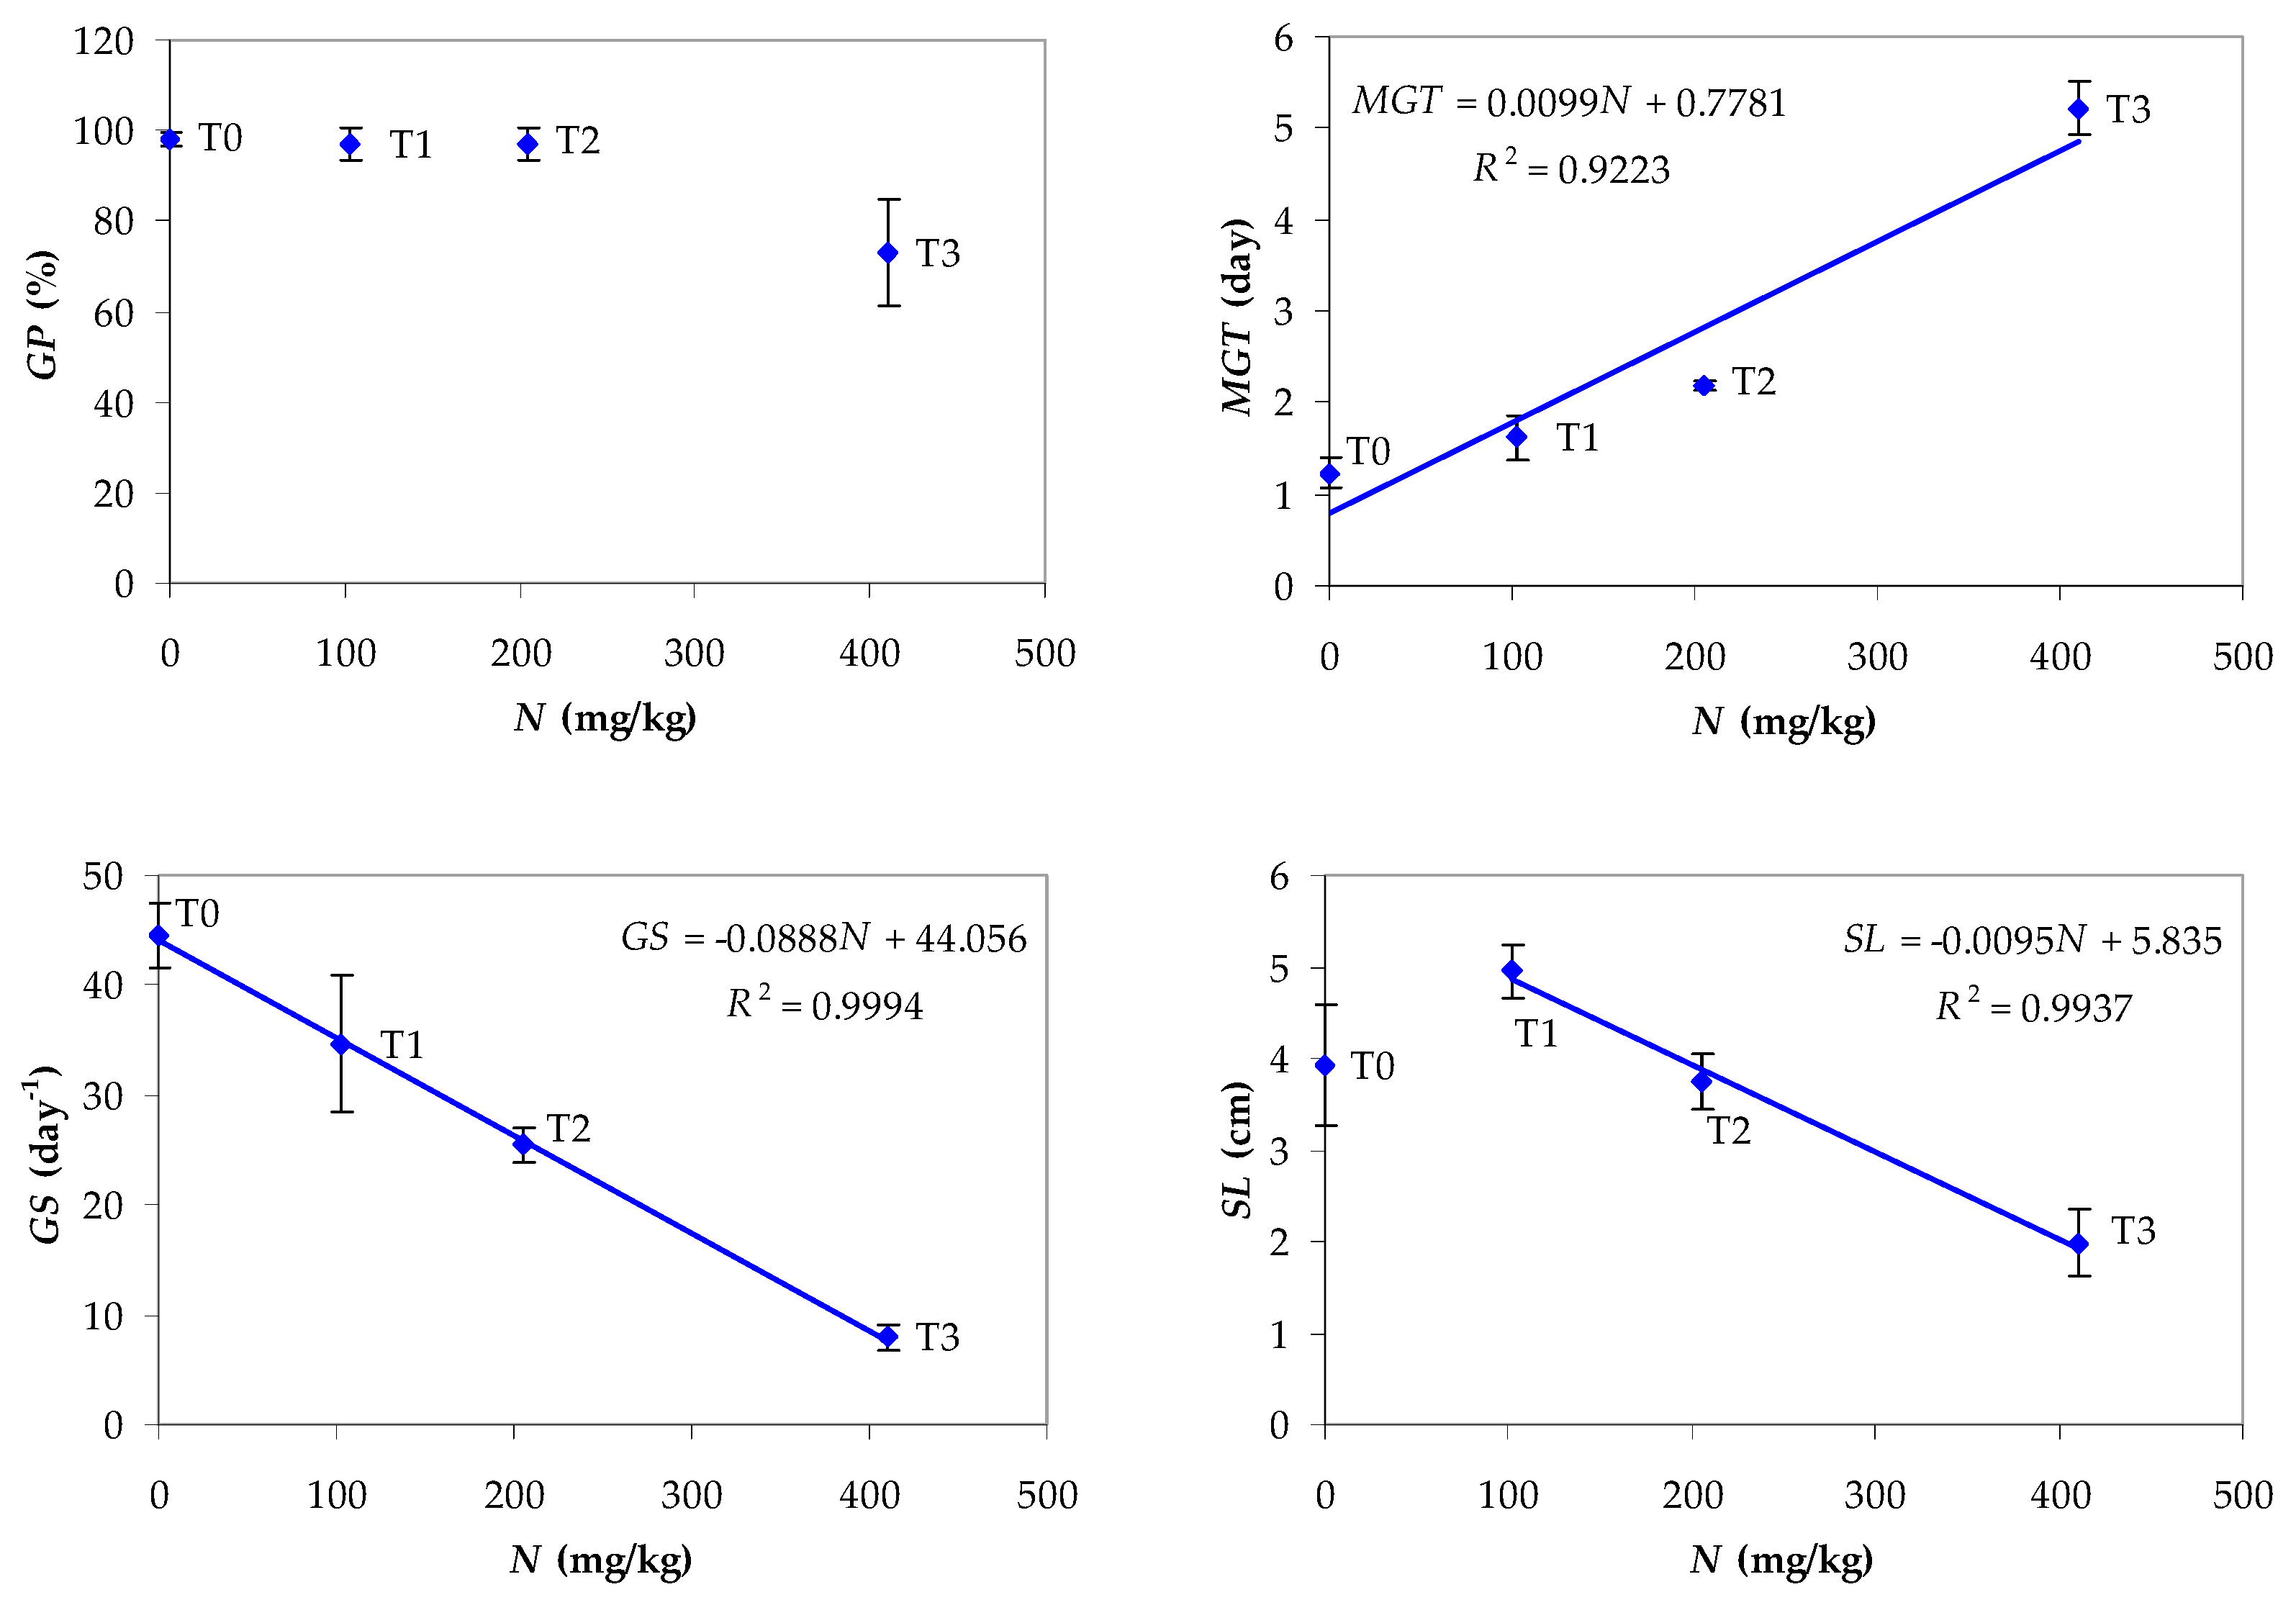
the value of GP for N = 410.0 mg/kg (treatment T3 with undiluted CT), i.e., 73%, is significantly lower than the values obtained by applying the other treatments (N = 0–205.0 mg/kg), which are almost equal (GP = 97–98%);
-
MGT increases linearly with N (R2 = 0.9223) and GS decreases linearly with N (R2 = 0.9994) for values of N ranging from 0 (treatment T0) to 410.0 mg/kg (treatment T3);
-
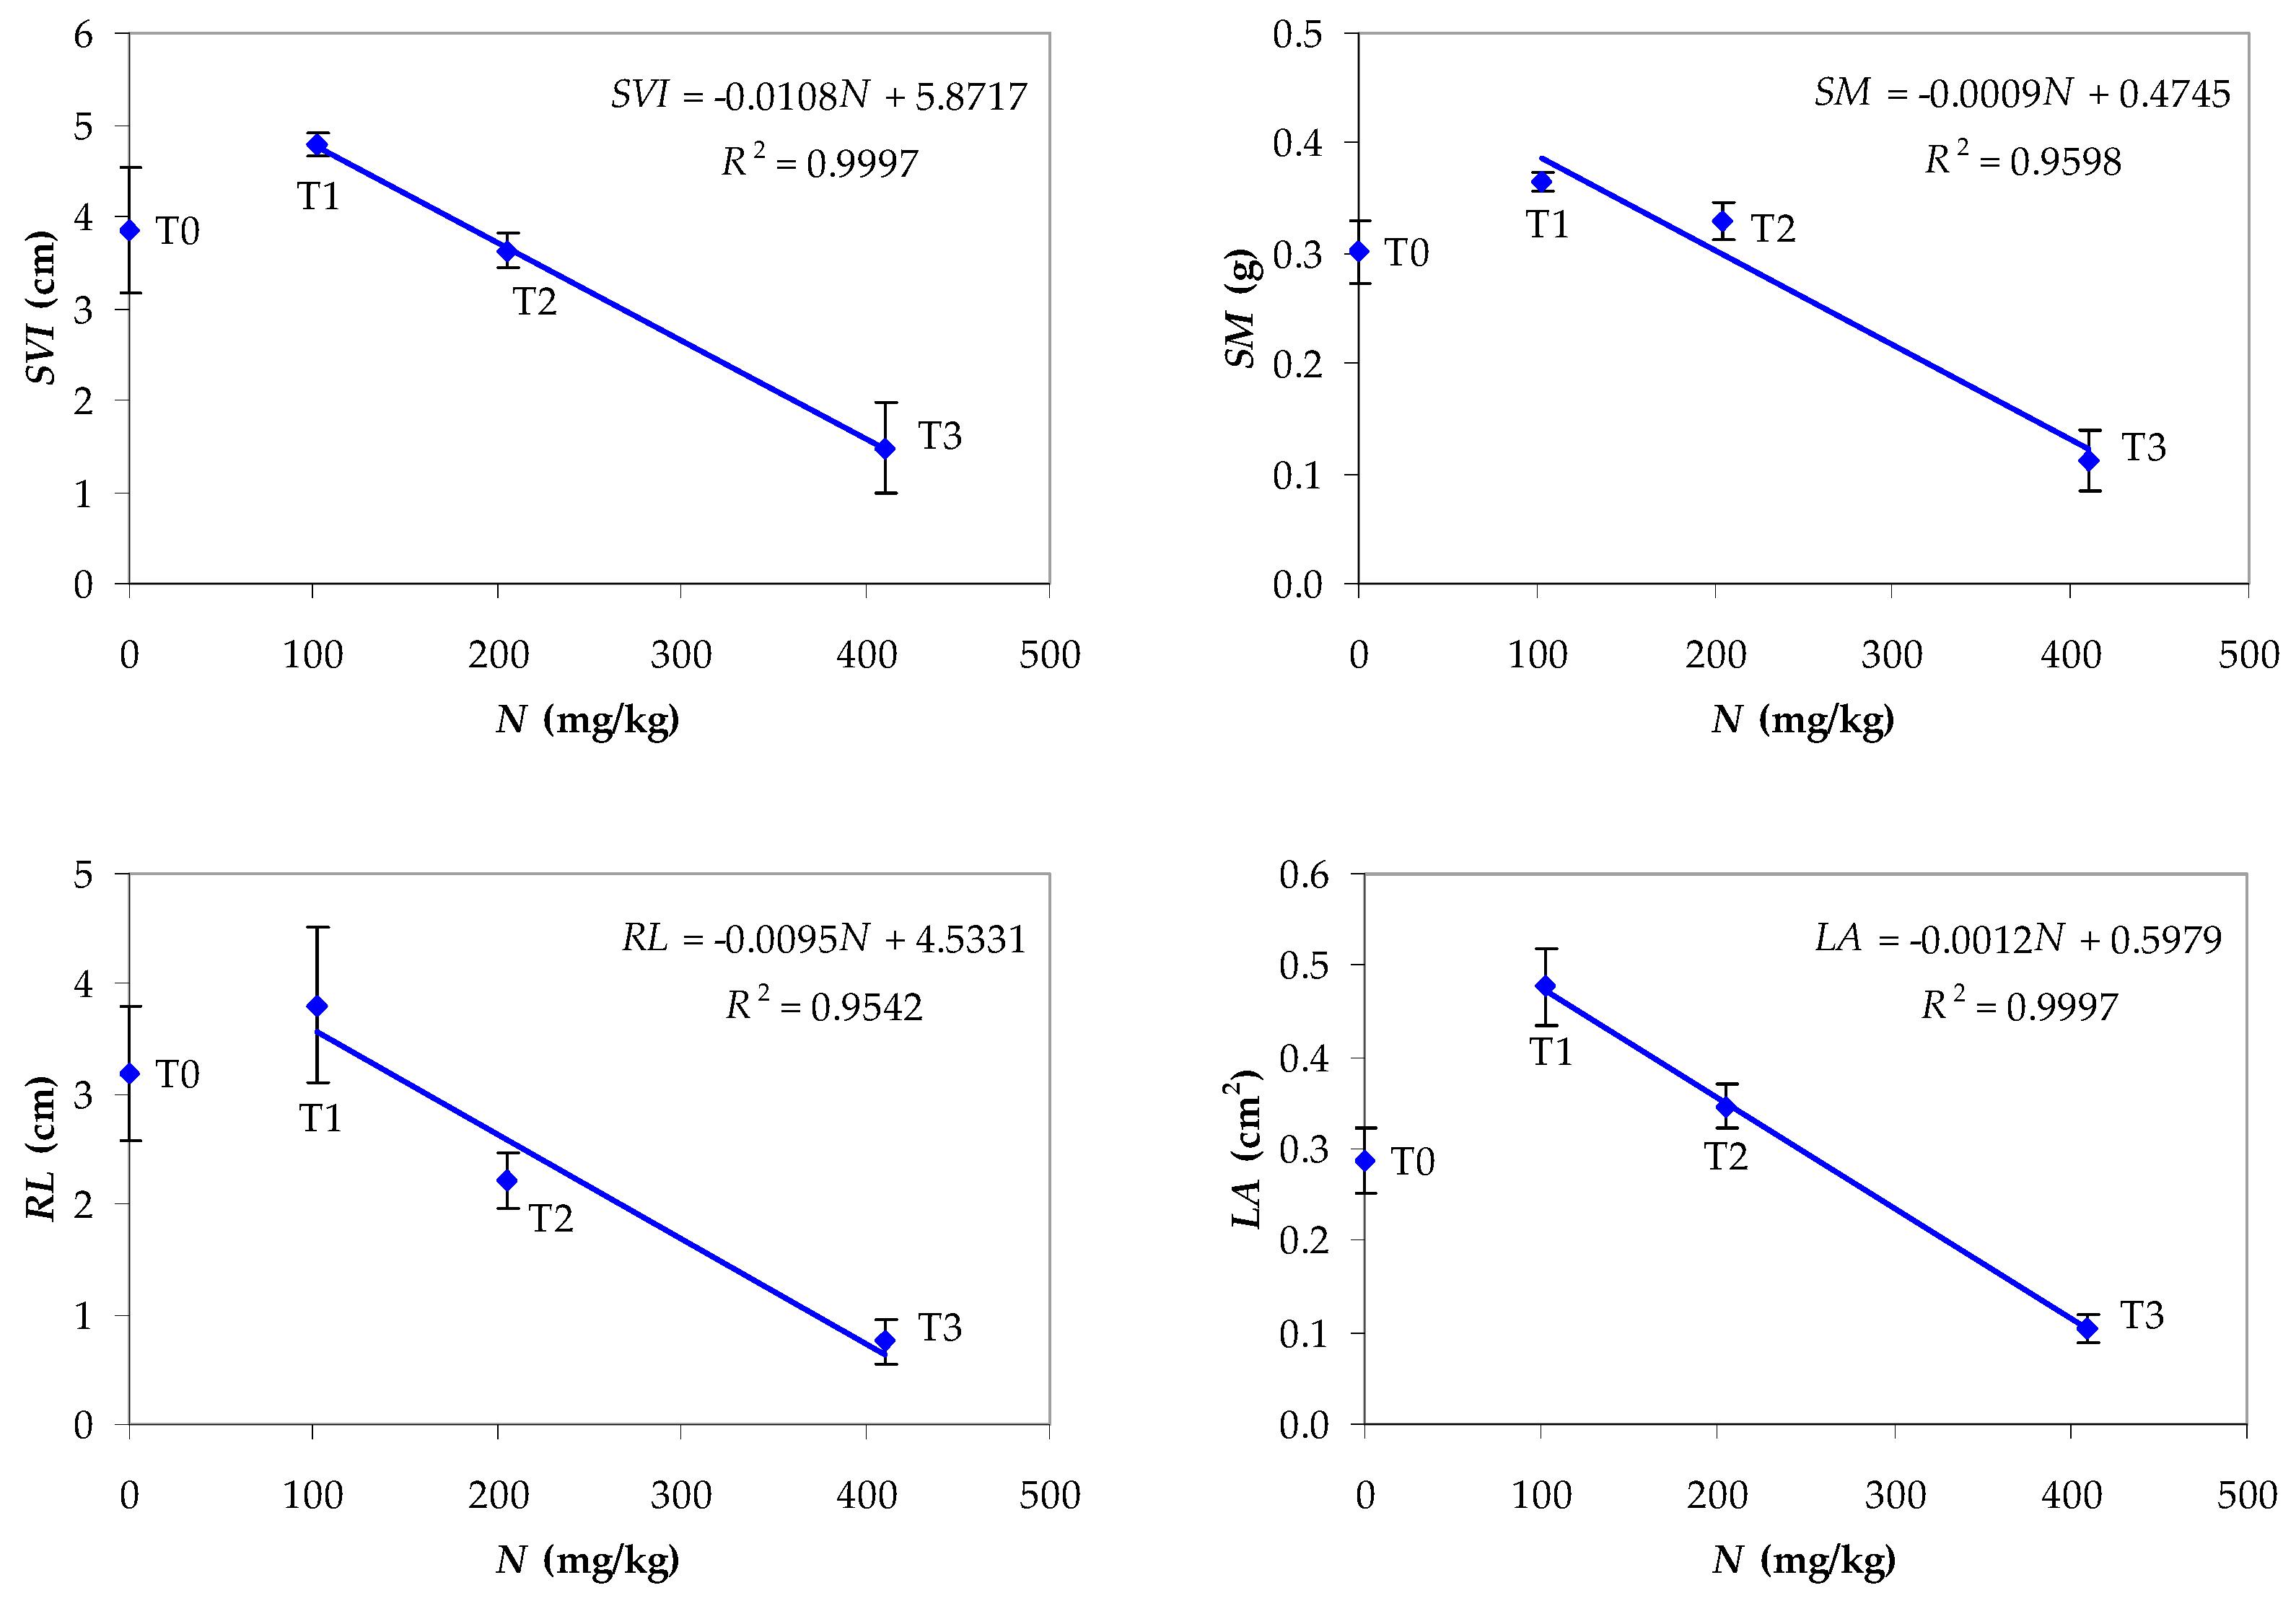
SL, SVI, SM, RL, and LA decrease linearly with N (R2 = 0.9542–0.9997) for values of N ranging from 102.5 (treatment T1) to 410.0 mg/kg (treatment T3).
The data shown in Figure 8 suggest that a dilution higher than 75% water could have beneficial effects on the characteristics of lettuce seed germination and seedling growth. The effects of the concentrations of the other nutrients as well as of EC, DM, and Ash on germination and seedling growth processes are similar to those of N.

4. Conclusions

Preparation of non-aerated compost tea (CT) from compost derived from rockweed and fish residues, its characterization, and testing for lettuce germination and seedling growth were presented in this paper.
CT was prepared by fermenting compost derived from marine residues under different working conditions. Effects of fermentation process factors, i.e., water/compost mass ratio (RLS = 4.2–9.8 g/g) and fermentation time (t = 4.2–9.8 days), on the physicochemical properties of CT were quantified using quadratic polynomial models. There was a good agreement between the experimental and predicted values of electrical conductivity, dry matter concentration, ash concentration, C, N, P, K, Ca, Mg, Fe, Mo, and Zn concentrations. Optimization of fermentation process factors, aiming at maximizing relevant process responses, was based on the desirability function approach.
CT obtained at optimal levels of process factors (RLS,opt = 4.2 g/g and topt = 5.6 days = 134 h) was tested for lettuce seed germination and seedling growth. The results of tests performed for 10 days indicated that diluted CT (25% CT + 75% ultrapure water) can be added to lettuce growth medium to improve seedling growth while achieving a high germination percentage.
To avoid too high salinity, CT should be diluted with 75% water. This gives a solution with an acceptable concentration of N (102.5 mg/L) for growing lettuce and high concentrations of P (150 mg/L) and K (1570 mg/L). The pH was high (> 8), which would hamper application of CT as the only fertilizer applied over time, because the high pH would limit the uptake of micronutrients by plants.

Author Contributions

Conceptualization, O.C.P. and V.A.I.; methodology, A.M. (Andrei Moț), O.C.P., V.A.I., A.M. (Ailin Moloșag), A.D., L.B., C.O., D.E., T.D., A.-K.L., J.C., A.S., S.M., C.O.L.-G., C.R. and A.M. (Alexandra Mocanu); validation, O.C.P. and V.A.I.; formal analysis, O.C.P.; investigation, A.M. (Andrei Moț), V.A.I., A.M. (Ailin Moloșag), A.D., L.B., C.O., D.E., T.D., A.-K.L., J.C., A.S., S.M., C.O.L.-G., C.R. and A.M. (Alexandra Mocanu); writing—original draft preparation, A.M. (Andrei Moț), O.C.P., V.A.I. and A.-K.L.; writing—review and editing, O.C.P. and V.A.I.; supervision, L.B., C.O., T.D., A.-K.L. and A.S. All authors have read and agreed to the published version of the manuscript.

Funding

This work is part of the project 244/2021 ERANET-BLUEBIO-MARIGREEN, which has received funding from the European Union’s Horizon 2020 research and innovation program under agreement 817992 and the Ministry of Research, Innovation and Digitization, CNCS/CCCDI—UEFISCDI, within PNCDI III.

Institutional Review Board Statement

Not applicable.

Informed Consent Statement

Not applicable.

Data Availability Statement

The original contributions presented in the study are included in the article; further inquiries can be directed to the corresponding author/s.

Conflicts of Interest

The authors declare no conflicts of interest.

References

  1. Ingham, E.R. The Compost Tea Brewing Manual, 5th ed.; Soil Foodweb Incorporated: Corvallis, OR, USA, 2005. [Google Scholar]
  2. Jarboui, R.; Dhouib, B.; Ammar, E. Effect of food waste compost (FWC) and its non-aerated fermented extract (NFCE) on seeds germination and plant growth. Open J. Soil Sci. 2021, 11, 122–138. [Google Scholar] [CrossRef]
  3. Pant, A.P.; Radovich, T.J.K.; Hue, N.V.; Paull, R.E. Biochemical properties of compost tea associated with compost quality and effects on pak choi growth. Sci. Hortic. 2012, 148, 138–146. [Google Scholar] [CrossRef]
  4. Xu, D.B.; Wang, Q.J.; Wu, Y.C.; Yu, G.H.; Shen, Q.R.; Huang, Q.W. Humic-like substances from different compost extracts could significantly promote cucumber growth. Pedosphere 2012, 22, 815–824. [Google Scholar] [CrossRef]
  5. Litterick, A.M.; Harrier, L.; Wallace, P.; Watson, C.A.; Wood, M. The role of uncomposted materials, composts, manures, and compost extracts in reducing pest and disease incidence and severity in sustainable temperate agricultural and horticultural crop production—A review. Crit. Rev. Plant Sci. 2004, 23, 453–479. [Google Scholar] [CrossRef]
  6. Pant, A.P.; Radovich, T.J.K.; Hue, N.V.; Talcott, S.T.; Krenek, K.A. Vermicompost extracts influence growth, mineral nutrients, phytonutrients and antioxidant activity in pak choi (Brassica rapa cv. Bonsai, Chinensis group) grown under vermicompost and chemical fertiliser. J. Sci. Food Agric. 2009, 89, 2383–2392. [Google Scholar] [CrossRef]
  7. Pilla, N.; Tranchida-Lombardo, V.; Gabrielli, P.; Aguzzi, A.; Caputo, M.; Lucarini, M.; Durazzo, A.; Zaccardelli, M. Effect of compost tea in horticulture. Horticulturae 2023, 9, 984. [Google Scholar] [CrossRef]
  8. Scheuerell, S.; Mahaffee, W. Compost tea: Principles and prospects for plant disease control. Compost Sci. Util. 2002, 10, 313–338. [Google Scholar] [CrossRef]
  9. Scheuerell, S.J.; Mahaffee, W.F. Variability associated with suppression of gray mold (Botrytis cinerea) on geranium by foliar applications of nonaerated and aerated compost teas. Plant Dis. 2006, 90, 1201–1208. [Google Scholar] [CrossRef]
  10. St. Martin, C.C.G.; Brathwaite, R.A.I. Compost and compost tea: Principles and prospects as substrates and soil-borne disease management strategies in soil-less vegetable production. Biol. Agric. Hortic. 2012, 28, 1–33. [Google Scholar] [CrossRef]
  11. Pane, C.; Palese, A.M.; Celano, G.; Zaccardelli, M. Effects of compost tea treatments on productivity of lettuce and kohlrabi systems under organic cropping management. Ital. J. Agron. 2014, 9, 153–156. [Google Scholar] [CrossRef]
  12. Pane, C.; Palese, A.M.; Spaccini, R.; Piccolo, A.; Celano, G.; Zaccardelli, M. Enhancing sustainability of a processing tomato cultivation system by using bioactive compost teas. Sci. Hortic. 2016, 202, 117–124. [Google Scholar] [CrossRef]
  13. Samet, M.; Charfeddine, M.; Kamoun, L.; Nouri-Ellouze, O.; Gargouri-Bouzid, R. Effect of compost tea containing phosphogypsum on potato plant growth and protection against Fusarium solani infection. Environ. Sci. Pollut. Res. 2018, 25, 18921–18937. [Google Scholar] [CrossRef] [PubMed]
  14. Weltzien, H.C. Some effects of composted organic materials on plant health. Agric. Ecosyst. Environ. 1989, 27, 439–446. [Google Scholar] [CrossRef]
  15. Marín, F.; Diánez, F.; Santos, M.; Carretero, F.; Gea, F.J.; Castañeda, C.; Navarro, M.J.; Yau, J.A. Control of Phytophthora capsici and Phytophthora parasitica on pepper (Capsicum annuum L.) with compost teas from different sources, and their effects on plant growth promotion. Phytopathol. Mediterr. 2014, 53, 216–228. [Google Scholar]
  16. Meshref, H.A.; Rabie, M.H.; El-Ghamry, A.M.; El-Agamy, M.A. Maximizing utilization of compost addition using foliar compost extract and humic substances in alluvial soil. J. Soil Sci. Agric. Eng. 2010, 1, 957–971. [Google Scholar] [CrossRef]
  17. Ali, O.A.; El-Tahlawy, Y.A.; Abdel-Gwad, S.A. Impact of compost tea types application on germination, nodulation, morphological characters and yield of two lentil cultivars. Egypt. J. Agron. 2018, 40, 1–19. [Google Scholar] [CrossRef]
  18. Arancon, N.Q.; Edwards, C.A.; Dick, R.; Dick, L. Vermicompost tea production and plant growth impacts. Biocycle 2007, 48, 51–52. [Google Scholar]
  19. Naidu, Y.; Meon, S.; Kadir, J.; Siddiqui, Y. Microbial starter for the enhancement of biological activity of compost tea. Int. J. Agric. Biol. 2010, 12, 51–56. [Google Scholar]
  20. Ros, M.; Hurtado-Navarro, M.; Giménez, A.; Fernández, J.A.; Egea-Gilabert, C.; Lozano-Pastor, P.; Pascual, J.A. Spraying agro-industrial compost tea on baby spinach crops: Evaluation of yield, plant quality and soil health in field experiments. Agronomy 2020, 10, 440. [Google Scholar] [CrossRef]
  21. Hegazi, A.Z.; Algharib, A.M. Utilizing compost tea as a nutrient amendment in open filed cowpea seed production system. J. Biodivers. Environ. Sci. 2014, 5, 318–328. [Google Scholar]
  22. Arancon, N.Q.; Pant, A.; Radovich, T.; Hue, N.V.; Potter, J.K.; Converse, C.E. Seed germination and seedling growth of tomato and lettuce as affected by vermicompost water extracts (teas). HortScience 2012, 47, 1722–1728. [Google Scholar] [CrossRef]
  23. Kim, M.J.; Shim, C.K.; Kim, Y.K.; Hong, S.J.; Park, J.H.; Han, E.J.; Kim, J.H.; Kim, S.C. Effect of aerated compost tea on the growth promotion of lettuce, soybean, and sweet corn in organic cultivation. Plant Pathol. J. 2015, 31, 259–268. [Google Scholar] [CrossRef] [PubMed]
  24. Siddiqui, Y.; Meon, S.; Ismail, R.; Rahmani, M.; Ali, A. Bio-efficiency of compost extracts on the wet rot incidence, morphological and physiological growth of okra (Abelmoschus esculentus [(L.) Moench]). Sci. Hortic. 2008, 117, 9–14. [Google Scholar] [CrossRef]
  25. González-Hernández, A.I.; Suárez-Fernández, M.B.; Pérez-Sánchez, R.; Gómez-Sánchez, M.Á.; Morales-Corts, M.R. Compost tea induces growth and resistance against Rhizoctonia solani and Phytophthora capsici in pepper. Agronomy 2021, 11, 781. [Google Scholar] [CrossRef]
  26. Zaccardelli, M.; Pane, C.; Villecco, D.; Palese, A.M.; Celano, G. Compost tea spraying increases yield performance of pepper (Capsicum annuum L.) grown in greenhouse under organic farming system. Ital. J. Agron. 2018, 13, 229–234. [Google Scholar] [CrossRef]
  27. González-Hernández, A.I.; Pérez-Sánchez, R.; Plaza, J.; Morales-Corts, M.R. Compost tea as a sustainable alternative to promote plant growth and resistance against Rhizoctonia solani in potato plants. Sci. Hortic. 2022, 300, 111090. [Google Scholar] [CrossRef]
  28. López-Martín, J.J.; Morales-Corts, M.R.; Pérez-Sánchez, R.; Gómez-Sánchez, M.Á. Efficiency of garden waste compost teas on potato growth and its suppressiveness against Rhizoctonia. Agric. For. 2018, 64, 7. [Google Scholar]
  29. Edwards, C.A.; Arancon, N.Q.; Greytak, S. Effects of vermicompost teas on plant growth and disease. Biocycle 2006, 47, 28–29. [Google Scholar]
  30. González-Hernández, A.I.; Gómez-Sánchez, M.Á.; Pérez-Sánchez, R.; Morales-Corts, M.R. Garden waste compost tea: A horticultural alternative to promote plant growth and root traits in tomato (Solanum lycopersicum L.) plants. Horticulturae 2023, 9, 1127. [Google Scholar] [CrossRef]
  31. Morales-Corts, M.R.; Pérez-Sánchez, R.; Gómez-Sánchez, M.A. Efficiency of garden waste compost teas on tomato growth and its suppressiveness against soilborne pathogens. Sci. Agric. 2018, 75, 400–409. [Google Scholar] [CrossRef]
  32. Dionne, A.; Tweddell, R.J.; Antoun, H.; Avis, T.J. Effect of non-aerated compost teas on damping-off pathogens of tomat. Can. J. Plant Pathol. 2012, 34, 51–57. [Google Scholar] [CrossRef]
  33. Ramírez-Gottfried, R.I.; Preciado-Rangel, P.; Carrillo, M.G.; García, A.B.; González-Rodríguez, G.; Espinosa-Palomeque, B. Compost tea as organic fertilizer and plant disease control: Bibliometric analysis. Agronomy 2023, 13, 2340. [Google Scholar] [CrossRef]
  34. Ahuja, I.; Dauksas, E.; Remme, J.F.; Richardsen, R.; Løes, A.K. Fish and fish waste-based fertilizers in organic farming—With status in Norway: A review. Waste Manag. 2020, 115, 95–112. [Google Scholar] [CrossRef]
  35. Illera-Vives, M.; Labandeira, S.S.; Brito, L.M.; López-Fabal, A.; López-Mosquera, M.E. Evaluation of compost from seaweed and fish waste as a fertilizer for horticultural use. Sci. Hortic. 2015, 186, 101–107. [Google Scholar] [CrossRef]
  36. Illera-Vives, M.; Seoane Labandeira, S.; Iglesias Loureiro, L.; López-Mosquera, M.E. Agronomic assessment of a compost consisting of seaweed and fish waste as an organic fertilizer for organic potato crops. J. Appl. Phycol. 2017, 29, 1663–1671. [Google Scholar] [CrossRef]
  37. Moloșag, A.; Pârvulescu, O.C.; Ion, V.A.; Asănică, A.C.; Soane, R.; Moț, A.; Dobrin, A.; Frîncu, M.; Løes, A.-K.; Cabell, J.; et al. Effects of marine residue-derived fertilizers on strawberry growth, nutrient content, fruit yield and quality. Agronomy 2023, 13, 1221. [Google Scholar] [CrossRef]
  38. Cabell, J.; Løes, A.-K. Blue Biomass Composting Technology; Report, No. 4; Norwegian Centre for Organic Agriculture (NORSØK): Tingvoll, Norway, 2023; Volume 8, Available online: https://orgprints.org/id/eprint/50477/ (accessed on 8 July 2024).
  39. Løes, A.-K.; Ahuja, I.; de Boer, A.; Rittl, T. Fertilisation Effects of Marine-Derived Residual Materials on Agricultural Crops; Report, No. 13; Norwegian Centre for Organic Agriculture (NORSØK): Tingvoll, Norway, 2022; Volume 7, Available online: https://orgprints.org/id/eprint/45330/ (accessed on 8 July 2024).
  40. Dima, A.D.; Pârvulescu, O.C.; Mateescu, C.; Dobre, T. Optimization of substrate composition in anaerobic co-digestion of agricultural waste using central composite design. Biomass Bioenerg. 2020, 138, 105602. [Google Scholar] [CrossRef]
  41. Calcan, S.I.; Pârvulescu, O.C.; Ion, V.A.; Răducanu, C.E.; Bădulescu, L.; Dobre, T.; Egri, D.; Moț, A.; Popa, V.; Crăciun, M.E. Valorization of vine prunings by slow pyrolysis in a fixed-bed reactor. Processes 2022, 10, 37. [Google Scholar] [CrossRef]
  42. Calcan, S.I.; Pârvulescu, O.C.; Ion, V.A.; Răducanu, C.E.; Bădulescu, L.; Madjar, R.; Dobre, T.; Egri, D.; Moț, A.; Iliescu, L.M.; et al. Effects of biochar on soil properties and tomato growth. Agronomy 2022, 12, 1824. [Google Scholar] [CrossRef]
  43. Egri, D.; Pârvulescu, O.C.; Ion, V.A.; Răducanu, C.E.; Calcan, S.I.; Bădulescu, L.; Madjar, R.; Orbeci, C.; Dobre, T.; Moț, A.; et al. Vine pruning-derived biochar for agronomic benefits. Agronomy 2022, 12, 2730. [Google Scholar] [CrossRef]
  44. Sharples, G.C.; Kuehl, R.O. Lettuce seed weight and size in relation to germination and seedling radicle growth. HortScience 1974, 9, 582–584. [Google Scholar] [CrossRef]
  45. Kader, M.A. A comparison of seed germination calculation formulae and the associated interpretation of resulting data. J. Proc. R. Soc. N. S. W. 2005, 138, 65–75. [Google Scholar] [CrossRef]
  46. Maguire, J.D. Speed of germination—Aid in selection and evaluation for seedling emergence and vigor. Crop. Sci. 1962, 2, 176–177. [Google Scholar] [CrossRef]
  47. Šerá, B. Methodological contribution on seed germination and seedling initial growth tests in wild plants. Not. Bot. Horti Agrobot. Cluj Napoca 2023, 51, 13164. [Google Scholar] [CrossRef]
  48. Pasztor, R.; Bala, M.; Sala, F. Flowers quality in relation to planting period in some Hyacinth cultivars. AgroLife Sci. J. 2020, 9, 263–272. [Google Scholar]
  49. Drăghici-Popa, A.M.; Boscornea, A.C.; Brezoiu, A.M.; Tomas, Ș.T.; Pârvulescu, O.C.; Stan, R. Effects of extraction process factors on the composition and antioxidant activity of blackthorn (Prunus spinosa L.) fruit extracts. Antioxidants 2023, 12, 1897. [Google Scholar] [CrossRef] [PubMed]
  50. Nasri, N.; Kaddour, R.; Rabhi, M.; Plassard, C.; Lachaal, M. Effect of salinity on germination, phytase activity and phytate content in lettuce seedling. Acta Physiol. Plant. 2011, 33, 935–942. [Google Scholar] [CrossRef]
  51. Uçarlı, C. Effects of salinity on seed germination and early seedling stage. Abiotic Stress Plants 2020, 211, 105772. [Google Scholar]
  52. Rosas, J.T.F.; Junior, E.M.; Lorenzoni, R.M.; dos Santos, F.F.L.; Martins, R.N. Effect of salinity on germination of lettuce cultivars produced in Brazil. J. Exp. Agric. Int. 2019, 34, 1–8. [Google Scholar] [CrossRef]
  53. Ünlükara, A.; Cemek, B.; Karaman, S.; Erşahin, S. Response of lettuce (Lactuca sativa var. crispa) to salinity of irrigation water. N. Z. J. Crop Hortic. Sci. 2008, 36, 265–273. [Google Scholar] [CrossRef]
  54. Ünlükara, A.; Kurunç, A.; Kesmez, G.D.; Yurtseven, E. Growth and evapotranspiration of okra (Abelmoschus esculentus L.) as influenced by salinity of irrigation water. J. Irrig. Drain. Eng. 2008, 134, 160–166. [Google Scholar] [CrossRef]
  55. Munns, R. Comparative physiology of salt and water stress. Plant Cell Environ. 2002, 25, 239–250. [Google Scholar] [CrossRef]
  56. Karimmojeni, H.; Rashidi, B.; Behrozi, D. Effect of different treatments on dormancy-breaking and germination of perennial pepperweed (Lepidium latifolium) (Brassicaceae). Aust. J. Agric. Eng. 2011, 2, 50–55. [Google Scholar]
  57. Martínez-Ballesta, M.D.C.; Egea-Gilabert, C.; Conesa, E.; Ochoa, J.; Vicente, M.J.; Franco, J.A.; Bañon, S.; Martínez, J.J.; Fernández, J.A. The importance of ion homeostasis and nutrient status in seed development and germination. Agronomy 2020, 10, 504. [Google Scholar] [CrossRef]
  58. Wen, D.; Xu, H.; Xie, L.; He, H.; Hou, H.; Zhang, C. A loose endosperm structure of wheat seed produced under low nitrogen level promotes early germination by accelerating water uptake. Sci. Rep. 2017, 7, 3116. [Google Scholar] [CrossRef] [PubMed]
  59. White, P.J.; Veneklaas, E.J. Nature and nurture: The importance of seed phosphorus content. Plant Soil 2012, 357, 1–8. [Google Scholar] [CrossRef]
  60. Sathiyavani, E.; Prabaharan, N.K.; Surendar, K.K. Role of mineral nutrition on root growth of crop plants–A review. Int. J. Curr. Microbiol. Appl. Sci. 2017, 6, 2810–2837. [Google Scholar]
  61. Xu, X.; Du, X.; Wang, F.; Sha, J.; Chen, Q.; Tian, G.; Zhu, Z.; Ge, S.; Jiang, Y. Effects of potassium levels on plant growth, accumulation and distribution of carbon, and nitrate metabolism in apple dwarf rootstock seedlings. Front. Plant Sci. 2020, 11, 904. [Google Scholar] [CrossRef]
  62. Djidonou, D.; Leskovar, D.I. Seasonal changes in growth, nitrogen nutrition, and yield of hydroponic lettuce. HortScience 2019, 54, 76–85. [Google Scholar] [CrossRef]
  63. Niu, F.; Zhang, D.; Li, Z.; Van Iersel, M.W.; Alem, P. Morphological response of eucalypts seedlings to phosphorus supply through hydroponic system. Sci. Hortic. 2015, 194, 295–303. [Google Scholar] [CrossRef]
  64. Yap, M.Y.; Lim, M.W.; Brendan, L.K.W. Influence of calcium macronutrient on tip burn occurrence in hydroponically cultivated lettuces. IOP Conf. Ser. Mater. Sci. Eng. 2022, 1257, 012003. [Google Scholar] [CrossRef]
  65. Jones, J.B., Jr. Hydroponics: A Practical Guide for the Soilless Grower, 2nd ed.; CRC Press: Boca Raton, FL, USA, 2005. [Google Scholar]
  66. Rouphael, Y.; Colla, G.; Bernardo, L.; Kane, D.; Trevisan, M.; Lucini, L. Zinc excess triggered polyamines accumulation in lettuce root metabolome, as compared to osmotic stress under high salinity. Front. Plant Sci. 2016, 7, 842. [Google Scholar] [CrossRef] [PubMed]
  67. Kaur, H.; Garg, N. Zinc toxicity in plants: A review. Planta 2021, 253, 129. [Google Scholar] [CrossRef] [PubMed]
Figure 1. Fresh marine residues: (a) rockweed (A. nodosum) filter cake; (b) acidified fish sediment [38,39].
Agronomy 14 01919 g001
Figure 2. Windrow consisting of rockweed (A. nodosum) filter cake, acidified fish sediment, woodchips, cattle bedding material, and horse manure [38].
Agronomy 14 01919 g002
Figure 3. Compost obtained by composting rockweed (A. nodosum) filter cake, acidified fish sediment, woodchips, cattle bedding material, and horse manure (a) and derived non-aerated compost tea (CT) (b).
Agronomy 14 01919 g003
Figure 4. Schematic representation of Petri dishes for a treatment, using 4 replicates per treatment (A and B in a dish, C and D in the other dish) and 50 seeds per replicate.
Agronomy 14 01919 g004
Figure 5. Samples of lettuce seedlings (10 days after sowing) for different treatments: (T0) 100% ultrapure water (control); (T1) 25% CT + 75% ultrapure water; (T2) 50% CT + 50% ultrapure water; (T3) 100% CT.
Agronomy 14 01919 g005
Figure 6. Projections of variables (EC, pH, DM, Ash, C, N, P, K, Ca, Mg, Cu, Fe, Mn, Mo, and Zn) and samples (CT1, CT2, …, CT12) on the factor-plane PC1–PC2. EC: electrical conductivity; DM: dry matter concentration; Ash: ash concentration; C: carbon concentration; N: nitrogen concentration; P: phosphorus concentration; K: potassium concentration; Ca: calcium concentration; Mg: magnesium concentration; Cu: copper concentration; Fe: iron concentration; Mn: manganese concentration; Mo: molybdenum concentration; Zn: zinc concentration; CT: compost tea.
Agronomy 14 01919 g006
Figure 7. Lettuce seedlings (10 days after sowing) for different treatments: (T0) 100% ultrapure water (control); (T1) 25% CT + 75% ultrapure water; (T2) 50% CT + 50% ultrapure water; (T3) 100% CT. Two Petri dishes were used for each treatment with two replicates (50 seeds per replicate) per dish (A and B in a dish, C and D in the other dish).
Agronomy 14 01919 g007
Figure 8. Characteristic variables (mean values ± SD) of lettuce seed germination and seedling growth vs. nitrogen concentration (N) in different CT treatments: (T0) 100% ultrapure water (control); (T1) 25% CT + 75% ultrapure water; (T2) 50% CT + 50% ultrapure water; (T3) 100% CT. GP: germination percentage; MGT: mean germination time; GS: germination speed; SL: seedling length; SVI: seedling vigor index; SM: seedling mass; RL: root length; LA: total leaf surface area.
Agronomy 14 01919 g008aAgronomy 14 01919 g008b
Table 1. Levels of dimensional and dimensionless fermentation factors.
RunRLS (g/g)t (Days)X1X2
1 55−1−1
2 59−11
3951−1
49911
57700
67700
74.27−1.4140
89.871.4140
974.20−1.414
1079.801.414
117700
127700
Table 2. Indicators of position and variability of CT properties measured in triplicate.
VariableIndicator
SymbolUnitsMinimum Value (MIN)Maximum Value (MAX)Mean Value (m)Standard Deviation (SD)
ECdS/m7.38618.0811.742.781
pH-7.7778.2957.9960.163
DM%0.7212.6861.5140.517
Ash%0.5471.7510.9730.314
C%0.0900.5940.3010.138
N%0.0070.0410.0210.009
C/Nkg/kg13.5816.9414.570.552
P%0.0160.0620.0300.013
K%0.2260.7000.4060.113
Camg/kg70.53805.1264.1237.9
Mgmg/kg37.41258.6110.856.05
Cumg/kg0.0370.3030.1330.063
Femg/kg9.83325.3316.214.523
Mnmg/kg0.0980.6960.2800.199
Momg/kg0.0070.0560.0360.013
Znmg/kg0.3352.8951.1170.640
EC: electrical conductivity; DM: dry matter concentration; Ash: ash concentration; C: carbon concentration; N: nitrogen concentration; P: phosphorus concentration; K: potassium concentration; Ca: calcium concentration; Mg: magnesium concentration; Cu: copper concentration; Fe: iron concentration; Mn: manganese concentration; Mo: molybdenum concentration; Zn: zinc concentration.
Table 3. Comparison with the data reported in the related literature.
VariableZaccardelli et al. [26]Samet et al.
[13]
Morales-Corts et al. [31]González-Hernández et al. [25,27,30]Jarboui et al.
[2]
Xu et al.
[4]
This Study
EC (dS/m)4.778 ± 0.5007.612.6 ± 0.11.2 ± 0.13.12 ± 0.01-11.74 ± 2.78
pH7.60 ± 0.168.007.81 ± 0.157.16 ± 0.156.93 ± 0.12-7.80 ± 0.16
N (%)-0.002 ± 0.000--0.006 ± 0.0000.0320.021 ± 0.009
C/N---7.1 ± 0.2--14.57 ± 0.55
P (mg/kg)-2.170 ± 0.254---239301.5 ± 125.2
K (%)0.142 ± 0.0230.188 ± 0.018---0.1080.406 ± 0.113
Ca (mg/kg)21.8 ± 1.9164.5 ± 34.350 ± 23280 ± 17--264.1 ± 237.9
Mg (mg/kg)37.8 ± 3.187.35 ± 15.5927.5 ± 16.020 ± 14--110.8 ± 56.1
Cu (mg/kg)0.16 ± 0.02-0.308 ± 0.047---0.133 ± 0.063
Fe (mg/kg)-3.746 ± 0.3859.8 ± 2.1---16.21 ± 4.52
Mn (mg/kg)0.45 ± 0.01-0.059 ± 0.019---0.280 ± 0.199
Zn (mg/kg)0.15 ± 0.01-0.266 ± 0.025---1.117 ± 0.640
Compost
feedstock
Agro-
industrial residues
Olive residues and coffee groundsGarden wasteGarden wasteFruit and vegetable wastePig manure and rice strawRockweed and fish residues
Fermentation conditionst = 7 days
with aeration
RLS = 5 g/g
t = 7 days
with aeration
20 °C
RLS = 5 L/L
t = 14 days
with aeration
20 °C
RLS = 5 L/L
t = 5 days
with aeration
25 °C
RLS = 8 g/g
t = 7 days
without aeration
20–25 °C
RLS = 8 g/g
t = 7 days
without aeration
20 °C
RLS = 4.2–9.8 g/g
t = 4.2–9.8 days
without aeration
EC: electrical conductivity; C: carbon concentration; N: nitrogen concentration; P: phosphorus concentration; K: potassium concentration; Ca: calcium concentration; Mg: magnesium concentration; Cu: copper concentration; Fe: iron concentration; Mn: manganese concentration; Zn: zinc concentration; variables are expressed as mean values ± SD and/or ranges of values (MINMAX); RLS: liquid/solid ratio; t: fermentation temperature.
Table 4. Factor loadings.
No.VariablePrincipal Component
NameSymbolPC1PC2
1Electrical conductivityEC0.88−0.27
2pHpH0.460.82
3Dry matter concentrationDM0.98−0.19
4Ash concentrationAsh0.96−0.13
5Carbon concentrationC0.95−0.20
6Nitrogen concentrationN0.96−0.18
7Phosphorus concentrationP0.990.03
8Potassium concentrationK0.91−0.24
9Calcium concentrationCa0.930.29
10Magnesium concentrationMg0.97−0.12
11Copper concentrationCu0.83−0.05
12Iron concentrationFe0.720.49
13Manganese concentrationMn0.920.31
14Molybdenum concentrationMo0.81−0.27
15Zinc concentrationZn0.790.23
Significant values of factor loadings are highlighted in bold.
Table 5. Correlation matrix.
VariableECpHDMAshCNPKCaMgCuFeMnMoZn
EC1.0000.2300.9300.9700.8210.8120.8950.9890.7490.8620.6260.5040.6820.6800.598
pH0.2301.0000.3060.3580.2710.2780.4780.2690.6180.3240.3940.6670.6510.1820.469
DM0.9300.3061.0000.9750.9700.9670.9700.9490.8530.9770.7970.6260.8350.8220.708
Ash0.9700.3580.9751.0000.8980.8930.9600.9720.8660.9310.7180.6300.8200.7540.719
C0.8210.2710.9700.8981.0000.9990.9250.8570.8070.9750.8460.6190.8250.8640.673
N0.8120.2780.9670.8930.9991.0000.9280.8490.8160.9750.8440.6340.8320.8590.684
P0.8950.4780.9700.9600.9250.9281.0000.9170.9370.9600.7830.7310.9140.7450.769
K0.9890.2690.9490.9720.8570.8490.9171.0000.7710.8980.6890.5420.7180.7050.621
Ca0.7490.6180.8530.8660.8070.8160.9370.7711.0000.8600.7000.7750.9710.6400.860
Mg0.8620.3240.9770.9310.9750.9750.9600.8980.8601.0000.8080.7040.8410.7770.696
Cu0.6260.3940.7970.7180.8460.8440.7830.6890.7000.8081.0000.4950.7920.7400.562
Fe0.5040.6670.6260.6300.6190.6340.7310.5420.7750.7040.4951.0000.7290.4080.568
Mn0.6820.6510.8350.8200.8250.8320.9140.7180.9710.8410.7920.7291.0000.6750.836
Mo0.6800.1820.8220.7540.8640.8590.7450.7050.6400.7770.7400.4080.6751.0000.665
Zn0.5980.4690.7080.7190.6730.6840.7690.6210.8600.6960.5620.5680.8360.6651.000
EC: electrical conductivity; DM: dry matter concentration; Ash: ash concentration; C: carbon concentration; N: nitrogen concentration; P: phosphorus concentration; K: potassium concentration; Ca: calcium concentration; Mg: magnesium concentration; Cu: copper concentration; Fe: iron concentration; Mn: manganese concentration; Mo: molybdenum concentration; Zn: zinc concentration. Values in bold of correlation coefficient (r) are different from 0 with a significance level α = 0.05.
Table 6. Mean experimental values (corresponding to triplicate measurements) of fermentation process responses (Yj,m, j = 1, …, 8) and related values of regression coefficients, determination coefficient (Rj2), F statistic (Fj), and pj-value for Fj at different levels of dimensionless process factors.
RunX1X2Yj,m
j = 1j = 2j = 3j = 4j = 5j = 6j = 7j = 8
ECm
(dS/m)
pHmDMm
(%)
Ashm
(%)
Cm
(%)
Nm
(%)
Pm
(%)
Km
(%)
1−1−115.168.0782.3121.4600.5020.0350.0520.532
2−1113.327.9201.2811.0010.1530.0100.0240.443
31−19.3808.1641.3400.8120.2890.0200.0280.323
4117.4128.2250.7250.5530.0930.0070.0170.233
50011.757.8151.4710.9320.2960.0200.0270.388
60011.658.0171.5640.9760.3280.0220.0300.393
7−1.414018.018.2852.6801.7150.5890.0400.0590.684
81.41408.6157.7851.0850.6750.2290.0160.0160.296
90−1.41411.657.9981.5400.9210.3300.0230.0300.413
1001.41410.127.9801.0470.7290.1470.0100.0230.338
110011.907.7831.5700.9250.3360.0230.0290.421
120011.937.8971.5580.9720.3250.0220.0280.412
a0j11.817.8781.5410.9510.3210.0220.0280.403
a1j−3.121−0.040−0.473−0.321−0.100−0.007−0.011−0.121
a11j0.5560.1000.1280.1080.0280.0020.0040.031
a2j−0.746−0.015−0.293−0.124−0.100−0.007−0.006−0.036
a22j−0.6550.077−0.167−0.076−0.057−0.004−0.001−0.026
a12j−0.0320.0550.1040.0500.0380.0030.004−0.000
Rj20.9790.3600.9210.9560.8800.8770.8770.942
Fj54.870.67514.0326.128.8118.5888.56419.65
pj0.0000.6580.0030.0010.0100.0100.0110.001
EC: electrical conductivity; DM: dry matter concentration; Ash: ash concentration; C: carbon concentration; N: nitrogen concentration; P: phosphorus concentration; K: potassium concentration. Statistically significant regression coefficients are highlighted in bold.
Table 7. Mean experimental values (corresponding to triplicate measurements) of fermentation process responses (Yj,m, j = 9, …, 15) and related values of regression coefficients, determination coefficient (Rj2), F statistic (Fj), and pj-value for Fj at different levels of dimensionless process factors.
RunX1X2Yj,m
j = 9j = 10j = 11j = 12j = 13j = 14j = 15
Cam
(mg/kg)
Mgm
(mg/kg)
Cum
(mg/kg)
Fem
(mg/kg)
Mnm
(mg/kg)
Mom
(mg/kg)
Znm
(mg/kg)
1−1−1779.7198.10.17923.710.6580.0532.509
2−11141.756.720.05610.060.1060.0321.092
31−1326.983.520.18812.590.4480.0421.564
411134.338.630.05021.000.1490.0200.770
500150.6108.60.11813.480.1820.0320.726
600231.8120.50.13115.490.2550.0370.820
7−1.4140759.7240.10.26525.160.6920.0532.029
81.414085.6480.340.09612.570.1160.0310.967
90−1.414173.7114.80.14115.320.2170.0390.861
1001.414154.464.730.08414.430.1870.0080.430
1100122.0115.30.13314.920.1760.0410.870
1200108.2107.90.15315.770.1780.0430.761
a0j153.2113.10.13414.910.1980.0380.794
a1j−176.7−44.83−0.029−2.250−0.123−0.007−0.346
a11j147.815.890.0161.9670.1130.0030.455
a2j−107.3−32.14−0.043−0.812−0.112−0.011−0.353
a22j18.51−19.34−0.018−0.0270.011−0.0060.028
a12j111.424.12−0.0035.5170.0630.0000.156
Rj20.8090.8690.6600.8150.6930.9430.833
Fj5.0807.9932.3265.2822.70820.016.005
pj0.0360.0130.1670.0330.1290.0010.025
Ca: calcium concentration; Mg: magnesium concentration; Cu: copper concentration; Fe: iron concentration; Mn: manganese concentration; Mo: molybdenum concentration; Zn: zinc concentration. Statistically significant regression coefficients are highlighted in bold.
Table 8. Predicted and experimental values of fermentation responses under optimal process conditions.
jVariableOptimal ValuePercentage
Prediction Error
SymbolUnitsPredictedExperimental
Yj,pr,optYj,m,opt ± SDjεj (%)
1ECdS/m17.5016.92 ± 1.51−3.4
2pH-8.2398.463 ± 0.3592.7
3DM%2.6942.658 ± 0.227−1.3
4Ash%1.7211.755 ± 0.1002.0
5C%0.5990.606 ± 0.0321.2
6N%0.0420.041 ± 0.002−1.9
7P%0.0590.060 ± 0.0011.8
8K%0.6490.628 ± 0.038−3.3
9Camg/kg895.2887.8 ± 14.3−0.8
10Mgmg/kg245.5249.0 ± 7.61.4
11Cumg/kg0.2250.232 ± 0.0423.0
12Femg/kg28.1029.34 ± 3.184.2
13Mnmg/kg0.7460.720 ± 0.053−3.5
14Momg/kg0.0590.058 ± 0.002−1.8
15Znmg/kg2.6132.516 ± 0.116−3.8
EC: electrical conductivity; DM: dry matter concentration; Ash: ash concentration; C: carbon concentration; N: nitrogen concentration; P: phosphorus concentration; K: potassium concentration; Ca: calcium concentration; Mg: magnesium concentration; Cu: copper concentration; Fe: iron concentration; Mn: manganese concentration; Mo: molybdenum concentration; Zn: zinc concentration.
Table 9. Mean values of relevant variables of lettuce seed germination and seedling growth.
VariableTreatment
T0T1T2T3
Germination percentage, GP (%)98 a97 a97 a73 b
Mean germination time, MGT (day)1.2 d1.6 c2.2 b5.2 a
Germination speed, GS (day−1)44.5 a34.7 b25.5 c7.9 d
Seedling length, SL (cm)3.92 b4.95 a3.75 b1.98 c
Seedling vigor index (SVI) (cm)3.84 b4.79 a3.63 b1.47 c
Seedling mass, SM (g)0.30 b0.37 a0.33 b0.11 c
Root length, RL (cm)3.18 a3.80 a2.21 b0.75 c
Total leaf surface area, LA (cm2)0.29 c0.48 a0.35 b0.10 d
(T0) 100% ultrapure water (control); (T1) 25% CT + 75% ultrapure water; (T2) 50% CT + 50% ultrapure water; (T3) 100% CT. Different letters indicate a significant difference between treatments.
Table 10. Mean values of nutrient concentrations in diluted and undiluted CT.
No.VariableTreatment
SymbolUnitsT1T2T3
1Nmg/kg102.5205.0410.0
2Pmg/kg150.0300.0600.0
3Kmg/kg157031406280
4Camg/kg222.0443.9887.8
5Mgmg/kg62.25124.5249.0
6Cumg/kg0.0580.1160.232
7Femg/kg7.33514.6729.34
8Mnmg/kg0.1800.3600.720
9Momg/kg0.0150.0290.058
10Znmg/kg0.6291.2582.516
N: nitrogen concentration; P: phosphorus concentration; K: potassium concentration; Ca: calcium concentration; Mg: magnesium concentration; Cu: copper concentration; Fe: iron concentration; Mn: manganese concentration; Mo: molybdenum concentration; Zn: zinc concentration. (T1) 25% CT + 75% ultrapure water; (T2) 50% CT + 50% ultrapure water; (T3) 100% CT.
Disclaimer/Publisher’s Note: The statements, opinions and data contained in all publications are solely those of the individual author(s) and contributor(s) and not of MDPI and/or the editor(s). MDPI and/or the editor(s) disclaim responsibility for any injury to people or property resulting from any ideas, methods, instructions or products referred to in the content.

