Abstract
In rainfed lowlands and water-saving cultivation systems, rice plants are often exposed to soil moisture fluctuation (SMF). Improving yield as well as grain quality is the main target for breeding under water-stressed environments. This study investigated the effects of different water treatment on yield, growth parameters, and grain quality under field conditions in Japan for 2 years. Two rice genotypes, Nipponbare (japonica) and G3-3 (derived from Nipponbare and KDML105, indica), were grown under continuous waterlogging (CWL) and SMF conditions. As the grain quality characteristics, grain appearance, dimension, and taste parameters were evaluated as well as yield and yield components. SMF reduced the yield, and G3-3 showed a higher yield than Nipponbare under SMF, which was attributed to the higher number of spikelets per panicle. G3-3 showed a better taste score (mark) with lower protein and amylose contents compared to Nipponbare. However, G3-3 had a higher percentage of broken grains, indicating a trade-off in grain quality traits. Non-structural carbohydrate dynamics may be involved as one of the grain quality characteristics. G3-3 demonstrated a superior yield under SMF conditions and have potential to show superior grain quality, indicating that the introgressed segments of G3-3 may be responsible for the grain quality traits associated with root plasticity.
1. Introduction
Rice is an important staple food for almost half of the world’s population, and its demand is expected to continue to increase in the future. Rice is grown in various agro-ecosystems defined by different water regimes, including irrigated lowlands, rainfed lowlands, uplands, and flood-prone areas [1]. The rainfed lowland occupies large area in Southeast Asia which comprise almost 30% of the world rice harvest. [2]. Rice production in rainfed lowlands encounters low soil fertility and droughts and flooding damage, resulting generally low yield with a mean of 2.5 t ha−1 [2]. The frequency of droughts and floodings leads to the soil moisture fluctuation (SMF), which is characterized by an alternate recurrence of anaerobic (waterlogged/flooding) and aerobic (drought) conditions [3]. SMF is also observed in water-saving cultivation systems such as alternate wetting and drying (AWD) [4,5,6]. It has been reported that most AWD treatments cause yield reduction [4,5]. On the other hands, the studies on the effect of AWD showed the significant increase of yield by AWD compared to conventional cultivation method [6,7]. The impact of SMF is complex and different from the one caused by single drought or flooding, and should be emphasized in crop production.
Improving grain quality and yield is the main goal for breeding in water-stressed environments [8]. Notably, the market price of rice is primarily influenced by grain size and quality, and has been an increasing demand for high-quality rice due to global improvement in living standards [9]. Grain quality is a quantitative trait influenced by several factors, including physical appearance, milling quality, nutritional content, aroma, and cooking and eating characteristics [9,10]. Importantly, these factors vary depending on the variety, environmental stress, and soil characteristics [11,12,13]. Generally, a tradeoff exists between grain quality and rice yield, and high-quality rice varieties often have low grain yield [14]. Moreover, recent climate change-associated events, such as high temperature and drought conditions, have exacerbated plant damage [15]. Therefore, strategies for simultaneous improvements of rice yield and quality are necessary.
Khao Dawk Mali 105 (KDML105), an indica variety from Northeastern Thailand, is well adapted to rainfed lowland conditions owing to its exceptional root plasticity [16,17,18]. Additionally, KDML105 rice, internationally known as “Jasmine Rice”, is a popular Thai rice cultivar with desirable characteristics, including good aroma, long-grain, low amylose content, and soft texture [19]. Due to its special quality and global demand, several studies have been conducted to improve the yield of KDML105 under biotic and abiotic stresses such as submergence and the brown plant hopper [20], and drought [21].
In our previous study, we developed a promising set of backcross inbred lines (BILs) derived from Nipponbare (japonica, the recurrent parent) and KDML 105 (indica, the donor parent) using marker-assisted selection [22]. Among the BILs, G3-3 tended to show a higher adaptation to SMF, with a higher root plasticity than the SMF-sensitive variety Nipponbare [22]. Although G3-3 is potentially highly adaptable to SMF under rainfed lowland conditions or water-saving cultivation, its grain quality has not yet been evaluated. It has been reported that grain quality was positively and strongly correlated with root traits under water deficit conditions [23]. Furthermore, maintained root activity can improve the grain appearance quality and palatability [11].
We hypothesized that the grain quality will be significantly affected with water treatment and root plasticity may be involved the good grain quality characteristics. The objective of this study is to evaluate the effect of different water treatments (CWL and SMF) on yield, growth parameters, and grain quality. We evaluated two rice genotypes, Nipponbare (sensitive) and G3-3 (tolerance), with contrasting SMF responses under field conditions in Japan. We intended to focus on the grain quality characteristics (appearance, dimension, and taste parameters), which has not yet been evaluated. The results of this study would provide useful information for rice breeding to improve both yield and quality under SMF in rainfed lowland or water-saving cultivation.
2. Materials and Methods
2.1. Experimental Site
Field experiments were conducted at Togo Field, Field Science Center, Graduate School of Bioagricultural Sciences, Nagoya University, Togo-cho, Aichi, Japan (35°6′42″ N, 137°4′57″ E) from June to October in 2022 and 2023.
2.2. Plant Materials
G3-3, the BIL (BC3F3) derived from Nipponbare (japonica, recurrent parent), and KDML 105 (indica, donor parent) crosses previously reported [22] (Figure S1) and the parents’ Nipponbare were used in this study.
2.3. Experimental Design
The study was designed in a split-plot with two factors (water treatment as main plot and variety as the sub-plot) with three replicates in 2022 and five replicates in 2023. The size of each plot was 1.2 m × 1.0 m (6 rows and 5 plants per row). The hill spacing was 20 × 20 cm, with one seedling per hill.
Pre-germinated seeds of Nipponbare and G3-3 were sown in seedling trays in a glasshouse, and 23-day-old seedlings in 2022 and 25-day-old seedlings in 2023 were transplanted on 17 June 2022 and 13 June 2023. The transplanted seedlings were grown under two soil moisture conditions: continuous waterlogging (CWL; control) and soil moisture fluctuation (SMF). Under SMF, the field was first waterlogged for approximately 2 weeks for plant establishment and then allowed to drain. Irrigation was performed at 45, 51, and 54 days after transplanting (DAT) in 2022 and 42 and 55 DAT in 2023 because of small rainfall.
During the experiments, the air temperature was monitored using a thermorecorder (TR-72nw; T&D Co., Tokyo, Japan). Daily rainfall data were collected from the Japan Meteorological Agency. Under SMF conditions, the soil moisture content (SMC) at 5, 10, and 15 cm depths from the soil surface was monitored using soil moisture sensors (ECH2O EC-5 and 10HS, METER, Salt Lake, UT, USA) connected to a data logger (ZL6 Basic, METER, Salt Lake, UT, USA). Due to an insufficient number of sensors, SMC at a depth of 10 cm, which is between the 5 cm and 15 cm depths used in 2022, was measured in 2023.
2.4. Analyzed Variables
Plant height, number of tillers, and SPAD values (SPAD-502 PLUS, Konica Minolta Co., Tokyo, Japan) were measured at 0, 19, 35, 46, 60, and 77 DAT in 2022 and at 23, 41, 55, and 73 DAT in 2023. For SPAD value measurements, the uppermost fully expanded leaves on the main stem were recorded and 3 readings at around the midpoint of leaf blade were averaged.
Plants were harvested at the post-heading and maturity stages as follows: at post-heading, 68 DAT in 2022, 66 DAT under CWL, and 73 DAT under SMF in 2023; at maturity, 123 DAT in 2022, 112 DAT under CWL, and 119 DAT under SMF in 2023. At harvest, the plants were cut at the stem base and separated into panicles, leaf blades, and stems (leaf sheaths and culms). Leaf blades and stems were oven-dried at 70 °C for 3 days to measure the dry weight. Stem samples were milled using a grinder (WB-1, Osaka Chemical Co., Ltd., Osaka, Japan) and the nonstructural carbohydrate (NSC) content of the stem samples was measured using the gravimetric method [24].
Panicles were counted and sun-dried for approximately one month to measure the dry weight. Thereafter, spikelets were removed from the panicles by manual threshing and the filled and unfilled spikelets were separated by submerging them in tap water and counted using a seed counter (RC-2501, Nippon Plant Seeder, Co., Ltd., Tokyo, Japan). Additionally, the moisture content of filled grains was measured using a grain moisture tester (Riceter f, Kett Electric Laboratory, Tokyo, Japan). The yield components were determined using number of panicles, number of spikelets per panicle, spikelet fertility, and 1000-grain weight. Filled grain weight was converted to 14% moisture content using the formula for conversion [25].
A number of 8–15 hills were selected in each plot based on the average plant height and SPAD value and panicle number. The number of hills was decided depending on the plant growth to collect enough brown rice for taste analysis. After dehulling, brown filled grains were manually sorted into perfect, pecky, chalky, and broken grains using a 1.8 mm mesh sieve. Approximately 12 g (considering 500 grains) of perfect rice was sampled to assess grain appearance using a grain scanner (RSQI 10A, Satake, Hiroshima, Japan). Thereafter, brown filled grains were milled using a grinder (WB-1, Osaka Chemical Co., Ltd., Osaka, Japan) and total carbon and total nitrogen were measured by a CN coder (MT-700, Yanaco, Kyoto, Japan). Additionally, approximately 100 g of perfect rice was sampled for taste parameter evaluation using a taste analyzer (RLTA10C, Satake, Hiroshima, Japan).
2.5. Statistical Analysis
Two-way analysis of variance (ANOVA) was used to evaluate the effects of water treatment and genotype for each year. Tukey’s HSD test was performed to compare the significant difference between the mean values at p < 0.05. Student’s t test was performed to compare between genotype means at p < 0.05 and p < 0.01. All statistical analyses were performed using JMP Pro 16 software (SAS Corp., Cary, NC, USA).
3. Results
Changes in maximum and minimum air temperatures during the growing season are shown in Figure S2. Notably, the maximum temperatures were higher in 2023 than in 2022, whereas the minimum temperatures were similar in both years. Additionally, the fluctuation in mean daily air temperature during the first 20 days after heading (DAH), a period in which the panicles are most sensitive to heat stress, was significantly higher in 2023 than in 2022 (Figure 1a). Moreover, the mean air temperature at 5–15 DAH was significantly higher in 2013 than in 2022 (Figure 1b).
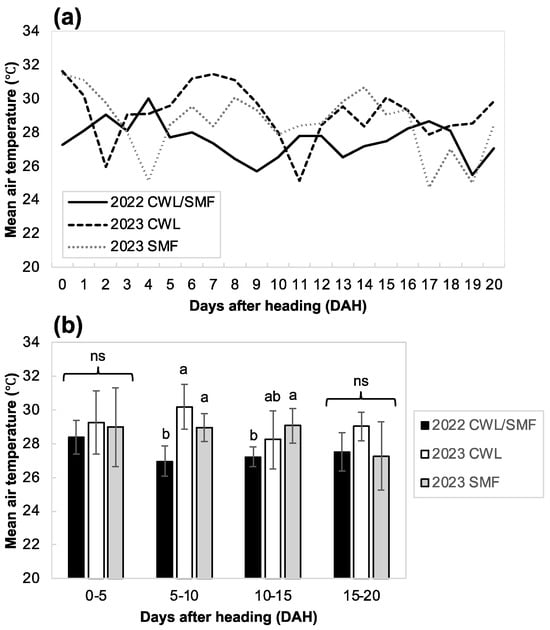
Figure 1.
Daily mean air temperature during the first 20 days after heading across two years. (a) Changes in daily mean air temperature; (b) average of daily mean temperature for every 6 days. Different letters in each stage indicate the significance at 5% level, based on Tukey’s HSD test. Ns indicates not significant at 5% level.
Under SMF conditions, SMC changed from 10 to 40 v/v% and 15 to 40 v/v% in 2022 and 2023, respectively (Figure 2). Additionally, the frequency of SMF was higher in 2022 than in 2023. During the early heading stage, plants were grown under progressive drought, with SMC of approximately 20 and 25 v/v% in 2022 and 2023, respectively.
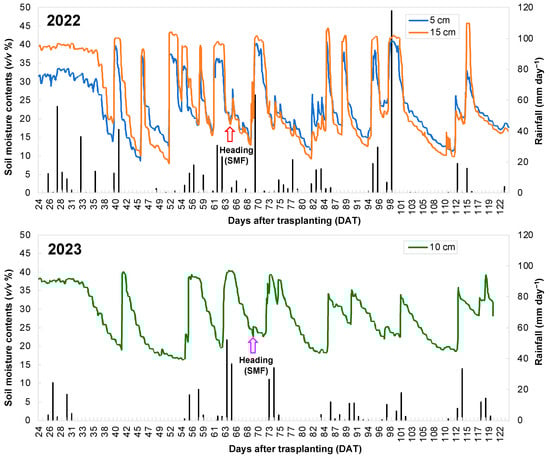
Figure 2.
Changes in soil moisture contents (SMC) and daily rainfall under soil moisture fluctuation (SMF) conditions during the growing season across two years. SMC were measured at 5 and 15 cm (2022) and 10 cm (2023) from soil surface. The arrow symbols indicate the heading time.
According to ANOVA results, consistent results were observed in the number of spikelets per panicles, percentage of broken grains, grain width, and grain length for both years (Table S1). Overall, the effect of genotype is larger than the impact of the treatment. Notably, the genotype had significant effects on grain dimension parameters.
Compared to CWL, SMF reduced panicle weight and grain yield in Nipponbare and G3-3 in both years (Table 1, Figure S3). Notably, G3-3 showed a consistently higher grain yield than Nipponbare under SMF conditions, but significance was observed only in 2023. Additionally, grain yield was lower in 2023 than in 2022 in both varieties because of the lower number of spikelets per panicle and spikelet fertility in 2023.

Table 1.
Yield and yield components of Nipponbare (NB) and G3-3 (G) genotype grown under continuous waterlogging (CWL) and soil moisture fluctuation (SMF) conditions.
Furthermore, we measured other yield-related agronomic traits, including plant height, tiller number, and SPAD values (Figure S4). The plant height in SMF remained flat after 40 DAT while plant height in CWL continued to increase, suggesting that the negative impacts of SMF on plant growth occurred at approximately 40 DAT. However, tillers and SPAD value did not correspond with plant height.
In the present study, grain appearance was markedly affected by the growth year (Table 2 and Figure S5). Notably, the percentage of perfect grains was lower in 2023 than in 2022, with higher ratios of pecky and chalky grains in 2023. In 2023, SMF negatively affected grain appearance in both varieties, with a marked increase in chalky grains in G3-3. Additionally, G3-3 had a significantly higher percentage of broken grains than Nipponbare, regardless of the year or water treatment. Overall, these results indicate a clear genotypic variation with regards to the percentage of broken grains.
Table 2.
Grain appearance of Nipponbare (NB) and G3-3 (G) grown under continuous waterlogging (CWL) and soil moisture fluctuation (SMF) conditions.
Furthermore, we examined differences in grain shape between the genotypes using perfect grains. Importantly, G3-3 had significantly longer, narrower, and thinner grains than Nipponbare (Table 3), characteristics inherited from KDML105, an indica variety. Overall, G3-3 had a larger grain area than Nipponbare. Additionally, SMF significantly reduced grain size in both genotypes in 2023; however, SMF had no or few effects on grain size in 2022.
Table 3.
Grain dimensions of Nipponbare (NB) and G3-3 (G) grown under continuous waterlogging (CWL) and soil moisture fluctuation (SMF) conditions in 2022.
Figure 3 shows the results of the taste analysis. Notably, G3-3 had significantly higher taste score (mark) than Nipponbare, with SMF and CWL significantly improving the taste of G3-3 in 2022 and 2023, respectively. In 2022, G3-3 showed significantly lower protein and higher moisture contents than Nipponbare. Additionally, amylose content was lower in G3-3 than in the Nipponbare, with CWL significantly reducing the amylose content of G3-3 in both years. Notably, SMF significantly decreased the taste of Nipponbare by 2.6% and significantly increased the protein content by 0.5% in 2022. Additionally, similar trends were observed for taste (mark), protein and amylose in 2023 under CWL conditions; however, there were no significant differences in taste parameters between both genotypes under SMF conditions.
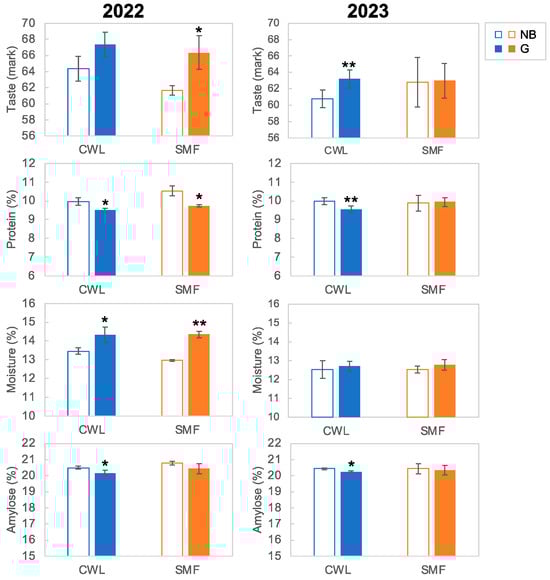
Figure 3.
Taste parameters of Nipponbare (NB) and G3-3 (G) genotype grown under continuous waterlogging (CWL) and soil moisture fluctuation (SMF) conditions in 2022 and 2023. Data represent the mean value ± standard deviation (SD; n = 3 in 2022, n = 5 in 2023). ** and * indicate significant different from NB at 5% and 1% level, respectively, based on Student’s t test.
To evaluate the overall characteristics of the yield and grain quality parameters, principal component analysis (PCA) was performed (Figure 4), with PC1 and PC2 representing 60.8% of the total variance. Notably, SMF in 2023 and the others clustered in PC1 accounted for 31.7% of the total variation. In contrast, Nipponbare and G3-3 formed distinct clusters in PC2, accounting for 29.1% of the total variation. Additionally, the major factors contributing to the positive axis of PC1 (representing G3-3 under CWL and SMF in 2022) were the number of perfect grains, yield, spikelet number per panicle, and grain moisture. Notably, both yield and taste were highly positively correlated with PC1 positive axis, with loading value of 0.82 and 0.64, respectively (Figure 4c). In contrast, the negative axis of PC1 (representing SMF in 2023) was mainly explained by pecky grains, chalky grains, and grain N content (%). Moreover, the positive axis of PC2 (representing Nipponbare) was mainly explained by grain thickness and width. Furthermore, the negative axis of PC2 (representing G3-3) was mainly explained by grain length and broken grains.
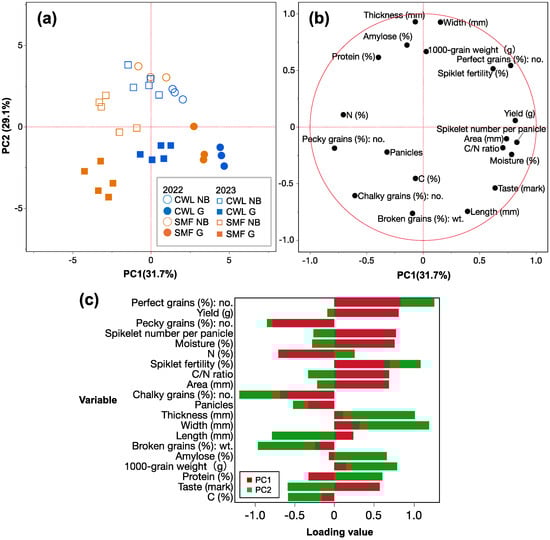
Figure 4.
Principle component analysis (PCA) (a) score plots, (b) loading plots, and (c) loading value of PC1 and PC2 for the yield and grain quality parameters of Nipponbare (NB) and G3-3 (G) genotype grown under continuous waterlogging (CWL) and soil moisture fluctuation (SMF) conditions in 2022 (n = 3) and 2023 (n = 5).
As shown in Figure 4a, the SMF in 2023 tended to be discriminated. Importantly, we hypothesized that the poor yield and grain quality performance under SMF conditions in 2023 were due to the inhibition of NSC translocation. Figure 5 shows the changes in NSC in the stems (culm and leaf sheath) after heading. Notably, there was a marked difference in NSC remobilization pattern at post-heading stage and at maturity between both years. In 2022, the NSC content showed a decreasing trend in both varieties from post-heading to maturity. Specifically, the reduction rate was higher in G3-3 than in Nipponbare, particularly under SMF conditions, suggesting that NSC may be utilized for grain filling. However, there was no observable difference in NSC content in both genotype during this period in 2023. Although there was a slight decline in NSC from post-heading to maturity under CWL conditions in 2023, it was not as pronounced as in 2022. The slight increase of NSC was observed in G3-3 under SMF in 2023. Additionally, genotypic variation was observed in the NSC content, with Nipponbare having a significantly higher NSC content than G3-3 in 2022.
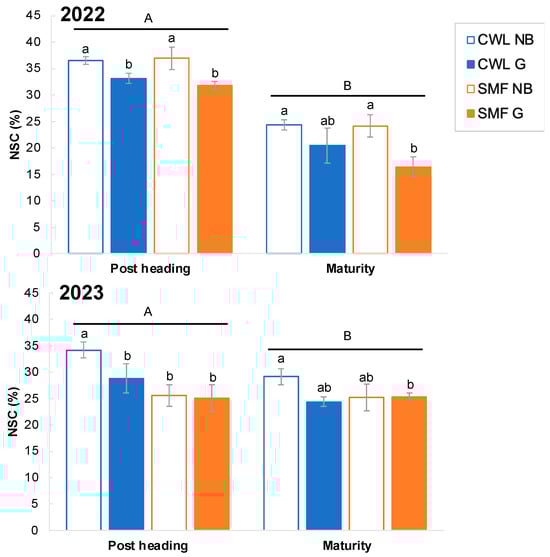
Figure 5.
Non-structural carbohydrates (NSC) contents in culm and leaf sheath at post-heading and maturity in Nipponbare (NB) and G3-3 (G) genotypes grown under continuous waterlogging (CWL) and soil moisture fluctuation (SMF) conditions in 2022 and 2023. Data represent the mean ± standard deviation (SD; n = 3 in 2022, n = 5 in 2023). Different letters at 5% level by Tukey’s HSD test. Different lowercase letters in each stage indicate significant differences and different capital letters indicate significant differences between post heading and maturity at 5% level, based on Tukey’s HSD test.
4. Discussion
This study demonstrated that SMF reduced the plant height and grain yield for both rice genotypes across two years (Table 1, Figure S4). Some studies have reported that SMF under AWD could increase the shoot growth and grain yield in rice [6,7]. On the other hand, several studies have shown SMF reduced the rice production [3,4,5], which indicates that such SMF is stressful for rice plants [3,22].
G3-3 showed a higher yield than Nipponbare, regardless of the water treatment (Table 1 and Figure S2), which was attributed to the higher number of spikelets per panicle. Notably, this finding was similar to that of a previous study conducted under AWD water-saving conditions and the maintenance of yield under AWD conditions was due to superior root system development and stomatal conductance [22]. However, the brown rice of G3-3 was more prone to cracking than that of Nipponbare (Table 2 and Figure S3), which may be due to the shape of the donor variety, KDML105. Particularly, the grain aspect ratio (defined as the ratio of width to length) is the main difference between japonica and indica and a high aspect ratio is associated with lower milling quality [26,27]. Overall, genotypic differences contributed more to the grain appearance parameter, such as grain dimension, than water treatment. Additionally, there was a significant genotypic difference in the taste parameters evaluated using the sensing device (Figure 3). Although the taste value in this study was generally low compared to the standard (taste mark 75), there was a significant positive correlation between N concentration and the estimated protein content (Figure S6). Importantly, these results were consistent with previous findings [12].
Unlike 2022, 2023 was hot, particularly around the heading stage (Figure 1). Notably, it was predicted that 2023 would have the lowest harvest of top-quality rice [28]. In the present study, the average yield was lower in 2023 than in 2022, owing to the decline in spikelet number and fertility (Table 1). Additionally, yield was lower under SMF conditions than under CWL. Rice is highly susceptible to high temperatures, drought, and combined high temperature and drought stress, especially during the heading and grain filling stage [29]. SMF decreased the perfect grain ratio and increased the number of chalky grains (Table 2). Research findings suggest that the optimal temperature for rice growth during the grain-filling stage is between 22 and 27 °C [30,31]. However, the mean air temperature was higher than the optimal level in 2023 (Figure 1 and Figure S2).
Furthermore, there was a clear difference in the NSC content between 2023 and 2022 (Figure 5). In 2023, although tillering reached its maximum stage (approximately 40 DAT) and gradually decreased with time until maturity, the reduction rate was lower than that in 2022 (Figure S3). In 2023, the slight increase of NSC was observed in G3-3 under SMF, which is due to increasing tiller number at maturity. Generally, panicles are regarded as sink organs, but can be used as source organs before maturity, with increasing NSC in stems before reaching maturity [32,33]. Additionally, NSC accumulation was observed in the roots post-heading [34]. Further research is needed to directly evaluate NSC dynamics as a physiological response related to yield and grain quality parameters in multi-environment trials.
G3-3 showed higher taste marks, lower protein and amylose contents, and higher moisture content in 2022 (Table 2), indicating that G3-3 inherited the good taste quality of KDML105 [19]. KDML105 contains the aroma compound 2-acetyl-1-pyrroline (2AP) and grain 2AP content is strongly influenced by environmental conditions as well as post-harvest conditions [35]. However, G3-3 does not have an aroma similar to that of Nipponbare and we did not consider aroma in this study. G3-3 had a similar grain weight to Nipponbare but a narrower and thinner grain shape than Nipponbare (Table 3). Importantly, these grain dimensions are common in indica variety and were inherited from KDML105. However, the milling process can easily produce broken grains and should be improved [36].
Furthermore, there seems to be a trade-off between grain quality and yield in G3-3 under combined SMF and high temperature stress (Figure 4). Agustin et al. (2023) [37] reported that superior grain quality significantly increased farmers’ net income compared to higher yield, with higher market price. Collectively, these results suggest that it is necessary to consider the best balance to achieve both high yield and grain quality with high stability across various environments. Increasing global surface temperatures are expected to intensify climate and weather extremes, leading to climate change that adversely affects crop production [38]. Enhancing adaptation to combined stressors is necessary to achieve desirable yield and quality.
G3-3, which showed root plasticity under SMF, has introgressed segments from KDML105 allele on all chromosomes, except for the regions on chromosomes 3, 8, 9, and 11 [22] (Figure S1). In the study of Jin et al. (2023) [39], total fifteen QTLs related to rice grain quality were found to be distributed on chromosome 6, 7, and 9. In addition, a suggestive QTL for NSC decrease was located on chromosome 2 [40]. G3-3’s introgressed segments may be responsible for the grain quality traits associated with root plasticity.
5. Conclusions
SMF significantly decreased rice yield; however, its effect on grain quality varied depending on the environment and genotype. Additionally, combined drought and high temperature stress close to the heading period had a serious impact on yield and grain quality under SMF conditions, with considerable inhibition of NSC translocation from stem to grain. G3-3 demonstrated superior yield under SMF conditions and have potential to show superior grain quality, indicating that the introgressed segments of G3-3 may be responsible for the grain quality traits associated with root plasticity. Our results suggested that the introgressed segments of this line could be useful genetic materials in breeding program for improving both yield and quality under rainfed lowland or water saving cultivation.
Supplementary Materials
The following supporting information can be downloaded at: https://www.mdpi.com/article/10.3390/agronomy14091926/s1. Figure S1: The graphical map of G3-3 showing the Nipponbare background with introgressed segments from the KDML105 genome, modified from Owusu-Nketia et al. (2018) [22]. The solid white square represents Nipponbare segment while the solid black square represents KDML105 segment; Figure S2: Daily maximum and minimum temperature during the growing season across two years; Figure S3: Panicle weight of Nipponbare (NB) and G3-3 (G) grown under continuous waterlogging (CWL) and soil moisture fluctuation (SMF) conditions across two years; Figure S4: Changes in plant height, tiller number, and SPAD value of Nipponbare (NB) and G3-3 (G) grown under continuous waterlogging (CWL) and soil moisture fluctuation (SMF) conditions across two years; Figure S5: Grain appearance of brown rice for Nipponbare (NB) and G3-3 (G) grown under continuous waterlogging (CWL) and soil moisture fluctuation (SMF) conditions across two years; Figure S6: Relationship between nitrogen concentration and estimated protein content in Nipponbare (NB) and G3-3 (G) genotypes grown under continuous waterlogging (CWL) and soil moisture fluctuation (SMF) conditions in 2022 and 2023; Table S1: Results of the two-way ANOVA on yield and grain quality parameters in 2022 and 2023.
Author Contributions
Conceptualization, K.H.S.T.D. and M.K.-N.; methodology, K.H.S.T.D. and M.K.-N.; software, M.K.-N. and V.A.C.M.; formal analysis, K.H.S.T.D., Y.N. and M.K.-N.; investigation, K.H.S.T.D., Y.N. and M.K.-N.; resources, Y.I.; data curation, V.A.C.M.; writing—original draft preparation, K.H.S.T.D. and M.K.-N.; writing—review and editing, M.K.-N., Y.I. and H.E.; visualization, K.H.S.T.D. and M.K.-N.; supervision, M.K.-N.; project administration, M.K.-N.; funding acquisition, K.H.S.T.D. and M.K.-N. All authors have read and agreed to the published version of the manuscript.
Funding
This research was partially funded by JICA-Agri-Net Program.
Data Availability Statement
The original contributions presented in the study are included in the article/Supplementary Materials, further inquiries can be directed to the corresponding author/s.
Acknowledgments
We thank Eiko Murakami, Shinya Mizuno, and the field staff for their valuable technical support.
Conflicts of Interest
The authors declare no conflicts of interest.
References
- GRiSP (Global Rice Science Partnership). Rice Almanac, 4th ed.; International Rice Research Institute: Los Baños, PA, USA, 2013; p. 283. [Google Scholar]
- Fukai, S.; Ouk, M. Increased productivity of rainfed lowland rice cropping systems of the Mekong region. Crop Pasture Sci. 2012, 63, 944–973. [Google Scholar] [CrossRef]
- Suralta, R.R.; Inukai, Y.; Yamauchi, A. Dry matter production in relation to root plastic development, oxygen transport, and water uptake of rice under transient soil moisture stresses. Plant Soil 2010, 332, 87–104. [Google Scholar] [CrossRef]
- Carrijo, D.R.; Lundy, M.E.; Linquist, B.A. Rice yields and water use under alternate wetting and drying irrigation: A meta-analysis. Field Crops Res. 2017, 203, 173–180. [Google Scholar] [CrossRef]
- Gao, R.; Zhuo, L.; Wu, P. Effects of alternate wetting and drying irrigation on yield, water-saving, and emission reduction in rice fields: A global meta-analysis. Agric. For. Meteorol. 2024, 353, 110075. [Google Scholar] [CrossRef]
- Arai, H.; Hosen, Y.; Chiem, N.H.; Inubushi, K. Alternate wetting and drying enhanced the yield of a triple-cropping rice paddy of the Mekong Delta. Soil Sci. Plant Nutr. 2021, 67, 493–506. [Google Scholar] [CrossRef]
- Yang, J.; Zhang, J. Crop management techniques to enhance harvest index in rice. J. Exp. Bot. 2010, 61, 3177–3189. [Google Scholar] [CrossRef]
- Ndikuryayo, C.; Ndayiragije, A.; Kilasi, N.; Kusolwa, P. Breeding for rice aroma and drought tolerance: A Review. Agronomy 2022, 12, 1726. [Google Scholar] [CrossRef]
- Hori, K.; Sun, J. Rice grain size and quality. Rice 2022, 15, 33. [Google Scholar] [CrossRef]
- Li, P.; Chen, Y.H.; Lu, J.; Zhang, C.Q.; Liu, Q.Q.; Li, Q.F. Genes and their molecular functions determining seed structure, components, and quality of rice. Rice 2022, 15, 18. [Google Scholar] [CrossRef]
- Matsue, Y.; Takasaki, K.; Abe, J. Water management for improvement of rice yield, appearance quality and palatability with high temperature during ripening period. Rice Sci. 2021, 28, 409–416. [Google Scholar] [CrossRef]
- Srun, K.; Fujita, A.; Kong, K.; Ngin, C.; Neou, R.; Asano, K.; Audia, F.; Yamada, S.; Kano-Nakata, M.; Yamauchi, A.; et al. Utilization of sensing and image-processing devices for evaluating the grain quality of Cambodian rice varieties. Trop. Agric. Dev. 2022, 66, 139–149. [Google Scholar]
- Zheng, C.; Liu, C.; Liu, L.; Tan, Y.; Sheng, X.; Yu, D.; Sun, Z.; Sun, X.; Chen, J.; Yuan, D.; et al. Effect of salinity stress on rice yield and grain quality: A meta-analysis. Eur. J. Agron. 2023, 144, 126765. [Google Scholar] [CrossRef]
- Ren, D.; Ding, C.; Qian, Q. Molecular bases of rice grain size and quality for optimized productivity. Sci. Bull. 2023, 68, 314–350. [Google Scholar] [CrossRef]
- Yang, Y.; Yu, J.; Qian, Q.; Shang, L. Enhancement of heat and drought stress tolerance in rice by genetic manipulation: A systematic review. Rice 2022, 15, 67. [Google Scholar] [CrossRef]
- Bañoc, D.M.; Yamauchi, A.; Kamoshita, A.; Wade, L.J.; Pardales, J.R., Jr. Dry matter production and root system development of rice cultivars under fluctuating soil moisture. Plant Prod. Sci. 2000, 3, 197–207. [Google Scholar] [CrossRef]
- Kano-Nakata, M.; Gowda, V.R.; Henry, A.; Serraj, R.; Inukai, Y.; Fujita, D.; Kobayashi, N.; Suralta, R.R.; Yamauchi, A. Functional roles of the plasticity of root system development in biomass production and water uptake under rainfed lowland conditions. Field Crops Res. 2013, 144, 288–296. [Google Scholar] [CrossRef]
- Kameoka, E.; Suralta, R.R.; Mitsuya, S.; Yamauchi, A. Developmental plasticity of rice root system grown under mild drought stress condition with shallow soil depth; comparison between nodal and lateral roots. Plant Prod. Sci. 2016, 19, 411–419. [Google Scholar] [CrossRef]
- Sangwongchai, W.; Tananuwong, K.; Krusong, K.; Thitisaksakul, M. Yield, grain quality, and starch physicochemical properties of 2 elite Thai rice cultivars grown under varying production systems and soil characteristics. Foods 2021, 10, 2601. [Google Scholar] [CrossRef]
- Korinsak, S.; Siangliw, M.; Kotcharerk, J.; Jairin, J.; Siangliw, J.L.; Jongdee, B.; Toojinda, T. Improvement of the submergence tolerance and the brown planthopper resistance of the Thai jasmine rice cultivar KDML105 by pyramiding Sub1 and Qbph12. Field Crops Res. 2016, 188, 105–112. [Google Scholar] [CrossRef]
- Kanjoo, V.; Punyawaew, K.; Siangliw, J.L.; Jearakongman, S.; Vanavichit, A.; Toojinda, T. Evaluation of agronomic traits in chromosome segment substitution lines of KDML105 containing drought tolerance qtl under drought stress. Rice Sci. 2012, 19, 117–124. [Google Scholar] [CrossRef]
- Owusu-Nketia, S.; Inukai, Y.; Ohashi, S.; Suralta, R.R.; Doi, K.; Mitsuya, S.; Kano-Nakata, M.; Niones, J.M.; Nguyen, D.T.N.; Kabuki, T.; et al. Root plasticity under fluctuating soil moisture stress exhibited by backcross inbred line of a rice variety, Nipponbare carrying introgressed segments from KDML105 and detection of the associated QTLs. Plant Prod. Sci. 2018, 21, 106–122. [Google Scholar] [CrossRef]
- Sultan, M.S.; Abdel-Moneam, M.A.; El-Abd, A.B.; El-Naem, S.A. Inheritance of some root and grain quality traits in rice under water deficiency conditions. J. Agron. 2014, 13, 89–99. [Google Scholar] [CrossRef][Green Version]
- Ohnishi, M.; Horie, T. A proxy analysis of nonstructural carbohydrate in rice plant by using the gravimetric method. Jpn. J. Crop Sci. 1999, 68, 126–136. [Google Scholar] [CrossRef]
- Saito, K.; Ndindeng, S.A.; Devkota, M.; Dobermann, A. Measurement of rice grain yield and aboveground biomass at maturity for crop cut at plot level, v1. Standard Operating Procedure 010. Guideline for Measuring Agronomic Gain Key Performance Indicators in on-Farm Trials, v. 1. Saito, K., Johnson, J.-M., Hauser, S., Corbeels, M., Devkota, M., Casimero, M., Eds.; Excellence in Agronomy for Sustainable Intensification and Climate Change Adaptation Initiative. 2023, p. 5. Available online: https://hdl.handle.net/10568/134609 (accessed on 19 August 2024).
- Luo, Y.; Zhu, Z.; Chen, N.; Duan, B.; Zhang, L. Grain types and related quality characteristics of rice in China. Chin. J. Rice Sci. 2004, 18, 135–139. [Google Scholar]
- Xu, Q.; Chen, W.; Xu, Z. Relationship between grain yield and quality in rice germplasms grown across different growing areas. Breed Sci. 2015, 65, 226–232. [Google Scholar] [CrossRef]
- Giseburt, A. Climate Change, Chalky Grains and the Risks for Japan’s Rice Farmers. The Japan Times. 2024. Available online: https://www.japantimes.co.jp/environment/2024/04/28/climate-change/rice-climate-change-risk/ (accessed on 19 August 2024).
- Lawas, L.M.F.; Shi, W.J.; Yoshimoto, M.; Hasegawa, T.; Hincha, D.K.; Zuther, E.; Jagadish, S.V.K. Combined drought and heat stress impact during flowering and grain filling in contrasting rice cultivars grown under field conditions. Field Crops Res. 2018, 229, 66–77. [Google Scholar] [CrossRef]
- Deng, N.; Ling, X.; Sun, Y.; Zhang, C.; Fahad, S.; Peng, S.; Cui, K.; Nie, L.; Huang, J. Influence of temperature and solar radiation on grain yield and quality in irrigated rice system. Eur. J. Agron. 2015, 64, 37–46. [Google Scholar] [CrossRef]
- Wakamatsu, K.; Sasaki, O.; Uezono, I.; Tanaka, A. Effects of high air temperature during the ripening period on the grain quality of rice in warm regions of Japan. Jpn. J. Crop. Sci. 2007, 76, 71–78. [Google Scholar] [CrossRef]
- Arai-Sanoh, Y.; Ida, M.; Zhao, R.; Nishitani, K.; Yoshinaga, S.; Takai, T.; Nakano, H.; Iwasawa, N.; Kondo, M. Varietal differences in cell wall β-(1 → 3), (1 → 4)-glucan and nonstructural carbohydrate in rice stems during the grain filling stage. Plant Prod. Sci. 2023, 16, 335–341. [Google Scholar] [CrossRef]
- Yoshinaga, S.; Takai, T.; Arai-Sanoh, Y.; Ishimaru, T.; Kondo, M. Varietal differences in sink production and grain-filling ability in recently developed high-yielding rice (Oryza sativa L.) varieties in Japan. Field Crops Res. 2013, 150, 74–82. [Google Scholar] [CrossRef]
- Onoda, K.; Ohta, R.; Peter, M.A.; Edifor, R.; Hamajima, M.; Mae, A.; Murai, A.; Kondo, M.; Sekiya, N. Post-heading accumulation of nonstructural carbohydrates and nitrogen in rice (Oryza sativa L.) roots. Field Crops Res. 2024, 315, 109478. [Google Scholar] [CrossRef]
- Kongpun, A.; Pusadee, T.; Jaksomsak, P.; Tuiwong, P.; Chan-In, P.; Konsaeng, S.; Pathom-Aree, W.; Utasee, S.; Wangkaew, B.; Prom-U-Thai, C. Abiotic and biotic factors controlling grain aroma along value chain of fragrant rice: A review. Rice Sci. 2024, 31, 142–158. [Google Scholar] [CrossRef]
- Bao, J. Rice milling quality. In Rice Chemistry and Technology, 4th ed.; Bao, J., Ed.; AACC International Press: St Paul, MN, USA, 2019; pp. 339–369. [Google Scholar]
- Agustin, A.M.L.; Ordonio, J.L.; Natividad, M.B.S.; Lucob-Agustin, N.B.; Suralta, R.R.; Ehara, H.; Mitsuya, S.; Kano-Nakata, M. Specialty rice (Oryza sativa L.) with high and stable grain yield under rainfed lowland conditions. Agriculture 2023, 13, 1985. [Google Scholar] [CrossRef]
- Pörtner, H.-O.; Roberts, D.C.; Tignor, M.; Poloczanska, E.S.; Mintenbeck, K.; Alegría, A.; Craig, M.; Langsdorf, S.; Löschke, S.; Möller, V.; et al. IPCC 2022 Climate Change 2022: Impacts, Adaptation and Vulnerability; Cambridge University Press: Cambridge, UK, 2022. [Google Scholar]
- Jin, S.; Xu, L.; Yang, Q.; Zhang, M.; Wang, S.; Wang, R.; Tao, T.; Hong, L.; Guo, Q.; Jia, S. High-resolution quantitative trait locus mapping for rice grain quality traits using genotyping by sequencing. Front. Plant Sci. 2023, 13, 1050882. [Google Scholar] [CrossRef]
- Phung, H.D.; Sugiura, D.; Sunohara, H.; Makihara, D.; Kondo, M.; Nishiuchi, S.; Doi, K. QTL analysis for carbon assimilate translocation-related traits during maturity in rice (Oryza sativa L.). Breed Sci. 2019, 69, 289–296. [Google Scholar] [CrossRef] [PubMed]


Disclaimer/Publisher’s Note: The statements, opinions and data contained in all publications are solely those of the individual author(s) and contributor(s) and not of MDPI and/or the editor(s). MDPI and/or the editor(s) disclaim responsibility for any injury to people or property resulting from any ideas, methods, instructions or products referred to in the content. |
© 2024 by the authors. Licensee MDPI, Basel, Switzerland. This article is an open access article distributed under the terms and conditions of the Creative Commons Attribution (CC BY) license (https://creativecommons.org/licenses/by/4.0/).