Article

Analysis of Phenotypic Trait Variation in Germplasm Resources of Lycium ruthenicum Murr.

1
College of Forestry, Inner Mongolia Agricultural University, Hohhot 010019, China
2
Inner Mongolia Forestry Research Institute, Hohhot 010010, China
3
Inner Mongolia Engineering Technology Research Center of Lycium ruthenicum Murr., Hohhot 010010, China
*
Author to whom correspondence should be addressed.
Agronomy 2024, 14(9), 1930; https://doi.org/10.3390/agronomy14091930 (registering DOI)
Submission received: 17 June 2024 / Revised: 26 August 2024 / Accepted: 26 August 2024 / Published: 28 August 2024
(This article belongs to the Section Crop Breeding and Genetics)

Abstract

:
Exploring the phenotypic trait variation and diversity of Lycium ruthenicum germplasm resources can support selection, breeding, and genetic improvement, enhancing agricultural production. This study collected 213 wild Lycium ruthenicum seedlings from a resource nursery in Alxa League, Inner Mongolia. These seedlings originated from eight sources across four provinces. Using 11 pseudo-qualitative traits and 20 quantitative traits, the phenotypic variation of the germplasm was analyzed. The analysis involved the coefficient of variation, Shannon–Wiener index (H), Simpson’s genetic diversity index (D), principal component analysis, correlation analysis, and Q-type cluster analysis. The results showed that the variation range of 31 phenotypic traits across the 213 Lycium ruthenicum germplasm resources was 17.26% to 105.41%, with an average coefficient of variation of 39.85%. The H and D indexes ranged from 0.18 to 1.58 and 0.20 to 0.75, respectively. For the 11 pseudo-qualitative traits, the H and D ranges were 0.18 to 1.58 and 0.07 to 0.74, with average values of 0.77 and 0.42. For the quantitative traits, the H and D ranges were 0.54 to 1.49 and 0.25 to 0.75, with average values of 1.21 and 0.63. This indicates that Lycium ruthenicum germplasm resources exhibit significant phenotypic diversity, with quantitative traits showing higher diversity than pseudo-qualitative traits. Principal component analysis revealed that the cumulative variance contribution rate of the first 10 principal components was 74.03%, comprehensively reflecting the information of the 31 traits. Q-type cluster analysis grouped the 213 Lycium ruthenicum germplasm resources into six clusters, each with distinct phenotypic characteristics. This analysis also identified the trait characteristics and breeding value of each cluster. The results of this study provide valuable information on the genetic improvement, conservation, and evaluation of Lycium ruthenicum germplasm resources.

1. Introduction

Lycium ruthenicum Murr., a shrub in the Solanaceae family, is a second-class nationally protected medicinal and edible plant found in various ecosystems of northwestern China [1]. It withstands salinity, drought, and wind erosion, playing a crucial role in windbreak and sand fixation, soil improvement, and ecological protection in arid regions of northwest China [2]. The fruit contains anthocyanins, flavonoids, alkaloids, phenolic acids, polysaccharides, and trace elements. These compounds help lower blood sugar and lipids, fight fatigue and tumors, prevent cancer, boost immunity, and slow aging [3,4]. Therefore, Lycium ruthenicum has significant ecological value and economic benefits.
Plant genetic diversity includes the total genetic variation within and among individuals and populations, covering fields like phenotypics, cytology, physiology, biochemistry, and molecular biology [5]. Research on phenotypic diversity is fundamental for evaluating plant genetic diversity, providing a crucial foundation for the collection, conservation, or genetic improvement of plant resources. Phenotypic diversity studies have been conducted on various plants, including Amygdalus pedunculata Pall., Xanthoceras sorbifolium Bunge, Pyrus spp., and Armeniaca sibirica Lam [6,7,8,9]. However, research on Lycium ruthenicum’s phenotypic diversity is scarce, with few reports available and small sample sizes focusing only on leaf and fruit traits [10,11,12]. The study demonstrated that flat peach-type fruits have significant quality advantages over sphere-type fruits in terms of bearing shoot length, internode length, peduncle length, individual fruit weight, and 100-pod weight [13]. The only similar study examined 48 accessions of Lycium ruthenicum germplasm, focusing on descriptive statistics, principal component analysis, correlation, and cluster analysis of 18 major phenotypic and quality traits (15 qualitative traits and 3 qualitative traits) [14].
In this study, we investigated 213 individual plants of Lycium ruthenicum collected from eight provenances across four provinces: Qinghai, Xinjiang, Gansu, and Inner Mongolia. We examined 11 pseudo-qualitative traits and 20 quantitative traits of branches, leaves, flowers, fruits, seeds, and thorns. Through diversity analysis, principal component analysis, cluster analysis, and correlation analysis, we aimed to explore the genetic diversity of Lycium ruthenicum. The goal is to provide a theoretical basis for the collection, development, and utilization of Lycium ruthenicum germplasm resources, and to offer a robust data foundation for future germplasm creation and new cultivar selection of Lycium ruthenicum.

2. Materials and Methods

2.1. Experimental Site Overview

The experiment was conducted in the Lycium ruthenicum resource nursery located in Aolunbulage Town, Alxa East County, Alxa League, Inner Mongolia. The geographical coordinates are 106°43′ N latitude and 40°33′ E longitude, with an elevation of 1005 m. The region has a temperate continental monsoon climate characterized by strong winds, abundant sand, scarce precipitation, high evaporation, and rich solar and thermal resources. The average annual precipitation is 119 mm, and the annual evaporation rate is 2279 mm. The average annual temperature is 7.8 °C, with an average of −15 °C in January and 23.7 °C in July. The growing season averages 150 days, with a frost-free period of 135 days per year. The total annual sunshine duration is 3400 h. The soil in the experimental area is aeolian sandy soil, with a subsurface layer primarily composed of loess. The soil pH is 8.22, with nutrient content including 4.97 g/kg of organic matter, 29.86 mg/kg of hydrolyzable nitrogen, 5.22 mg/kg of available phosphorus, and 39.36 mg/kg of available potassium.

2.2. Source of Planting Resources

The experimental material consisted of 213 wild Lycium ruthenicum seedlings from different families, originating from eight seed sources across four provinces. These seedlings were sown, propagated, and preserved in 2015 at the Inner Mongolia Engineering Technology Research Center of Lycium ruthenicum Murr. at the Inner Mongolia Academy of Forestry Sciences. Detailed information on the provenances, including provinces, latitudes, longitudes, and altitudes, is presented in Table 1.

2.3. Experimental Survey and Trait Value Assignment Based on Distinctness

Referring to NY/T2528-2013 “Guidelines for the conduct of tests for distinctness, uniformity and stability, Lycium”, we selected 11 pseudo-qualitative traits and 20 quantitative traits for the survey. A pseudo-qualitative trait is defined as one with at least partially continuous expression but with a multidimensional range of variation. For example, shape can be ovate (1), elliptical (2), circular (3), or obovate (4). All individual expression states must be determined within the specified range of trait descriptions [15]. The pseudo-qualitative traits include plant habit, plant thorns, branch color (one-year-old and perennial), leaf shape and apex shape, corolla color, petal apex shape, fruit color, fruit shape, and seed color. These traits were manually surveyed during the growing seasons from April to September in 2021 and 2022. To minimize errors, a single uniformity and stability testing guidelines for Lycium ruthenicum were followed (Table 2).
The quantitative traits include:
(1)
Plant traits: plant height, crown width.
(2)
Branch traits: one-year-old branch length, one-year-old branch internode length, thorn density, number of fruiting branches on one-year-old branches, and maximum number of flowers in short branch clusters on one-year-old branches. The middle-upper sections of one-year-old branches from each plant (3 to 4 branches per plant) were used as test materials.
(3)
Leaf traits: leaf thickness, leaf length, leaf width, leaf length-to-width ratio, leaf area, leaf perimeter, and leaf shape factor. The leaves from the middle and upper parts of the current year’s branches were used as the test material (3–4 branches per plant, with 3–4 single leaves or terminal leaflets of compound leaves per branch). The measurements were taken using a multifunctional leaf area analyzer (WanShen LA-S, Hangzhou, China).
(4)
Fruit traits: fruit vertical diameter, fruit horizontal diameter, fruit skin thickness, number of seeds, pedicel length, fruit weight, and number of seeds. The fruits from the middle and upper parts of the current year’s branches were used as the test material (3–4 branches per plant, with 3–4 fruits per branch), and the measurements were taken using a vernier caliper and an electronic balance.

2.4. Data Processing

The raw data were organized using Microsoft Excel 2021. We calculated the distribution frequency of pseudo-qualitative traits and the mean, maximum, minimum, standard deviation (σ), coefficient of variation (CV), Shannon–Wiener diversity index (H), and Simpson’s diversity index (D) [9,10]. The formulas for calculating H and D are as follows:
H = i = 1 s P i ln P i
D = 1 i = 1 s P i 2
where s is the number of species, and P i is the frequency of the i-th code value for a given trait. Quantitative traits were categorized into five levels based on the mean observation value ( x ¯ i ) and σ. The levels were defined as level 1 < x ¯ i 1.5 σ , level 5   x ¯ i + 1.5 σ , with each intermediate level differing by 1σ as shown in Table 3. For each quantitative trait, the values for levels 1 to 5 were used as the horizontal axis, and the values obtained through grading methods were used as the vertical axis to construct a 0–1 matrix.
Principal component analysis (PCA) of the 31 phenotypic traits was performed using SPSS 26 software; Q-type cluster analysis and correlation analysis were conducted using Origin 2021 [16,17,18,19].

3. Results

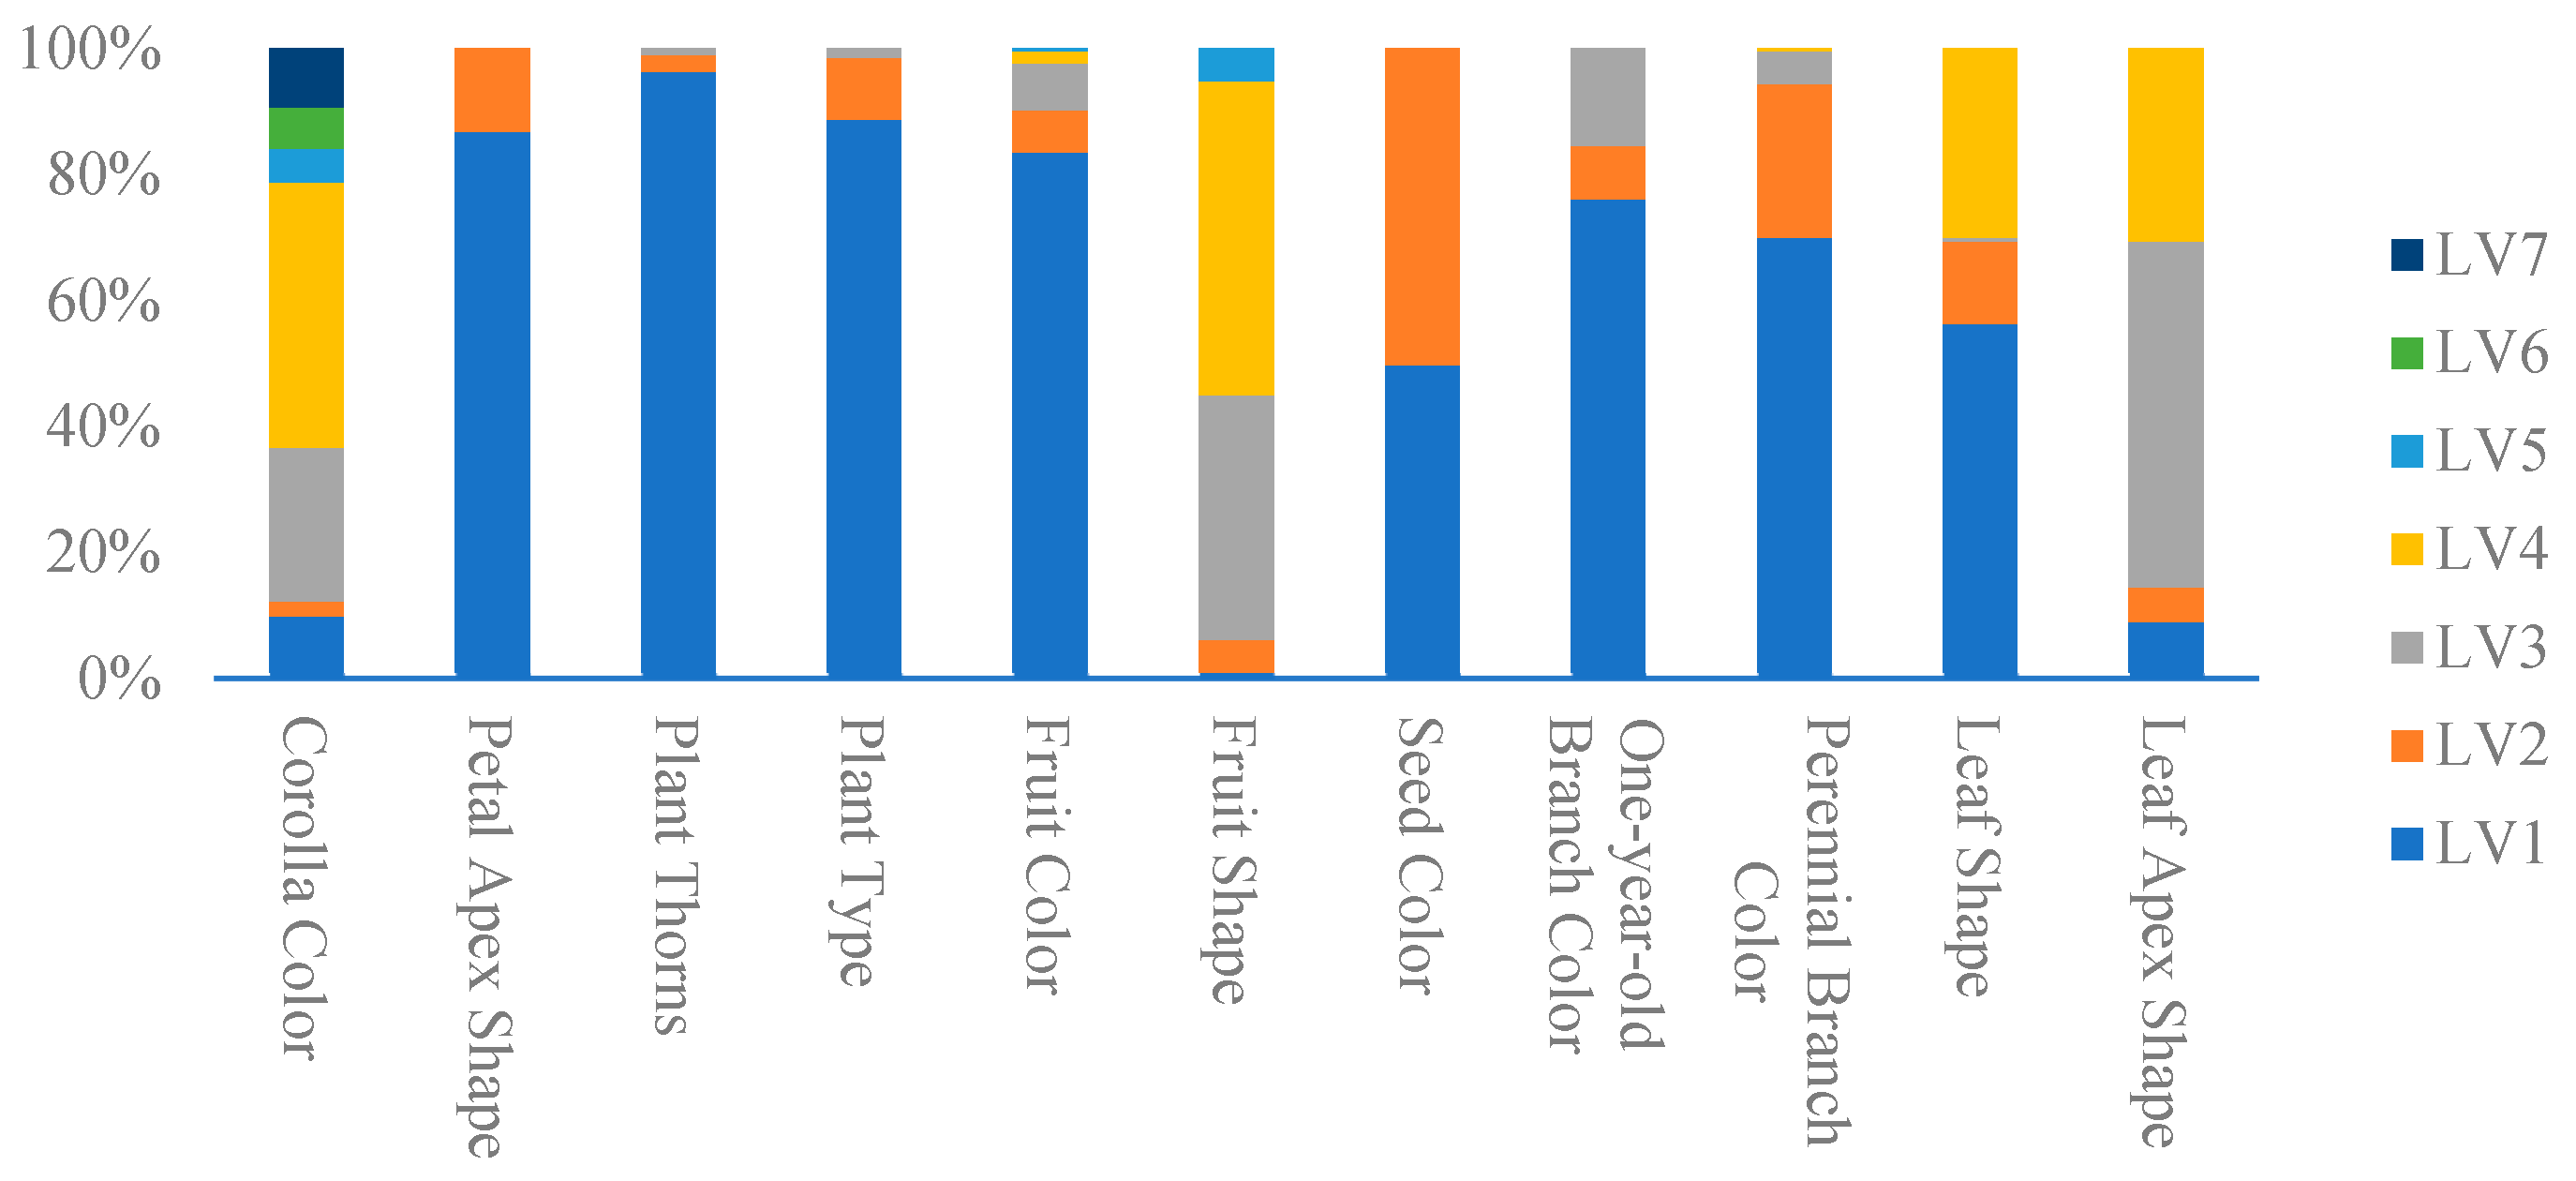
3.1. Analysis of Pseudo-Qualitative Traits

A total of 42 variation types were detected among the 11 pseudo-qualitative traits of the 213 Lycium ruthenicum samples (Figure 1). Corolla color exhibited the most diversity, with seven types observed, followed by fruit shape and leaf apex shape acute. Among the 213 samples, 86.85% of the Lycium ruthenicum plants exhibited an upright plant type, 96.24% had thorns, 83.57% had black fruits, 88.73% had petals with a blunt apex, 49.77% had an oblate fruit shape, and 42.25% had purple corollas. Seed color had only two categories, with brown and yellow distributed almost equally (50.23% and 49.77%, respectively).
The CVs for the 11 pseudo-qualitative traits ranged from 21.15% to 75.82%. Acute leaf shape (75.82%), fruit color (56.15%), and color of one-year-old branches (52.51%) had relatively high CVs, each exceeding 50%, indicating poor stability among individuals. Conversely, fruit shape (21.15%), thorn density (25.71%), acute leaf apex shape (27.51%), and petal apex shape (28.76%) had lower CVs, all below 30%, indicating higher stability among Lycium ruthenicum individuals. The ranges of H and D for the 11 pseudo-qualitative traits were 0.18 to 1.58 and 0.07 to 0.74, respectively (Figure 2).

3.2. Analysis of Quantitative Trait Diversity

The CVs for the 20 quantitative traits of the 213 Lycium ruthenicum plants ranged from 17.26% to 105.41%, with an average of 39.87%. The ranges of the H and D were 0.54 to 1.49 and 0.25 to 0.75, respectively, indicating substantial variation and rich diversity among individual plants (Table 4). The number of fruit-bearing branches on one-year-old branches, leaf area, and thorn density had the highest CVs at 105.41%, 84.70%, and 55.50%, respectively. Conversely, fruit vertical diameter, fruit horizontal diameter, and leaf length–width ratio had the lowest CVs at 17.26%, 18.10%, and 17.60%, respectively. When quantitative traits were categorized by organ and sorted by average CV, the results were as follows: branch traits (61.87%) > thorn traits (55.50%) > flower traits (49.65%) > plant traits (44.59%) > seed traits (37.07%) > leaf traits (32.87%) > fruit traits (30.06%). The diversity was higher for branch, thorn, and flower traits.

3.3. PCA of Phenotypic Traits

PCA can transform multiple, complexly related traits into a few principal components, identifying the main influencing factors. For the 31 phenotypic traits of 213 Lycium ruthenicum samples, PCA extracted 10 principal components with eigenvalues greater than 1, accounting for 74.03% of the total variance (Table 5). These components encapsulate most of the phenotypic trait information and can replace the original 31 traits. The contribution rates for PC1 to PC9 were 28.61%, 9.00%, 7.53%, 5.78%, 4.75%, 4.20%, 3.91%, 3.58%, 3.45%, and 3.23%, respectively. Based on the absolute values of the feature vectors, PC1 primarily reflected leaf traits, PC2 mainly reflected fruit traits, including fruit horizontal diameter and fruit weight, and PC3 primarily reflected leaf and acute leaf apex shape traits.
Selecting the two indicators with the highest contribution rates from each principal component, 19 representative indicators were identified. These indicators, in descending order, are leaf area, leaf perimeter, leaf length, fruit horizontal diameter, fruit weight, leaf shape, acute leaf apex shape, leaf shape factor, corolla color, leaf length–width ratio, seed color, leaf thickness, plant thorns, maximum number of flowers in clusters on short branches of one-year-old branches, petal apex shape, plant type, fruit shape, fruit skin thickness, and the number of fruit-bearing branches on one-year-old branches. It is evident that the leaf traits contribute the most to the diversity of Lycium ruthenicum, followed by fruit traits and some traits of the seeds and one-year-old branches.

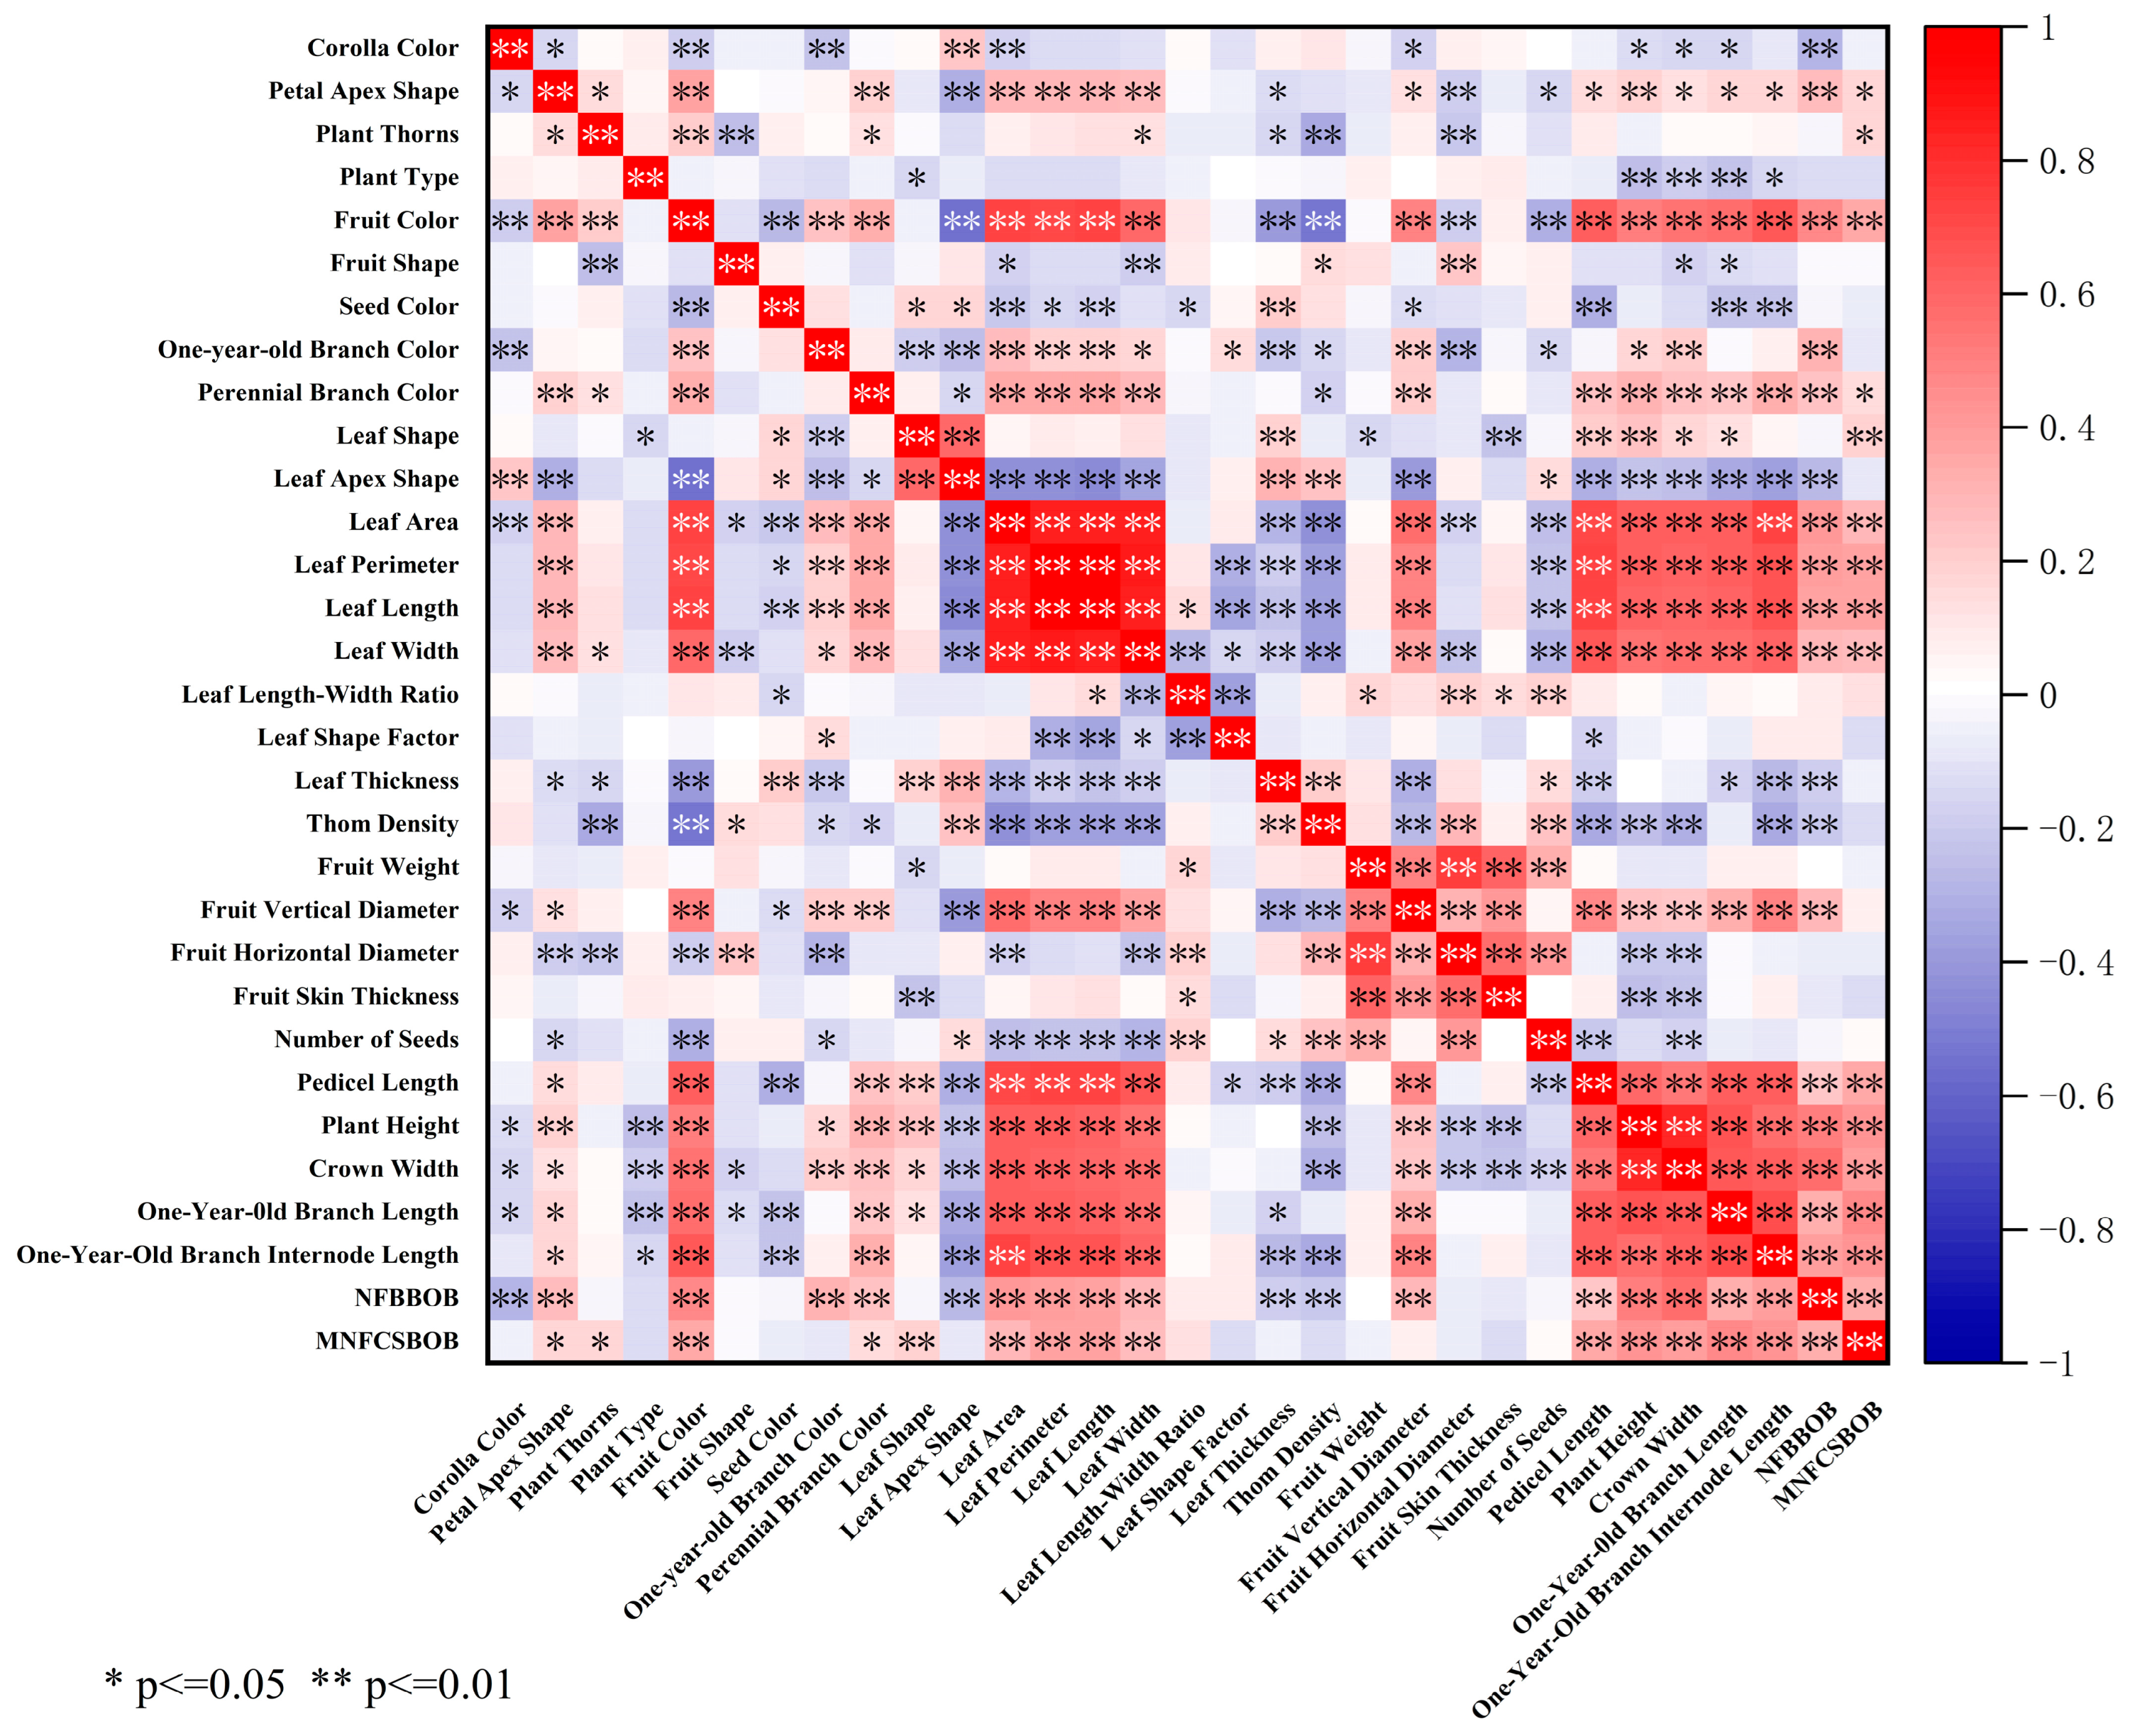
3.4. Correlation Analysis of Phenotypic Traits

A correlation analysis of 31 phenotypic traits of Lycium ruthenicum (Figure 3) revealed a high degree of correlation between the various phenotypic traits, indicating significant mutual influence among them. Leaf length, leaf width, and leaf area are related to the plant’s photosynthetic production capacity. The analysis found that these traits are significantly positively correlated (p < 0.01) with fruit color, fruit vertical diameter, pedicel length, plant height, crown width, and one-year-old branch traits, while they are significantly negatively correlated (p < 0.01) with acute leaf apex shape, thorn density, and leaf thickness. Fruit is the most intuitive phenotype of Lycium ruthenicum Murr.
Among the fruit traits, fruit weight is significantly positively correlated (p < 0.01) with fruit vertical diameter, fruit horizontal diameter, fruit skin thickness, and number of seeds. Fruit skin thickness is significantly negatively correlated with plant height, crown width, leaf shape, and acute leaf apex shape. Fruit color is significantly positively correlated (p < 0.01) with plant height, crown width, leaf length, leaf width, leaf area, one-year-old branch traits, and pedicel length, and significantly negatively correlated (p < 0.01) with seed color, acute leaf apex shape, leaf thickness, thorn density, and number of seeds. Pedicel length is significantly positively correlated (p < 0.01) with one-year-old branch length, one-year-old branch internode length, number of fruit-bearing branches on one-year-old branches, maximum number of flowers in clusters on short branches of one-year-old branches, plant height, and crown width. The maximum number of flowers in clusters on short branches of one-year-old branches affects the fruit yield of Lycium ruthenicum Murr.; it is significantly positively correlated (p < 0.01) with leaf area, leaf shape, leaf perimeter, leaf length, leaf width, pedicel length, plant height, crown width, and one-year-old branch traits.

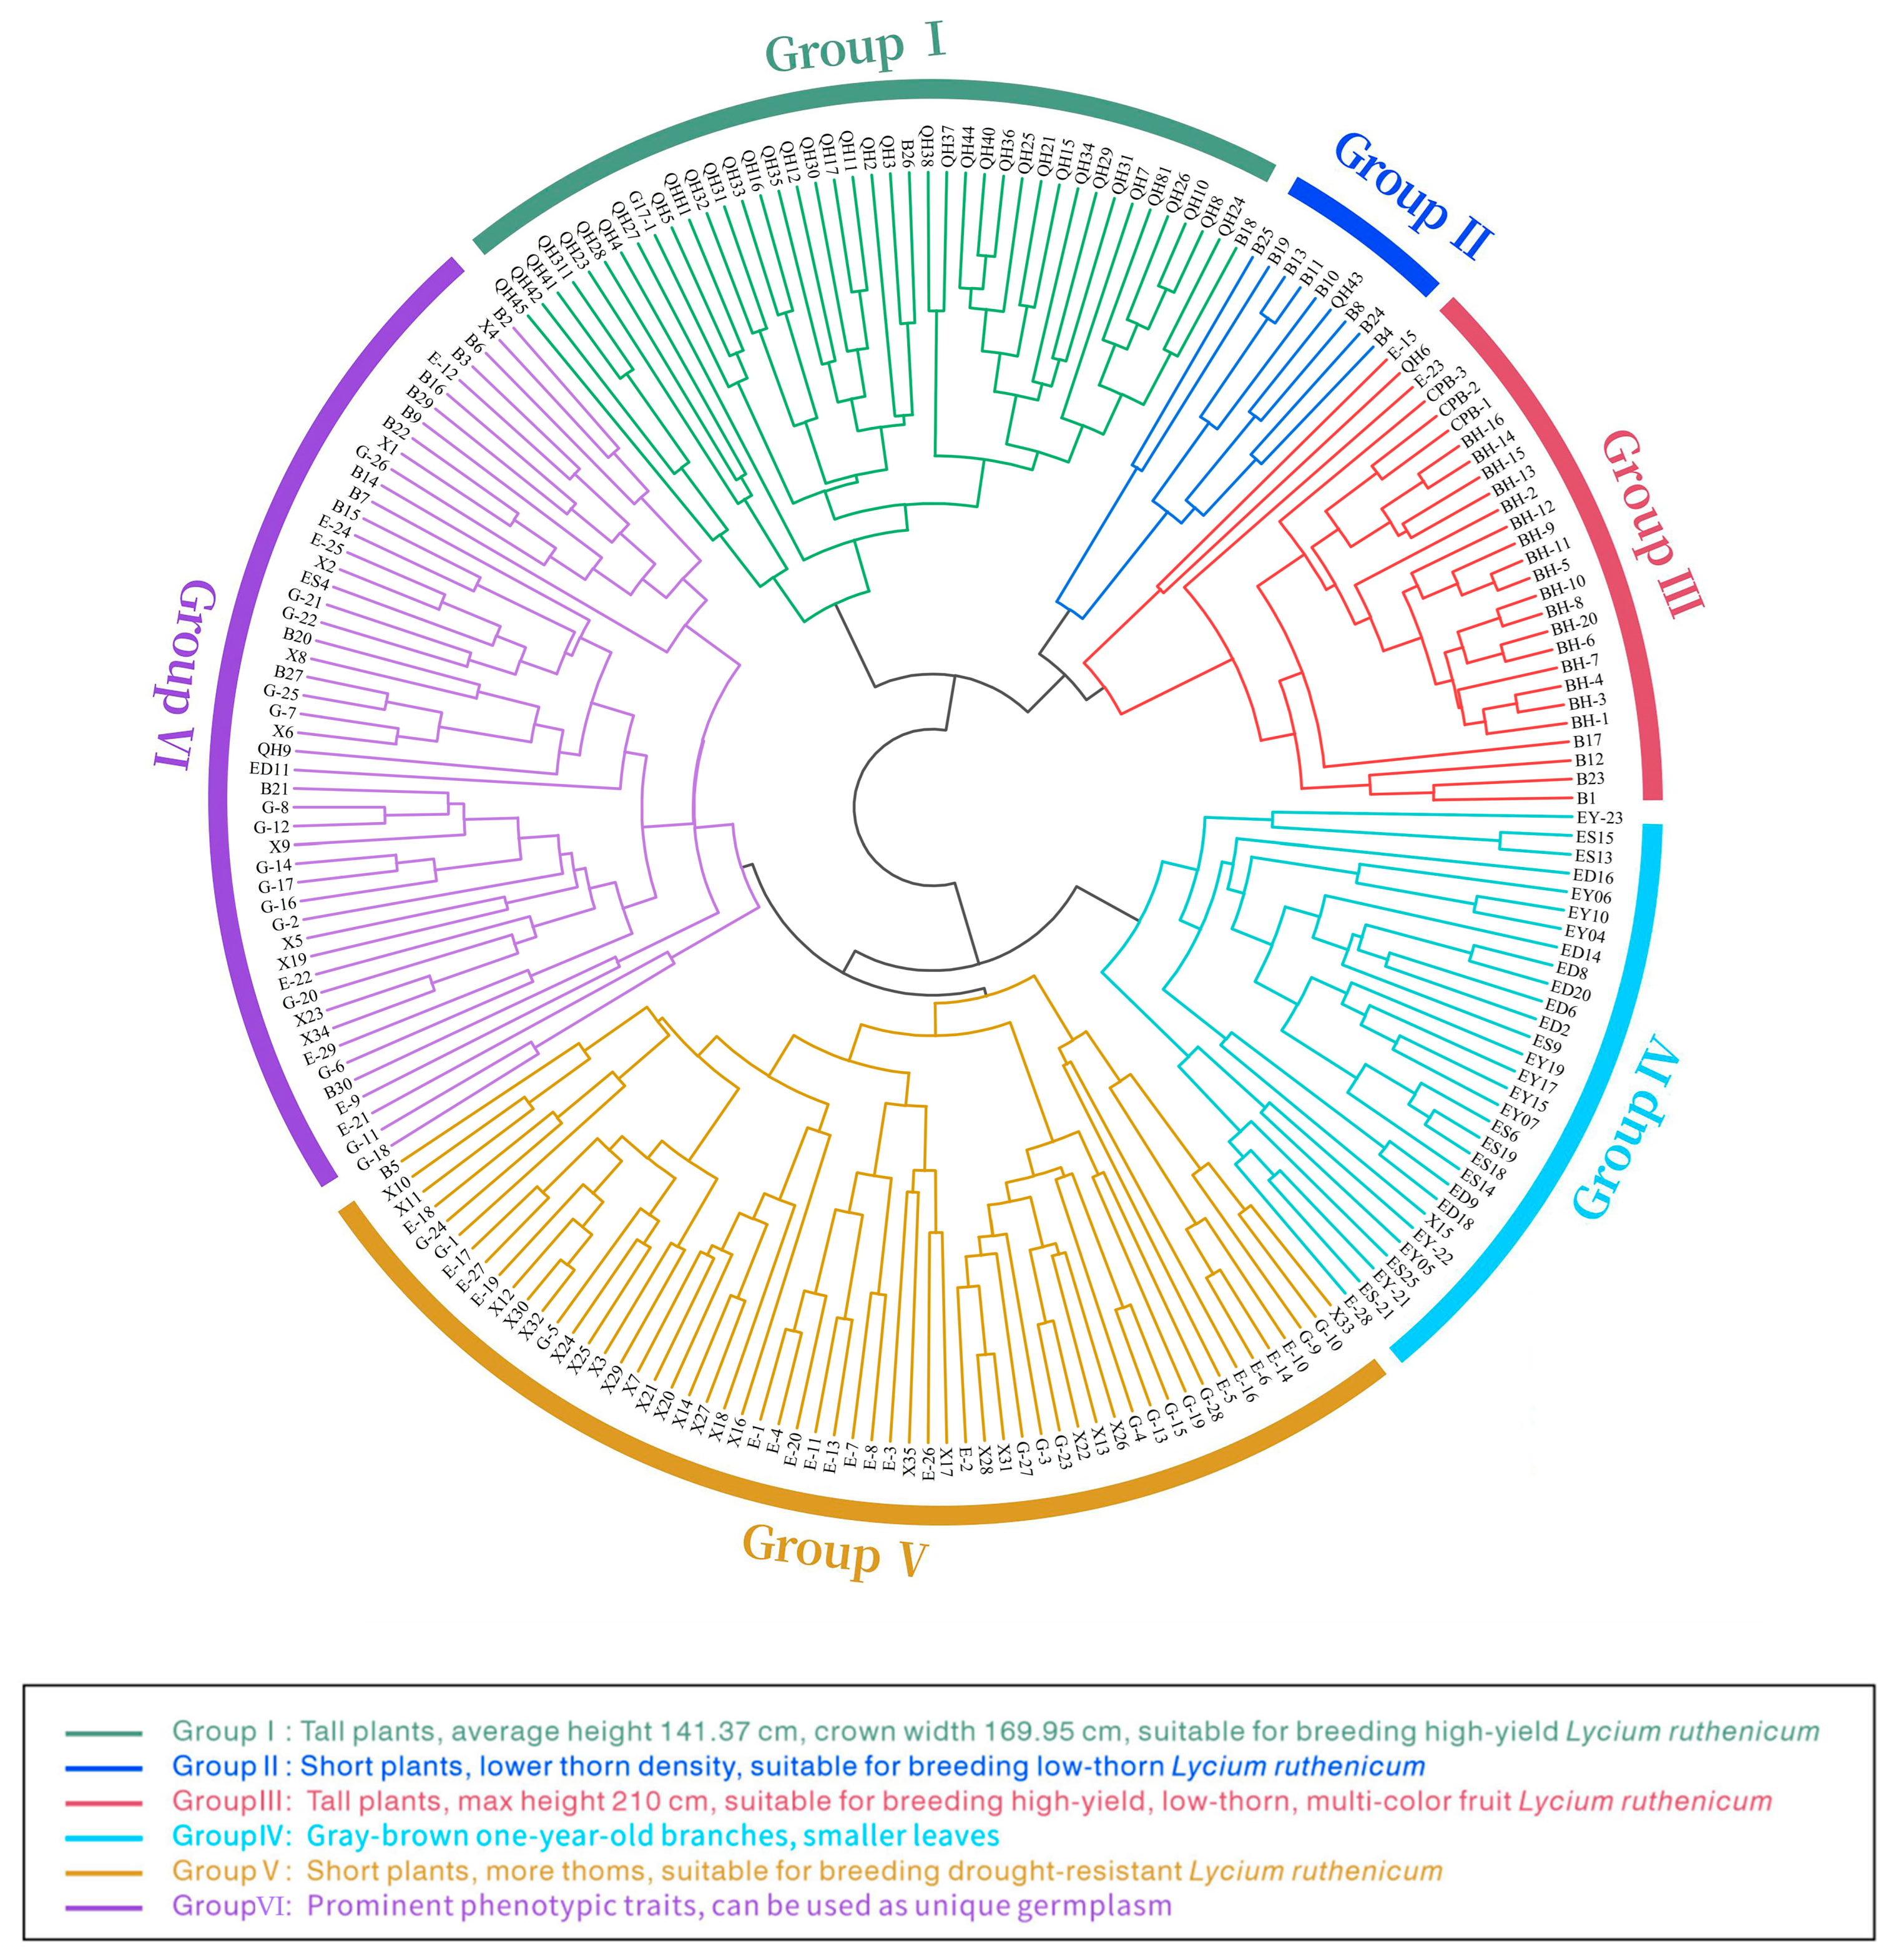
3.5. Q-Type Cluster Analysis of Phenotypic Traits

Cluster analysis based on phenotypic traits can reflect similarities and phylogenetic relationships among individuals. Using the absolute values of the feature vectors from the 10 principal components, Q-type clustering was performed on 19 selected indicators from the 31 traits. The results (Figure 4) show that the 213 Lycium ruthenicum samples were clustered into six groups.
Group I included 41 samples: 39 from Nuomuhong, Qinghai Province, 1 from Guazhou County, Gansu Province, and 1 from Urat Rear Banner, Bayannur, Inner Mongolia. This group had relatively tall plants with an average height of 141.37 cm and a crown width of 169.95 cm. They also had a high number of fruiting branches on one-year-old branches and larger leaf areas, making them suitable for breeding “high-yield Lycium ruthenicum”.
Group II consisted of nine samples: eight from Urat Rear Banner, Bayannur, Inner Mongolia, and one from Nuomuhong, Qinghai Province. These plants were shorter, had lower thorn density, shorter one-year-old branches, and fewer fruiting branches. This group is suitable for breeding “low-thorn Lycium ruthenicum”.
Group III included 27 samples: 6 from Urat Rear Banner, Bayannur, Inner Mongolia, and 21 from Nuomuhong, Qinghai Province. These plants were taller, with a maximum height of 210 cm and a crown width of 397 cm. They had a high number of fruiting branches, up to 300, vigorous growth, larger leaves, fewer thorns, and non-black fruit colors. This group is suitable for breeding “high-yield, low-thorn, multi-color fruit Lycium ruthenicum”.
Group IV consisted of 30 samples: 1 from Wushi County, Aksu, Xinjiang Province, and 29 from Dalaihubu Town, Ejina Banner, Inner Mongolia. This group had gray-brown one-year-old branches and smaller leaves.
Group V included 57 samples: 24 from Wushi County, Aksu, Xinjiang Province, 13 from Guazhou County, Gansu Province, and 20 from Dalaihubu Town, Ejina Banner, Inner Mongolia. These plants were smaller, had more thorns, and fewer fruiting branches. The main difference between Group IV and Group V was branch color. Group V had more thorns, potentially related to drought resistance, making it suitable for breeding “drought-resistant Lycium ruthenicum”.
Group VI included the remaining 49 samples, primarily from Inner Mongolia, Gansu, and Xinjiang. This group exhibited several prominent phenotypic traits and can be further developed and utilized as unique germplasm materials.
The 213 seedlings originated from eight geographical locations. Some seedlings from the same source clustered together, while others from different sources also clustered together, indicating relative aggregation and mixed distribution of seedlings from the same geographical origin.

4. Discussion

Forest and grass germplasm resources form the material basis for forest and grass breeding, with the diversity of breeding materials serving as a prerequisite for ensuring multi-target breeding [6,20]. Phenotypic diversity, the external morphological expression of plants resulting from the combined effects of genes and the environment, intuitively reflects the genetic diversity of species, making it a fundamental and convenient method for evaluating variation. It has significant implications for cultivating high-quality varieties and improving agronomic traits, as well as serving as an important basis for the conservation, research, and selection of new germplasm resource varieties [21,22].
This study, guided by the distinctness, uniformity, and stability guidelines for the genus Lycium ruthenicum, presents the first comprehensive and systematic investigation of the phenotypic traits of Lycium ruthenicum, encompassing branches, leaves, thorns, flowers, fruits, and seeds. We analyzed the diversity and differentiation of 31 phenotypic traits in 213 germplasm resources, finding rich and highly diverse phenotypic variation, with the diversity index of quantitative traits surpassing that of pseudo-qualitative traits.
The CV reflects the dispersion of traits among individuals, with a higher CV indicating greater dispersion and richer phenotypic diversity [23]. In this study, the CVs of the 31 phenotypic traits ranged from 17.26% to 105.41%, with an average of 39.85%. All traits exhibited CVs greater than 15%, indicating substantial phenotypic diversity. Previous studies by Lu et al. [24] have shown that cultivated Lycium ruthenicum exhibits greater variability in fruit traits, leaf morphology, and branch characteristics compared to wild Lycium ruthenicum. In this study, the CVs of leaf traits, plant traits, and branch traits in wild Lycium ruthenicum from different sources under artificial propagation conditions were relatively high, indicating varying degrees of variability and diversity. Notably, the CV for the number of fruiting branches on one-year-old branches was the highest (105.41%), followed by leaf area (74.7%). This may be attributable to plant pruning and watering under artificial cultivation conditions, as water significantly impacts leaf size.
Furthermore, CVs can reflect the rate of evolution to some extent. Our study found that the CVs for pseudo-qualitative traits related to thorns in Lycium ruthenicum were relatively low, but the diversity level of their quantitative traits was high. This aligns with the breeding direction for Lycium ruthenicum, indicating that there is room for improvement in thorn traits, although the cultivation of thornless plants remains a challenge.
PCA reduces the dimensionality of a dataset by integrating and compressing numerous indicators into a smaller number of composite indicators that reflect more information. This simplifies the resource evaluation and screening process [25] and is a powerful tool for reducing the dimensions of multivariate datasets. Its application in the assessment of agronomic traits is also increasing [26]. In this study, PCA identified 10 principal components with a cumulative contribution rate of 74.03%. The 31 selected phenotypic traits were reduced to 19 representative indicators, revealing that traits such as leaf size, fruit size, seed, thorn, and corolla significantly contribute to the phenotypic diversity of Lycium ruthenicum. This finding aligns with the results of Wang et al. [14]. These traits should be the focus in future evaluations and breeding programs for Lycium ruthenicum. Moreover, correlation analysis also indicates that there is a highly significant relationship (p < 0.01) between the leaf traits, fruit size, and characteristics of annual branches of Lycium ruthenicum. These traits can serve as important indicators in the evaluation and breeding of Lycium ruthenicum germplasm resources in the future, and should be given special attention.
Li et al. [27] investigated the reproductive allocation patterns of Lycium ruthenicum populations across various habitat conditions, discovering that these conditions significantly influence the growth indices, reproductive allocation, and morphological traits of Lycium ruthenicum. To fully and effectively utilize the superior Lycium ruthenicum resources from different regions, it is crucial to conduct identification and evaluation of different sources and types of Lycium ruthenicum under uniform ecological conditions. Lin et al. [28] utilized ISSR molecular markers to assess the genetic diversity of 16 Lycium ruthenicum populations in the Heihe River Basin. Their findings indicate that Lycium ruthenicum possesses a rich genetic background with high genetic diversity at the population level, although the correlation between genetic diversity and provenance was not significant. Similarly, Wang et al. [29] employed AFLP molecular markers to analyze the genetic diversity of 120 samples from five wild Lycium ruthenicum populations in the Qaidam Basin, concluding that there is no significant correlation between genetic distance and geographical distance. Therefore, phenotypic screening and evaluation of Lycium ruthenicum from different geographical sources under identical ecological conditions is of critical importance for the classification and identification of breeding materials of Lycium ruthenicum.
In this study, 213 samples from the germplasm nursery were classified into six major groups using phenotypic clustering analysis, with the characteristics of each group preliminarily identified. This classification will aid the research team in the efficient development and utilization of the germplasm nursery’s resources and will also serve as a foundation for selecting effective molecular markers for Lycium ruthenicum in future research. Group I had a higher number of fruiting branches on one-year-old branches and larger leaf area, making it suitable for breeding high-yield Lycium ruthenicum. Group II had lower thorn density and could be used for breeding low-thorn Lycium ruthenicum. Group III had taller plants, larger leaves, fewer thorns, and non-black fruit colors, making it suitable for breeding high-yield, low-thorn, multi-colored fruit Lycium ruthenicum and for developing leaf-use Lycium ruthenicum. Groups IV and V had smaller leaves and more thorns, making them suitable for breeding drought-resistant resources. Group VI had several outstanding phenotypic traits, making it a valuable source for further development and utilization as unique germplasm material.
The study also found that the clustering results did not entirely correspond with the distribution of germplasm sources. Lycium ruthenicum from the same source exhibited both aggregation and association with germplasm from other sources. This is primarily due to the fact that, although the germplasm resources used in this experiment were obtained from different wild environments, they were artificially sown under the same conditions. This minimized the genetic influence of different habitats on the germplasm resources and highlighted the impact of the artificial cultivation environment on their morphological expression [30]. Additionally, Lycium ruthenicum exhibited morphological variation under artificial cultivation, which can accelerate branch growth and reduce thorns, facilitating fruit harvesting [31]. Therefore, optimizing phenotypic traits under artificial cultivation conditions can further aid in the development and utilization of high-quality Lycium ruthenicum germplasm resources.
This study established methods for measuring phenotypic traits of Lycium ruthenicum based on pseudo-qualitative and quantitative traits, evaluated the main phenotypic indicators, and presented clustering results. These data lay the foundation for subsequent genome-wide association studies on phenotypic traits and the selection and breeding of new Lycium ruthenicum varieties. Future research should focus on the relationship between the phenotype and genomics of Lycium ruthenicum Murr., and how changes in external soil conditions may alter breeding strategies [32].

5. Conclusions

The 213 Lycium ruthenicum germplasm resources exhibited significant phenotypic variation, with the diversity of quantitative traits being higher than that of pseudo-qualitative traits. Leaf and fruit size contributed most to this phenotypic diversity, followed by seeds, thorns, and corolla color. The study results indicate that the phenotypic variation in Lycium ruthenicum germplasm is rich, with higher diversity in quantitative traits compared to pseudo-qualitative traits. The CV value for the presence or absence of thorns in Lycium ruthenicum is relatively low, but the variation in thorn length and density is quite high. This suggests there is potential for improvement in thorn traits, although breeding for thornless plants still has a way to go. Additionally, there is a highly significant correlation (p < 0.01) between leaf traits, fruit size, and traits of one-year-old branches in Lycium ruthenicum. These traits should be considered important indicators for germplasm selection in future Lycium ruthenicum germplasm evaluation and breeding efforts, and should receive particular attention. Principal component analysis reduced 31 phenotypic traits to 19, capturing the majority of phenotypic information. Q-type clustering categorized the 213 samples into six groups, clarifying the characteristics and breeding value of each group. These findings effectively highlight the phenotypic variation in Lycium ruthenicum germplasm resources and provide valuable insights for their genetic improvement, conservation, and future utilization.

Author Contributions

Conceptualization, R.Y. and Y.B.; methodology, R.Y.; software, R.Y.; validation, R.Y.; formal analysis, R.Y.; investigation and data curation, J.L., H.H., R.W. and X.W.; writing—original draft preparation, R.Y.; writing—review and editing, R.Y. and Y.B.; visualization, R.Y. and H.H.; supervision, Y.B.; project administration, Y.B. All authors have read and agreed to the published version of the manuscript.

Funding

This research was funded by the Major Project in the Inner Mongolia Autonomous Region, grant number 2021ZD0041 and the “Open bidding for selecting the best candidates” project for enhancing research capabilities of the Inner Mongolia Autonomous Region Academy of Forestry Science, grant number 2024NLTS02.

Data Availability Statement

Data are contained within the article.

Conflicts of Interest

The authors declare no conflicts of interest.

References

  1. Mo, S.; Biao, A.; Wang, Z.; Lin, S.; Yang, T.; Pan, L.; Wang, Y.; Zeng, S. Spatio transcriptome uncover novel insight into the Lycium ruthenicum seedling tolerant to salt stress. Ind. Crops Prod. 2022, 177, 114502. [Google Scholar] [CrossRef]
  2. Muhammad, M.; Waheed, A.; Wahab, A.; Majeed, M.; Nazim, M.; Liu, Y.-H.; Li, L.; Li, W.-J. Soil salinity and drought tolerance: An evaluation of plant growth, productivity, microbial diversity, and amelioration strategies. Plant Stress 2024, 11, 100319. [Google Scholar] [CrossRef]
  3. Zhang, G.; Chen, S.; Zhou, W.; Meng, J.; Deng, K.; Zhou, H.; Hu, N.; Suo, Y. Anthocyanin composition of fruit extracts from Lycium ruthenicum and their protective effect for gouty arthritis. Ind. Crops Prod. 2019, 129, 414–423. [Google Scholar] [CrossRef]
  4. Yun, D.; Yan, Y.; Liu, J. Isolation, structure and biological activity of polysaccharides from the fruits of Lycium ruthenicum Murr: A review. Carbohydr. Polym. 2022, 291, 119618. [Google Scholar] [CrossRef] [PubMed]
  5. Ninomiya, S.; Baret, F.; Cheng, Z.-M. Plant Phenomics: Emerging Transdisciplinary Science. Plant Phenomics 2019, 2019, 2765120. [Google Scholar] [CrossRef]
  6. Tao, J.; Qiao, G.; Wen, X.; Gao, G.; Liu, T.; Peng, Z.; Cai, Y.; Chen, N.; Yan, F.; Zhang, B. Characterization of genetic relationship of dragon fruit accessions (Hylocereus spp.) by morphological traits and ISSR markers. Sci. Hortic. 2014, 170, 82–88. [Google Scholar] [CrossRef]
  7. Kumar, S.; Kirk, C.; Deng, C.; Wiedow, C.; Knaebel, M.; Brewer, L. Genotyping-by-sequencing of pear (Pyrus spp.) accessions unravels novel patterns of genetic diversity and selection footprints. Hortic. Res. 2017, 4, 17015. [Google Scholar] [CrossRef] [PubMed]
  8. Yin, M.; Gao, F.; Wuyun, T. High-level genetic diversity of Siberian apricot (Armeniaca sibirica (L.) Lam) in Inner Mongolia as revealed by phenotypic traiting. J. Plant Genet. Resour. 2017, 18, 242–252. (In Chinese) [Google Scholar]
  9. Ai, P.; Zhen, Z.; Jin, Z. Genetic diversity and relationships within sweet kernel apricot and related Armeniaca species based on sequence-related amplified polymorphism markers. Biochem. Syst. Ecol. 2011, 39, 694–699. [Google Scholar] [CrossRef]
  10. Wang, H.; Li, J.; Tao, W.; Zhang, X.; Gao, X.; Yong, J.; Zhao, J.; Zhang, L.; Li, Y.; Duan, J.-A. Lycium ruthenicum studies: Molecular biology, Phytochemistry and pharmacology. Food Chem. 2018, 240, 759–766. [Google Scholar] [CrossRef]
  11. Zhang, P.; Yang, M.K.; Zhu, J.; Li, X.J.; Feng, R.; Xu, R.; Chen, J. Study on phenotypic diversity and cluster analysis of Cistanche Herba in different populations in Xinjiang. China J. Chin. Mater. Medica 2018, 43, 3841–3847. (In Chinese) [Google Scholar]
  12. Wang, Q.; Zeng, S.; Wu, X.; Lei, H.; Wang, Y.; Tang, H. Interspecies Developmental Differences in Metabonomic Phenotypes of Lycium ruthenicum and L. barbarum Fruits. J. Proteome Res. 2018, 17, 3223–3236. [Google Scholar] [CrossRef] [PubMed]
  13. Qi, Y.; Zhu, C.; Chen, J.; Liu, G.; Yang, Z.; Chen, W. Comparative analysis of the quality and health-promoting compounds of two-shaped fruits of wild Lycium ruthenicum Murr. from the Qinghai–Tibet Plateau. Acta Physiol. Plant. 2019, 41, 101. [Google Scholar] [CrossRef]
  14. Wang, X.; Li, M.; Tao, L.; Zhang, B.; He, X.; Mi, J.; Xu, W. Study on the Genetic Diversity of Phenotypic and Quality Traits of 48 Germplasm Resources of Lycium ruthenicum Murr. J. Henan Agric. Sci. 2023, 52, 78–90. (In Chinese) [Google Scholar]
  15. GB/T 19557.1–2004; General Directives for the Conduct of Tests of Distinctness, Uniformity and Stability for New Varieties of Plants. Standards Press of China: Beijing, China, 2004.
  16. Ferreira, N.G.; Yoshimitsu, M.S.; Naomi, K.K.; Giraldo, M.S.; Damião, C.C.; Valadares, d.S.W. Genetic diversity of Syagrus coronata and principal component analysis of phenotypic traits: A palm from the brazilian semiarid biome. Biodivers. Conserv. 2023, 32, 4275–4293. [Google Scholar]
  17. Karim, H.; Ahmed, D.; Jamal, C.; Lahcen, H.; Mohamed, E.F.; Abdelghani, N. Appropriate statistical methods for analysis of safflower genetic diversity using agglomerative hierarchical cluster analysis through combination of phenotypic traits and molecular markers. Crop Sci. 2021, 61, 4164–4180. [Google Scholar]
  18. Ana, U.; Marina, Ć.; Dalibor, Ž.; Radu, G.; Leif, S.; Ellen, S.; David, L. Phenotypic and Genotypic Characterization and Correlation Analysis of Pea (Pisum sativum L.) Diversity Panel. Plants 2022, 11, 1321. [Google Scholar] [CrossRef]
  19. Santhy, V.; Rathinavel, K.; Saravanan, M.; Meshram, M.; Priyadharshini, C. Genetic diversity assessment of extant cotton varieties based on Principal Component Analysis (PCA) and cluster analysis of enlisted DUS traits. Electron. J. Plant Breed. 2020, 11, 430–438. [Google Scholar]
  20. Koskela, J.; Vinceti, B.; Dvorak, W.; Bush, D.; Dawson, I.K.; Loo, J.; Kjaer, E.D.; Navarro, C.; Padolina, C.; Bordács, S.; et al. Utilization and transfer of forest genetic resources: A global review. For. Ecol. Manag. 2014, 333, 22–34. [Google Scholar] [CrossRef]
  21. Upadhyaya, H.; Gowda, C.; Sastry, D. Plant genetic resources management: Collection, characterization, conservation and utilization. J. SAT Agric. Res. 2008, 6, 16pp. [Google Scholar]
  22. Peng, L.; Ru, M.; Wang, B.; Wang, Y.; Li, B.; Yu, J.; Liang, Z. Genetic diversity assessment of a germplasm collection of Salvia miltiorrhiza Bunge. based on morphology, ISSR and SRAP markers. Biochem. Syst. Ecol. 2014, 55, 84–92. [Google Scholar] [CrossRef]
  23. Mahmoud, A.; Osman, N. Utilizing genetic diversity to select tomato lines tolerant of tomato yellow leaf curl virus based on genotypic coefficient of variation, heritability, genotypic correlation, and multivariate analyses. Braz. J. Bot. 2023, 46, 609–624. [Google Scholar] [CrossRef]
  24. Lu, W.; Wang, Z.; Fan, G. Morphological variation of Lycium ruthenicum under artificial cultivation conditions. Nonwood For. Res. 2014, 32, 171–174. (In Chinese) [Google Scholar]
  25. Salem, N.; Hussein, S. Data dimensional reduction and principal components analysis. Procedia Comput. Sci. 2019, 163, 292–299. [Google Scholar] [CrossRef]
  26. Lee, O.; Park, H. Assessment of genetic diversity in cultivated radishes (Raphanus sativus) by agronomic traits and SSR markers. Sci. Hortic. 2017, 223, 19–30. [Google Scholar] [CrossRef]
  27. Li, D.; Zhang, Z.; Tang, W.; Li, Q. Reproductive allocation characteristics of Lycium barbarum population in different habitats. J. Northwest For. Univ. 2021, 36, 144–149. (In Chinese) [Google Scholar]
  28. Lin, L.; Zhang, M.; Du, Z.; Zhu, T.; Sun, S.; Jin, L. Analysis on genetic diversity of 16 populations of Lycium ruthenicum Murr. in middle and lower reaches of Heihe River basin based on ISSR molecular markers. Chin. J. Inf. Tradit. Chin. Med. 2019, 26, 62–67. (In Chinese) [Google Scholar]
  29. Wang, J.; Chen, J.; Chen, W.; Zhou, X.; Xu, D.; Li, J.; Qi, X. Population genetic diversity of wild Lycium ruthenicum in Qaidam inferred from AFLP markers. Chin. J. Plant Ecol. 2015, 39, 1003–1011. (In Chinese) [Google Scholar]
  30. Gong, H.; Rehman, F.; Ma, Y.; Zeng, S.; Yang, T.; Huang, J.; Wang, Y. Germplasm resources and strategy for genetic breeding of Lycium species: A Review. Front. Plant Sci. 2022, 13, 802936. [Google Scholar] [CrossRef]
  31. Zhang, J.; Yang, H.; Liu, F.; Li, H. Research Progress of Chemical Constituents Pharmacological Activity and Cultivation Techniques of Lycium ruthenicum Murr. J. Food Sci. Biotechnol. 2018, 37, 673–678. [Google Scholar]
  32. Wang, Z.; Zhang, W.; Huang, W.; Biao, A.; Lin, S.; Wang, Y.; Yan, S.; Zeng, S. Salt stress affects the fruit quality of Lycium ruthenicum Murr. Ind. Crops Prod. 2023, 193, 116240. [Google Scholar] [CrossRef]
Figure 1. Frequency distribution of pseudo-qualitative traits in 213 Lycium ruthenicum.
Agronomy 14 01930 g001
Figure 2. Diversity of pseudo-qualitative traits in 213 Lycium ruthenicum.
Agronomy 14 01930 g002
Figure 3. Correlation analysis of 31 phenotypic traits. NFBBOB stands for Number of Fruit-Bearing Branches on One-Year-Old Branches, and MNFCSBOB stands for Maximum Number of Flowers in Clusters on Short Branches of One-Year-Old Branches.
Agronomy 14 01930 g003
Figure 4. Q-type cluster analysis of 213 Lycium ruthenicum Murr.
Agronomy 14 01930 g004
Table 1. Collection information and numbered information of germplasm resources.
NumberProvenanceProvinceProvenance NumberLatitude and LongitudeElevation (m)Field NumberQuantity
1Urad Rear BannerInner MongoliaBE:106.56; N:40.80996B1~B3029
2DalaihubuzhenInner MongoliaEE:100.97; N:41.858900E1~E2929
3Subonao’er SumuInner MongoliaESE:101.04; N:42.12869ES4, ES6, ES9, ES13~ES15, ES18~19, ES21, ES2510
4DongfengzhenInner MongoliaEDE:101.07; N:42.01873ED2, ED6, ED8~ED9, ED11, ED14, ED16, ED18, ED209
5Saihantaolai SumuInner MongoliaEYE:100.59; N:41.88911EY04~EY07, EY10, EY15, EY17, EY19, EY21~EY2311
6Guazhou CountyGansuGE:94.99; N:40.261274G1~G17, G17-1, G18~G2829
7Uqturpan CountyXinjiangXE:78.53; N:41.31379X1~X2535
8NuomuhongQinghaiQE:96.19; N:36.252712QH1~QH12, QH15~QH17, QH21, QH23, QH24~QH38, QH40~QH45, QH3-1, QH8-1, QH21, QH31-1, BH1~BH16, BH20, CPB1~CPB361
Table 2. Grading and assignment of 11 pseudo-qualitative traits surveyed.
TraitsGrading and Assignment of Values
Corolla ColorFull Color = 1, White = 2, Light Purple = 3, Medium Purple = 4, White and Light Purple = 5, White and Medium Purple = 6, Light Purple and Medium Purple = 7
Petal Apex ShapeBlunt = 1, Sharp = 2
Plant ThornsPresent = 1, Very Few = 2, None = 3
Plant TypeUpright = 1, Upright to Semi-Upright = 2, Semi-Upright = 3, Prostrate = 4
Fruit ColorBlack = 1, Red = 2, Yellow = 3, Brownish Red = 4, Multicolored = 5
Fruit ShapeLong Elliptical = 1, Medium Elliptical = 2, Round = 3, Flattened Spherical = 4, Ovoid = 5
Seed ColorYellow = 1, Brown = 2
One-year-old Branch ColorWhite = 1, Yellow = 2, Gray-Brown = 3
Perennial Branch ColorGray-Brown = 1, Yellow-Brown = 2, Brown = 3, Dark Brown = 4
Leaf ShapeLinear = 1, Narrow Lanceolate = 2, Broad Lanceolate = 3, Ovoid = 4, Linear and Narrow Lanceolate = 5
Leaf Apex ShapeAcute = 1, Acuminate = 2, Obtuse and Rounded = 3, Acuminate and Obtuse = 4
Table 3. Classification of 20 quantitative traits.
Estimated Value of TraitsLevel
x i   < x ¯ i 1.5 σ 1
x ¯ i 1.5 σ   x i < x ¯ i 0.5 σ 2
x ¯ i 0.5 σ   x i < x ¯ i + 0.5 σ 3
x ¯ i + 0.5 σ   x i < x ¯ i + 1.5 σ 4
x i     x ¯ i + 1.5 σ 5
Table 4. Diversity analysis of 20 quantitative traits.
Quantitative TraitsMeanMaximumMinimum σ CV (%)HD
Leaf Area (mm2)34.40182.6010.2025.7074.700.540.25
Leaf Perimeter (mm)41.1784.5618.2512.6830.791.200.62
Leaf Length (mm)21.1942.499.976.2529.521.230.63
Leaf Width (mm)3.117.371.001.0132.391.120.61
Leaf Length–Width Ratio7.3914.704.201.3017.601.300.68
Leaf Shape Factor0.250.420.100.0623.991.490.75
Leaf Thickness (mm)1.021.590.190.2221.121.440.73
Thorn Density14.7743.000.008.2055.501.410.73
Fruit Weight (g)0.220.600.060.0940.341.270.66
Fruit Vertical Diameter (mm)6.5412.254.511.1317.261.040.57
Fruit Horizontal Diameter (mm)7.9012.965.011.4318.101.280.69
Fruit Skin Thickness (mm)1.247.190.590.4737.631.110.60
Number of Seeds13.4830.003.335.0037.071.340.70
Pedicel Length (mm)7.9819.412.812.9536.951.300.68
Plant Height (cm)107.34210.0030.0037.2734.721.270.66
Crown Width (cm)126.54482.5042.5068.9354.471.040.60
One-Year-Old Branch Length (cm)17.6245.880.007.8444.521.190.63
One-Year-Old Branch Internode Length (mm)7.1317.392.172.5535.691.330.69
Number of Fruit-Bearing Branches on One-Year-Old Branches69.48410.000.0073.25105.410.910.47
Maximum Number of Flowers in Clusters on Short Branches of One-Year-Old Branches2.416.600.001.2049.651.310.69
Table 5. PCA of 31 phenotypic traits.
TraitsPrincipal Component Eigenvectors
PC1PC2PC3PC4PC5PC6PC7PC8PC9PC10
Corolla Color−0.2150.0420.197−0.4930.104−0.110−0.045−0.137−0.1360.163
Petal Apex Shape0.345−0.140−0.236−0.008−0.2780.1290.1610.5660.073−0.194
Plant Thorns0.158−0.242−0.207−0.4030.0140.2960.577−0.1040.0680.046
Plant Type−0.1550.058−0.332−0.3600.165−0.0320.0810.4050.1010.158
Fruit Color0.845−0.021−0.230−0.051−0.049−0.0790.076−0.0290.155−0.011
Fruit Shape−0.1840.2370.0310.266−0.160−0.036−0.2470.2270.556−0.306
Seed Color−0.238−0.2270.1400.282−0.0690.6500.1050.003−0.032−0.208
One-year-old Branch Color0.245−0.234−0.3930.448−0.1280.279−0.210−0.345−0.0220.144
Perennial Branch Color0.405−0.0550.052−0.0430.0320.2190.1880.080−0.1530.117
Leaf Shape0.063−0.1970.736−0.0520.2000.1500.078−0.1360.330−0.168
Acute Leaf Apex Shape−0.523−0.1120.596−0.0030.2140.0610.041−0.1560.264−0.030
Leaf Area (mm2)0.909−0.013−0.0550.0440.2120.026−0.117−0.009−0.040−0.100
Leaf Perimeter (mm)0.9090.0990.069−0.157−0.0860.182−0.168−0.011−0.047−0.098
Leaf Length (mm)0.9050.1220.037−0.179−0.1070.176−0.165−0.040−0.031−0.098
Leaf Width (mm)0.827−0.1180.068−0.1460.1980.193−0.2090.115−0.102−0.113
Leaf Length–Width Ratio0.0410.435−0.007−0.101−0.638−0.1410.086−0.3680.099−0.003
Leaf Shape Factor−0.100−0.231−0.1970.5110.587−0.2660.1840.0560.0790.047
Leaf Thickness (mm)−0.3120.0560.4970.037−0.0160.308−0.0900.282−0.2380.252
Thorn Density−0.4680.2630.2310.190−0.185−0.107−0.1740.239−0.328−0.113
Fruit Weight (g)0.0040.828−0.0730.0750.2210.2810.0840.017−0.0340.013
Fruit Vertical Diameter (mm)0.5490.488−0.3130.0940.2830.1680.076−0.1660.050−0.136
Fruit Horizontal Diameter (mm)−0.1990.8660.0460.0520.1900.0320.0570.0660.020−0.012
Fruit Skin Thickness (mm)0.0470.4030.044−0.1290.0480.202−0.2230.0630.3570.567
Number of Seeds−0.2690.4710.1600.257−0.0400.0060.416−0.098−0.258−0.128
Pedicel Length (mm)0.7830.1280.176−0.2270.112−0.133−0.085−0.0350.054−0.134
Plant Height (cm)0.752−0.0810.3860.236−0.086−0.049−0.0290.027−0.0730.155
Crown Width (cm)0.756−0.1330.2830.238−0.006−0.0870.0080.017−0.0850.250
One-Year-Old Branch Length (cm)0.7460.1480.2750.078−0.001−0.2530.0510.087−0.154−0.056
One-Year-Old Branch Internode Length (mm)0.8030.1150.0780.0660.183−0.2060.115−0.031−0.029−0.039
Number of Fruit-Bearing Branches on One-Year-Old Branches0.5410.010−0.0520.484−0.2110.0130.1740.0790.1590.347
Maximum Number of Flowers in Clusters on Short Branches of One-Year-Old Branches0.4540.0360.357−0.011−0.254−0.1410.4400.1480.1860.052
Eigenvalues8.8682.7912.3331.7911.4721.3021.2121.111.0691.001
Contribution Rates%28.619.007.535.784.754.203.913.583.453.23
Total Contribution Rates%28.6137.6145.1450.9155.6659.8663.7767.3570.8074.03
Disclaimer/Publisher’s Note: The statements, opinions and data contained in all publications are solely those of the individual author(s) and contributor(s) and not of MDPI and/or the editor(s). MDPI and/or the editor(s) disclaim responsibility for any injury to people or property resulting from any ideas, methods, instructions or products referred to in the content.

