Article

Effects of Composted Straw, Biochar, and Polyacrylamide Addition on Soil Permeability and Dynamic Leaching Characteristics of Pollutants in Loessial Soil in Urban Greenbelts According to Indoor Simulation Experiments

1
College of Natural Resources and Environment, Northwest A&F University, Yangling 712100, China
2
Key Laboratory of Plant Nutrition and the Agro-Environment in Northwest China, Ministry of Agriculture, Yangling 712100, China
*
Author to whom correspondence should be addressed.
Agronomy 2024, 14(9), 1958; https://doi.org/10.3390/agronomy14091958
Submission received: 22 July 2024 / Revised: 22 August 2024 / Accepted: 27 August 2024 / Published: 29 August 2024

Abstract

:
Urban greenbelt soil is currently severely degraded and unable to meet the needs of sponge city construction. Therefore, this study involved adding modified materials, such as decomposed straw, straw biochar, and PAM (polyacrylamide), to greenbelt soil (collected from the Xixian New Area, a pilot city for sponge city construction in China). This study was conducted to explore the effects of adding modified materials on soil physical properties and pollutant adsorption capacity through indoor simulation experiments and dynamic leaching experiments (in the dynamic leaching experiments, the medium thickness was 40 cm, and a water outlet was set every 10 cm to collect the filtrate). In this study, three experimental treatments were set up: (1) soil–sand–decomposed straw + PAM (SSJ), (2) soil–sand–biochar + PAM (SSB), and (3) soil–sand–decomposed straw–biochar + PAM (SSBJ). In the three treatments, the addition amounts of soil, sand, and PAM (0.01 g·mL−1) were constant at 560 kg·m−3, 624 kg·m−3, and 76 L·m−3, respectively. The addition amounts of decomposed straw in the SSJ and SSBJ treatments were 100 kg·m−3 and 50 kg·m−3, respectively. The amounts of added biochar in the SSJ and SSBJ treatments were 32 kg·m−3 and 16 kg·m−3, respectively. The saturated hydraulic conductivity and saturated water content of the different treatments increased by 92.90–107.10% and 19.07–32.17%, respectively, compared with the background values. As the depth increased, the leaching concentrations of N and COD (chemical oxygen demand) at 40 cm in the different treatments increased by 282.66–1374.02% and 435.10–455.84%, respectively, compared with those at 10 cm. However, the leaching concentrations of Cu, Zn, Cd, and P changed little with increasing depth. As the flow load increased, the leaching concentration of the pollutant pattern was not obvious. After the leaching of pollutants stabilized, at 40 cm, the leaching concentrations of N, P, and COD for the SSJ, SSBJ, and SSB treatments were 5.46–56.30 mg·L−1, 0.14–2.06 mg·L−1, and 1034.23–1531.40 mg·L−1, respectively. The retention rates of Cu, Zn, and Cd showed a small trend over time, and the retention rates were all above 86%. Overall, the SSB treatment had a strong ability to intercept N, P, and COD, whereas the SSBJ treatment had a strong ability to intercept Cu, Zn, and Cd. These research results can provide a reference for the improvement of greenbelts in sponge city construction.

1. Introduction

In recent years, due to the rapid increase in urban paved roads and climate change, there has been a surge in runoff, leading to frequent urban waterlogging disasters in China. Owing to the intensification of atmospheric pollution and the increase in urban vehicles, urban runoff pollution is also becoming increasingly severe, posing a large threat to water quality safety [1,2,3]. On this basis, China has launched the construction of sponge cities. A sponge city refers to a city that, like a sponge, has good “elasticity” in adapting to environmental changes and responding to natural disasters. It absorbs, stores, seeps, and purifies water during rainfall and releases and utilizes the stored water when needed [4]. Urban greenbelts, as important sites in sponge city construction, play a role in reducing road traffic and conserving water resources [5]. Fully utilizing the functions of green spaces is important for alleviating urban waterlogging and urban runoff pollution [6,7]. However, owing to the influence of human activities, soil degradation in urban greenbelts is severe, resulting in a series of problems, such as increased compactness, decreased saturated hydraulic conductivity, and weak pollutant adsorption performance [8,9]. These problems make it difficult for such sites to regulate runoff and water quality to their full extent; therefore, the situation urgently needs improvement. Improving soil by adding modifiers is currently a commonly used measure in urban greenbelt soil improvement [10,11]. There are various types of soil modification materials available on the market, among which composted straw, biochar, and PAM (polyacrylamide) are commonly used as improvement materials. Owing to their rich variety of raw materials and low cost, these materials have been widely promoted and utilized in soil improvement [9,11,12].
Research has shown that applying composted straw, biochar, and PAM to soil can improve the soil bulk density, increase the soil water capacity and infiltration capacity due to their cementation effect and high specific surface area, and partially reduce the leaching loss of soil nutrients and the adsorption and passivation of heavy metals in soil [12,13,14]. Hao et al. [15] reported that when biochar is combined with composted straw, a ratio of 1:1 can significantly (p < 0.05) increase the saturated hydraulic conductivity and saturated water content of the soil. Research by Wang et al. [16] revealed that when PAM is applied in combination with composted straw and biochar, the improvement effect on the saturated hydraulic conductivity and saturated water content of the soil is the greatest for a PAM dosage of 1%. If the concentration is exceeded, the improvement effect on the soil will be reduced. Moreover, there are currently various opinions on the effectiveness of biochar and composted straw for improving soil. Zhou et al. [17] reported that the infiltration and water retention performance of soil supplemented with biochar were greater than those of soil supplemented with straw, but Peng et al. [18] reported the opposite results. The above research indicates that, due to differences in the properties of biochar and soil, the results of different experiments are inconsistent or even contradictory, resulting in confusion, which hinders the promotion and application of biochar. Various factors, such as the amount, frequency, and depth of application of biochar, can also affect the improvement effect of biochar. Therefore, further research is needed on the effects of the application of biochar and decomposed straw on soil improvement in urban green spaces [19].
The application of composted straw and its preparation into biochar for urban greenbelt soil improvement can not only improve the quality of urban greenbelt soil but also, to a certain extent, broaden the resource utilization of straw and reduce the environmental pollution caused by straw burning, with a variety of ecological and environmental benefits. Currently, most research on soil improvement in urban greenbelt soil considers only a single aspect of soil permeability improvement or pollutant removal, while relatively few studies have comprehensively considered the permeability and pollutant removal of green soil with different modifiers [20,21]. Therefore, this study builds on existing research results [15,16]. This study included three treatments: soil–sand–composted straw + PAM, soil–sand –biochar + PAM, and soil–sand–composted straw–biochar + PAM. Taking the Xixian New Area, a pilot city for the construction of sponge cities in China, as the research object, indoor simulation experiments were conducted to explore the water conductivity and water retention performance of different treatments, as well as the dynamic leaching characteristics of N, P, COD (chemical oxygen demand), Cu, Zn, and Cd. The appropriate treatments for soil improvement in urban green spaces were identified to provide a reference for soil improvement in urban greenbelts.

2. Materials and Methods

2.1. Experimental Materials

The test soil was collected from the urban green belt soil of the Xixian New Area (108° 76, E, 34° 44, N) in Xi’an city, Shaanxi Province (passing a 2 mm sieve), and the soil type was loessial soil. The sand (purchased from Xixian New Area, Xi’an City, Shaanxi Province) was passed through a 3 mm soil sieve. PAM is anionic and has a molecular weight of 12 million. The decomposed straw was the product of wheat straw after composting, and the biochar was wheat straw biochar (the firing temperature of the biochar was 500 °C). Wheat straw was harvested from Yangling District, Shaanxi Province, China. The basic properties of the material are shown in Table 1.

2.2. Experimental Process

2.2.1. Soil–Laboratory Incubation Test

After the different materials were thoroughly mixed (Table 2), they were placed in a plastic box with a diameter of 13.5 cm and a height of 9 cm. When filling, the soil should be compacted to ensure that the bulk density is at the same level as the soil bulk density of the green space in the Xixian New Area (1.4 g·cm−3). The clay content of the soil was 7.47%, the silt content was 64.58%, the sand content was 27.95%, the saturated moisture content was 40.87%, the electrical was 1.0 μS · cm−1, the cation exchange capacity was 1.0 cmol (+) kg−1, the organic matter content was 16.9 g·kg−1, the total nitrogen content was 0.5 g·kg−1, and the pH was 7.69 (water–soil ratio of 5:1). The filled soil was placed on the South Campus of Northwest A&F University for cultivation. During the soil–laboratory incubation test period, the samples were watered down via the weighing method to ensure a mass moisture content of 23%–25%, and the soil–laboratory incubation period lasted for 30 days. After cultivation, a special cutting ring with a diameter and height of 5 cm was used for sampling to determine the saturated hydraulic conductivity, saturated water content, and bulk density. Each experiment was repeated three times. The soil bulk density was determined via the ring knife method [22]. The saturated hydraulic conductivity of the soil was measured via the double ring method [23]. The soil saturated water content was determined via the weighing method [24]. The soil particle size was determined via a Malvern laser particle size analyzer [25]. The soil conductivity was measured via a conductivity meter [26]. The cation exchange capacity was determined via sodium acetate flame photometry [27]. The soil pH was measured via a pH meter (water–soil = 2.5:1) [28]. The soil carbon and nitrogen contents were measured via an elemental analyzer [29]. The carbon and nitrogen contents of the decomposed straw and biochar were determined via an elemental analyzer [29]. The pH of the decomposed straw and biochar was measured via a pH meter (water–soil = 20:1) [29]. The specific surface areas of decomposed straw and biochar were measured via a specific surface area analyzer [29]. The maximum water holding capacity of decomposed straw and biochar was determined according to the field water holding capacity measurement method [29]. The total phosphorus content of the decomposed straw and biochar was determined via the vanadium molybdenum yellow colorimetric method [29]. The bulk density of decomposed straw and biochar was determined according to the soil bulk density measurement method [29].

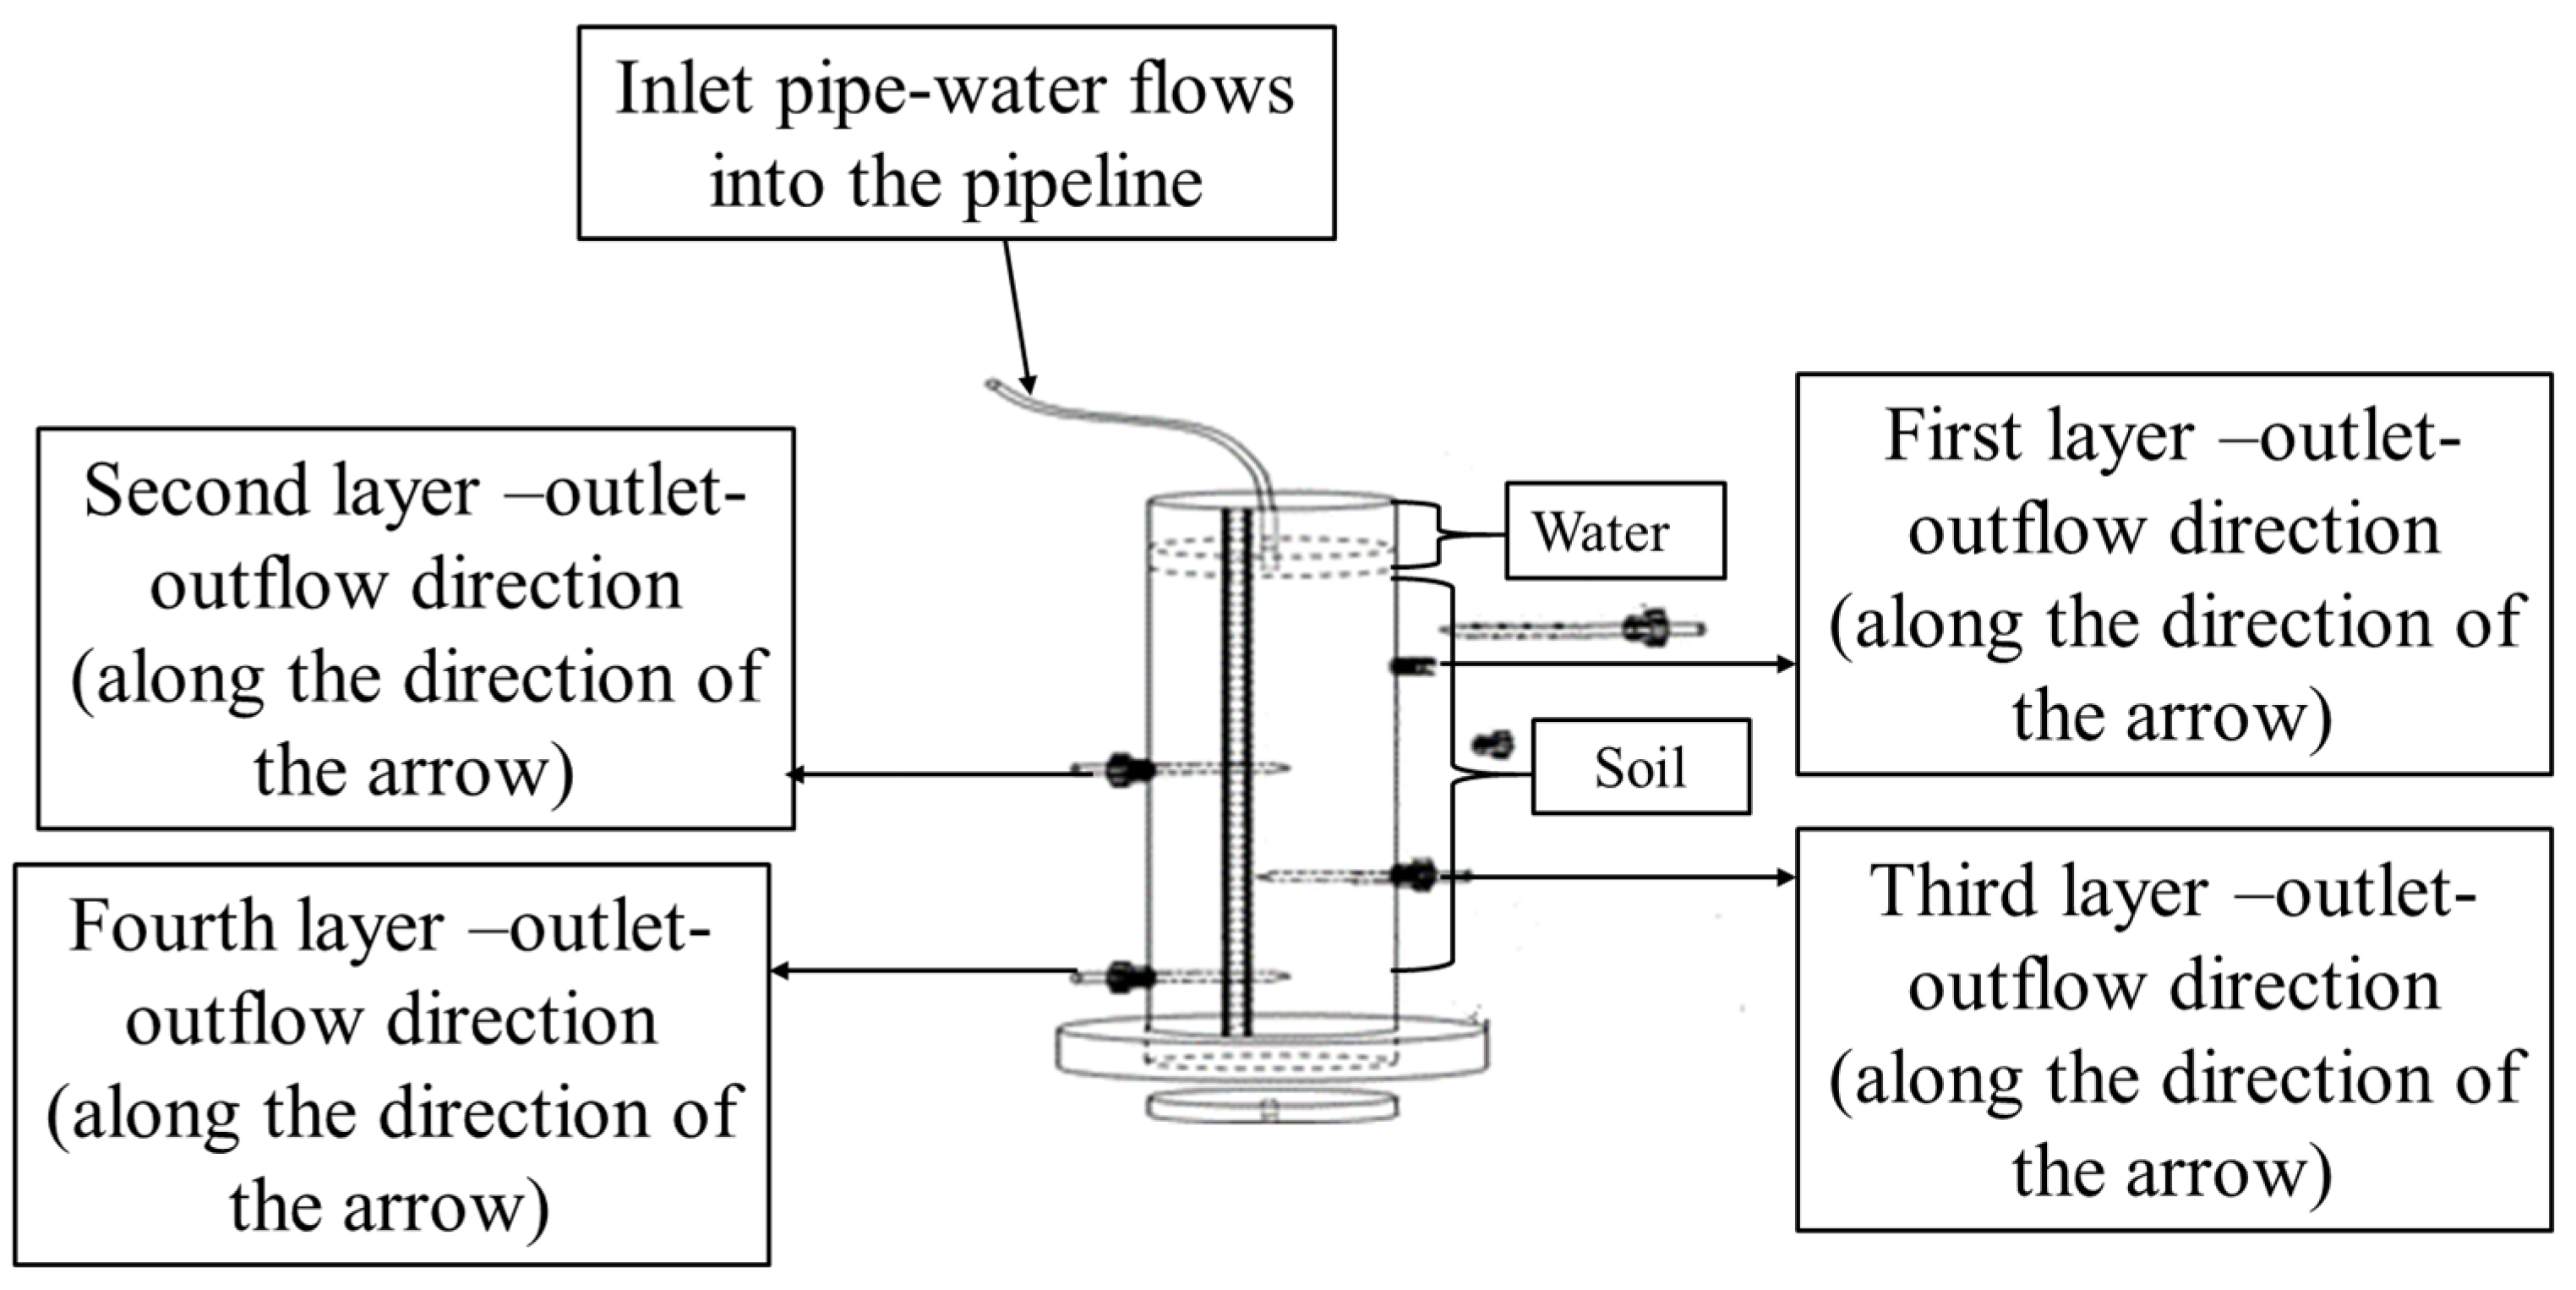
2.2.2. Dynamic Leaching

The soil, sand, biochar, composted straw, and PAM were mixed in the designated proportions and then loaded into the column (Table 2). Figure 1 shows a diagram of the device. The inner diameter of the column was 10 cm, and the height was 50 cm. A 5 cm layer of quartz sand was spread on the bottom of the column; filling proceeded in layers, with packing every 5 cm. The column was compacted and smoothed at the top, and the bulk density was controlled at 1.4 g·cm3; the column was filled with a total of 40 cm of soil. To prevent the occurrence of preferential flow, it was necessary to apply Vaseline to the inner wall of the column in advance. One water outlet was set up for every 10 cm thick soil layer, with a total of four water outlets (Figure 1). Each process was repeated three times.
For the water inlet and water collection steps, first, the tower was saturated with distilled water, and then the configured wastewater (Table 3) was added via a constant flow pump at the flow rate shown in Table 4. The water collection times were 2 h, 6 h, 14 h, 24 h, 36 h, 48 h, and 72 h from the beginning of water inflow. The four collection ports were opened at the same time, 15 mL was collected from each port, and then the collection ports were closed. After the collected filtrate was passed through a 0.45 µm filter membrane, the concentrations of N, P, COD, Cu, Zn, and Cd in the leachate were determined. COD was determined via digestion colorimetry [16]. N was determined via potassium persulfate digestion–UV spectrophotometry [16]. P was determined via the potassium persulfate digestion–molybdenum antimony colorimetric method [16]. The contents of Cu, Zn, and Cd were determined via flame atomic absorption spectrophotometry [15].

2.3. Data Analysis

Multifactor variance analysis was used to analyze the influence of different influencing factors on the leaching concentration of pollutants. One-way analysis of variance (ANOVA) was used to analyze the differences in the variations in the soil hydraulic conductivity, bulk density, and saturated water content. The variations in the pollutant leaching concentration with respect to the material and percolation depth were analyzed via S-N-K analysis. The differences in pollutant leaching concentrations with different flow loads were compared via paired-sample t tests. Data and graphs were generated via SPSS 20.0 and Origin 8.0.

3. Results

3.1. The Effects of Amendment Materials on the Saturated Hydraulic Conductivity, Saturated Water Content, and Bulk Density of Green Spaces

A preliminary investigation revealed that the background value of the saturated hydraulic conductivity of green spaces in the Xixian New Area was 1.83 m·d−1, the background value of the capacitance was 1.40 g·cm−3, and the background value of the saturated water content was 30.00% [15]. Table 5 shows that after amendment with composted straw, biochar, and PAM, the saturated hydraulic conductivity of the SSJ, SSB, and SSBJ treatments was 3.53–3.79 m·d−1, which was 92.90–107.10% higher than the background value; the bulk density of the SSJ, SSS, and SSBJ treatments was between 1.22 and 1.25 g·cm−3, which was 10.71–12.86% lower than the background value; and the saturated water content of the SSJ, SSB, and SSBJ treatments ranged from 35.72 to 39.65%, which was 19.07–32.17% higher than the background value. However, there were no significant differences (p < 0.05) in the saturated hydraulic conductivity, bulk density, or saturated water content between the treatments.

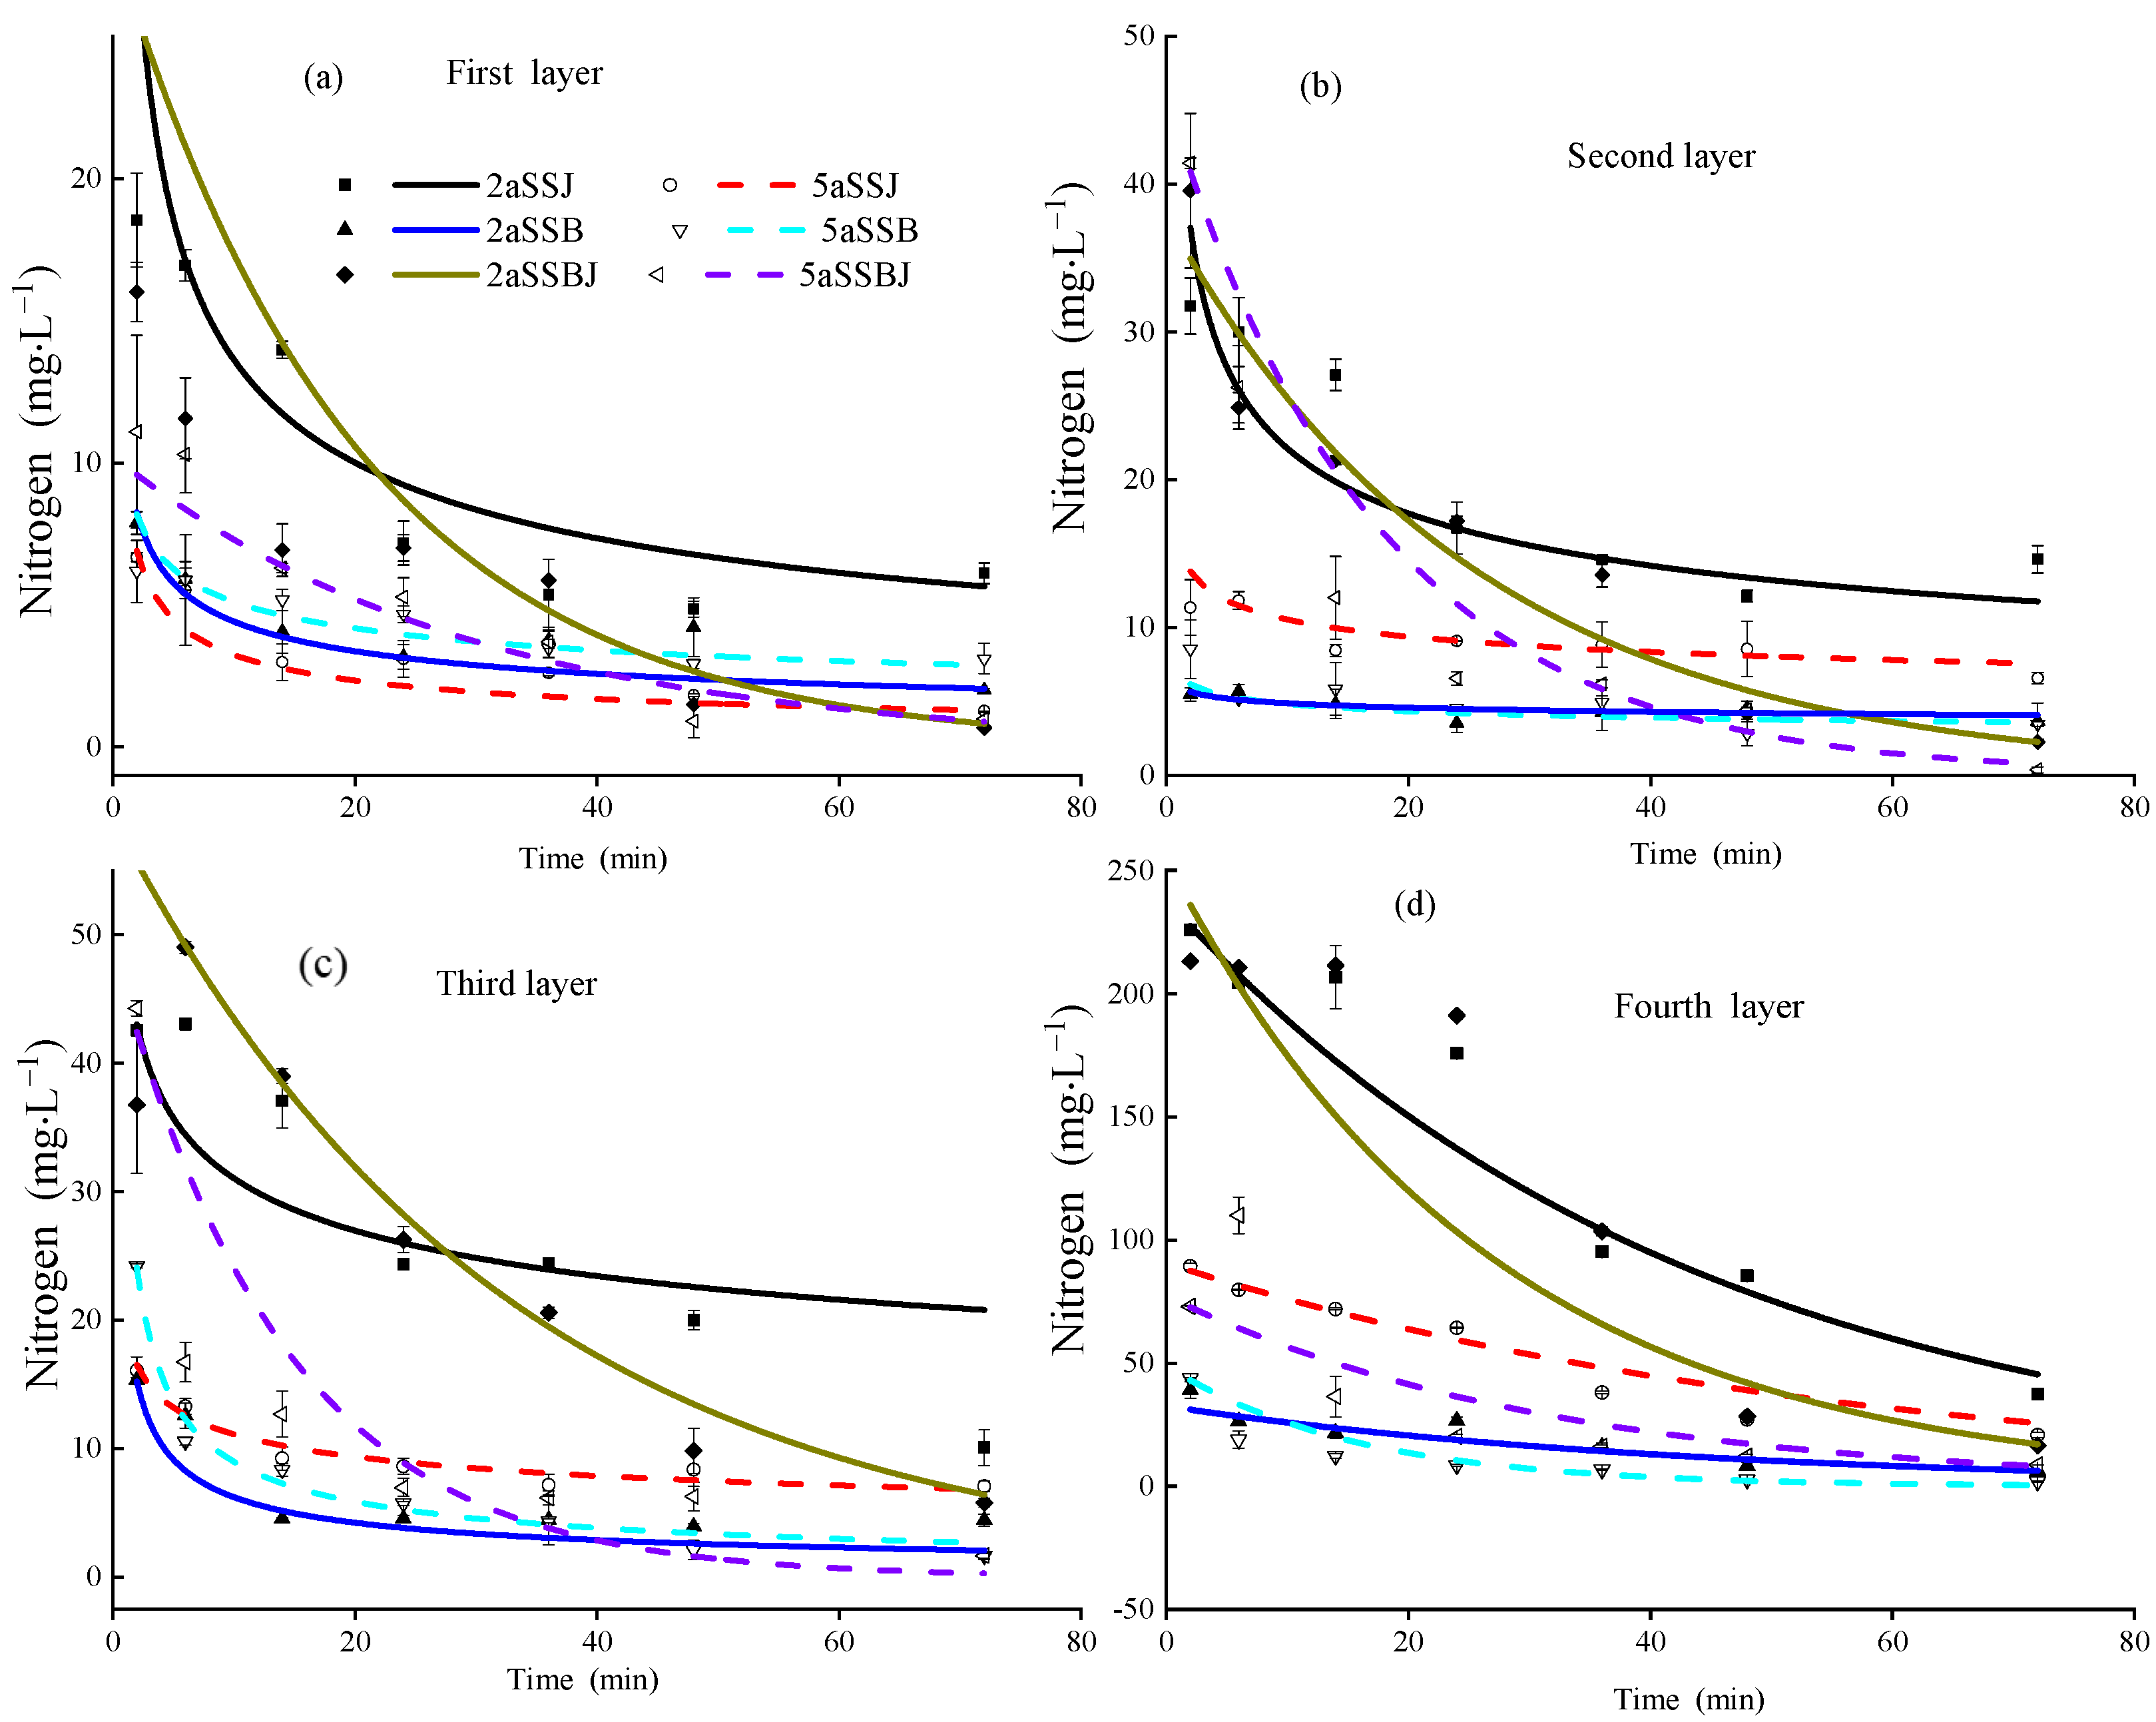
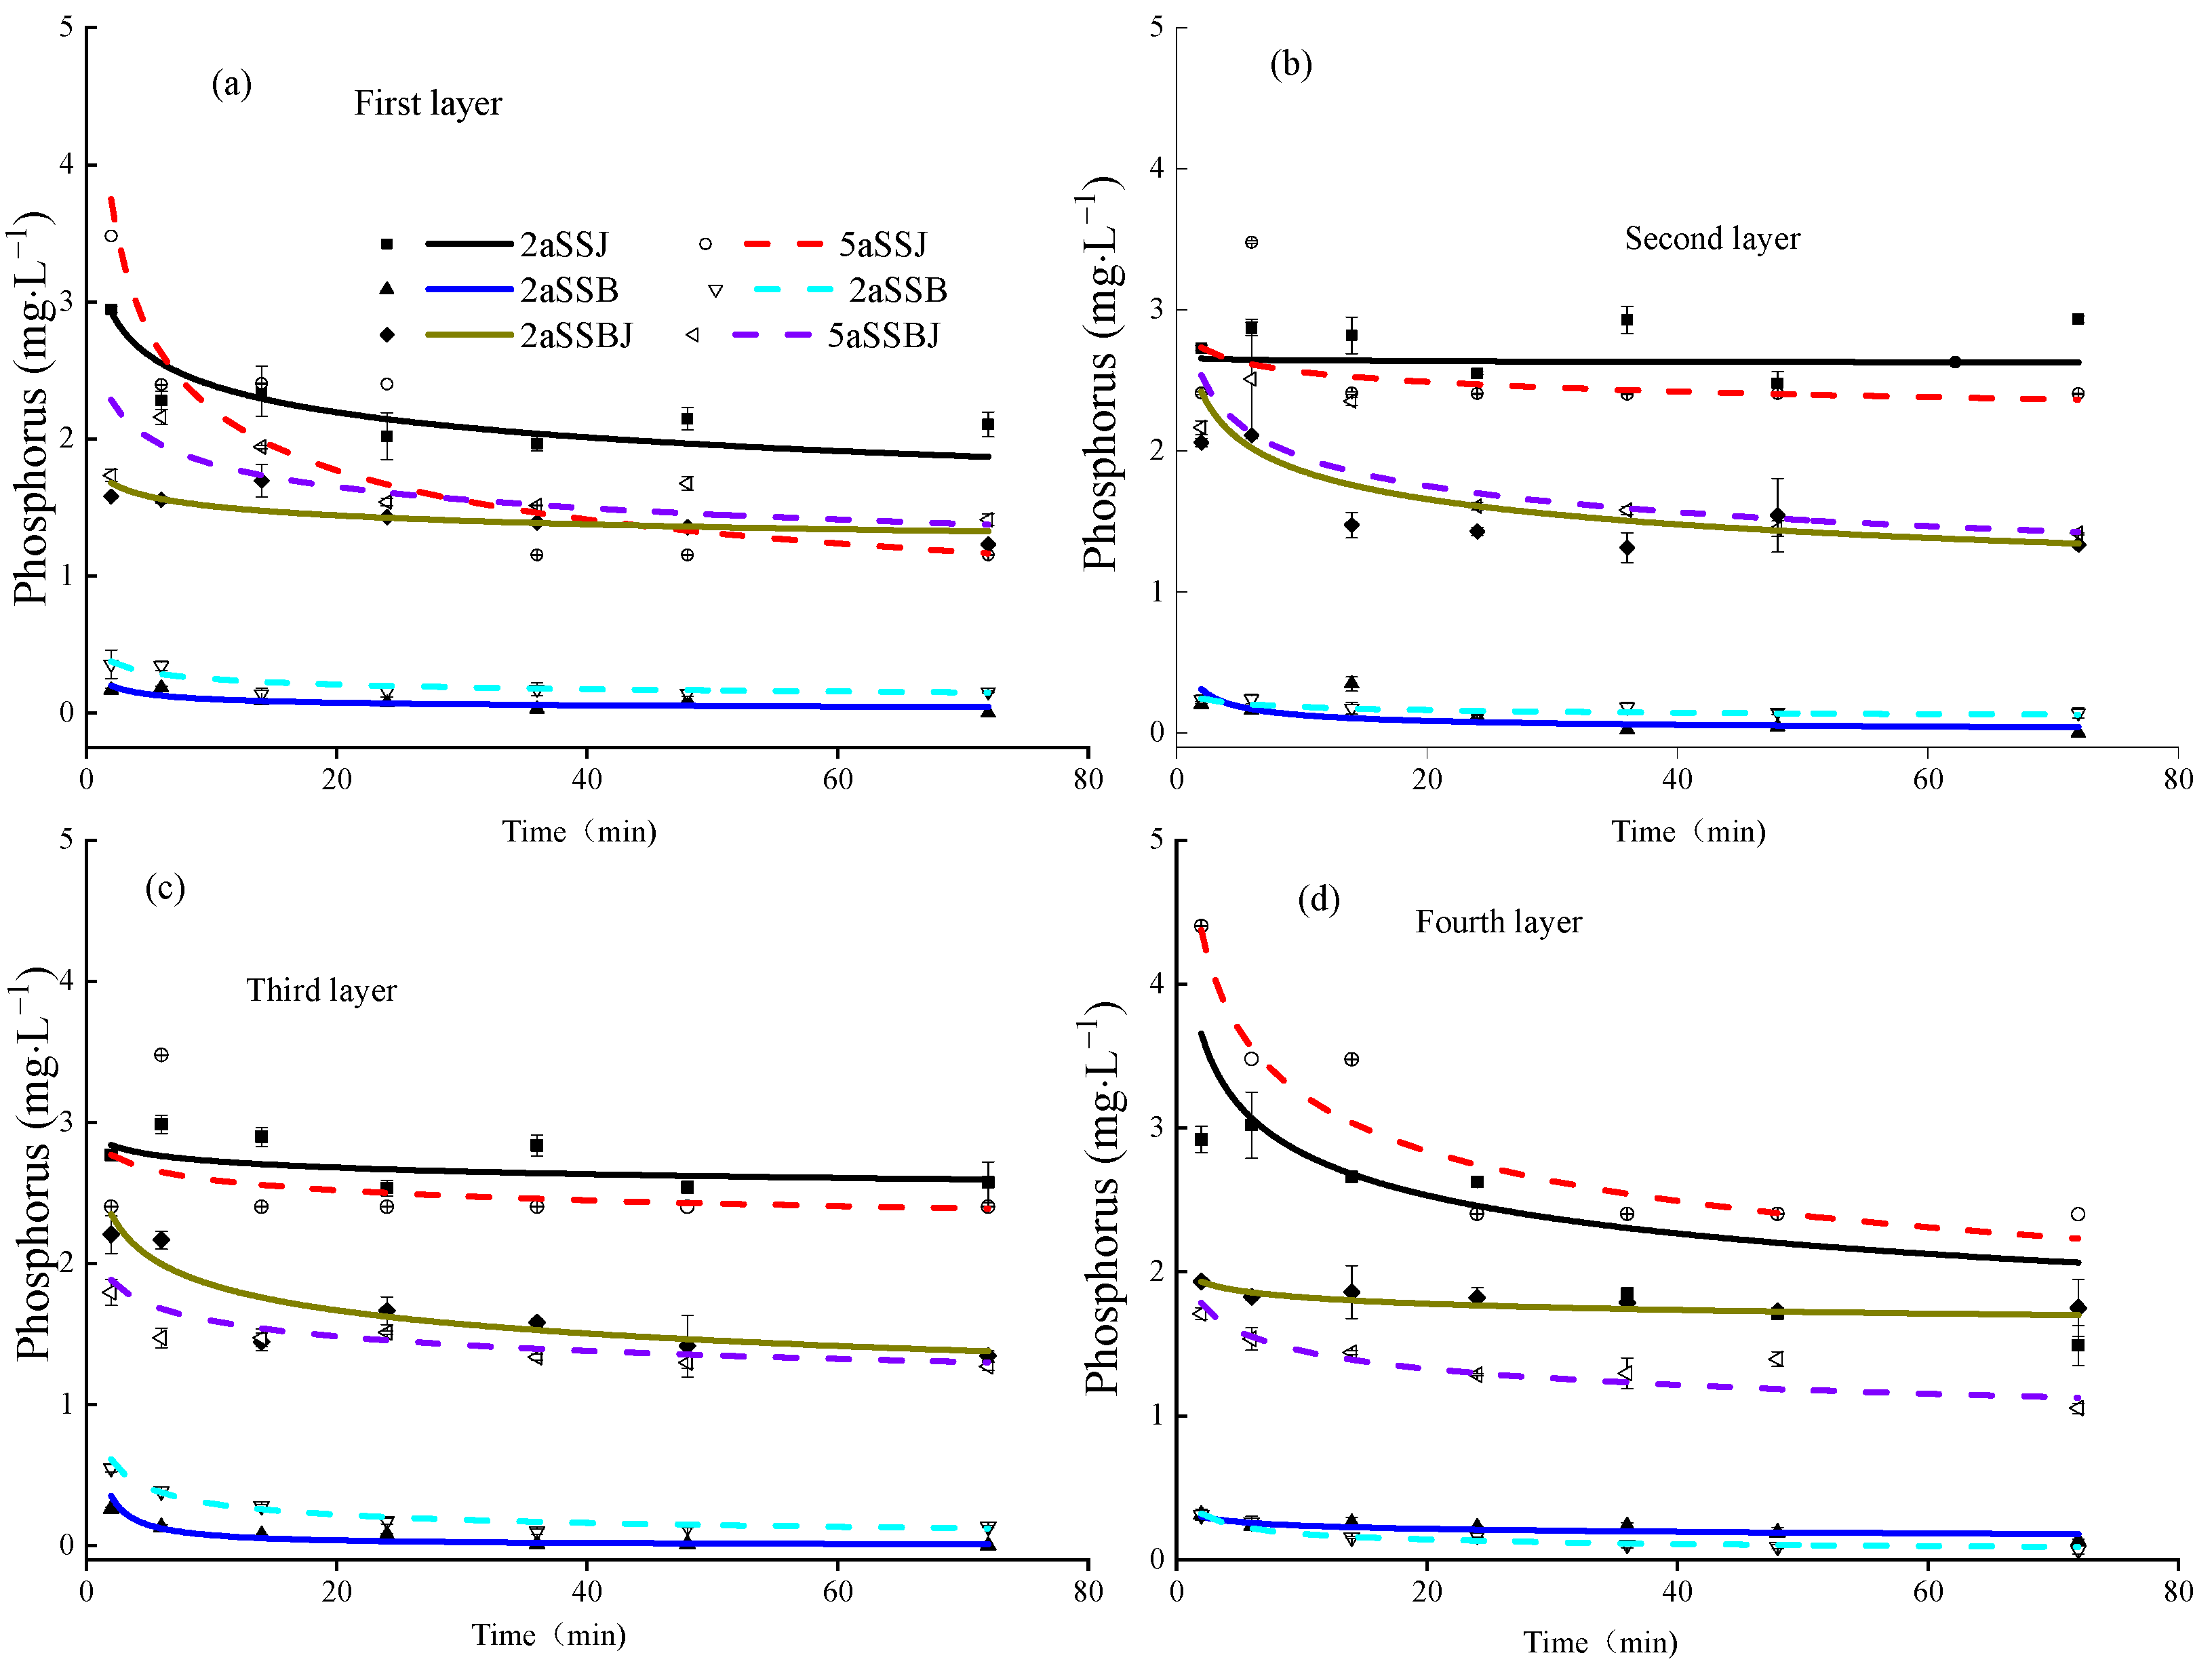
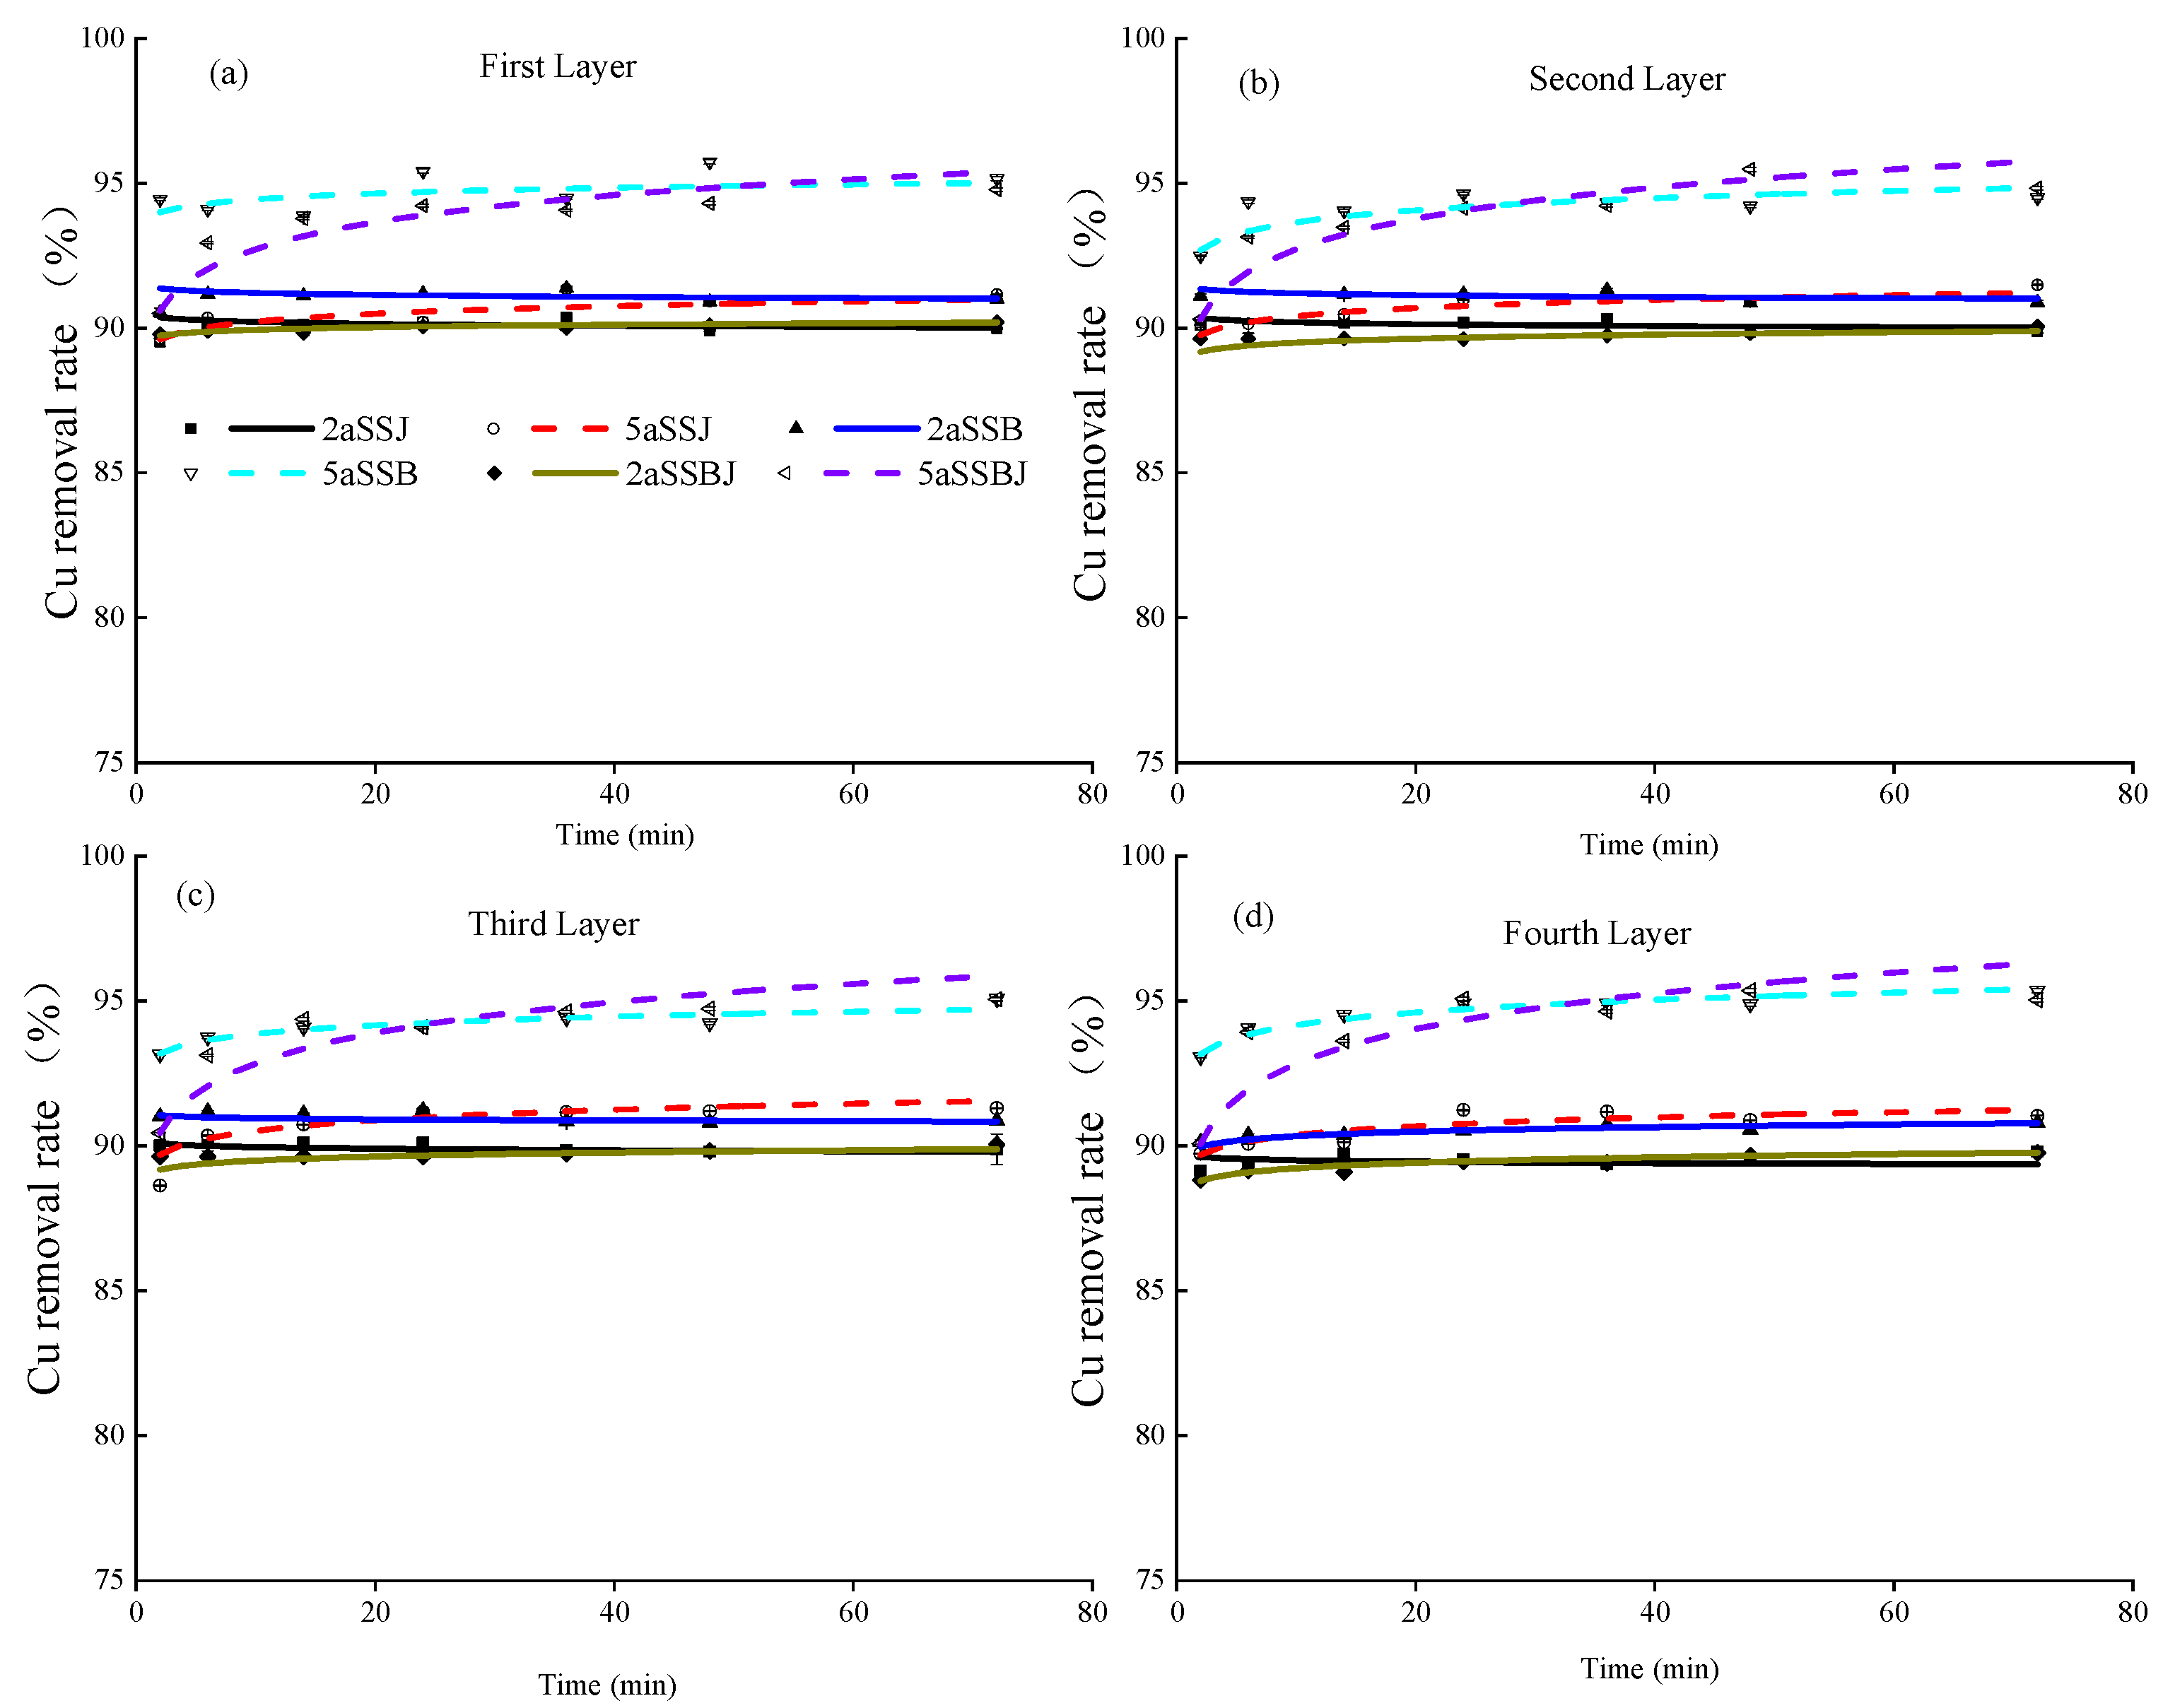
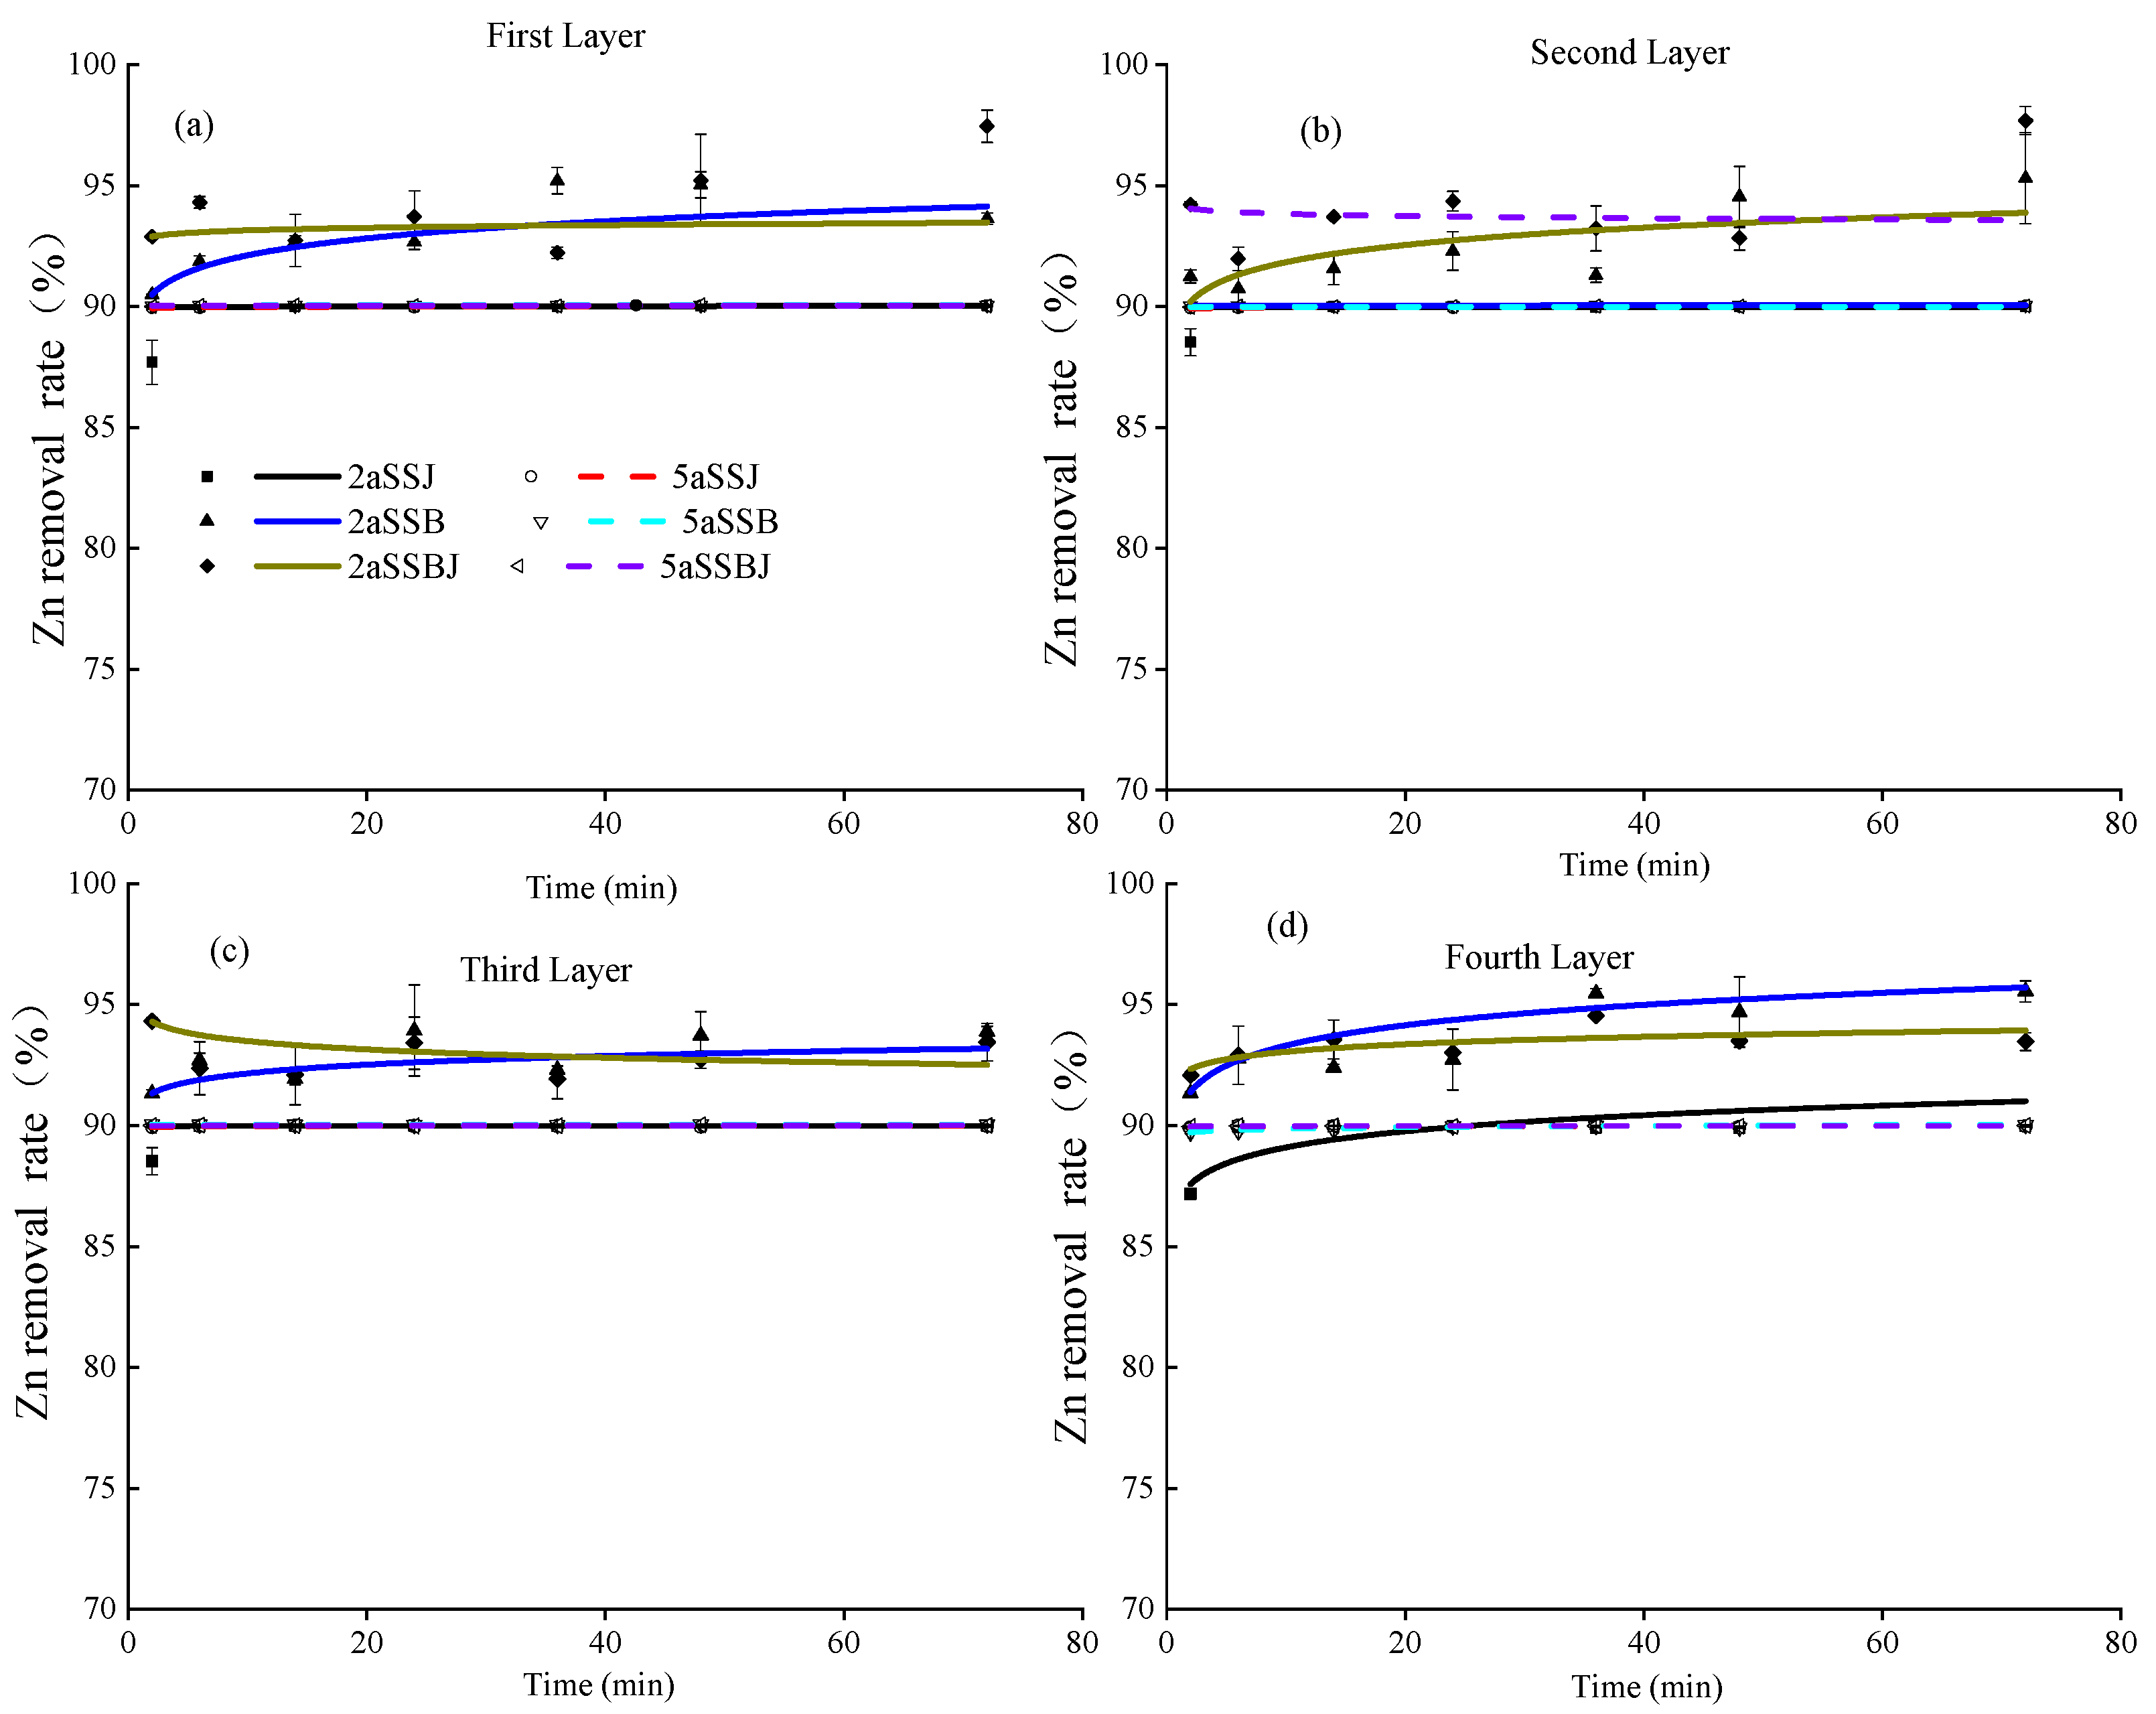
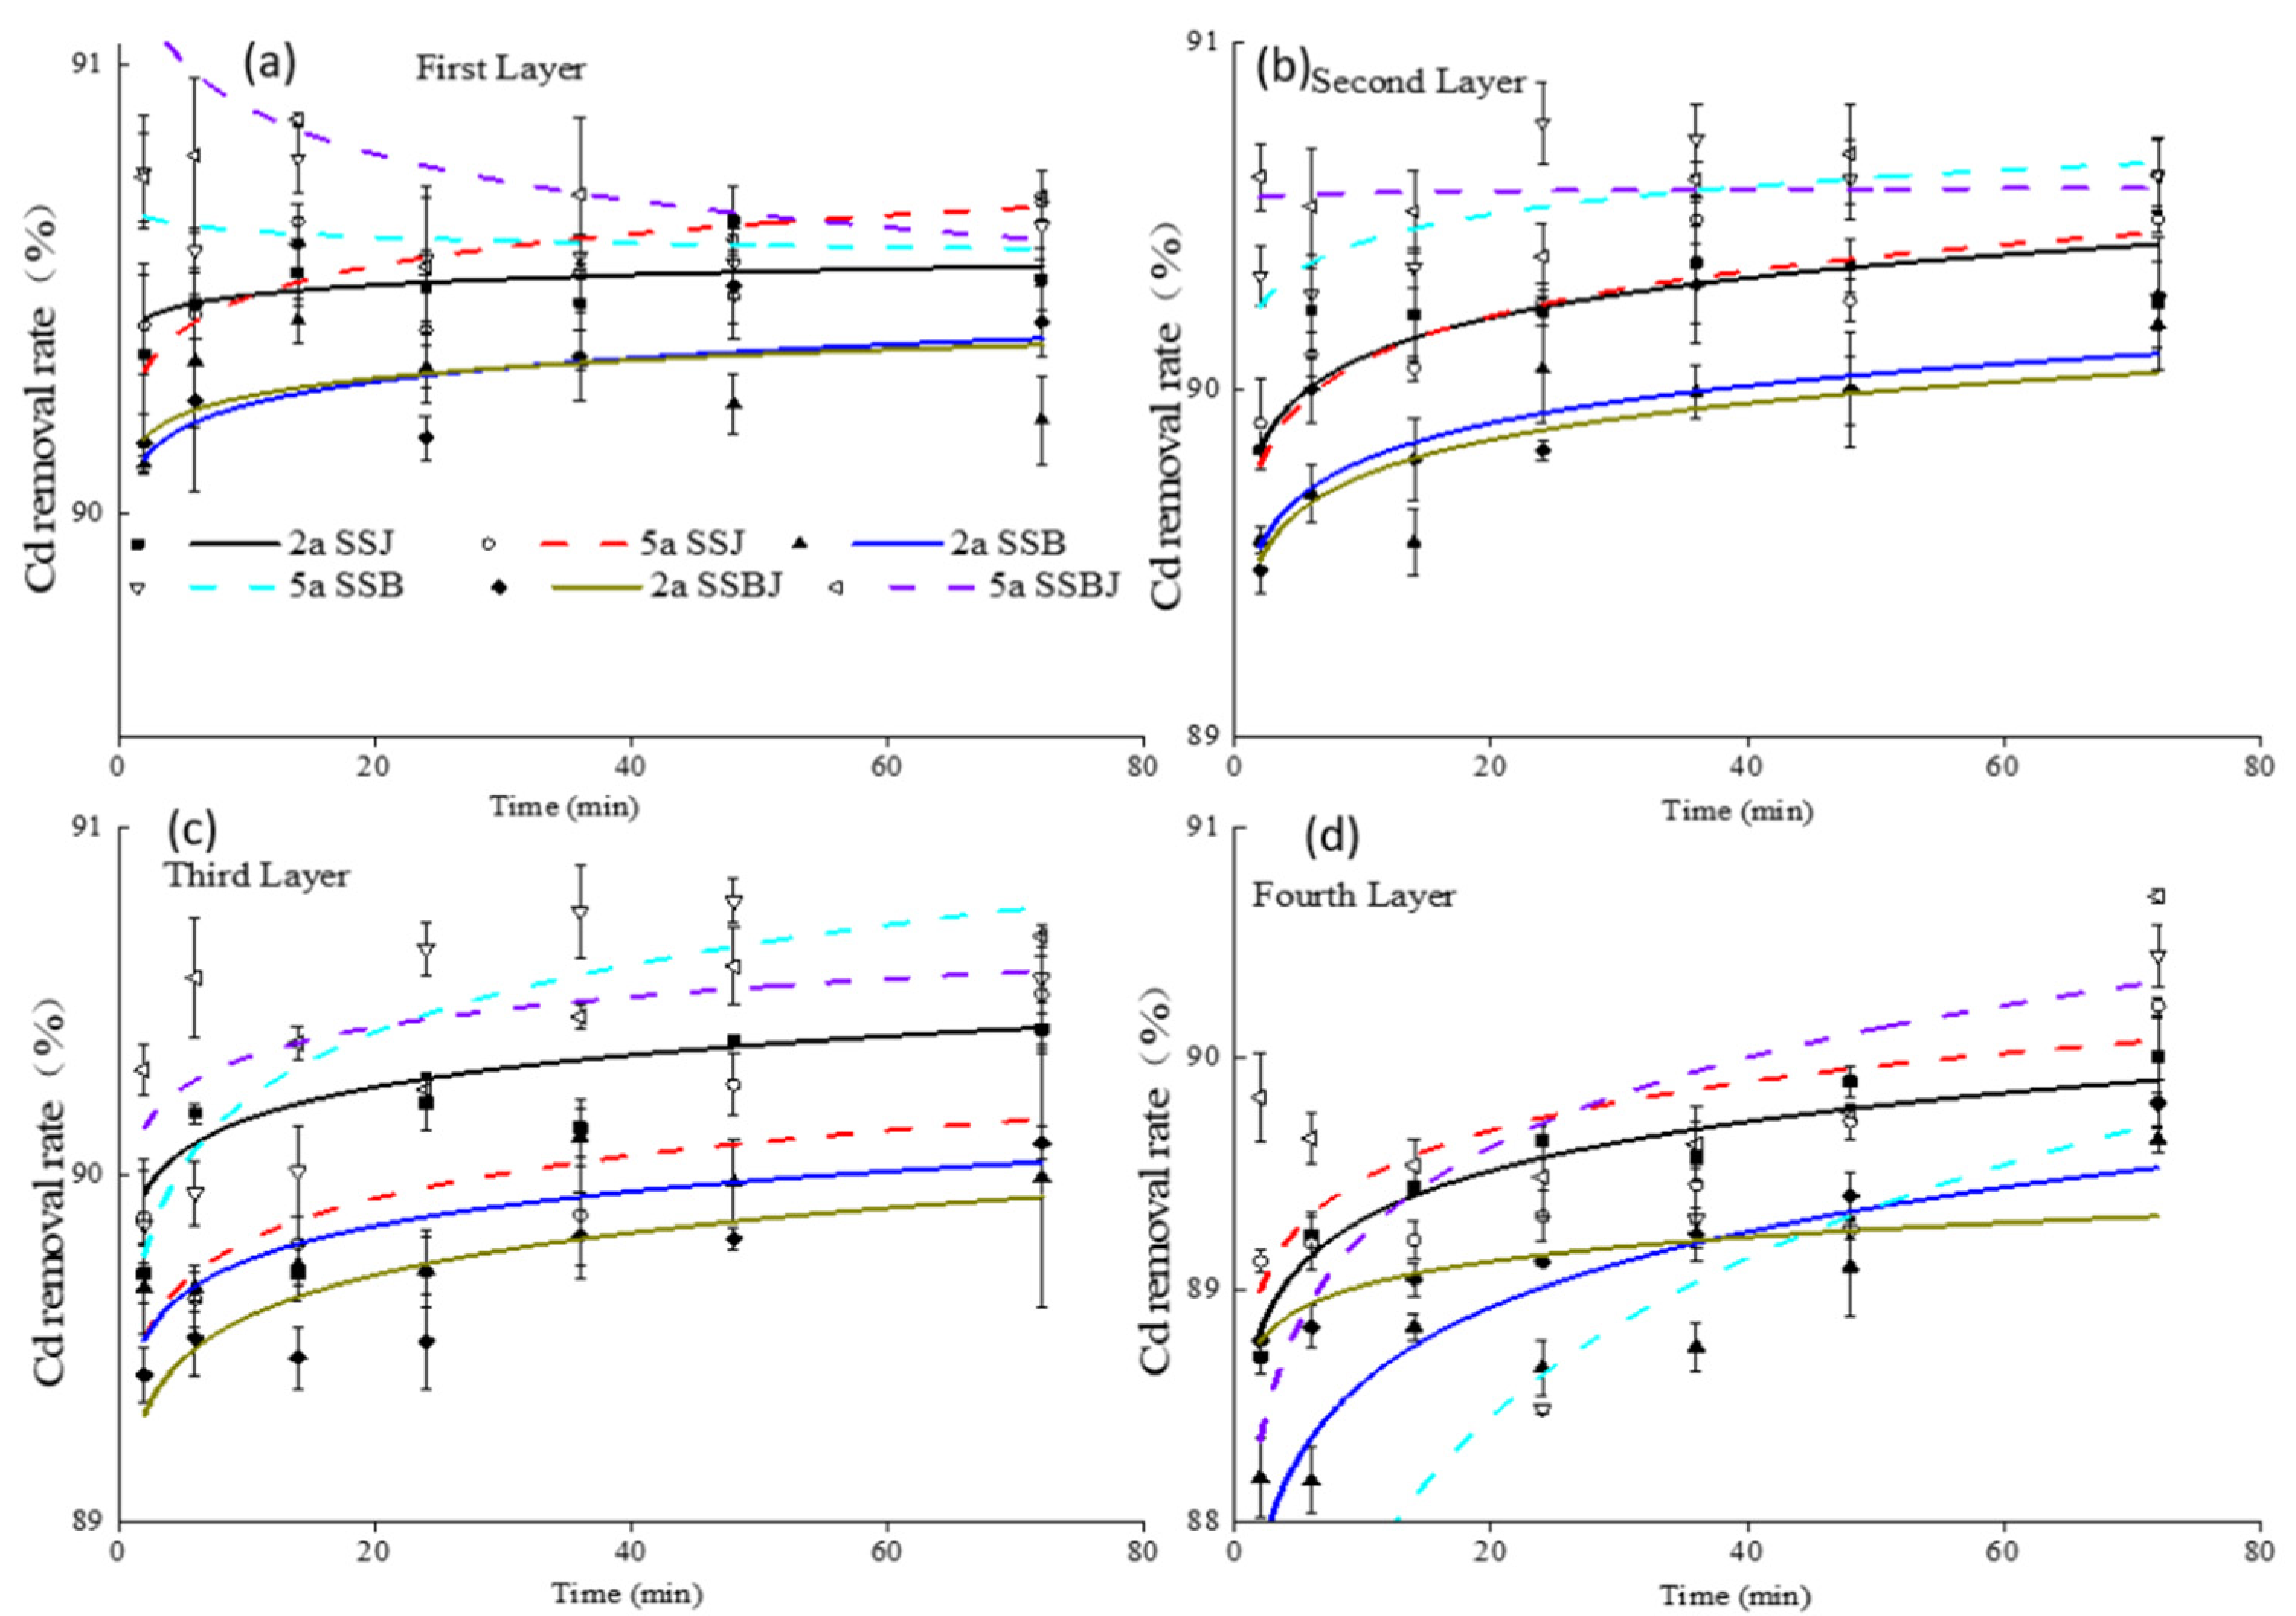
3.2. Dynamic Leaching Characteristics of Pollutants

The leaching concentrations of N (Figure 2), P (Figure 3), and COD (Figure 4) in the different treatments tended to decrease overall over time, and the leaching concentrations began to stabilize at 48 h. At 48 h, under different flow loads, the average N leaching concentrations of the SSJ, SSBJ, and SSB treatments in the fourth layer were 56.30 mg·L−1, 20.27 mg·L−1, and 5.46 mg·L−1, respectively. The average leaching concentrations of P in the fourth layer were 2.06 mg·L−1, 1.56 mg·L−1, and 0.14 mg·L−1, respectively. The average leaching concentrations of COD in the fourth layer were 1498.96 mg·L−1, 1531.4 mg·L−1, and 1034.23 mg·L−1. The retention rates of Cu (Figure 5), Zn (Figure 6), and Cd (Figure 7) showed relatively small trends over time, and different treatments had strong retention rates for heavy metals, such as Cu, Zn, and Cd, at different periods, with retention rates above 86%. As the percolation depth increased, the leaching concentrations of N (Figure 2a–d) and COD (Figure 4a–d) in the different treatments increased by 282.66%–1374.02% and 435.10%–455.84%, respectively, at a percolation depth of 40 cm compared with those at 10 cm, whereas the leaching concentrations of Cu (Figure 5a–d), Zn (Figure 6a–d), Cd (Figure 7a–d), and P (Figure 3a–d) showed little change. As the flow load increased, the N and COD leaching concentrations of the SSBJ treatment, the N leaching concentration of the SSJ treatment, and the COD leaching concentration of the SSB treatment tended to decrease, whereas the COD leaching concentration of the SSJ treatment and the P leaching concentration of the SSB treatment tended to increase. There was no difference in the P leaching concentration between the SSJ and SSBJ treatments. The leaching concentrations of Cu and Cd tended to decrease in the different treatments, whereas the leaching concentration of Zn did not change in the SSJ treatment but tended to increase in the other treatments. Overall, in this experiment, the SSB treatment had a strong ability to intercept N, P, and COD, whereas the SSBJ treatment had a strong ability to intercept Cu, Zn, and Cd (Table 6).

3.3. Analysis of the Contribution Rates of Different Factors of Improved Green Space Adsorption Capacity

Table 7 shows that the amendment materials, flow load, leaching time, and percolation depth all had a significant (p < 0.01) impact on the leaching concentrations of N, P, COD, and Cd, and the interactions of different factors also reached a significant (p < 0.01) level. Among these factors, the factor that had the strongest influence on the leaching concentrations of N, Cd, and COD was percolation depth, and its contribution rates were 31.29%, 34.96%, and 33.08%, respectively. The amendment material had a strong influence on the P leaching concentration, and its contribution rate reached 84.15%. With respect to Zn leaching, only the amendment material, the flow load, and the interaction of the two had a significant (p < 0.01) effect, with contributions of 22.41%, 22.26%, and 29.42%, respectively. In the leaching of Cu, the factors that had a significant influence (p < 0.01) were the amendment material, the flow load, the leaching time, and the interaction between the amendment material and the flow load. Among these factors, the amendment material had the largest contribution rate, which was 49.5%.

4. Discussion

4.1. Effects of Different Materials on Soil Water Conductivity and Water Retention Performance

Both composted straw and biochar can reduce the soil bulk density and increase the soil saturated water content and saturated hydraulic conductivity after being applied to greenbelt soil. This is consistent with the research results of Xue et al. [30] and Chen et al. [31] on soil improvement in farmland, indicating that decomposed straw and biochar can not only improve soil properties in farmland but also improve urban greenbelt soil. The composted straw and biochar can increase the activity of soil microorganisms after being applied to the soil, thereby increasing the cementitious organic matter in the soil and promoting the formation of soil aggregates [32]. On the other hand, this may be because after straw and biochar are applied to the soil, they can affect the cation species in the soil, and soil cations play an important role in the formation of aggregates [33]. The improvement in soil agglomeration after the application of composted straw and biochar to soil may be an important reason for the decrease in soil bulk density [34]. A decrease in the soil bulk density indicates that the porosity in the soil increases. Soil pores are an important pathway for water infiltration. An increase in soil porosity increases water infiltration pathways, thereby increasing the saturated hydraulic conductivity of the soil [35]. In addition, an increase in soil porosity results in more space in the soil for the retention of water. Decomposed straw and biochar also result in strong water absorption, so the saturated water content of the soil significantly (p < 0.05) increases [16,36]. There was no significant (p < 0.05) difference in the improvement in soil physical properties between decomposed straw and biochar, which may be related to the short indoor incubation time.

4.2. The Effects of Different Materials on the Dynamic Leaching of Soil Pollutants

With increasing leaching time, the leaching concentrations of N, P, and COD in the different treatments decreased, which was similar to the results of Wang et al. [37]. This may be due to the high background value of the ratio and the occurrence of leaching, which resulted in a higher leaching concentration in the early stage. With increasing leaching amount, the pollutants retained in the column gradually decreased, so the N and COD leaching concentrations began to decrease in the later stage [38,39,40]. The removal rates of Cu, Zn, and Cd under the different treatments slightly increased with increasing leaching time. This may be because as the leaching time increases, more cations in the medium are leached, which affects the adsorption capacity of the medium for heavy metals [41].
The amendment material contributed the most to the P, Zn, and Cu leaching concentrations. With respect to the leaching of N, P, and COD, the SSJ and SSBJ treatments containing composted straw as an improved material had a poor interception capacity, and the SSB treatment containing biochar had a relatively strong interception capacity for pollutants. On the one hand, this may be because the bulk density of composted straw is greater than that of other materials, such that the total amount of nutrients applied to the soil by the same volume of composted straw is greater, and a greater nutrient application amount leads to an increase in the desorption amount. On the other hand, this may be due to the high specific surface area of biochar, which is more stable in the soil after application than other materials and has a greater capacity for nutrient adsorption [42,43]. The strong adsorption capacity for heavy metals is due to the combined effects of the two materials, possibly because the combination of the two materials may compensate for the deficiencies of a single material and thus provide better results [44].
As the leaching concentrations of pollutants changed with flow load, the leaching concentrations of phosphorus in SSB treatment and that of COD in SSJ treatment under a low flow load were lower than those under a high flow load. This may be because when the flow load increases and the hydraulic retention time decreases, the soil infiltration load increases, which is not conducive to the interception and adsorption of pollutants by the soil. Furthermore, a larger flow load leads to more desorption of pollutants, which may also be one of the reasons for the higher leaching concentration of pollutants under a high flow load [22,45]. However, some treatments showed the opposite trend. The leaching concentrations of N in the SSJ and SSBJ treatments and those of COD in the SSB and SSBJ treatments under a low flow load were greater than those under a high flow load. This may be due to the forward shift of the pollution peak at high flow loads, resulting in lower measured concentrations during the same period [39]. The removal rates of Cu and Cd under a low flow load were lower than those under a high flow load. These removal rates may increase with increasing flow loading, resulting in the leaching of more cations and an increase in the number of heavy metal adsorption sites [41,46]. However, the Zn removal rates of the SSJ and SSBJ treatments containing biochar were lower than those of the high and low flow loads, which may have been caused by Zn leaching [47].
The leaching concentrations of N and COD increased with increasing percolation depth. This may be because the deeper the percolation depth of the medium, the higher the background value of the soil nutrients, which leads to an increase in the pollutant leaching concentration [48,49]. The leaching concentration of P in the different treatments did not show an obvious trend with percolation depth; this result may be because the leaching concentration of P is affected mainly by the material and is related to the weak mobility of P. Cu, Zn, and Cd were mostly intercepted in the first layer. This may be because the materials used have many negatively charged sites on the surface, a large specific surface area, and a high organic content and therefore have a high capacity for heavy metal adsorption. Additionally, the migration ability of heavy metals is weak, so they are intercepted more in the upper layer than in other layers [50,51,52].
The results of this study indicate that the SSB ratio has a relatively strong adsorption capacity for N, P, and COD, whereas the SSBJ ratio has a relatively strong adsorption capacity for Cu, Zn, and Cd. However, owing to the high content of N and organic matter in the material itself, the adsorption capacity of the SSB ratio for N and COD is weak. Chen et al. [53] reported that the application of ceramsite in soil can achieve a N adsorption capacity of 59.45%. Pan et al. [54] applied zeolite and anthracite to greenbelt soil, and the soil adsorption capacity for COD reached 70.5%. In this study, the adsorption capacity of N and COD when biochar was applied to improve green soil was lower than that when zeolite, anthracite, or ceramsite was applied to improve green soil. However, the application of ceramsite and zeolites in soil improvement has the problems of easily clogging soil pores and high costs [11]. As a renewable energy source, biochar has a relatively low cost and can also provide fertility for plant growth. Therefore, in future research, attempts can be made to modify biochar materials to improve their adsorption capacity for N and COD. This study revealed that for the SSB and SSBJ ratios, the leaching of N and COD occurs in the early stage. Therefore, in subsequent applications, biochar and decomposed straw should be washed in advance to reduce their background values, thereby reducing the leaching risk of N and COD during application. Although this study revealed that the SSBJ treatment exhibited good adsorption capacity for heavy metals, the bioavailability of heavy metals, such as Cu, Zn, and Cd, in biochar increased after pyrolysis. However, this study did not address whether the heavy metals adsorbed by biochar and the heavy metals contained in biochar itself affected greenbelt plants and microorganisms or whether the adsorption effect of biochar deteriorated after long-term use [19]. However, research in this field is crucial for selecting suitable greenbelt plants, achieving better soil–plant interactions, fully leveraging the role of greenbelt soil in road runoff infiltration and pollutant adsorption, and assessing the environmental risks of using biochar and decaying straw in green soil [55,56,57]. Therefore, in future work, relevant research should be conducted to provide better references for the construction of sponge cities.

5. Conclusions

The saturated hydraulic conductivity and saturated water content of the different treatments increased by 92.90–107.10% and 19.07–32.17%, respectively, compared with the background values, but there was no significant (p < 0.05) difference between the different treatments. As the percolation depth increased, the leaching concentrations of N and COD in the different treatments increased by 282.66–1374.02% and 435.10–455.84%, respectively, at a percolation depth of 40 cm compared with those at 10 cm, whereas the leaching concentrations of Cu, Zn, Cd, and P showed little change. As the flow load increased, the leaching concentration of the pollutant pattern was not obvious. Overall, the SSB treatment had a strong ability to intercept N, P, and COD, whereas the SSBJ treatment had a strong ability to intercept Cu, Zn, and Cd. Relatively speaking, the SSB treatment was found to be more suitable for improving greenbelt soil in areas with severe N, P, and COD pollution in road runoff, whereas the SSBJ treatment was determined to be more suitable for improving greenbelt soil in areas with severe Cu, Zn, and Cd pollution in road runoff. This study provides a reference for the improvement of soil in sponge city green belt soil.

Author Contributions

All the authors contributed to the study conception and design. Material preparation, data collection and analysis were performed by Y.Z., S.H., J.C., S.C., J.L., H.L., X.Z., and X.L. The first draft of the manuscript was written by C.W. and A.Z., and all the authors commented on previous versions of the manuscript. All the authors have read and approved the final manuscript. All authors have read and agreed to the published version of the manuscript.

Funding

This work was jointly supported by the National Key R&D Program of China (2023YFD1900300) and the Key Research and Development Program of Shaanxi (Program No. 2024NC-ZDCYL-02-07).

Data Availability Statement

The datasets used and/or analyzed during the current study are available from the corresponding author upon reasonable request.

Conflicts of Interest

The authors declare no conflict of interest.

References

  1. Zhang, J.Y.; Shu, Z.K.; Wang, H.J.; Li, W.J.; Zhang, X.L. A discussion on several hydrological issues of “7·20” rainstorm and flood in Zhengzhou. Acta Geogr. Sin. 2023, 78, 1618–1626. [Google Scholar] [CrossRef]
  2. Xu, H.; Gao, J.L.; Yu, X.C.; Qin, Q.Q.; Du, S.Q.; Wen, J.H. Assessment of Rainstorm Waterlogging Disaster Risk in Rapidly Urbanizing Areas Based on Land Use Scenario Simulation: A Case Study of Jiangqiao Town in Shanghai, China. Land 2024, 13, 1088. [Google Scholar] [CrossRef]
  3. Wang, Q.; Huang, J.G.; Chang, N.N.; Yu, Z.Z. Regional heterogeneity and driving factors of road runoff pollution from urban areas in China. Environ. Geochem. Health 2023, 45, 3041–3054. [Google Scholar] [CrossRef]
  4. Zhang, J.Y.; Wang, Y.T.; Hu, Q.F. Discussion and views on some issues of the sponage city construction in China. Adv. Water Sci. 2016, 27, 793–799. [Google Scholar] [CrossRef]
  5. Li, Q.; Jia, H.F.; Guo, H.K.; Zhao, Y.Y.; Zhou, G.H.; Lim, F.Y.; Guo, H.L.; Neo, T.H.; Ong, S.L.; Hu, J.Y. Field study of the road stormwater runoff bioretention system with combined soil filter media and soil moisture conservation ropes in North China. Water 2022, 14, 415. [Google Scholar] [CrossRef]
  6. Ren, X.W.; Hong, N.; Li, L.F.; Kang, J.Y.; Li, J.J. Effect of infiltration rate changes in urban soils on stormwater runoff process. Geoderma 2020, 363, 114518. [Google Scholar] [CrossRef]
  7. Xiong, L.J.; Lu, S.Q.; Tan, J. Optimized strategies of green and grey infrastructures for integrated control objectives of runoff, waterlogging and WWDP in old storm drainages. Sci. Total Environ. 2023, 901, 165847. [Google Scholar] [CrossRef]
  8. Zhang, Q. Effects of biochar and biochar-based fertilizer to green space soil properties and growth of Ocimum basilicum var. majus. Chin. Soil Fertil. 2022, 10, 81–88. [Google Scholar] [CrossRef]
  9. Penfound, E.; Vaz, E. Modelling future wetland loss with land use landcover change simulation in the Greater Toronto and Hamilton Area: The importance of continued greenbelt development restrictions. Habitat Int. 2024, 143, 102974. [Google Scholar] [CrossRef]
  10. Han, J.G.; Li, G.; Zhang, W.W.; Liu, W.; Liu, S.; Ma, X.; Zhang, L.; Zhu, Y.G. Problems and countermeasures of soil health quality in urban green space. J. Appl. Ecol. 2022, 33, 268–276. [Google Scholar] [CrossRef]
  11. Zhang, W.; Tang, Y.F.; Wang, C.; Chai, S.Y.; Zuo, Q.T. Research progress on soil replacement medium in biological retention facilities for sponge city construction. Environ. Eng. 2023, 41, 277–285. [Google Scholar] [CrossRef]
  12. Scharenbroch, B.C.; Meza, E.N.; Catania, M.C.; Fite, K. Biochar and Biosolids Increase Tree Growth and Improve Soil Quality for Urban Landscapes. J. Environ. Qual. 2013, 42, 1372–1385. [Google Scholar] [CrossRef]
  13. Sui, Y.; Gao, J.P.; Liu, C.H.; Zhang, W.Z.; Lan, Y.; Li, S.H.; Meng, J.; Xu, Z.G.; Tang, L. Interactive effects of straw-derived biochar and N fertilization on soil C storage and rice productivity in rice paddies of Northeast China. Sci. Total Environ. 2016, 544, 203–210. [Google Scholar] [CrossRef]
  14. Sahu, J.; Prasad, M.; Sahu, R.; Kumar, D.; Sohane, R.K. Crop Residue Management under Changing Climate Scenario. Curr. J. Appl. Sci. Technol. 2019, 15, 1–6. [Google Scholar] [CrossRef]
  15. Hao, S.; Wang, C.G.; Zhang, A.F.; Wang, X.D.; Ma, X.; Ma, Y. Effects of soil permeability improvement and purification of pollutants in urban green space under different matrix composition amendments. Chin. J. Appl. Ecol. 2020, 31, 1349–1356. [Google Scholar] [CrossRef]
  16. Wang, C.G.; Hao, S.; Lu, S.X.; Zhang, A.F.; Wang, X.D.; Ma, X.; Ma, Y. Effect of PAM Amendment on the Properties of Urban Green Space Replacement Media. J. Soil Water Conserv. 2020, 34, 356–361. [Google Scholar] [CrossRef]
  17. Zhou, H.; Fang, Q.; Zhang, Q.; Wang, C.; Chen, S.J.; Mooney, X.; Peng, Z.D. Biochar enhances soil hydraulic function but not soil aggregation in a sandy loam. Eur. J. Soil Sci. 2019, 70, 291–300. [Google Scholar] [CrossRef]
  18. Peng, X.; Zhu, Q.H.; Xie, Z.B.; Darboux, F.; Holden, N.M. The impact of manure, straw and biochar amendments on aggregation and erosion in a hillslope Ultimol. Catena 2016, 138, 30–37. [Google Scholar] [CrossRef]
  19. Guo, M.X.; He, Z.Q.; Uchimiya, S.M. Agricultural and Environmental Applications of Biochar: Advances and Barriers; SSSA Special Publication 63; Soil Science Society of America: Madison, WI, USA, 2015; pp. 341–407, 495–504. [Google Scholar] [CrossRef]
  20. Wang, L.Y.; Ma, J.G. Analysis on Water Infiltration Characteristics and Difference of Soil in Kunming’s Main City Parks Green Space. J. Southwest For. Univ. 2022, 42, 48–55. [Google Scholar] [CrossRef]
  21. Liu, M.; Jia, Z.H.; Tang, S.C.; Xu, Q.; Zhao, W.Y. Dynamic Process Simulation of the Impact of Rain Garden Concentrated Infiltration on Groundwater Level and Quality. J. China Hydrol. 2023, 43, 66–73. [Google Scholar] [CrossRef]
  22. Li, P.P.; Wang, Q.; Wen, Q.; Li, H.; Wu, C.F.; Xiong, W.D.; Han, Y.L. Effects of the return of organic materials on soil physical and chemical properties and bacterial number in sandy soil. Acta Ecol. Sin. 2017, 37, 3665–3772. [Google Scholar] [CrossRef]
  23. Han, F.P.; Zheng, J.Y.; Li, Z.B.; Zhang, X.C. Effect of PAM on soil physical properties and water distribution. Trans. Chin. Soc. Agric. Eng. 2010, 26, 70–74. [Google Scholar] [CrossRef]
  24. Ran, Y.L.; Wang, Y.Q.; Zhang, R.X.; Zhu, F.H.; Liu, J. Research on the mechanism of super absorbent polymer to soil water-holding characteristic. Agric. Res. Arid Areas 2015, 33, 101–107. [Google Scholar] [CrossRef]
  25. Wang, C.G.; Li, H.R.; Xue, S.B.; Ma, B.; Shang, Y.Z.; Li, Z.B. How root and soil properties affect soil detachment capacity in different grass–shrub plots: A flume experiment. Catena 2023, 229, 107221. [Google Scholar] [CrossRef]
  26. Ai, D.; Bian, L.L.; Zhang, Y.G.; Chang, N.J.; Yan, F.F.; Li, B.; Li, Z.H.; Feng, W.Q.; Zhang, Z.J.; Chen, X.; et al. Effects of brick fertilizer on soil electrical conductivity and root distribution of flue cured tobacco. China Soils Fertil. 2023, 3, 111–119. [Google Scholar] [CrossRef]
  27. Chen, H.X.; Du, Z.L.; Guo, W.; Zhang, Q.Z. Effects of biochar amendment on cropland soil bulk density, cation exchange capacity, and particulate organic matter content in the North China Plain. Chin. J. Appl. Ecol. 2011, 22, 2930–2934. [Google Scholar] [CrossRef]
  28. Liu, L.Y.H.; Wu, M.L.; Liu, Y.; Yu, Y.H.; Gu, X.J.; Wu, M.J.; Mo, Q.F. Characteristics of Soil Cation Exchange Capacity of Two Plantations in Heshan, Guangdong Province. Chin. J. Soil Sci. 2024, 55, 661–668. [Google Scholar] [CrossRef]
  29. Hao, S. The Effects of Soil Permeability Improvement and Purification of Pollutants in Urban Green Space under Different Matrix Compositions Amendment. Master’s Dissertation, Northwest A&F University, YangLing, China, 2018. [Google Scholar] [CrossRef]
  30. Xue, P.; Fu, Q.; Li, T.; Liu, D.; Hou, R.J.; Li, Q.L.; Li, M.; Meng, F.X. Effects of biochar and straw application on the soil structure and water-holding and gas transport capacities in seasonally frozen soil areas. J. Environ. 2022, 301, 113943. [Google Scholar] [CrossRef]
  31. Chen, C.; Zhu, H.; Lv, Q.; Tang, Q. Impact of biochar on red paddy soil physical and hydraulic properties and rice yield over 3 years. J. Soil Sediments 2022, 22, 607–616. [Google Scholar] [CrossRef]
  32. Halder, M.; Ahmad, S.J.; Rahman, T.; Joardar, J.C.; Siddique, M.A.B.; Islam, M.S.; Islam, M.U.; Liu, S.; Rabbi, S.; Peng, X.H. Effects of straw incorporation and straw-burning on aggregate stability and soil organic carbon in a clay soil of Bangladesh. Geoderma Reg. 2023, 32, e00620. [Google Scholar] [CrossRef]
  33. Wang, D.; Fonte, S.J.; Parikh, S.J.; Six, J.H.; Scow, K.M. Biochar additions can enhance soil structure and the physical stabilization of C in aggregates. Geoderma 2017, 303, 110–117. [Google Scholar] [CrossRef]
  34. Hansen, V.; Müller-Stöver, D.; Munkholm, L.J.; Peltre, C.; Nielsen, H.H.; Jensen, L.S. The effect of straw and wood gasification biochar on carbon sequestration, selected soil fertility indicators and functional groups in soil: An incubation study. Geoderma 2016, 269, 99–107. [Google Scholar] [CrossRef]
  35. Singh, U.; Sharma, P.K. Comparison of saturated hydraulic conductivity estimated by surface NMR and empirical equations. J. Hydrol. 2023, 617, 128929. [Google Scholar] [CrossRef]
  36. Xin, Y.; Xie, Y.; Liu, Y.; Liu, H.; Ren, X. Residue cover effects on soil erosion and the infiltration in black soil under simulated rainfall experiments. J. Hydrol. 2016, 543, 651–658. [Google Scholar] [CrossRef]
  37. Wang, Z.Q.; Xie, W.X.; Chai, N.; Li, P. Effects of Bioretention with oyster shell as filler on pollutants removal from Urban Surface Runoff. J. Soil Water Conserv. 2019, 33, 128–133. [Google Scholar] [CrossRef]
  38. Iqbal, H.; Garcia-Perez, M.; Flury, M. Effect of biochar on leaching of organic carbon, nitrogen, and phosphorus from compost in bioretention systems. Sci. Total Environ. 2015, 521–522, 37–45. [Google Scholar] [CrossRef]
  39. Long, G.Q.; Jiang, Y.J.; Sun, B. Seasonal and inter-annual variation of leaching of dissolved organic carbon and nitrogen under long-term manure application in an acidic clay soil in subtropical China. Soil Tillage Res. 2015, 146, 270–278. [Google Scholar] [CrossRef]
  40. Scott, J.T.; Lambie, S.M.; Stevenson, B.A.; Schipper, L.A.; Parfitt, R.L.; McGill, A.C. Carbon and nitrogen leaching under high and low phosphate fertility pasture with increasing nitrogen inputs. Agric. Ecosyst. Environ. 2015, 202, 139–147. [Google Scholar] [CrossRef]
  41. Shuman, L.M. Effect of ionic strength and anions on zinc adsorption by two soils. Soil Sci. Soc. Am. J. 1986, 50, 1438–1442. [Google Scholar] [CrossRef]
  42. Li, C.L.; Liu, M.; Hu, Y.M.; Sui, J.L.; Wu, Y.L.; Liu, C.; Sun, F.Y. Simulation on the control effect of low impact development measures of sponge city based on storm water management model (SWMM). J. Appl. Sci. 2017, 28, 2405–2412. [Google Scholar] [CrossRef]
  43. Qin, Y.; Chai, B.; Wang, C.; Wang, C.L.; Yan, J.T.; Song, G.S. Removal of tetracycline onto KOH-activated biochar derived from rape straw: Affecting factors, mechanisms and reusability inspection. Colloids Surf. 2022, 640, 128466. [Google Scholar] [CrossRef]
  44. Wu, H.B.; Fang, H.L.; Li, A.P. Effects of Commonly Modified Materials on Soil Water Infiltration in Green Belt. J. Soil Water Conserv. 2016, 30, 317–323. [Google Scholar] [CrossRef]
  45. Liu, Z.A.; Yang, J.P.; Yang, Z.C.; Zou, J.L. Effects of rainfall and fertilizer types on nitrogen and phosphorus concentrations in surface runoff from subtropical tea fields in Zhejiang, China. Nutr. Cycl. Agroecosystems 2012, 93, 297–307. [Google Scholar] [CrossRef]
  46. Du, Y.L. Study on Pollution Characteristics of Initial Rainwater and Its Intercepted Storage at Hefei Economic and Technological Development Area. Master’s Dissertation, Hefei University of Technology, Hefei, China, 2018. [Google Scholar] [CrossRef]
  47. Hu, D.; Zhang, C.; Ma, B.; Liu, Z.; Yang, L. The characteristics of rainfall runoff pollution and its driving factors in Northwest semiarid region of China—A case study of Xi’an. Sci. Total Environ. 2020, 726, 138384. [Google Scholar] [CrossRef]
  48. Dusza, Y.; Barot, S.; Kraepiel, Y.; Lata, J.C.; Abbadie, L.; Raynaud, X. Multifunctionality is affected by interactions between green roof plant species, substrate depth, and substrate type. Ecol. Evol. 2017, 7, 2357–2369. [Google Scholar] [CrossRef] [PubMed]
  49. Wen, L.; Wei, W.; Chen, W.P.; Deo, R.C.; Si, J.H.; Xi, H.Y.; Li, B.F.; Feng, Q. The impacts of substrate and vegetation on stormwater runoff quality from extensive green roofs. J. Hydrol. 2019, 576, 575–582. [Google Scholar] [CrossRef]
  50. Ma, Y.; Jiang, A.; Shi, X.J.; Li, Z.L.; Chen, X.P. Synthesis of microbial exopolysaccharides and their mechanisms and applications in heavy metal remediation. Acta Microbiol. Sin. 2024, 64, 701–719. [Google Scholar] [CrossRef]
  51. Hatt, B.E.; Fletcher, T.; Deletic, A. Hydraulic and pollutant removal performance of fine media stormwater filtration systems. Environ. Sci. Technol. 2008, 42, 2535–2541. [Google Scholar] [CrossRef]
  52. Liu, Y.; Cui, E.P.; Li, Z.Y.; Du, Z.J.; Gao, F.; Fan, X.Y. Migration of nutrient and heavy metals impacted by biochar and pectin under the irrigation with livestock wastewater. Plant Nutr. Fertil. Sci. 2018, 24, 424–434. [Google Scholar] [CrossRef]
  53. Cheng, J.; Bi, J.; Gong, Y.; Cheng, X.; Yu, J.; Gao, H.H.; Wang, R.; Wang, K. Processes of nitrogen removal from rainwater runoff in bioretention filters modified with ceramsite and activated carbon. Environ. Technol. 2023, 44, 3317–3330. [Google Scholar] [CrossRef]
  54. Pan, J.K.; Liu, Y.; Qu, Y.A.; Gao, J.P.; Zhang, X.G. Removal Effect of Runoff Pollutants by Bioretention of Composite Filler. Yellow River 2020, 42, 93–99. [Google Scholar] [CrossRef]
  55. Wang, C.G.; Wang, X.D. Improvement of soil adsorption performance of green space by plants. Huhei Agric. Sci. 2022, 61, 86–91. [Google Scholar] [CrossRef]
  56. He, Y.; Li, J.Y.; Tian, Y.L.; Gao, C.J.; Qian, J.H.; Li, H.; He, W. Pollution level and risk assessment of heavy metals in municipal sludge. Environ. Sci. Technol. 2021, 44, 131–138. [Google Scholar] [CrossRef]
  57. Gong, H.; Zhao, L.; Rui, X.; Hu, J.W.; Zhu, N.W. A review of pristine and modified biochar immobilizing typical heavy metals in soil: Applications and challenges. J. Hazard. Mater. 2022, 432, 128668. [Google Scholar] [CrossRef] [PubMed]
Figure 1. Dynamic leaching device diagram.
Agronomy 14 01958 g001
Figure 2. Nitrogen leaching with time at different percolation depths for different treatments. (a). The nitrogen concentration when the soil layer thickness is 10 cm. (b). The nitrogen concentration when the soil layer thickness is 20 cm. (c). The nitrogen concentration when the soil layer thickness is 30 cm. (d). The nitrogen concentration when the soil layer thickness is 40 cm. Here, 2a represents rain in the Xi’an area lasting for 100 min with a return period of 2 years, and 5a represents rain in the Xi’an area lasting for 100 min with a return period of 5 years.
Agronomy 14 01958 g002
Figure 3. Phosphorus leaching with time at different percolation depths for different treatments. (a). The phosphorus concentration when the soil layer thickness is 10 cm. (b). The phosphorus concentration when the soil layer thickness is 20 cm. (c). The phosphorus concentration when the soil layer thickness is 30 cm. (d). The phosphorus concentration when the soil layer thickness is 40 cm.
Agronomy 14 01958 g003
Figure 4. COD leaching with time at different percolation depths for different treatments. (a). The COD concentration when the soil layer thickness is 10 cm. (b). The COD concentration when the soil layer thickness is 20 cm. (c). The COD concentration when the soil layer thickness is 30 cm. (d). The COD concentration when the soil layer thickness is 40 cm.
Agronomy 14 01958 g004
Figure 5. Cu leaching with time at different percolation depths for different treatments. (a). The Cu concentration when the soil layer thickness is 10 cm. (b). The Cu concentration when the soil layer thickness is 20 cm. (c). The Cu concentration when the soil layer thickness is 30 cm. (d). The Cu concentration when the soil layer thickness is 40 cm.
Agronomy 14 01958 g005
Figure 6. Zn leaching with time at different percolation depths for different treatments. (a). The Zn concentration when the soil layer thickness is 10 cm. (b). The Zn concentration when the soil layer thickness is 20 cm. (c). The Zn concentration when the soil layer thickness is 30 cm. (d). The Zn concentration when the soil layer thickness is 40 cm.
Agronomy 14 01958 g006
Figure 7. Cd leaching with time at different percolation depths for different treatments. (a). The Cd concentration when the soil layer thickness is 10 cm. (b). The Cd concentration when the soil layer thickness is 20 cm. (c). The Cd concentration when the soil layer thickness is 30 cm. (d). The Cd concentration when the soil layer thickness is 40 cm.
Agronomy 14 01958 g007
Table 1. Basic properties of decomposed straw and biochar.
MaterialBulk Density (g·cm−3)pHSpecific Surface Area (m2·g−1)Maximum Water Capacity (%)Organic Carbon (%)TN (%)TP (g·kg−1)
Decomposed straw0.508.1317.62205.124.11.9813.4
Biochar0.169.7229.97861.651.51.274.37
Table 2. Amounts of materials used for different treatments.
TreatmentSoil (kg·m−3)Sand (kg·m−3)Composted Straw (kg·m−3)Biochar (kg·m−3)PAM (L·m−3)
SSJ560624100 76
SSBJ560624501676
SSS560624 3276
Note: The PAM concentration was 0.01 g·mL−1.
Table 3. Water quality of artificially prepared rainfall.
Total Nitrogen
(TN)
Total Phosphorus
(TP)
Chemical Oxygen Demand
COD
CuZnCd
Concentration (mg·L−1)823002.25301.5
Water distribution reagentKNO3KH2PO4C6H12O6CuCl2ZnSO4CdCl2
Table 4. Flow rate and operating time of the constant flow pump.
Flow Load (a)Set Water Collection Time (min)Flow Rate (L·min−1)
Low inflow loading1000.018
High inflow loading1000.024
Note: The low flow load refers to rain in the Xi’an area lasting for 100 min with a return period of 2 years, and the high flow load refers to rain in the Xi’an area lasting for 100 min with a return period of 5 years.
Table 5. Differences in soil physical properties when different improvement materials are added.
TreatmentSaturated Hydraulic Conductivity
(m·d−1)
Bulk Density
(g·cm−3)
Saturated Water Content
(%)
SSJ3.69 ± 0.751.25 ± 0.0339.65 ± 1.90
SSB3.53 ± 0.681.22 ± 0.0439.64 ± 0.97
SSBJ3.79 ± 0.441.24 ± 0.0135.72 ± 1.25
Note: SSJ: soil–sand–decomposed straw (4:4:2), SSB: soil–sand–biochar (4:4:2), and SSBJ: soil–sand–decomposed straw–biochar (4:4:1:1).
Table 6. Differences in the pollutant intercept capacity among the different treatments.
NPCODCuZnCd
SSJlowlowlowmediumlowlow
SSBhighhighhighhighmediummedium
SSBJmediummediummediumhighhighhigh
Note: S–N–K analysis of differences in the pollutant adsorption capacity of different materials based on post hoc comparisons after multivariate ANOVA. High, medium, and low values represent high to low adsorption capacities.
Table 7. Significance and contribution analysis of the effect of each factor on the adsorption capacity of the medium based on ANOVA.
NPCODCuZnCd
Modified material6.96% **84.15% **9.47% **49.5% **22.41% **6.2% **
Percolation depth31.29% **0.56% **33.08% **−0.04%0.15%34.96% **
Leaching time9.13% **1.39% **12.03% **2.12% **3.36%7.13% **
Flow load3.02% **0.4% **0.44% **18.36% **22.26% **2.77% **
Modified material × percolation depth11.02% **0.95% **2.07% **−0.28%0.87%19.23% **
Modified material × leaching time2.6% **4.21% **1.02% **0.03%3%3.69% **
Modified material × flow load4.47% **1.03% **20.14 %**5.11% **29.42% **3.58% **
Percolation depth × leaching time9.87% **0.41% **4.88% **−0.05%1.24%5.37% **
Percolation depth × flow load4.46% **0.05% **0.57% **0.05%0.16%0.94% **
Leaching time × flow load0.7% **0.4% **0.2% **0.43%2.86%0.28% **
Modified material × percolation depth × leaching time3.78% **2.36% **2.15% **−1.33%2.28%5.08% **
Modified material × percolation depth × flow load6.64% **1.74% **8.01% **−0.20%1.05%2.98% **
Modified material × leaching time × flow load1.65% **0.43% **2.83% **0.37%3%1.76% **
Percolation depth × leaching time × flow load1.53% **0.28% **0.26% **−0.05%1.17%0.96% **
Modified material × percolation depth × leaching time × flow load2.54% **0.97% **1.79% **−1.25%2.26%2.95% **
Error0.34% **0.68% **1.04% **27.05%4.49%2.18% **
Note: ** means extremely significant at the 0.01 level. The numbers in the table represent the contribution rates of different factors to the adsorption rates of pollutants. ‘×’ represents interaction.
Disclaimer/Publisher’s Note: The statements, opinions and data contained in all publications are solely those of the individual author(s) and contributor(s) and not of MDPI and/or the editor(s). MDPI and/or the editor(s) disclaim responsibility for any injury to people or property resulting from any ideas, methods, instructions or products referred to in the content.

