Article

Mitigating Dry–Hot–Windy Climate Disasters in Wheat Fields Using the Sprinkler Irrigation Method

by
Haijun Liu
1,*,
Yuhui Ren
2,
Xueqing Zhou
1 and
Ronghao Liu
2
1
Beijing Key Laboratory of Urban Hydrological Cycle and Sponge City Technology, College of Water Sciences, Beijing Normal University, Beijing 100875, China
2
College of Water Resources Science and Engineering, Taiyuan University of Technology, Taiyuan 030002, China
*
Author to whom correspondence should be addressed.
Agronomy 2024, 14(9), 1962; https://doi.org/10.3390/agronomy14091962
Submission received: 12 August 2024 / Revised: 25 August 2024 / Accepted: 28 August 2024 / Published: 29 August 2024
(This article belongs to the Section Water Use and Irrigation)

Abstract

:
The dry–hot–windy climate frequently occurs during the grain-filling stage of winter wheat on the North China Plain (NCP) and thus negatively influences wheat yield. Sprinkler irrigation can improve field temperature and humidity and can be used to mitigate dry–hot–windy climate disasters. A two-season field experiment was carried out on the NCP to test how sprinkler irrigation influences the microclimate, canopy temperature and photosynthetic traits, as well as the grain-filling process and final grain yield, when spraying 1.5–2 mm of water on dry–hot–windy days. Field experiments revealed that, compared with the no-spraying treatment, spraying with 2 mm of water each time caused the air and canopy temperatures to decrease by 2.3–7.6 °C and 4.3–9.9 °C, respectively, during and just after spraying stopped, and the temperatures returned to their previous levels approximately one hour after spraying. The air humidity increased by up to 10% during and after spraying. The photosynthesis and transpiration rates and the stomatal conductivity after spraying increased by 34–235%, 15–55% and 24–79%, respectively. The linear relationships between photosynthesis rates and transpiration rates with respect to stomatal conductivity suggest that increases in both photosynthesis and transpiration rates are the main contributors to the increase in stomatal conductivity, which is due mainly to the improved canopy temperature and humidity conditions caused by spraying practices. The grain-filling process was improved by spraying, which ultimately increased the unit grain mass by approximately 5%. One spraying event on a dry–hot–windy day influenced the field microclimate and canopy photosynthetic traits for 90 min (30 min in spraying time + 60 min after spraying). When the intensity of the dry–hot–windy climate is strong, two spraying events can be applied. Spraying 2–2.5 mm of water each time was sufficient when the leaf area index was 4–5 during the grain-filling stage of winter wheat. Spray events can have a slight effect on grain yield when a dry–hot–windy climate occurs within the last five days before harvest.

1. Introduction

The North China Plain (NCP) is the main wheat production region in China, producing 58% of the total wheat yield in China from 51% of all Chinese wheat cultivation fields in 2022 [1]. Although the wheat grain yield in China has been increasing over the last 20 years (from 3.7 to 5.8 ton ha−1) [1], increasing temperatures as a consequence of climate change have been estimated in the future that could negatively influence wheat production because of increasing heatwaves and drought [2,3,4]. The dry–hot–windy (DHW) climate, characterized by extremely high temperatures (>30 °C), low humidity (<30%) and high wind speed (>3 m s−1) [5], has been reported to occur frequently in the middle and later grain-filling stages of winter wheat in the NCP [6]. Under DHW climate conditions, plants cannot efficiently regulate their temperature because of the imbalance of transpiration rate and root water uptake. The extra-high leaves and canopy temperatures can destroy chloroplasts and reduce the energy transfer efficiency, reduce the plant photosynthesis rate and the accumulation of assimilated production, and ultimately reduce the crop biomass and yield [7]. A 10-h DHW climate in the grain-filling stage of winter wheat was found to resulted in a 4% decrease in wheat grain yield, and the DHW climate caused a reduction in wheat yield of 0.09 ton ha−1 per decade in the U.S. Grant Plain [8]. Therefore, reducing the canopy temperature and increasing the field humidity could mitigate the damage caused by a DHW climate and ultimately maintain high crop yields.
Sprinkler irrigation is mainly used to compensate for soil water depletion due to plant transpiration and soil evaporation. Moreover, when droplets travel through the air and are intercepted by the plant canopy, water evaporation occurs, which alters the energy balance as well as the microclimate near the canopy [9,10,11,12,13,14]. Tang et al. [15] investigated the energy balance in sprinkler-irrigated wheat fields and reported that the ratio of latent heat (used for evapotranspiration (ET)) to net radiation on the daily scale increased from 0.19 to 0.23 1–3 days after sprinkler irrigation, and the crop ET increased by 1.8–4.7 mm during an irrigation interval. Moreover, the mean daily ratio of sensible heat to net radiation decreased by 0.06–0.17, which caused the daily minimum and maximum temperatures to decrease by approximately 0.8 and 0.9 °C, respectively, and the daily mean relative humidity increased by approximately 7.5% in the first 3 days after sprinkler irrigation. Similar results in which the air and canopy temperatures decrease and the relative humidity increases within a few days after sprinkler irrigation have been reported in other studies [16,17,18]. Liu and Kang [19] investigated microclimate changes in winter fields under sprinkler and surface irrigation and reported that a lower air temperature and higher humidity in sprinkler-irrigated fields than in surface irrigation conditions existed in all periods from wheat elongation to harvest, which caused water evaporation in 20-centimeter-diameter pans to decrease by 3–11%. At the wheat growth season time scale, the seasonal wheat ET under sprinkler irrigation measured by weighing lysimeters was 4–23% lower than that under surface irrigation [20]. Therefore, it can be inferred that the sprinkler irrigation method could be an efficient measure to improve the field temperature and humidity status under DHW climate conditions.
In addition to microclimate improvement in the sprinkler-irrigated field, plant physiological traits, which mainly include photosynthesis and transpiration rates, changed correspondingly. For example, Urrego-Pereira et al. [17] investigated the changes in the microclimate and photosynthesis rates of maize and alfalfa with daytime sprinkler irrigation and reported that sprinkler irrigation decreased maize net photosynthesis by 19% due to high leaf wettability and a decrease in temperature below the optimum range for photosynthesis; however, sprinkler irrigation increased alfalfa net photosynthesis on 36% of days, mainly due to the wide range of optimum temperatures for alfalfa photosynthesis. Zhao et al. [21] integrated decreasing temperature and increasing humidity into a plant transpiration and soil evaporation model and reported that plant transpiration and soil evaporation during a sprinkler irrigation period (irrigation depth of 17–30 mm) decreased by 0.68–1.03 and 0.23–0.28 mm, respectively, and the corresponding rates of decrease were 47% and 45% compared with those in the no-sprinkler irrigation field. Martínez-Cob et al. [22] reported that during daytime sprinkler irrigation, crop ET decreased by 32–55% and transpiration decreased by 58% compared with those under no-sprinkler irrigation, and after sprinkler irrigation for 1–2 h, the ET increased by 34%, while transpiration still decreased by 20%, and approximately 2 h after sprinkler irrigation, there was no significant difference in the transpiration rate. Similarly, Urrego-Pereira et al. [16] reported that the transpiration rates of corn with sprinkler irrigation were 30–36% lower than those with dry irrigation during the irrigation process, and the transpiration reduction lasted for 1.8–2.6 h, with a range of 22–29% after irrigation. Therefore, when the air temperature is regulated to within the optimal range for the crops by sprinkler irrigation, the microclimate change could increase the photosynthesis rate during and after the sprinkler period, and the change in transpiration rate depends on the crop and climate conditions.
Improvements in the field microclimate and plant photosynthetic traits ultimately enhance crop yield and fruit quality. For example, Liu et al. [23] investigated the cooling effects of microsprinkler irrigation on jujube plants and reported that microsprinkler irrigation with 2–6 mm water caused increases in the net photosynthesis rate and stomatal conductance and a decrease in the transpiration rate from the flowering stage to the fruit set stage, mainly due to increased temperature and decreased humidity and vapor pressure deficit, which ultimately increased the soluble sugar content by 2.0–6.5% and yield by 2.0–7.0%. Under a DHW climate, some studies have reported that the microclimate can be regulated by solid-set sprinkler irrigation and central pivot sprinkler irrigation systems and that the wheat yield was increased by 3–4% on average [18,24]. Based on the aforementioned results, sprinkler irrigation could improve the field microclimate and, ultimately, crop yield and quality. However, it is still unclear how sprinkler irrigation influences the photosynthesis traits and grain-filling rates of wheat, how much water should be applied each time, and what times are best to trigger sprinkler-cooling practices when there is a DHW climate.
Considering the frequent occurrence of a DHW climate in the grain-filling stage of winter wheat in the NCP, a field experiment was carried out to mitigate the negative effects of a hot–dry–windy climate on wheat growth with the objectives of (1) investigating the microclimate and canopy temperature changes with spraying 1–2 mm water, (2) analyzing the responses of photosynthesis traits, the grain-filling process and wheat yield to spraying water, and (3) proposing an optimal irrigation depth and start time of spraying on DHW days.

2. Materials and Methods

2.1. Experimental Site

The field experiment was carried out at Dacaozhuang Seed Breeding Station, Ningjin County, Hebei Province, China (longitude 114° 56′, latitude 37° 30′, altitude 26 m). The station is located in a typical winter wheat cultivation region in the central part of the NCP. The field area at the station is approximately 15 ha. Solid–lateral sprinkler irrigation systems are used to irrigate wheat crops at the station, and both solid–lateral sprinkler irrigation systems and central pivot sprinkler irrigation systems are used in the approximately 1500 ha field around the station. The climate in the station region is a typical warm temperate semiarid monsoon climate. The annual average temperature is 12.8 °C, and the annual average precipitation is 449 mm, with approximately 60% distributed from July to September. The annual average sunshine hours are 2538 h, and the wind speed is 2.3–2.7 m s−1. At the experimental station, the mean total organic carbon content in the 0–30 cm soil layer was 13.1 g kg−1, the available nitrogen content (NO3-N) in the 0–100 cm soil layer ranged from 16.7 to 22.7 mg kg−1, the available phosphorus content ranged from 2.3 to 15.3 mg kg−1, and the available potassium content ranged from 172 to 244 mg kg−1. The field soil texture at the 0–100 cm depth is silty loam following the American standard. The water holding capacity ranges from 0.36 to 0.38 cm3 cm−3. The detailed data of the soil texture are shown in Table 1.

2.2. Experimental Layout

Winter wheat in the NCP is generally sown in the first half period in October, then enters the winter period from December to February, after which it begins the regreening period in March, the elongation period in April, the heading stage in late April and the grain-filling stage in May, and finally, it is harvested in the first half period in June. The dry–hot–windy (DHW) climate mostly occurs from the middle and later grain-filling stages to harvest. The field microclimate was automatically recorded by a climate station at the experimental station from October 2018 to June 2023. Climate data from 20 May to 10 June (from late grain filling to harvest) in each season were used evaluate DHW conditions. In accordance with the standard “Disaster grade of dry–hot–windy for wheat” (QX/T 82–2019) issued by the China Meteorological Administration [1], the climates in the grain-filling stages of the 2018–2019 and 2021–2022 seasons clearly represent DHW conditions. Therefore, a field experiment in which a small amount of water was sprayed to mitigate the effect of DHW on wheat growth was carried out over two seasons. Water spraying was performed on days when there were clear DHW conditions. Five days were chosen for the experiment, one in the 2019 season and four in the 2022 season. The detailed climate conditions over the five days are listed in Table 2.
In the 2019 season, the amount of water sprayed by the sprinkler irrigation system was 1.2 mm. Wang et al. [25] reported that the water interception of the winter wheat canopy at the middle growth stage was 0.6 mm. When both sides of the leaves in the wheat canopy are wetted, the amount of water needed for canopy interception is doubled. Therefore, the water spraying amount was 1.2 mm. Later, we measured the sprinkler water distribution in the wheat canopy and reported that the mean canopy water interception was 0.9 mm and that approximately 60% of the sprinkler water reached the soil surface as throughfall water [26]. In this case, when the full canopy is wetted and 60% of the irrigation water is taken as throughfall water, the irrigation water can reach 2.25 mm. Therefore, in the experiment in the 2022 season, the water sprayed during each event was 2.0 mm after considering the theoretical value (2.25 mm) and the previous experimental value (1.2 mm).
The experimental layout is shown in Figure 1a,b. The total wheat field used for this experiment was 1.2 ha in size, with a length of 200 m and a width of 65 m. A solid-set lateral sprinkler system was used in this experiment. The sprinkler system was first used for irrigation during the wheat season. There were three laterals with a distance of 18 m between two adjacent sprinklers. The sprinklers were spaced 18 m apart with a discharge of 2.6 m3 h−1 under a working pressure of 0.2 MPa. With this sprinkler irrigation layout, the theoretical irrigation intensity is 8.0 mm h−1, and the measured water distribution uniformity, which was calculated using the Christian method, was approximately 0.8 and higher than the threshold of 0.75 [27]. Since the dominant wind direction in the later wheat growth period was north–east, only the west lateral direction was used for spraying water in the experiment, and the irrigation intensity was 4.0 mm h−1. The irrigation water was from groundwater, and the water quality was perfect. Based on the DHW climate conditions, one water spraying event occurred on 2 June in the 2019 season, 28 May and 31 May in the 2022 season, and two spraying events occurred on 3 June and 5 June in the 2022 season because of the extremely high temperatures during the latter two days.

2.3. Measurements

Soil water: Soil water was measured by taking soil samples from the 0–100 cm soil depth at 20 cm soil intervals. The gravity soil water content was first determined and then converted into the volumetric soil water content by considering the bulk density. The relative soil water content was calculated as the ratio of the measured volumetric soil water content to the field capacity. The soil water content was measured at three sites in the field before the experiment and at harvest. The mean data from the three sites were used for data analysis.
Microclimate: The air temperature and humidity above the wheat canopy were measured using a calibrated temperature–humidity system (Model USB-TH, Jiandarenke Co., Jinan, China) (seeing Figure 1a,b). The resolutions of the temperature and humidity sensors are 0.1 °C and 1.5%, respectively. The system was deployed at 80 cm above the ground surface and approximately 10 cm above the canopy when the wheat height was 70 cm. There were 13 measurement sets deployed in the middle of the field along the width direction and perpendicular to the laterals. The spacing between the measurement sets was 5–6 m. The data were sampled and stored at 1 min intervals. The temperature and humidity were measured from 28 May to 5 June in the 2022 season. There was an automatic weather station at the experimental station, which was approximately 50 m away from the experimental plot. The measured variables included the air temperature, relative humidity, shortwave radiation and wind speed at 2 m high using a CR1000 data logger (Campbell Scientific, Inc., Logan, UT, USA). The signals were sampled for 10 s, and 30-min average data were stored for later processing.
Canopy temperature: Canopy temperature was measured using a thermal infrared imager (Model Ti200, Fluke Co., Everett, WA, USA) (Figure 1c). During the measurements, the canopy temperatures in both the spraying field and the no-spraying field were measured. The infrared image was automatically processed, and the mean canopy temperature was used for data comparison. During spraying and within one hour after spraying, the canopy temperature was measured at 10–15 min intervals and at 30–60 min intervals during the other periods. The canopy temperature was measured on all five experimental days.
Photosynthesis and transpiration rates of leaves: Photosynthetic factors, including net photosynthetic rate (Pn) and transpiration rate (Tr), were measured at 30–60 min intervals on all treatment days using a portable photosynthesis system (Model Li-6800, LICOR., Inc., Lincoln, NE, USA), and the stomatal conductivity (Gs) and intercellular CO2 concentration (Ci) were automatically calculated by a measurement system. Flag leaves from three plants in both with and without water spraying fields were selected for measurement, and the mean values were used for comparison. During the photosynthetic measurements, a 3 × 3 cm cuvette head was used, the atmospheric CO2 (Ca) at the chamber reference was set to 400 μmol mol−1, and the radiation intensity, air temperature and humidity were not controlled. The Ci/Ca ratio represents the balance between CO2 diffusion into the leaf (regulated by Gs) and CO2 fixation by photosynthesis. The index of stomatal limitation to Pn (Ls) is calculated based on the Ci/Ca ratio by the equation L s = 1 C i C a [28]. High Ls and low Ci/Ca indicate high Pn relative to Gs, and low Ls with high Ci/Ca indicates low Pn relative to Gs [29].
Grain-filling process: The grain-filling process was not investigated in the 2019 season because water spraying to mitigate DHW effects was carried out on 2 June, which reached harvest (10 June). In the 2022 season, water spraying was performed beginning on 28 May and greatly influenced the grain-filling process. Therefore, the grain-filling process was investigated at 2–3-day intervals from 30 May to harvest (10 June) in the 2022 season. For each measurement, ten wheat ears from both the spraying and no-spraying fields were collected, after which the grains in each ear were numbered and placed in an envelope. The grains were subsequently placed in an oven and dried at 80 °C until the mass weight did not change. Finally, the dry mass per grain was calculated as the ratio of the total dry grain mass to the total number of grains.
Grain yield: The grain yields in both the spraying and no-spraying fields were investigated in the 2019 and 2022 seasons. For each measurement, ten 1 m × 1 m subplots were selected randomly from both the spraying and no-spraying fields. All wheat plants in each subplot were harvested. For each sample, wheat grains were obtained by thresholding using a machine, and the water content of the wheat grains was subsequently determined. The final grain yield of each treatment was obtained based on the standard water content of 13% and converted to the amount per hectare for comparison.

2.4. Data Processing

The data were collated in Microsoft Excel 2013, and one-way ANOVA in SPSS 21 (SPSS, Inc., Chicago, IL, USA) was used to analyze the differences in canopy temperature, photosynthetic traits, grain mass and total wheat yield between the spraying and no-spraying fields via the Duncan test at a significance level of 5%. Graphs were created using Origin 2022 (OriginLab Co., Northampton, MA, USA) and Microsoft Excel 2013.

3. Results

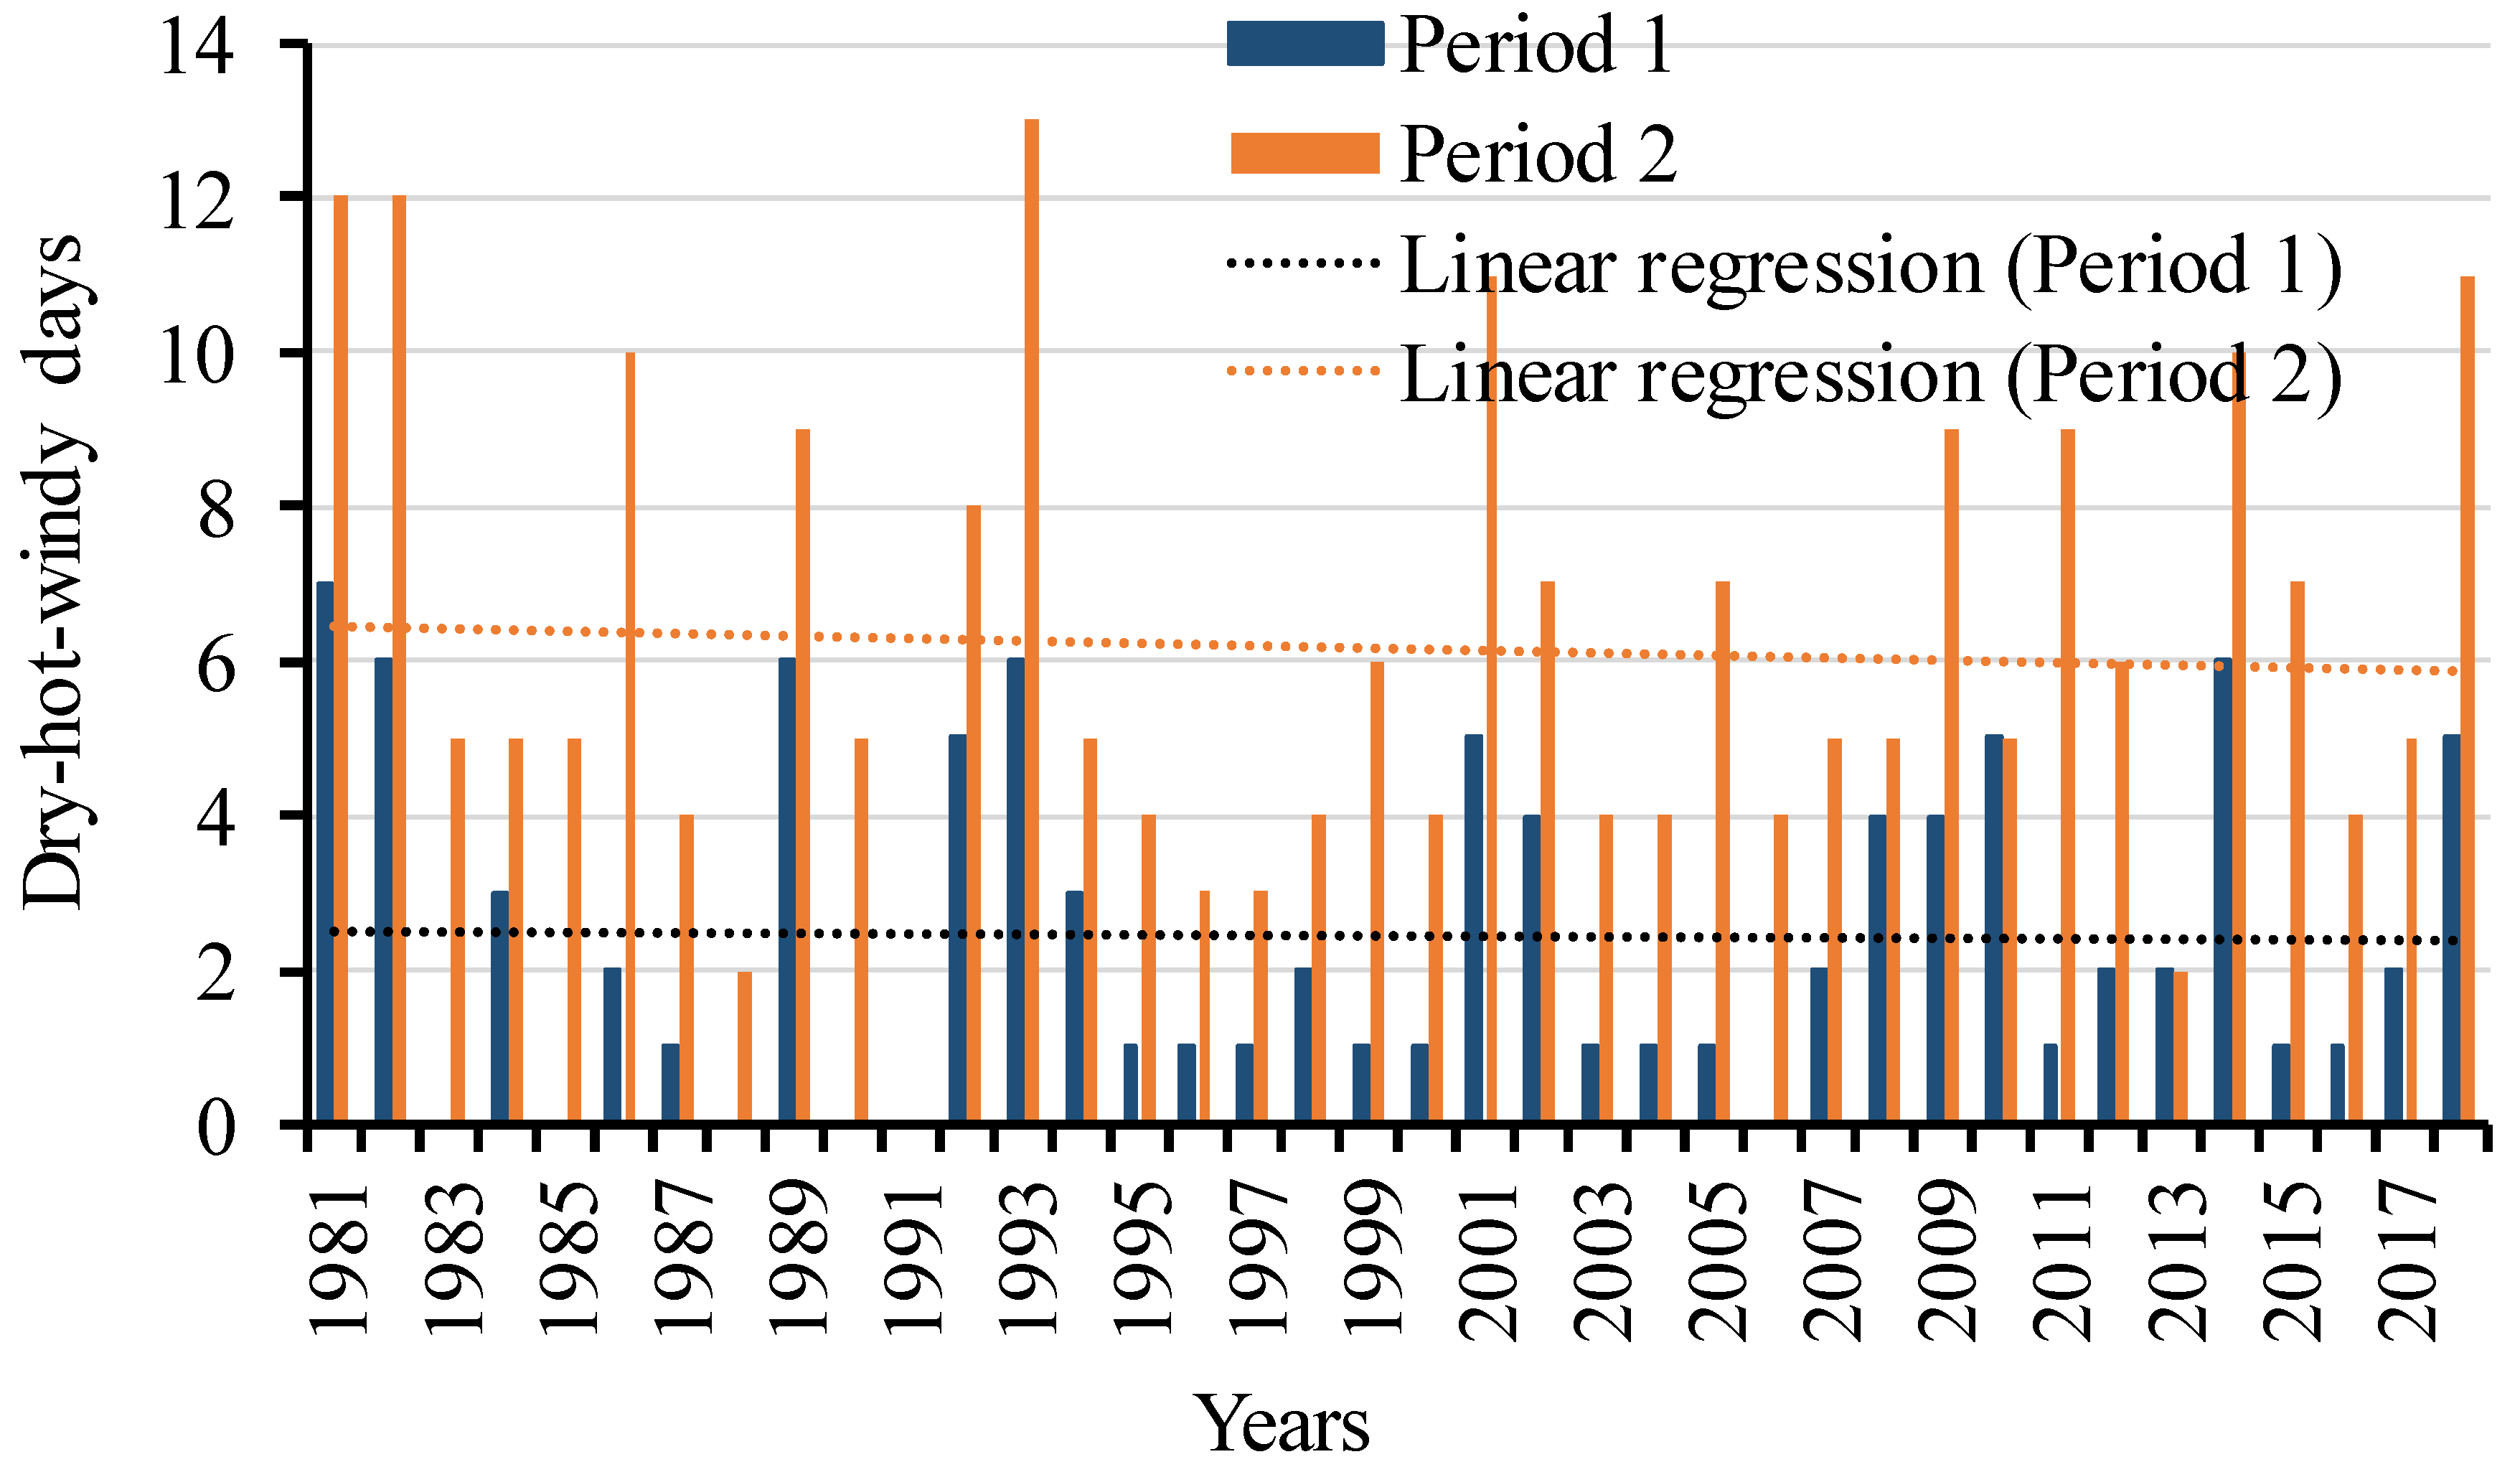
3.1. Dry–Hot–Windy Climate in the Winter Wheat Season

The dry–hot–windy climate mostly occurred during the late grain-filling stage. Therefore, we counted the DHW days from 20 May to 31 May (the middle to late grain-filling stage, the sensitive period for grain yield and named Period 1) and from 20 May to June 10 on the harvest day (the full period from the late grain-filling stage to harvest, named Period 2) from 1981 to 2018 (Figure 2). In Period 1, with a total of 11 days, the number of DHW days varied from 0 to 7, with a mean of 2.4 days. In Period 2, the number of DHW days varied from 0 to 13, with a mean of 6.2 days. The number of DHW days from 1 June to 10 June was approximately 1.3 greater than that in Period 1. There was no clear trend in the number of DHW days between Periods 1 and 2. Approximately 20–30% of DHW events and no significant change rate indicated frequent and strong DHW events in the wheat season in the NCP.
The climate dates from 20 May to 10 June from the 2019–2023 seasons were evaluated based on the DHW climate standard [5]. In the 2020, 2021 and 2023 seasons, the air temperature at 14:00 on most days was lower than 30 °C, and the humidity was higher than 30%. Therefore, the intensity of the DHW climate was weak, and water was not sprayed using the sprinkler irrigation system. In the 2019 and 2022 seasons, there were clear DHW days (Figure 3). There were nine DHW days from 20 May to 10 June in the 2019 season, while three days occurred from 8 June to 10 June. In the same period in the 2022 season, there were eight DHW days, all of which occurred from 26 May to 7 June. The mean temperature, humidity and wind speed at 14:00 on DHW days in the 2022 season were 33.4 °C, 22.2% and 4.2 m s−1, respectively, and 34.6 °C, 22.1% and 3.8 m s−1, respectively, in the 2019 season. Since all the DHW climates in the 2022 season occurred in the grain-filling stage, four spray events were carried out in the 2022 season, followed by one spraying event on 2 June in the 2019 season (Table 2).

3.2. Soil Water Content and Field Microclimate

The soil water contents at the 0–100 cm depth were measured on 21 May in the 2019 season and 25 May in the 2022 season. The mean soil water contents in the 0–100 cm soil layer were 0.26 and 0.30 cm3 cm−3 in the 2019 and 2022 seasons, respectively. Both soil water contents were higher than the threshold value of 0.25 cm3 cm−3 (65% of field capacity) for the water stress of wheat [30,31]. This infers that the soil water content is not a limiting factor for wheat growth in the later growth period.
The temporal and spatial distributions of the measured air temperature and humidity approximately 10 cm above the canopy on the water-spraying day in the spraying and the no-spraying fields are shown in Figure 4. Since the distributions of air temperature and humidity in the field on each water-spraying day were similar, those on 28 May are presented in Figure 4. Before water was sprayed, there were no obvious differences in either the air temperature or the humidity between the fields with and without water. When water was sprayed at 14:00, the air temperature decreased, and the humidity increased quickly, as shown by the light yellow and green areas in Figure 4. The effect of spraying water on the temperature and humidity was much more obvious in the middle part and less obvious at the edge of the spraying area. When the spraying was stopped at 14:25, the air temperature increased quickly and became close to that in the field without spraying. Similarly, the humidity gradually increased after spraying stopped, and approximately 30–60 min later, the humidity became close to that under no spraying.
The mean air temperature and humidity values approximately 10 cm above the canopy in the spraying and no-spraying fields during the daytime with one (31 May) and two (5 June) spraying events are shown in Figure 5. Generally, the temperature quickly decreased when the spraying started, and the low temperature lasted during the spraying period. The largest temperature decreases were between 2.3 and 7.6 °C during the spraying period. After the spraying stopped, the air temperature in the spraying field increased and was close to that in the no-spraying field approximately 30–60 min after spraying. When the air temperature is still high and the first spraying-cooling effect has vanished, another spraying event can be performed. With two spraying events on 5 June, the air temperature in the spraying field was 1.0–7.5 °C lower than that in the no-spraying field from 14:30 to 17:30.
Similar to the change in air temperature, the relative humidity increased by 6–11% during the spraying period, decreased quickly after the spray stopped and was finally close to that under no-spraying condition 30–60 min later. When there were two spraying events, both spray events had similar effects on the relative humidity changes (Figure 5b). Generally, after one or two spraying events, the relative humidity will ultimately increase, and the effects of low humidity under a DHW climate will be alleviated.

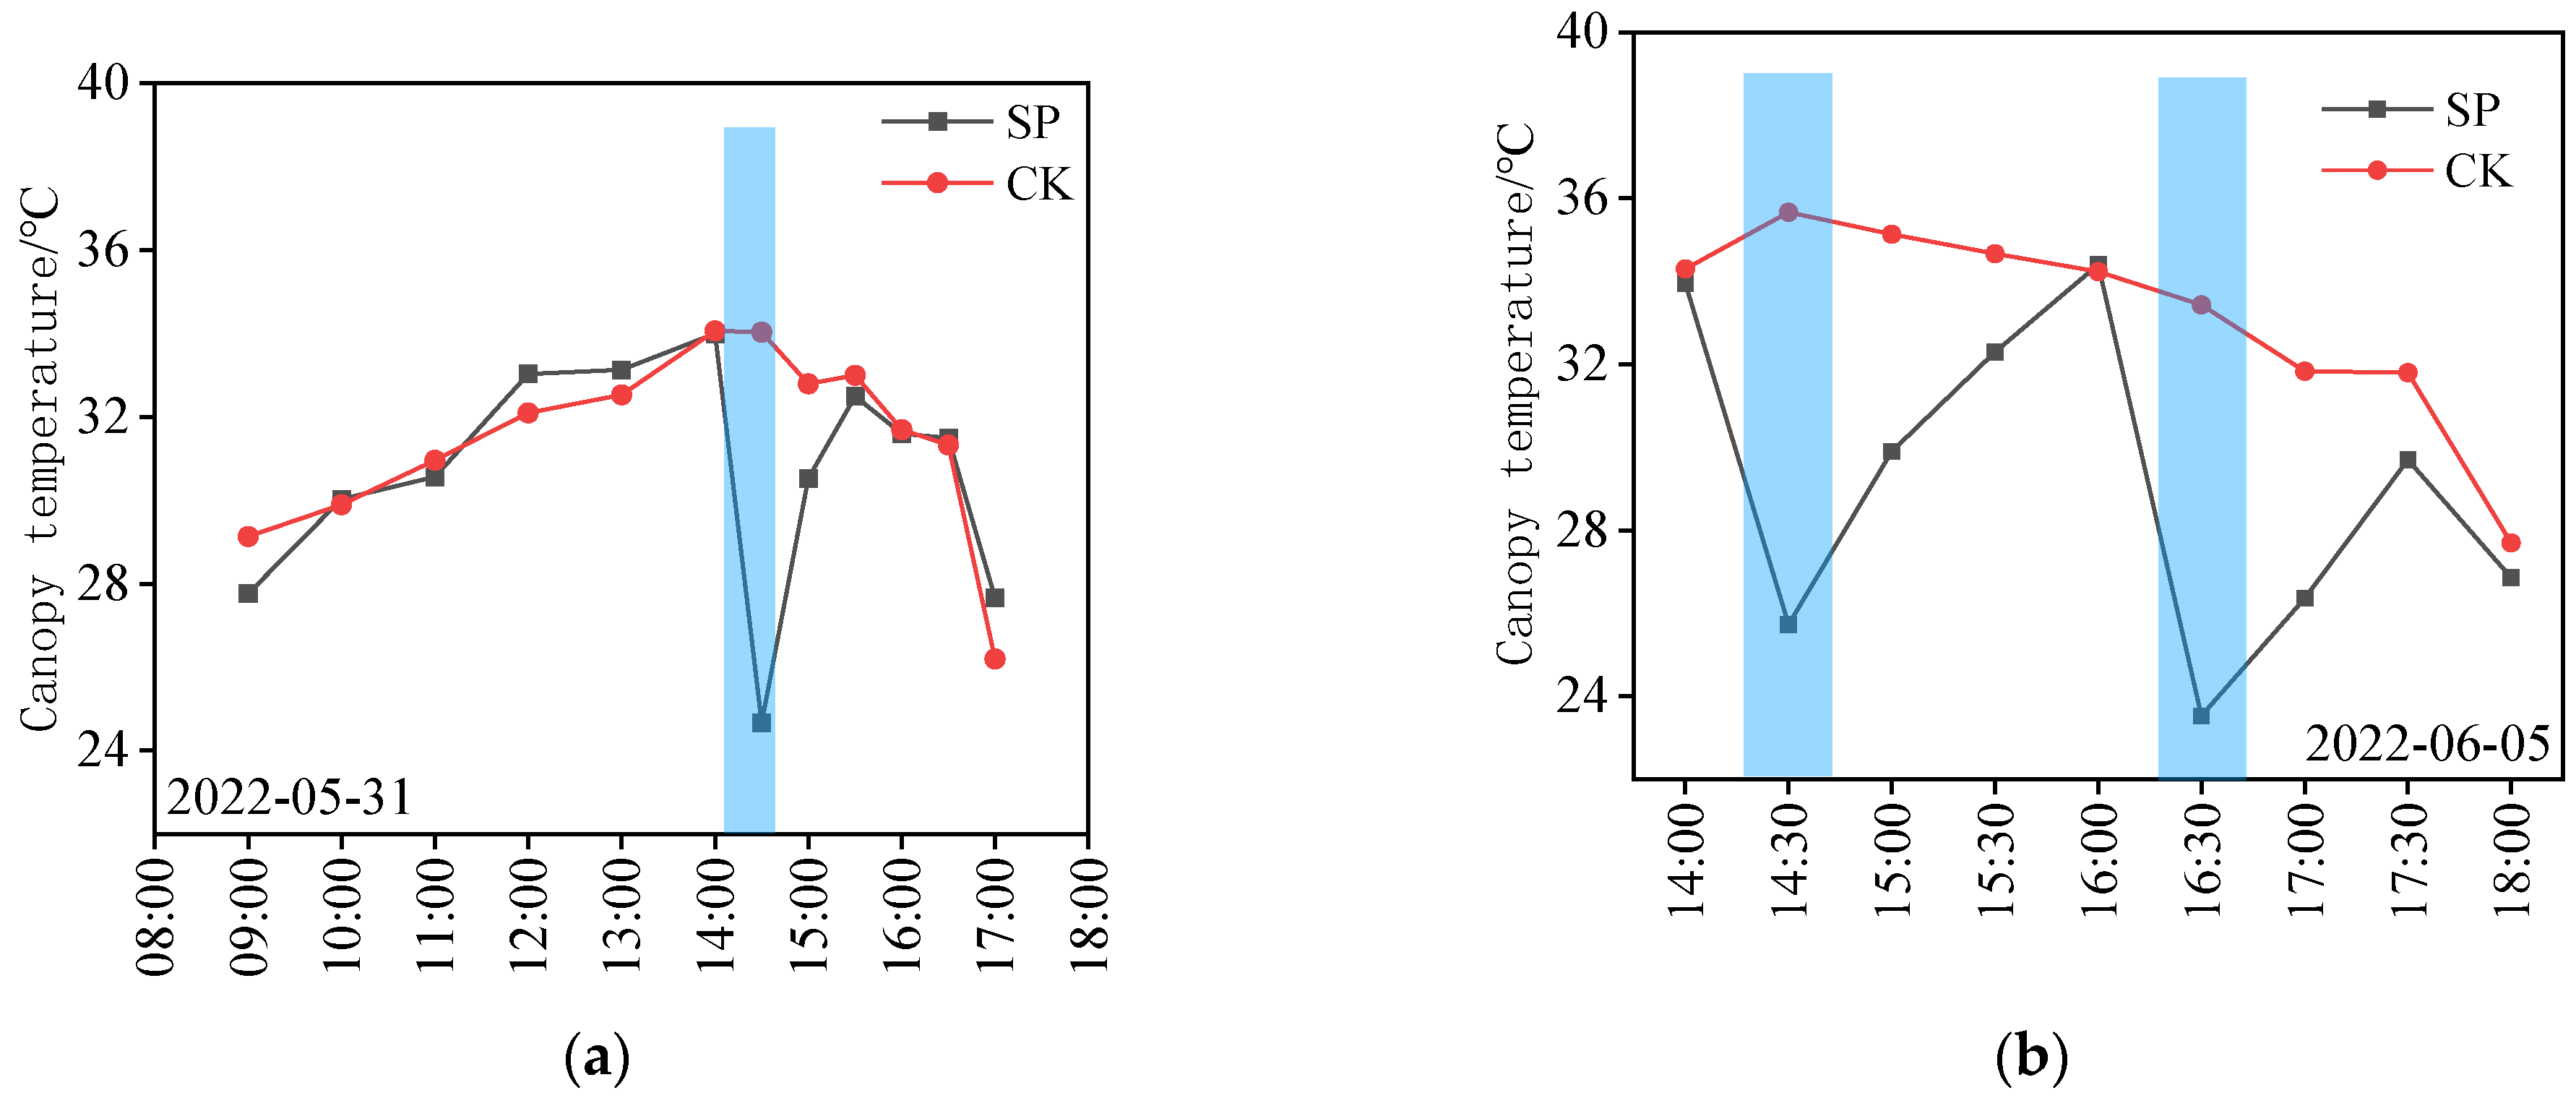
3.3. Canopy Temperature Response to Spraying on DHW Days

The canopy temperatures measured in both the spraying and no-spraying fields during and after the spraying period are shown in Figure 6. The results clearly reveal that spraying water significantly decreased the canopy temperature during and after the spraying events. The largest decrease in canopy temperature was approximately 4.3–9.9 °C and occurred during the spraying period. When the spraying stopped, the canopy temperature in the spraying field increased quickly. The effect of spraying water on the canopy temperature generally lasted for approximately 1 h, which is similar to the response times of the air temperature and humidity (Figure 4 and Figure 5). Each spraying event had a similar effect and temperature decline curve on the canopy temperature. Therefore, when one spraying event cannot efficiently regulate the canopy temperature, two or more spraying events can be carried out. On 3 June, the first spraying was carried out at 13:40, and the effect was slight after one hour; then, the canopy temperature returned to the normal temperature and was still high (36.0 °C). In this situation, another spraying event was performed, and the low canopy temperature lasted until 17:00. After that time, both the air temperature and canopy temperature gradually decreased.

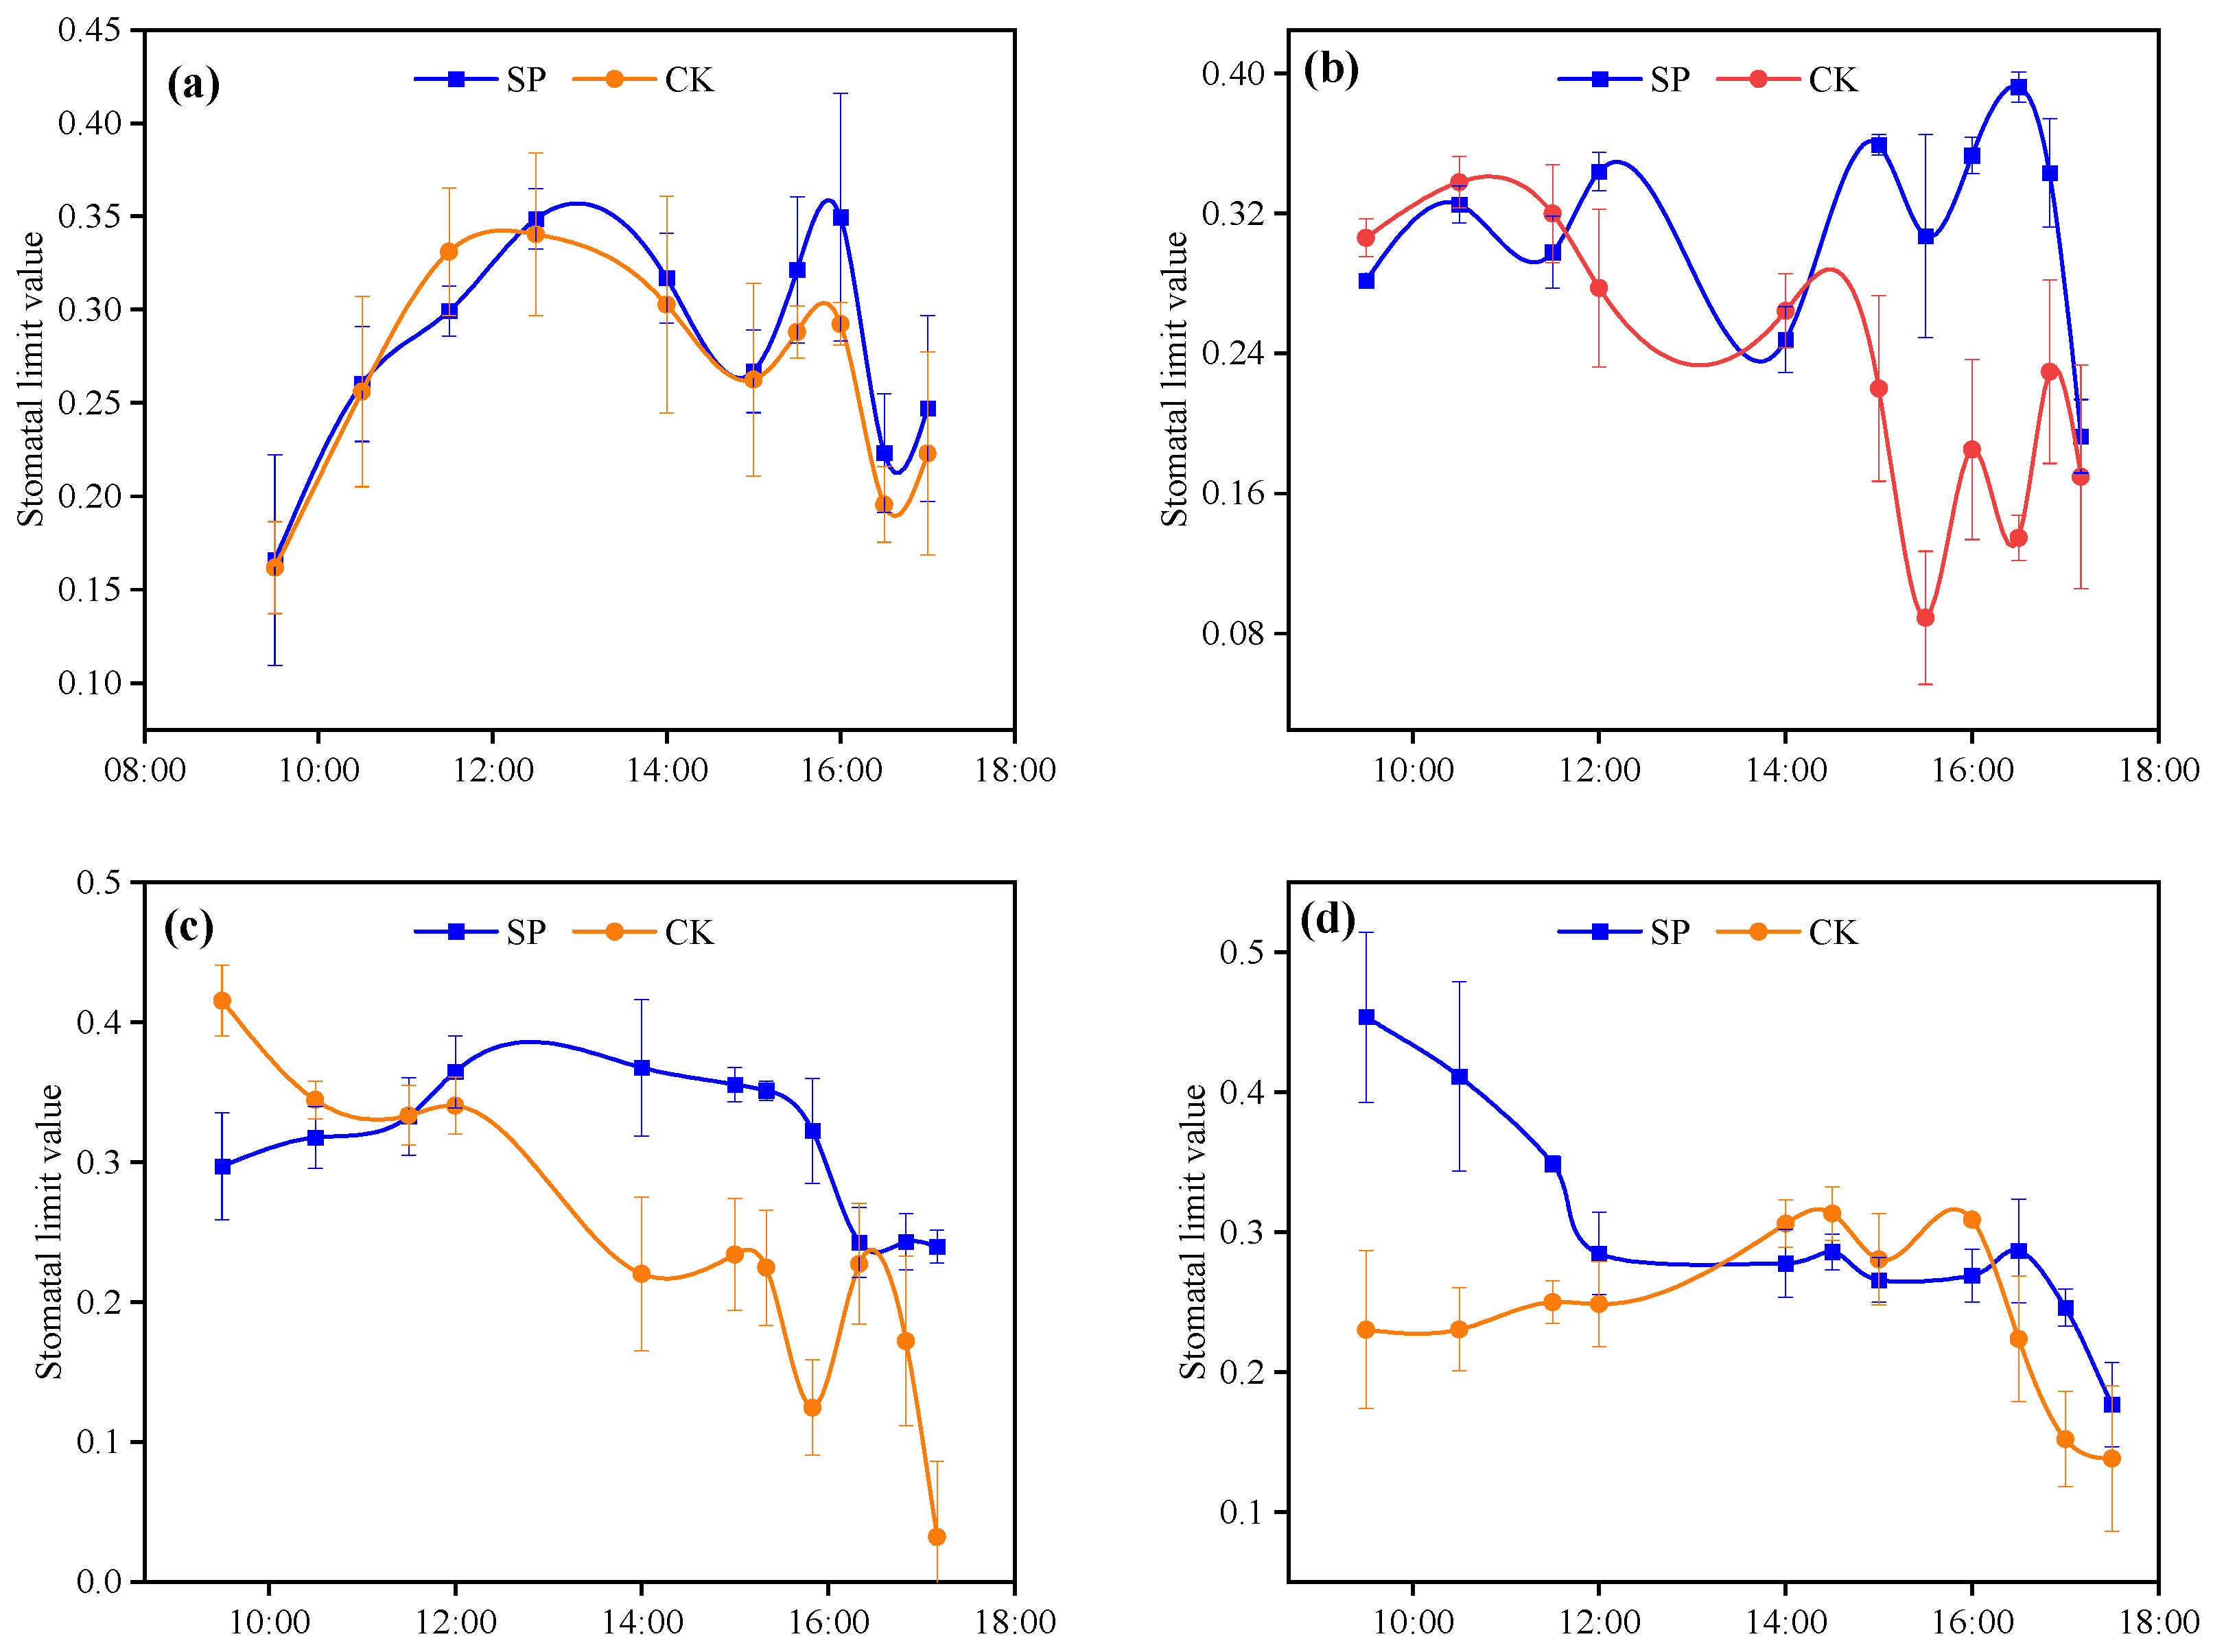
3.4. Photosynthetic Trait Responses to Spraying on DHW Days

The improvements in air temperature and humidity as well as canopy temperature, caused by spraying water, ultimately influence leaf photosynthetic factors. Figure 7, Figure 8 and Figure 9 show the net photosynthesis rate (Pn), transpiration rate (Tr) and stomatal conductance (Gs) during the daytime in the spraying and no-spraying fields on the four spraying days (28 May and 31 May and 3 June and 5 June, 2022). Figure 7 shows that the Pn was significantly (p < 0.05) influenced by the spraying events on all the treatment days. Before spraying, the Pn in the spray field was close to that in the no-spray field and was lower on some days (31 May). Under no-spraying conditions, the Pn on most days was the highest at 9:00 in the morning and then decreased from 9:00 to 17:00 throughout the day due to the unpleasant climate. When the canopy was sprayed with water, the Pns increased quickly by 2–5 µmol m−2 s−1, and the relatively high Pn generally lasted for approximately 1 h. After that, the Pn decreased and returned to a level close to that in the unsprayed fields. With two spraying events on 3 June and 5 June, the significant higher Pn lasted for approximately 2–3 h.
Similar to the increase in Pn after spraying, both Tr and Gs significantly (p < 0.05) increased after spraying. On 31 May, although the Tr before spraying in the treatment field (due to the sampling issue) was 25–78% lower than that in the CK, it increased quickly and was 15–45% greater after spraying. These findings indicate that spraying greatly increased the Tr and Gs, and this effect lasted for approximately one hour. Stomatal closure is a key factor for photosynthesis. The daily curves of the stomatal limitation value with respect to photosynthesis (Ls) are shown in Figure 10. The Ls value increased significantly by 0.05–0.26 and, correspondingly, by 11–77% after the spraying practice on the first three spraying days and slightly at the last spraying event on 5 June. These findings indicate stronger stomatal regulation of the Pn after spraying on the first three spraying days than on the last spraying day.
The mean increases in the Pn, Tr and Gs one hour after one spraying (28 May and 31 May) and three hours after two sprayings (3 June and 5 June) are shown in Figure 11. The mean Tr and Gs increased from the first spraying on 28 May to the last spraying on 5 June, and the corresponding increase percentages ranged from 15 to 55% in the Tr and from 24 to 79% in the Gs (Figure 11a,c). The Pn increased from the first to the second spraying and then slightly decreased (Figure 11c). The percentages of increase in the Pn from the first to the last spraying days were 34%, 235%, 167% and 62%, respectively, and the mean percentage increase was 126%. Compared with the increase in Tr (mean value of 46%), the increase in Pn (mean value of 126%) was much greater, indicating a greater water use efficiency. Figure 11d shows that the stomatal limitation value (Ls) for photosynthesis in the spraying field increased by 11.3% on the first day (28 May) to 78% and 58% on the second and third days (31 May and 3 June), respectively, and finally to 7% on the last day (5 June). The mean percentage increase in Ls in the spraying field was 39% greater than that in the CK.

3.5. Response of the Grain-Filling Process and Yield to Spraying on DHW Days

The grain-filling process was investigated just after the water spraying treatment was carried out from 28 May in the 2022 season. The changes in grain mass from 30 May to 11 June at harvest are shown in Figure 12. The grain mass before the spraying treatment in both the spraying and no-spraying fields was similar and increased from 30 May to 11 June at harvest. However, the rate of increase in the grain mass resulting from the spraying treatment was greater than that resulting from the no-spraying treatment, especially after 4 June. The grain mass still quickly increased with spraying treatment; however, the rate of increase in the grain mass decreased when no spraying occurred. At harvest, the grain mass (45.8 g 1000 grain−1) under the water spraying treatment was approximately 5.5% greater than that (43.5 g 1000 grain−1) in the no-spraying treatment. The wheat yield also showed that (Table 3) spraying water on dry–hot–windy days increased the yield by approximately 1% compared with that in the no-spraying treatment, although the difference was not significant (p > 0.05). The insignificant difference in yield could be due to the sampling variation of approximately 2% (Table 3).

4. Discussion

4.1. Microclimate Changes Caused by Spraying Water on DHW Days

Crop disasters caused by a dry–hot–windy climate are due to extremely high temperatures (>30 °C), relatively low humidity (<30%) and high wind speeds (3 m s−1) [5,32]. This special climate results in high water evaporation potential conditions, which quickly leads to the loss of water from leaves. When the water lost from the crop cannot be compensated for by water taken up by the roots, the crop will wilt or even die. During the sprinkler irrigation process, evaporation occurs when droplets fly from sprinkler nozzles to the canopy surface and from canopy water interception [12,13,14,33]. Water evaporation requires energy and ultimately influences the field energy balance. Tang et al. [15] reported that, under a high soil water content, the ratio of the latent heat amount to the total net radiation under sprinkler-irrigated wheat fields was 0.19–0.23 greater than that under no-sprinkler irrigation conditions. As a result, the ratio of sensible heat to net radiation decreased by 0.02–0.14. Therefore, the investigated daily maximum air temperature in the sprinkler-irrigated field decreased by approximately 1 °C over the following three days after sprinkler irrigation. Similar results of temperature decline under sprinkler conditions have been reported widely [19,21]. Water evaporation increases the water particle density in air and consequently the field relative humidity [19]. Liu and Kang [24] reported that the maximum air temperature decreased by 6–10 °C and that the vapor pressure deficit (VPD) decreased by 0.1–0.8 kPa on sprinkler irrigation days. On dry–hot–windy days, Cai et al. [18] reported that spraying 2.5–5.0 mm water caused the temperature to decrease by 2–5 °C and the humidity to increase by up to 10%. The changes in temperature and humidity are influenced by the irrigation depth, air temperature, humidity and the duration of spraying [15,18,19,24]. In this study, the air temperature after water was sprayed decreased to 2.3–7.6 °C, and the relative humidity increased by 10%, which is consistent with the research results mentioned above. The change in air temperature (2.3–7.6 °C) in this study was greater than that (1–5 °C) reported previously [19], which could be due mainly to the higher temperature and lower humidity conditions in this study.
Research has shown that the duration of the effects of sprinkler irrigation on field temperature and humidity ranges from a few hours to a few days during the whole wheat growth season [18,19,21,24,34]. The duration of spraying is influenced mainly by the sprinkler water depth, climate conditions and crop growth conditions [9,18]. For example, Tang [9] reported that the effect of sprinkler irrigation (approximately 40 mm water) on the field microclimate could last 5–7 days, and the greatest influence on temperature and humidity was found on sprinkler irrigation days and the first three days after sprinkler irrigation. When sprinkler irrigation was carried out at intervals of approximately 10 days, the microclimate changed from wheat regeneration to harvest on the NCP [19]. Under DHW climate conditions, Liu and Kang [24] reported that the influencing period ranged from 50 to 60 min, and a similar influence period was reported in our research and by Cai et al. [18]. Therefore, we can conclude that spraying water using a sprinkler system is an efficient way to improve the field temperature and humidity on DHW days, and these effects could last for approximately one hour. When the spraying effect dissipates and the temperature is high, more spraying practices can be carried out. For example, in this study, two spray events caused the air temperature to decrease from approximately 14:00 to 17:00 on 3 June and 5 June (Figure 5b and Figure 6b).

4.2. Improvements in Photosynthesis Traits and Yield Caused by Spraying Water on DHW Days

The high temperature, low humidity and high wind speed on DHW days strongly influence crop physiological and growth activities [35]. The optimal temperatures for wheat growth are 16 ± 2.3, 23 ± 1.75 and 26 ± 1.53 °C at the heading, anthesis and grain filling stages, respectively [36,37]. An extremely high temperature (30–40 °C) in the grain-filling stage under a DHW climate could strongly negatively affect photosynthetic traits, shorten the grain-filling process and ultimately result in a low yield [32,38,39]. Moreover, the extremely low humidity and high wind speed cause the canopy to quickly lose water, which consequently influences the physiological and growth activities of wheat plants. Therefore, decreasing the air temperature and increasing the field humidity could improve the field microclimate and, ultimately, physiological activities [16,17,18,21]. This study revealed that the net Pn rate of flag leaves in the spraying field was 34–235% greater than that in the no-spraying field (Figure 7 and Figure 11). The highest increase rate of 235% in Pn was reported on 31 May of 2022, which could be mainly due to the strong intensity the dry–hot–windy climate (Table 2). The strong DHW climate caused low Pn throughout the daytime and the Pn increased greatly after spraying (Figure 7b). This shows spraying practice has large potential to improve Pn on stronger dry–hot–windy days. Moreover, the Tr rate and Gs were 15–55% and 24–79% greater, respectively, in the spraying field than in the no-spraying field. Generally, the Pn and Tr rates are positively and linearly related to Gs (Figure 13). The similar increases in Tr (46%) and Gs (55%) imply that the increase in Tr could be due mainly to the increase in Gs. Mott and Parkhurst [40] reported that stomatal closure is a response to high leaf transpiration. However, the increase in Gs accounted for only 55% of the increase in Pn. High temperature not only significantly alters electron transfer, energy capture and absorption but also decreases plant chlorophyll and photosynthetic proteins [41,42], which control the conversion efficiency of light energy into chemical energy and regulate photosynthetic electron transfer and plant health [7]. Therefore, the decrease in Gs caused by stomatal closure on DHW days is the main reason for the decrease in Tr, and both the decrease in Gs and the low efficiency of light energy conversion caused by low plant chlorophyll and photosynthetic protein contents are the main reasons for the low photosynthesis rate under the DHW climate. Spraying water significantly decreases the temperature [15,18], which helps wheat maintain relatively high levels of chlorophyll and photosynthetic proteins in its leaves, enhances the light energy transfer efficiency and ultimately results in a relatively high photosynthesis rate [7,43], as shown in Figure 7 and Figure 11a.
The dry–hot–windy climate mostly occurs from the middle of May to the middle of June in the NCP [6,44]. During this period, winter wheat grows from the middle grain-filling stage to harvest [18,24]. Tang [9] investigated the grain-filling process for 12 winter wheat varieties at the same experimental station and reported that the grain-filling process generally starts from the beginning of May, and the grain-filling rate reaches the maximum value approximately 12–14 days later (approximately 15 May) and then gradually decreases until the harvest day (approximately 10 June). During the last 15, 10 and 5 days of the total approximately 40 days of the grain-filling process, corresponding to the dates of 25 May, 31 May and 5 June, the grain-filling rates were 50%, 25% and 10% of the maximum rate, respectively, and the dry grain masses were 85%, 93% and 98% of the maximum value, respectively, at harvest. These results indicate that improving the microclimate in DHW climates by spraying during the last 15 days of the grain-filling process could increase the grain mass by up to 15%. When water is sprayed 5 days before harvest, it can improve the grain mass only by up to 2%. This is the reason why we did not perform spraying in 2019, when the DHW climate occurred just a few days before harvest. In 2022, the first spraying was carried out on 28 May, and the following sprayings were carried out on 31 May and 3 June and 5 June. The spraying events significantly improved the photosynthesis rate (Figure 7), which ultimately increased the dry grain mass by approximately 5% (Figure 12) and wheat yield by ~1% (Table 3). Compared to the significant increase in grain mass (5%) by spraying, the increase in grain yield (1%) is smaller and insignificant (p > 0.05) (Table 3), which could be due mainly to the variation in sampling at harvest and the sampling method. More sampling and representative sample collection can reduce the measurement error and then reflect the actual experimental conditions. The higher values of grain mass and mean grain yield at harvest show that spraying water has the potential to mitigate disaster caused by a DHW climate and ultimately improve the wheat grain yield. Similarly, Cai et al. [18] reported that spraying 2.5–5.0 mm water could increase grain mass by 2.8–4.3% and wheat yield by 3.3–5.8% in the NCP under a DHW climate using a central pivot sprinkler irrigation system. Considering the grain-filling process, spraying water efficiently improved wheat photosynthesis characteristics and the grain-filling process when the DHW climate occurred 10–15 days before harvest and had a slight effect on grain yield when the DHW climate occurred approximately 0–5 days before harvest.

4.3. Spraying Time and Amount of Water on DHW Days

For dry–hot–windy days, the highest temperature and lowest humidity generally occur during the period from 13:00 to 16:00 (Figure 3, Figure 4 and Figure 5). Since the canopy temperature is directly influenced by the air temperature and humidity, the highest temperature could cause the highest canopy temperature, which in turn causes the most severe damage to leaves and plants. Therefore, the key role of spraying water is to mitigate the peak temperature and the lowest humidity, as well as the canopy temperature. The results of this study reveal that the effects of spraying water on the air temperature, humidity and canopy temperature lasted approximately 90 min, including 20–30 min of spraying and approximately 60 min after spraying. The spraying started at approximately 13:00–14:00 just before the temperature peak. With one spraying event, the low-temperature conditions lasted for approximately one hour from 14:30 to 15:30 (Figure 4 and Figure 5). In cases where the air temperature is still high, another spray can be applied. In this case, the effects of spraying on temperature could last until approximately 17:00 (Figure 5), after which the natural decrease in air temperature would not impose heat stress on the canopy temperature or plant activities. The experiments on 3 June and 5 June in this study revealed that two spray events could reduce the air and canopy temperatures by mean values of 2.5–2.7 °C and 2.0–4.0 °C, respectively, from 13:00–17:00. After 17:00, the air temperature decreased to approximately 35.5 °C, and the canopy temperature also decreased to 30–33 °C, which are close to the upper limit of the optimal temperature range of approximately 28–30 °C [36,37].
Another important issue is how much water should be applied during each spraying event. In previous studies, 2.5 and 5.0 mm water depths were applied by Cai et al. [18], and 1.0–1.5 mm depths were applied by Liu and Kang [24]. Both experiments revealed that the effects of spraying on the period of air temperature changes were approximately 60 min, and a greater irrigation depth did not result in a longer influencing time. However, higher water application could greatly increase the humidity inside the canopy, which could increase the risk of wheat disease [45]. Furthermore, higher water application means higher soil water content, and wheat plant lodging is subject to higher soil water content under windy conditions at the later growth stage [46]. Liu et al. [26] reported that the mean water interception of a wheat canopy (LAI of approximately 4.0~5.0) is 0.9 mm, and stem flow and throughfall water account for 30% and 60% of the total sprinkler water, respectively. Research has shown that the amount of canopy water intercepted by winter wheat is between 0.6 and 1.0 mm [25,47]. Given that the full canopy is wetted, approximately 60% of the water is throughfall water, and stem flow is neglected because of the short spraying time under a dry–hot–windy climate; the water balance in the wheat plant field can be calculated as I = W C + W T , where I, WC and WT are the total spray water, canopy interception water and throughfall water, respectively. Given that WC is 0.8–1.0 mm and W T = 0.6 I , the amount of the sprayed water is 2.0–2.5 mm. This theoretical spraying water amount is close to those used in this study (2.0 mm) and by Cai et al. [18] (2.5 mm) but approximately 0.5–1.0 mm greater than the amount used by [24]. Considering the much higher maximum daily air temperature (38–40 °C) in this study than that (32–34 °C) reported by Liu and Kang [19], spraying a water depth of 2.0–2.5 mm each time is recommended for mitigating the extremely high temperature and low humidity in the DHW climate conditions of the winter wheat field in the NCP.

5. Conclusions

A two-season field experiment was carried out to investigate the effects of 2 mm water spraying on the field microclimate, canopy temperature, photosynthetic traits, grain-filling process and grain yield of winter wheat on the NCP under dry–hot–windy climate conditions. The main results of this study include the following:
(1)
Spraying water during dry–hot–windy climate conditions could significantly improve field microclimate by decreasing air temperature and increasing humidity during spraying period and approximately 60 min after spraying.
(2)
The improved field microclimate enhanced the photosynthesis and transpiration rates and the stomatal conductivity, which consequently increase the grain-filling rate and finally the wheat yield.
(3)
One spraying event could be enough to mitigate the high temperature and low humidity on most dry–hot–windy days, and two spraying events are recommended when the intensity of the dry–hot–windy climate is strong. An irrigation water depth of 2–2.5 mm each time is sufficient to wet the wheat canopy with an LAI of 4–5.

Author Contributions

Conception and design of experiments, H.L. and R.L.; performance of experiments and analysis of data, Y.R., H.L. and X.Z.; writing—review and editing, H.L. and Y.R. All authors have read and agreed to the published version of the manuscript.

Funding

This research was funded by the National Nature Science Foundation of China (no. 51939005) and the 111 Project (B18006).

Data Availability Statement

Dataset available on request from the authors.

Acknowledgments

We greatly appreciated Zhuangzhuang Gao, Lun li and Xuyu Feng during the field measurements and the field support by Wenjie Zhang, the director of the experimental station.

Conflicts of Interest

The funders had no role in the design of the study; in the collection, analyses, or interpretation of data; in the writing of the manuscript; or in the decision to publish the results.

References

  1. National Bureau of Statistics of China. National Statistics Yearbook; China Statistics Press: Beijing, China, 2023.
  2. Rezaei, E.E.; Webber, H.; Asseng, S.; Boote, K.; Durand, J.L.; Ewert, F.; Martre, P.; MacCarthy, D.S. Climate change impacts on crop yields. Nat. Rev. Earth Environ. 2023, 4, 831–846. [Google Scholar] [CrossRef]
  3. Ishaque, W.; Osman, R.; Hafiza, B.S.; Malghani, S.; Zhao, B.; Xu, M.; Ata-Ul-Karim, S.T. Quantifying the impacts of climate change on wheat phenology, yield, and evapotranspiration under irrigated and rainfed conditions. Agric. Water Manag. 2023, 275, 108017. [Google Scholar] [CrossRef]
  4. Bai, H.; Xiao, D.; Tang, J.; Liu, D.L. Evaluation of wheat yield in North China Plain under extreme climate by coupling crop model with machine learning. Comput. Electron. Agric. 2024, 217, 108651. [Google Scholar] [CrossRef]
  5. QX/T 82-2019; Disaster Grade of Dry-Hot Wind for Wheat. Chinese Academy of Meteorological Sciences: Beijing, China, 2019.
  6. Feng, Y.; Sun, F.; Wang, H.; Liu, F. Recent warm-season dryness/wetness dominated by hot-dry wind in Northern China. J. Hydrol. 2023, 627, 130436. [Google Scholar] [CrossRef]
  7. Zahra, N.; Hafeez, M.B.; Ghaffar, A.; Kausar, A.; Zeidi, M.A.; Siddique, K.H.M.; Farooq, M. Plant photosynthesis under heat stress: Effects and management. Environ. Exp. Bot. 2023, 206, 105178. [Google Scholar] [CrossRef]
  8. Zhao, H.; Zhang, L.; Kirkham, M.B.; Welch, S.M.; Nielsen-Gammon, J.W.; Bai, G.; Luo, J.; Andresen, D.A.; Rice, C.W.; Wan, N.; et al. U.S. winter wheat yield loss attributed to compound hot-dry-windy events. Nat. Commun. 2022, 13, 7233. [Google Scholar] [CrossRef]
  9. Tang, X. Mechanism of Sprinkler Irrigation Scheduling and Wheat Varieties on Crop Evapotranspiration and Yield and Their Optimal Combination to Cope with Climate Change. Ph.D. Thesis, Beijing Normal University, Beijing, China, 2023. [Google Scholar]
  10. Yang, F.-H.; Bryla, D.R.; Peters, R.T. An Energy balance model for predicting berry temperature and scheduling sprinklers for cooling in northern highbush blueberry. HortScience 2021, 56, 447–453. [Google Scholar] [CrossRef]
  11. Wang, Y.; Li, M.; Hui, X.; Meng, Y.; Yan, H. Alfalfa canopy water interception under low-pressure sprinklers. Agric. Water Manag. 2020, 230, 105919. [Google Scholar] [CrossRef]
  12. Yang, F.-H.; Bryla, D.R.; Orr, S.T.; Strik, B.C.; Zhao, Y. Thermal cooling with sprinklers or microsprinklers reduces heat damage and improves fruit quality in northern highbush blueberry. HortScience 2020, 55, 1365–1371. [Google Scholar] [CrossRef]
  13. Uddin, M.J.; Murphy, S.R. Evaporation losses and evapotranspiration dynamics in overhead sprinkler irrigation. J. Irrig. Drain. Eng. 2020, 146, 04020023. [Google Scholar] [CrossRef]
  14. Baifus Manke, E.; Nörenberg, B.G.; Faria, L.C.; Tarjuelo, J.M.; Colombo, A.; Chagas Neta, M.C.C.; Parfitt, J.M.B. Wind drift and evaporation losses of a mechanical lateral-move irrigation system: Oscillating plate versus fixed spray plate sprinklers. Agric. Water Manag. 2019, 225, 105759. [Google Scholar] [CrossRef]
  15. Tang, X.; Liu, H.; Yang, L.; Li, L.; Chang, J. Energy balance, microclimate, and crop evapotranspiration of winter wheat (Triticum aestivum L.) under sprinkler irrigation. Agriculture 2022, 12, 953. [Google Scholar] [CrossRef]
  16. Urrego-Pereira, Y.; Cavero, J.; Medina, E.T.; Martínez-Cob, A. Role of transpiration reduction during center-pivot sprinkler irrigation in application efficiency. J. Irrig. Drain. Eng. 2013, 139, 221–232. [Google Scholar] [CrossRef]
  17. Urrego-Pereira, Y.F.; Martínez-Cob, A.; Fernández, V.; Cavero, J. Daytime sprinkler irrigation effects on net photosynthesis of maize and alfalfa. Agron. J. 2013, 105, 1515–1528. [Google Scholar] [CrossRef]
  18. Cai, D.; Shoukat, M.R.; Zheng, Y.; Tan, H.; Meng, F.; Yan, H. Optimizing center pivot irrigation to regulate field microclimate and wheat physiology under dry-hot wind conditions in the North China Plain. Water 2022, 14, 708. [Google Scholar] [CrossRef]
  19. Liu, H.; Kang, Y. Effect of sprinkler irrigation on microclimate in the winter wheat field in the North China Plain. Agric. Water Manag. 2006, 84, 3–19. [Google Scholar] [CrossRef]
  20. Liu, H.; Kang, Y.; Yao, S.M.; Sun, Z.Q.; Liu, S.P.; Wang, Q.G. Field evaluation on water productivity of winter wheat under sprinkler or surface irrigation in the north china plain. Irrig. Drain. 2013, 62, 37–49. [Google Scholar] [CrossRef]
  21. Zhao, W.; Li, J.; Li, Y. Modeling sprinkler efficiency with consideration of microclimate modification effects. Agric. For. Meteorol. 2012, 161, 116–122. [Google Scholar] [CrossRef]
  22. Martínez-Cob, A.; Playán, E.; Zapata, N.; Cavero, J.; Medina, E.T.; Puig, M. Contribution of evapotranspiration reduction during sprinkler irrigation to application efficiency. J. Irrig. Drain. Eng. 2008, 134, 745–756. [Google Scholar] [CrossRef]
  23. Liu, Z.; Jiao, X.; Zhu, C.; Katul, G.G.; Ma, J.; Guo, W. Micro-climatic and crop responses to micro-sprinkler irrigation. Agric. Water Manag. 2021, 243, 106498. [Google Scholar] [CrossRef]
  24. Liu, H.; Kang, Y. Regulating field microclimate using sprinkler misting under hot-dry windy conditions. Biosyst. Eng. 2006, 95, 349–358. [Google Scholar] [CrossRef]
  25. Wang, Q.; Kang, Y.; Liu, H.; Liu, S. Method for measurement of canopy interception under sprinkler irrigation. J. Irrig. Drain. Eng. 2006, 132, 185–187. [Google Scholar] [CrossRef]
  26. Liu, H.; Chang, J.; Tang, X.; Zhang, J. In situ measurement of stemflow, throughfall and canopy interception of sprinkler irrigation water in a wheat field. Agriculture 2022, 12, 1265. [Google Scholar] [CrossRef]
  27. Ministry of Construction of the People’s Republic. Technical Code for Sprinkler Irrigation; Ministry of Construction of the People’s Republic: Beijing, China, 2007. [Google Scholar]
  28. Song, X.; Zhou, G.; He, Q.; Zhou, H. Stomatal limitations to photosynthesis and their critical Water conditions in different growth stages of maize under water stress. Agric. Water Manag. 2020, 241, 106330. [Google Scholar] [CrossRef]
  29. Aspinwall, M.J.; Faciane, M.; Harris, K.; O’Toole, M.; Neece, A.; Jerome, V.; Colón, M.; Chieppa, J.; Feller, I.C. Salinity has little effect on photosynthetic and respiratory responses to seasonal temperature changes in black mangrove (Avicennia germinans) seedlings. Tree Physiol. 2021, 41, 103–118. [Google Scholar] [CrossRef]
  30. Pei, D.; Sun, Z.; Chen, S.; Zhang, X.; Chen, S.; Wang, Z. Effects of water stress on physiological and agronomic features of winter wheat. Trans. Chin. Soc. Agric. Eng. 2006, 22, 68–72. [Google Scholar]
  31. Zhang, X.; Pei, D.; Hu, C. Index system for irrigation scheduling of winter wheater and maize in the piedmont of Mountain Taihang. Trans. Chin. Soc. Agric. Eng. 2002, 18, 36–41. [Google Scholar]
  32. Schauberger, B.; Archontoulis, S.; Arneth, A.; Balkovic, J.; Ciais, P.; Deryng, D.; Elliott, J.; Folberth, C.; Khabarov, N.; Müller, C.; et al. Consistent negative response of US crops to high temperatures in observations and crop models. Nat. Commun. 2017, 8, 13931–13939. [Google Scholar] [CrossRef]
  33. Cavero, J.; Medina, E.T.; Montoya, F. Sprinkler irrigation frequency affects maize yield depending on irrigation time. Agron. J. 2018, 110, 1862–1873. [Google Scholar] [CrossRef]
  34. Tang, X.; Liu, H.; Zhang, W. Physiological characteristics, crop growth and grain yield of twelve wheat varieties cultivated in the North China Plain. Agronomy 2023, 13, 3041. [Google Scholar] [CrossRef]
  35. Verma, L.; Singh, A.K.; Singh, S.; Tiwari, D.; Zaidi, S.T.; Yadav, R.K.; Mishra, S.R.; Singh, A.K. Temperature stress its impact on yield of various wheat varieties at different growth stages. Natl. Acad. Sci. Lett. 2024, 47, 219–225. [Google Scholar] [CrossRef]
  36. Khan, A.; Ahmad, M.; Ahmed, M.; Iftikhar Hussain, M. Rising atmospheric temperature impact on wheat and thermotolerance strategies. Plants 2021, 10, 43. [Google Scholar] [CrossRef]
  37. Shah, N.H.; Paulsen, G.M. Interaction of drought and high temperature on photosynthesis and grain-filling of wheat. Plant Soil 2003, 257, 219–226. [Google Scholar] [CrossRef]
  38. Thapa, S.; Jessup, K.E.; Pradhan, G.P.; Rudd, J.C.; Liu, S.; Mahan, J.R.; Devkota, R.N.; Baker, J.A.; Xue, Q. Canopy temperature depression at grain filling correlates to winter wheat yield in the U.S. Southern High Plains. Field Crops Res. 2018, 217, 11–19. [Google Scholar] [CrossRef]
  39. Correia, P.M.P.; Cairo Westergaard, J.; da Silva, A.B.; Roitsch, T.; Carmo-Silva, E.; da Silva, J.M. High-throughput phenotyping of physiological traits for wheat resilience to high temperature and drought stress. J. Exp. Bot. 2022, 73, 5235–5251. [Google Scholar] [CrossRef]
  40. Mott, K.A.; Parkhurst, D.F. Stomatal responses to humidity in air and helox. Plant Cell Environ. 1991, 14, 509–515. [Google Scholar] [CrossRef]
  41. Mustafa, T.; Sattar, A.; Sher, A.; Ul-Allah, S.; Ijaz, M.; Irfan, M.; Butt, M.; Cheema, M. Exogenous application of silicon improves the performance of wheat under terminal heat stress by triggering physio-biochemical mechanisms. Sci. Rep. 2021, 11, 23170. [Google Scholar] [CrossRef]
  42. Ahammed, G.J.; Xu, W.; Liu, A.; Chen, S. COMT1 silencing aggravates heat stress-induced reduction in photosynthesis by decreasing chlorophyll content, photosystem II activity, and electron transport efficiency in tomato. Front. Plant Sci. 2018, 9, 998. [Google Scholar] [CrossRef]
  43. Ma, M.-Y.; Liu, Y.; Zhang, Y.-W.; Qin, W.-L.; Wang, Z.-M.; Zhang, Y.-H.; Lu, C.-M.; Lu, Q.-T. In situ measurements of winter wheat diurnal changes in photosynthesis and environmental factors reveal new insight into photosynthesis improvement by super-high-yield cultivation. J. Integr. Agric. 2021, 20, 527–539. [Google Scholar] [CrossRef]
  44. Wang, C.; Zhang, Y.; Zhang, J. Risk assessment of main meteorological disasters of winter wheat in North China. Trans. Chin. Soc. Agric. Eng. 2016, 32, 203–213. [Google Scholar]
  45. Mumtaz, R.; Maqsood, M.H.; Haq, I.u.; Shafi, U.; Mahmood, Z.; Mumtaz, M. Integrated digital image processing techniques and deep learning approaches for wheat stripe rust disease detection and grading. Decis. Anal. J. 2023, 8, 100305. [Google Scholar] [CrossRef]
  46. Baker, C.J.; Berry, P.M.; Spink, J.H.; Sylvester-Bradley, R.; Griffin, J.M.; Scott, R.K.; Clare, R.W. A method for the assessment of the risk of wheat lodging. J. Theor. Biol. 1998, 194, 587–603. [Google Scholar] [CrossRef]
  47. Kang, Y.; Wang, Q.-G.; Liu, H.-J. Winter wheat canopy interception and its influence factors under sprinkler irrigation. Agric. Water Manag. 2005, 74, 189–199. [Google Scholar] [CrossRef]
Figure 1. The experimental field (a), aerial view of the layout of temperature and humidity sets (b) and the thermal infrared image (c). In subfigure (a), field with the light blue background represents theoretical spraying area (SP), and the white area represents not sprinkler irrigated and taken as control (CK). In the thermal infrared image (subfigure (c)), the value (28.8) is the mean canopy temperature in the white box.
Agronomy 14 01962 g001
Figure 2. Days with a dry–hot–windy climate from 20 to 31 May (Period 1) and from 20 May to 10 June (Period 2) in the winter season from 1981 to 2018. During Period 1, wheat was in the middle and late grain-filling stages and was highly sensitive to the DHW climate. During Period 2, the DHW climate occurred frequently.
Agronomy 14 01962 g002
Figure 3. Air temperature, humidity and wind speed at 14:00 from 20 May to 10 June in the 2019 (a) and 2022 (b) seasons.
Agronomy 14 01962 g003
Figure 4. Spatial and temporal distributions of air temperature at approximately 10 cm above the wheat canopy in the experimental field from 8:00 to 18:00 on 28 May 2022. The water was sprayed from 14:00 to 14:25. Subfigures (a,c) represent the air temperature and humidity changes during the whole day, respectively, and (b,d) indicate the significant changes in air temperature and humidity during and after spraying, respectively. The data in the horizontal direction indicate the distance from the west edge of the experimental field. SP and CK indicate the spraying influencing area and no water area, respectively. The sprinkler pipe was deployed at a distance of approximately 15 m from the west edge.
Agronomy 14 01962 g004
Figure 5. Daytime curves of the air temperature and relative humidity measured at approximately 10 cm above the wheat canopy in the fields with (SP) and without (CK) spraying water practices on 31 May (a) and 5 June (b) in 2022. One water spraying event occurred on 31 May, and two events occurred on 5 June. The light blue bar in the figure represents the water spraying period.
Agronomy 14 01962 g005
Figure 6. Measured canopy temperatures of winter wheat in the field with (SP) and without (CK) water spraying on 31 May with one spraying event (a) and on 5 June with two spraying events (b) in the 2022 season. The light blue bar in the figure represents the water spraying period.
Agronomy 14 01962 g006
Figure 7. Daily curves of the photosynthesis rates of flag leaves of winter wheat with (SP) and without (CK) spraying water on four dry–hot–windy days: 28 May (a), 31 May (b), 3 June (c) and 5 June (d) in the 2022 season.
Agronomy 14 01962 g007
Figure 8. Daily curves of transpiration rates of flag leaves of winter wheat with (SP) and without (CK) spraying water on the four featured dry–hot–windy days: 28 May (a), 31 May (b), 3 June (c) and 5 June (d) in the 2022 season.
Agronomy 14 01962 g008
Figure 9. Daily curves of stomatal conductance of flag leaves of winter wheat with (SP) and without (CK) spraying water on four dry–hot–windy days: 28 May (a), 31 May (b), 3 June (c) and 5 June (d) in the 2022 season.
Agronomy 14 01962 g009
Figure 10. Daily curves of stomatal limitation values for photosynthesis of flag leaves of winter wheat with (SP) and without (CK) spraying water on the four featured dry–hot–windy days: 28 May (a), 31 May (b), 3 June (c) and 5 June (d) in the 2022 season.
Agronomy 14 01962 g010
Figure 11. Mean increases in the photosynthesis rate (a), transpiration rate (b), stomatal conductivity (c) and stomatal limitation values for photosynthesis (d) within one hour after one spraying event (28 May and 31 May) and three hours after two spray events (2 June and 5 June) on the four dry–hot–windy days in the 2022 season.
Agronomy 14 01962 g011
Figure 12. Grain-filling process of winter wheat in fields with (SP) and without (CK) spraying practices from 30 May to 11 June at harvest in 2022. Subfig. (a) represents the change process of grain mass amount with time, and (b) represents the increasing rate of grain mass with time. The different lower letters below and above the corresponding points on subfig. (a) mean their difference is significant and the same letters mean insignificant at 0.05 level.
Agronomy 14 01962 g012
Figure 13. Relationships between photosynthetic rate Pn (a), transpiration rate Tr (b) and stomatal conductivity (Gs). The data shown in the figure are from measurements taken on 2 June 2022.
Agronomy 14 01962 g013
Table 1. Soil physical characteristics in the 0–100 cm soil layer.
Depth (cm)Soil Particle Distribution (%)Soil TextureBulk
Density
Field
Capacity
Saturated Soil
Water Content
Clay
(<0.002 mm)
Silt
(0.002–0.02 mm)
Sand
(0.02–2 mm)
g/cm3cm3/cm3cm3/cm3
0–2012.566.820.7Silt loam1.400.340.41
20–4012.168.119.81.430.360.41
40–6014.370.615.11.490.390.42
60–8016.964.618.51.480.400.44
80–10018.360.820.91.540.420.47
Table 2. Air temperature, relative humidity and wind speed at 14:00 on the five typical dry–hot–windy climate (DHW) days.
Climate IndicatorsSeasons20192022
DHW Day2 June28 May31 May3 June5 June
Air temperature°C36.8133.4236.4837.6436.50
Relative humidity%25.5530.7818.5923.3411.58
Wind speedm s−13.454.066.544.472.34
Table 3. Grain yields of winter wheat and coefficients of variation (CV) in fields with and without spraying water practices in the 2019 and 2022 seasons.
SeasonsSprayingNo Spraying
Wheat Yield (kg ha−1)CVWheat Yield (kg ha−1)CV
2018–20198.63a0.0198.54a0.016
2021–20229.37a0.0189.29a0.025
Disclaimer/Publisher’s Note: The statements, opinions and data contained in all publications are solely those of the individual author(s) and contributor(s) and not of MDPI and/or the editor(s). MDPI and/or the editor(s) disclaim responsibility for any injury to people or property resulting from any ideas, methods, instructions or products referred to in the content.

