Abstract
The interaction between the amount and frequencies of nitrogen application has always been a hot issue in improving crop yield and reducing environmental pollution. Photosynthesis and non-structural carbohydrates (NSCs) play an important role in the formation of rice yield. However, the research on photosynthetic characteristics and NSCs under nitrogen fertilizer management on rice yield is still insufficient. This work was a two-year field trial in China’s Hunan Province in 2020–2021. To analyze the photosynthetic characteristics and NSCs of the hybrid rice “Zhu Liangyou 819” (ZLY819), the experiment was set up with N application frequencies, specifically P1 (basal-tiller fertilizer at a ratio of 5:5), P2 (basal-tiller-spike fertilizer at a ratio of 4:3:3), and P3 (basal-tiller-spike-grain fertilizer at a ratio of 4:3:2:1). Additionally, three distinct amounts of N applications were utilized: N1 (90 kg ha−1), N2 (150 kg ha−1), and N3 (210 kg ha−1). The findings indicated that under the same N application amount, N2 increased the effective spike by 9.32–17.80% and the number of grains per spike by 12.21–13.28% compared with N1. Under the same N application frequency, P3 had the highest effective number of spikes and number of grains per spike, which were 320.83 × 10⁴ ha−1 and 113.99–119.81, respectively. Under the same N application amount, the SPAD and photosynthetic rate (Pn) of N2 at the heading stage were increased by 5.61–5.68% and 11.73–13.81%, respectively, compared with that of N1; and at the maturity stage, the SPAD of N2 was increased by 14.79–17.21%. At the same N application frequency, SPAD and Pn were 5.40–6.78% and 4.70–12.85% higher in P3 compared to P1, respectively, at the heading stage. At maturity, SPAD showed 14.59–15.64% higher values in P3 compared to P1. The photosynthetically active radiations (PAR) and radiation use efficiency (RUE) of ZLY819 obtained the highest values under N2 or N3 as the differences between these both were nonsignificant. PAR and RUE tended to increase with the increase in the application frequency. NSC accumulation, output, and contribution rate to grains all exhibited a pattern of initial increase followed by a subsequent decline in response to escalating nitrogen application, i.e., it was highest under N2 treatment. A statistically significant positive correlation was observed between rice yield and effective number of spikes, number of grains per spike, SPAD, Pn RUE, output of NSCs, and contribution rate to grains. Appropriate amount and frequency of N application (P3N2) can significantly improve photosynthetic characteristics and NSCs of rice, thus increasing rice yield.
1. Introduction
Rice constitutes one of the most significant food crops for humanity, with nearly half of the global population relying on it as a staple in their diet [1,2]. Due to the growing population, it is still necessary to continually enhance rice production in order to satisfy the food requirements of the global population. Nitrogen fertilizer has the potential to enhance rice growth development, and yield, and improve quality. The appropriate amount of nitrogen application can ensure a high yield and stable rice production. However, irrational and blind use of nitrogen still exists in rice production in China. Too little nitrogen fertilizer application leads to few rice tillers, dwarf plants, yellowing leaves, slow development of young spikes, and yield decline. At the same time, a higher dose of N fertilizer application causes too many rice tillers, an increase in ineffective tillers, and a decrease in rice seed setting rate [3,4], which not only restricts higher rice yield but also causes environmental pollution, soil quality decline, and harms human health [5,6]. Rational application of nitrogen fertilizer can enhance the efficiency of nitrogen utilization and decrease production costs, protect the ecological environment, and promote the sustainable development of agriculture [7]. China applies about 180 kg ha−1 of pure N during rice cultivation, which is 75% higher compared to the world average N fertilizer application for rice [8]. To improve the rice N fertilizer utilization rate, prior investigations have been undertaken regarding N fertilizer application rate, N fertilizer type, N fertilizer application period, N fertilizer application ratio, N fertilizer application method, and transplanting specifications [9,10,11,12].
Appropriate nitrogen application can enhance the Pn of rice, whereas excessive nitrogen fertilizer can reduce photosynthetic capacity. The leaf, the primary organ for photosynthesis in plants, is significantly influenced by nitrogen fertilizer. Non-structural carbohydrates (NSC) in rice stem sheaths are mainly starch and soluble sugars. Soluble sugars provide the plant “sink” with substances and energy for growth and development; in controlling photoassimilate partitioning, their content is an index of the coordination of the plant’s source sink [13]. The substances stored in the stem sheaths of rice after heading act as a temporary “source” to supply assimilates to grain filling [14]. Reducing the nitrogen applied to the basal tiller fertilizer and increasing the rate of nitrogen application at a later stage promoted pre-flowering and post-flowering stem sheath NSC translocation [15]. Excessive N application led to extended growth and delayed maturity, reducing leaf photosynthetic rate, NSC accumulation in stem sheath, and translocation rate [16]. Too little N application increased SPS activity in rice leaves and facilitated the translocation of NSCs from the stem sheath to the grain before and after flowering [17]. Several studies have demonstrated that the proper application of nitrogen can promote the development of a high leaf area in the canopy structure of the rice population [18,19].
Zhao et al. [20] found that the yield and grain filling rate were lower in the treatment with excessive N fertilizer compared to the treatment with appropriate N application. Although a large number of studies on the frequency and amount of N application have been reported, there is still a long way to go to continuously improve rice yield per unit area with the ongoing development of China’s social economy and people’s demand for food [21,22,23]. Increasing the yield per unit area of rice while improving the utilization rate of N is an urgent problem in the field of rice production [24]. Most studies on the effect of NSCs in rice have focused on the amount of nitrogen application, while there are fewer studies on the simultaneous effects of the frequency and amount of N application in rice.
Based on previous studies, we hypothesized that increasing the frequency and amount of N application affects the photosynthetic characteristics and the accumulation and transport of NSCs in rice, which in turn affects the formation of rice yields. In this study, the experiment was conducted in 2020–2021 using N application frequencies and the amount of N application. This study aimed to (1) elucidate the effects of N fertilizer transport on photosynthetic characteristics and NSCs of rice and their potential mechanisms; (2) analyze the effects of N fertilizer transport on yield formation of rice; and (3) seek the optimal method of N application to provide theoretical foundations and practical bases for the high-yield and high-efficiency production of rice.
2. Materials and Methods
2.1. Field Management
The field trial was conducted in 2020–2021 at Zhongtang Village, Bijia Mountain, Heshan District, Yiyang City, China (28°30′15″ N, 112°20′18″ E) in a randomized group design, with early rice hybrid ZLY819. The region has a subtropical monsoon climate with an average annual temperature of 18.5 °C and an average yearly rainfall of 1656.6 mm. The experiment was set up with N application frequencies, specifically P1 (basal-tiller fertilizer at a ratio of 5:5), P2 (basal-tiller-spike fertilizer at a ratio of 4:3:3), and P3 (basal-tiller-spike-grain fertilizer at a ratio of 4:3:2:1). Additionally, three distinct amounts of N applications were utilized: N1 (90 kg ha−1), N2 (150 kg ha−1), and N3 (210 kg ha−1). There were 9 treatments that combined different amounts and frequencies of nitrogen application. The plot area measured 20 m2, with 3 replications of each treatment, resulting in a total of 27 plots. The row spacing of rice was length 5 m, width 4 m, and row spacing of 16.7 cm × 20 cm. Equal amounts of phosphorus and potassium fertilizer were applied to each treatment (P2O5 75 kg ha−1, K2O 180 kg ha−1). The base fertilizer was administered one day prior to the transplanting process. Subsequently, the tiller fertilizer was applied 7 days post-transplantation. The spike fertilizer was applied when the plants exhibited 3.5 leaves, and the grain fertilizer was applied at the initiation of the spike development. Urea, which contains 46% nitrogen, was utilized as the nitrogen fertilizer, while calcium superphosphate, comprising 12% P2O5, served as the phosphorus fertilizer. Potassium chloride, containing 60% K2O, was employed for potassium fertilization. The experimental site was characterized as paddy soil with a pH of 5.20. The soil analysis revealed an organic matter content of 43.64 g kg−1, total nitrogen at 2.63 g kg−1, total potassium at 19.12 g kg−1, total phosphorus at 0.60 g kg−1, available nitrogen at 145.98 mg kg−1, available phosphorus at 37.44 mg kg−1, and available potassium at 138.11 mg kg−1. All other management practices adhered to standard field production protocols. Each plot was individually drained and irrigated, while the ridges were enveloped in plastic film to mitigate any potential leakage of string fertilizer. Additionally, the field was meticulously managed, with pests and diseases being promptly controlled and prevented. For more information on the specific fertilizer application method employed, please refer to Table 1.

Table 1.
Frequency and amount of N fertilizer application for ZLY819.
2.2. Experimental Sampling and Measurements
2.2.1. Determination of Starch
The method of determination is based on that of Xu et al. [25] with minor modifications. An accurately weighed 0.5 g of dried and crushed samples obtained at the heading, filling, and maturity stages were placed in a mortar and ground by adding 10 mL of 80% ethanol. The homogenate sample was loaded into a centrifuge tube and subjected to centrifuging at 6000 r/min for a duration of 10 min to remove the supernatant. Subsequently, 10 mL 80% ethanol was added to the centrifuge tube to wash it once and centrifuged again to remove the supernatant. Then 5 mL of 80% Ca(NO3)2 was added to the centrifuge tube and the precipitate was dissolved by stirring in a boiling water bath for 10 min, followed by centrifuging at 6000 r/min for 10 min. The supernatant was collected and transferred to a 25 mL volumetric flask, and the residue was extracted with 80% Ca(NO3)2 repeated three times. Take 1 mL of the supernatant into a glass test tube, add 0.1 mL of 0.01 mol L−1 I2-KI solution and 1 mL of distilled water, shake well, and then assess the absorbance at 600 nm. The starch content of the sample was calculated according to the standard curve of the standard starch in mg g−1 as FW.
2.2.2. Determination of Soluble Sugars
The samples were dried and crushed at the heading, filling, and maturity stages, then a weight of 0.25 g was placed in a centrifuge tube, to which 5 mL of distilled water was added. The mixture was then homogenized and subjected to boiling in a water bath for 10 min. After the samples were subjected to a cooling process, the samples were centrifuged at 8000 rpm for 10 mins at ambient temperature, and the supernatant was taken and placed in a refrigerator at 4 °C for testing. The reagents were added according to the steps described in the assay kit (BC0030, Solarbio, Beijing, China). The mixture was mixed well, placed in a water-maintained bath at 100 °C for 10 min, cooled to room temperature, and then the absorbance measurements for both the blank tube and the assay tube were recorded at 620 nm, respectively, with ΔA = A assay − A blank. A standard curve with glucose.
V1: Volume of sample added (mL), V2: Total volume extracted (mL), W: Weight (g), y: Glucose content from a standard curve (mg g−1).
Soluble sugar (mg g−1 dry weight) = (y × V1) ÷ (W × V1 ÷ V2) = 10 × y ÷ W
2.2.3. Determination of Rice Yield and Dry Matter
Two representative samples were collected from each plot during the heading and maturity stages of the rice. We removed the roots and separated the stems, leaves, and spikes to prepare the samples. Next, we placed them in an oven at 105 °C for 30 min to destroy and blunt the oxidase activity. The samples were subjected to drying at a temperature of 80 °C until a consistent weight was attained, and then we weighed them on an electronic balance to determine their dry weight. The dry weight was measured after drying to a constant weight of 80 °C. The number of grains per spike was determined by hand threshing at maturity. The full and unfilled grains were separated by water selection to ascertain the quantity of grains per panicle and grain-setting rate. The full grains were dried and weighed to ascertain the weight of one thousand grains. Each plot was beaten and harvested for yield measurement, converted at 13.5% moisture content.
2.2.4. Determination of Photosynthetic Characteristics
The Pn of the flag leaf was assessed between 9:00 a.m. and 11:00 a.m. on a sunny day utilizing an LI-6400 portable photosynthesis system analyzer (LI-6400, Li-Cor, Lincoln, NE, USA) at the booting, full heading, and filling stages. During the full heading stage, filling stage, and mature stage, the SPAD values were measured at the upper, middle, and lower 1/3 of each leaf using a chlorophyll meter (SPAD-502 Plus, Konica minolta, Tokyo, Japan). The mean of these measurements was recorded as the SPAD value for each individual leaf.
Canopy PAR transport parameter collection (Tillering, Booting, Heading, Filling, and Maturity stage): Parameter measurements of the distribution of photosynthetically active radiation (PAR) in rice were collected with the SunScan canopy analyzer (Delta, Cambridge, UK) at 11:00–13:00 on a sunny day. The total PAR at the top of the canopy and the effective PAR at the bottom of the canopy (TPAR) of the population were measured, and the interception of photosynthetically active radiation (IPAR) was calculated.
IPAR (μmol·m−2·s−1) = PAR − TPAR.
Radiation use efficiency (RUE) = Total dry mass/sum of intercepts for each period
2.3. Statistical Analysis
WPS Office 2021 was used to organize the data. For the analysis of the data, specifically for ANOVA and graphical representation, Statistics 8.0 and Origin 2022 were employed. The LSD method was applied for multiple comparisons, with the significance level for the F-test or parallel test level established at 0.05. The graph shows each mean’s standard error (SD) as an error bar. Heat maps were plotted using Origin 2022 and principal component analysis (PCA) plots and cluster plots were plotted using SPSS 16.
3. Results
3.1. Effects of N Fertilizer Application Frequency and Amount on Rice Yield and Constituent Elements
The frequency of nitrogen applications had a significant effect on rice yield, panicles, number of grains per spike, and grain-setting rate. The amount of nitrogen application had a significant effect on rice yield, panicles, the number of grains per spike, grain-setting rate, and the 1000-grain weight. There was no significant difference between the effects of N applications and application rate on rice yield, the effective number of spikes, number of grains per spike, fruiting rate, and 1000-grain weight under the interaction. Intercropping of year, N application frequency, and application amount were nonsignificant on rice yield and yield structure (Table 2).
Table 2.
Analysis of variance (ANOVA) for yield and growth traits under N application frequency and amount.
From the yield components in both years, rice effective spike per unit area and the total number of grains per spike exhibited a notable increase in response to higher N application amount under the same N application frequency. Under the same N application frequency, the setting rate exhibited a marked decline as the quantity of nitrogen application increased. The 1000-grain weight exhibited the highest value overall in the N2 treatment, but the difference was nonsignificant. Under the same N application amount, the effective panicles, number of grains per spike, and setting rate all increased with the increase in the frequency of N fertilizer application, and the effect of 1000-grain weight was nonsignificant. Under the same fertilizer application frequency, the effective panicles per unit area showed N1 < N2 < N3, and the number of grains per spike exhibited an initial increase followed by a subsequent decrease with the rise of nitrogen application. ZLY819 had a 17.25–24.39% higher effective panicle per unit area under N3 treatment than N1, respectively; ZLY819 had a 9.32–13.28% higher total number of grains per spike under N2 treatment than N1. The setting rate showed N1 > N2 > N3, while N3 made the setting rate of ZLY819 12.83–14.49% lower than N1 in 2020 and 2021; the 1000-grain weight showed N3 < N1 < N2 in general, but the difference was nonsignificant. Under the same N application amount, the effective panicle, number of grains per spike, and setting rate of rice in different fertilization periods showed that P1 < P2 < P3, in which the effective panicles, number of grains per spike, and grain-setting rate of ZLY819 were 5.74–4.56%, 2.30–2.96% and 2.50–3.21% higher under P3 treatment than P1, respectively. The fertilizer application frequency has a nonsignificant effect on 1000-grain weight (Table 3).
Table 3.
Yield components of ZLY819 under N application frequency and amount treatments.
3.2. The Effect of N Application Frequency and Amount on the SPAD Value of Rice
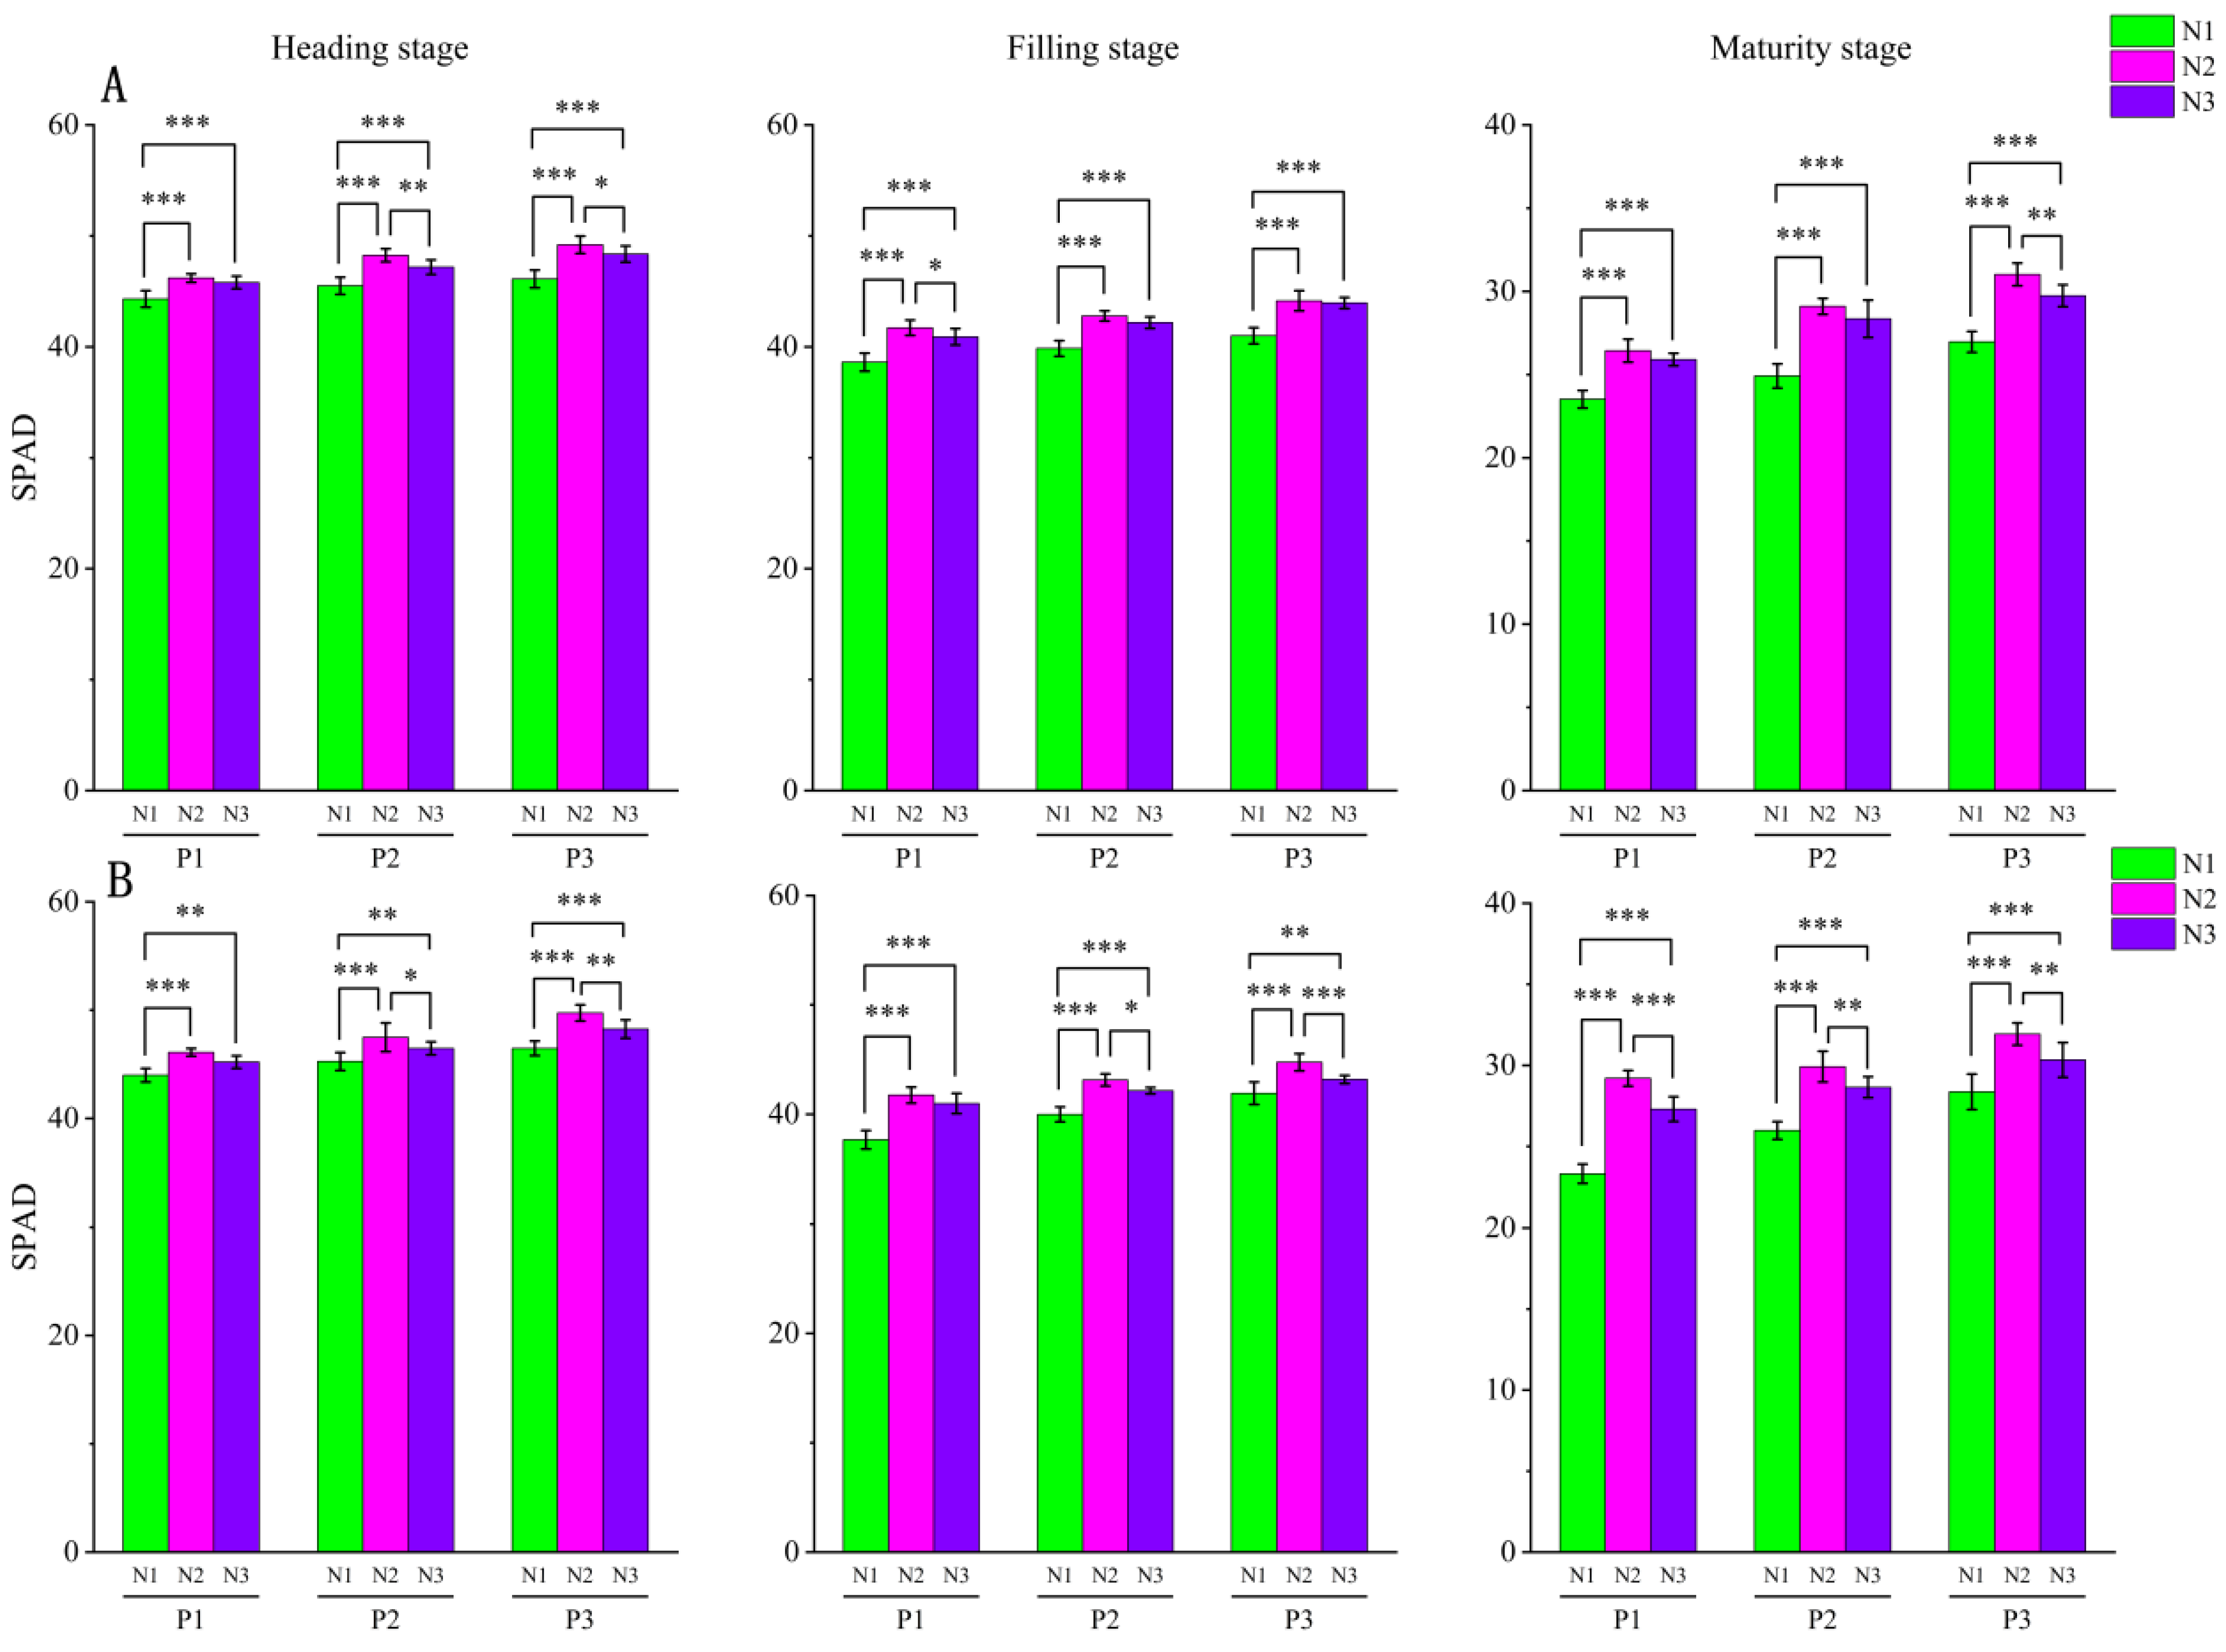
With the advancement of the reproductive period, the SPAD value of rice exhibited a declining trend, with its peak observed during the heading stage (Figure 1). The SPAD values of rice tended to increase followed by a subsequent decrease with the increase of N application, showing that N1 < N3 < N2. Among them, the SPAD values of ZLY819 were 5.61–5.68% higher than N1 under N2 treatment. Under the N application frequency, the SPAD values showed the following trend with the extension of reproductive period P1 < P2 < P3, where the SPAD values of ZLY819 at the heading stage were 5.40–6.78% higher than those of P1 under P3 treatment. The later shift of N fertilizer was beneficial to increase leaf SPAD value. At maturity, the SPAD values of ZLY819 were 6.85% higher in the P3 than in the P2 and 14.59% higher than in the P1 treatment. The SPAD values reached their peak under the P3N2 treatment in the heading, filling, and maturity stages.

Figure 1.
Flag leaf SPAD value of ZLY819 ((A) in 2020 and 2021 (B)) under N fertilization period and amount treatments. *, **, *** significant at p < 0.05, p < 0.01, p < 0.001. The N application amount for N1, N2, and N3 in rice was 90, 150, and 210 kg N ha−1, respectively. P1 was tiller and base (5:5), P2 was base:tiller:panicle fertilizer (4:3:3), and P3 was base:tiller:panicle:granular fertilizer (4:3:2:1).
3.3. The Effect of Nitrogen Fertilizer Application Frequency and Amount on the Pn of Rice
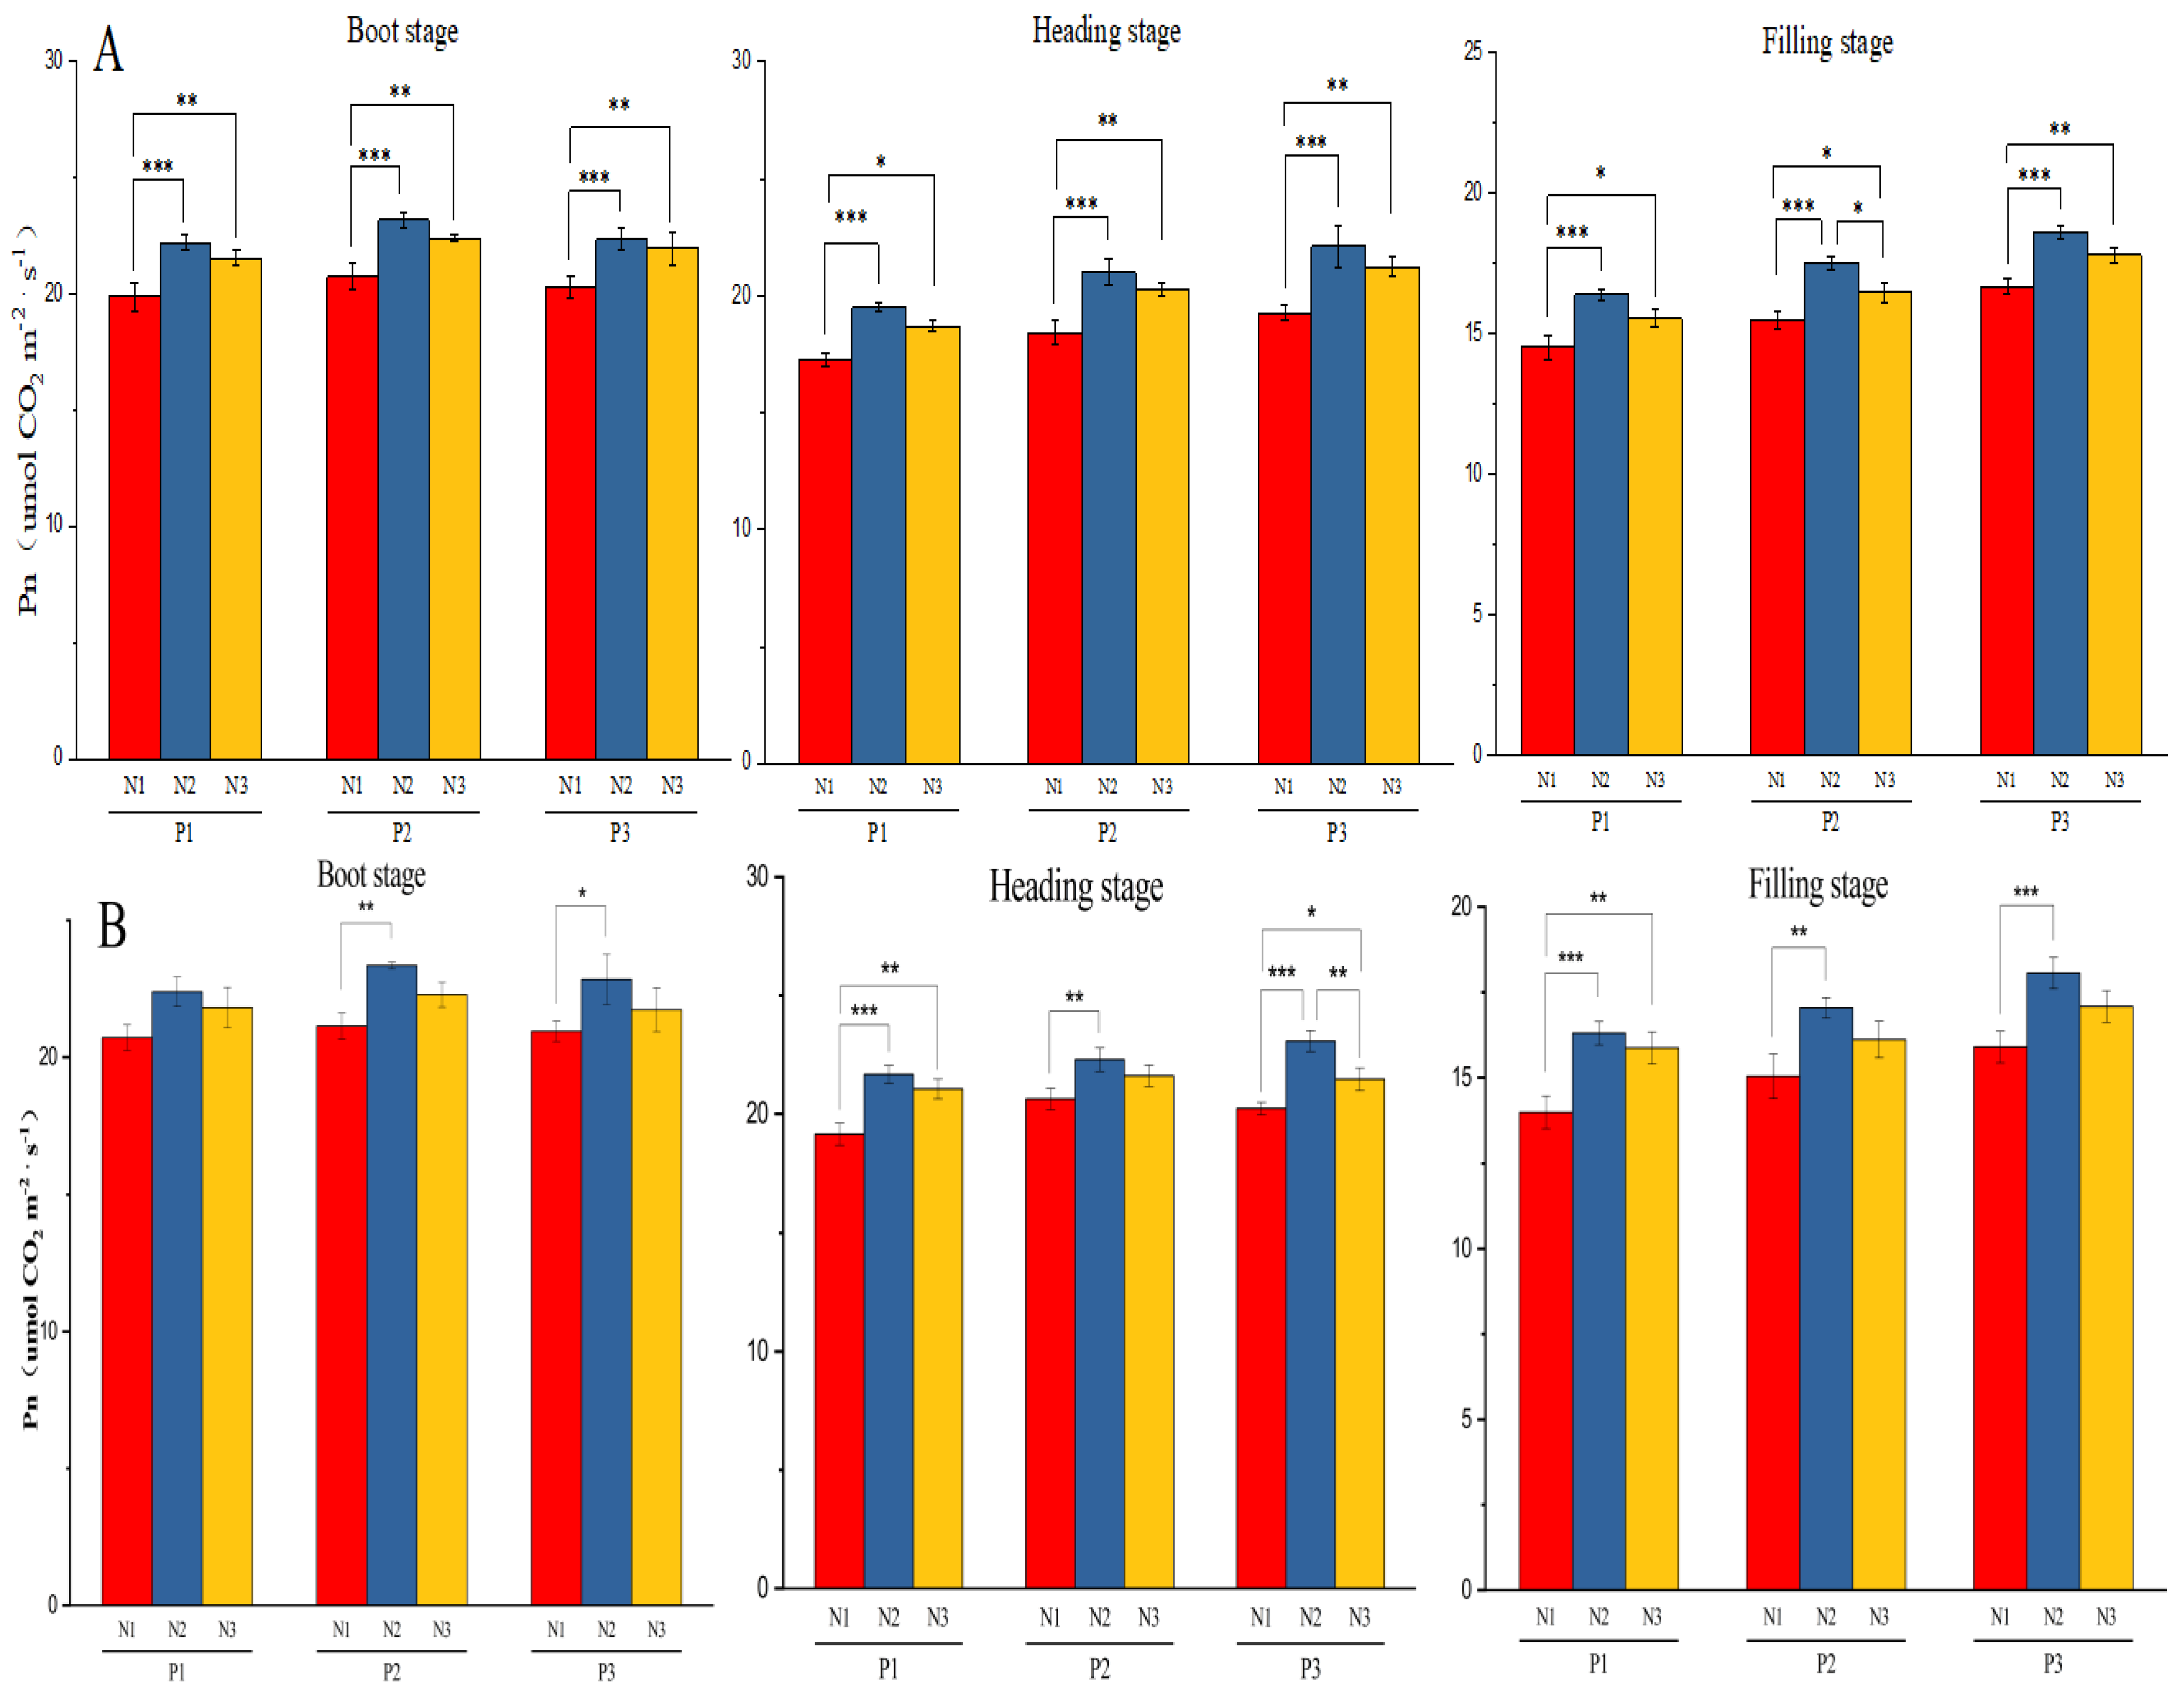
The Pn of rice leaves increased first and then decreased as the fertility period progressed, which was the highest at the heading stage (Figure 2). Under the same frequencies of N application, the Pn of rice exhibited a pattern of initial increase followed by a decline as the quantity of N applied increased., i.e., the Pn was the highest under N2; under the same N application amount, the Pn showed P1 < P2 < P3 with the increase of N application frequency. The Pn of ZLY819 was 11.73–13.81% higher than N1 at the boot stage under the same fertilization period. The Pn of ZLY819 was 4.70–12.85% higher than P1 at the heading stage under the same N application. At the filling stage, the Pn exhibited an increase of 6.63% in the P3 relative to the P2 and 12.45% higher than the P1 treatment. The Pn exhibited the highest value under P3N2 during the boot, heading, and filling stages. It can be seen that proper N application frequency and amount can enhance the physiological activity of rice leaves during the late stage, thus promoting yield formation.
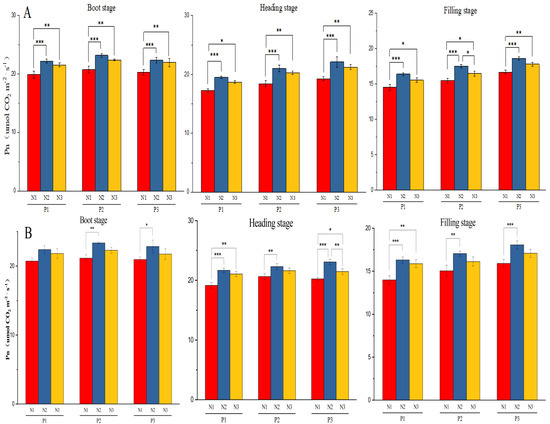
Figure 2.
Pn of ZLY819 ((A) in 2020 and (B) in 2021) under N application frequency and amount. *, **, *** significant at p < 0.05, p < 0.01, p < 0.001. The fertilizer application rate for N1, N2, and N3 in rice was 90, 150, and 210 kg N ha−1, respectively. P1 was tiller and base (5:5), P2 was base:tiller:panicle fertilizer (4:3:3), and P3 was base:tiller:panicle:granular fertilizer (4:3:2:1).
3.4. The Effect of N Application Frequency and Amount on RUE in ZLY819
As shown in Table 4, the photosynthetic active radiation (PAR) of ZLY819 exhibited an initial increase followed by a subsequent decline with the rise of N application amount in 2020, and was the highest at the N2 level, i.e., averaged 839.50 MJ m−2 at the application of 150 kg N ha−1. The average PAR of ZLY819 was 839.50 MJ m−2 at the N1 level, i.e., 839.50 MJ m−2 at the N2 level. There was a general upward trend with increasing N application in 2021, which was mainly shown as N1 < N2 < N3 under N application treatments, but the difference in N treatments between N2 and N3 was nonsignificant. The photosynthetic active radiation exhibited a gradual increase corresponding to the frequency of N applications and was highest in the P3 treatment, averaging 586.62–816.85 MJ m−2. At the same amount and different N application frequencies, the treatments mainly showed P1 < P2 < P3, and the differences were highly significant. The differences were not statistically significant with respect to the amount and frequencies of N applications. Differences between treatments were nonsignificant under the reciprocal effect of the amount and other N application frequencies. The response of RUE to the interaction between the frequency and amount of nitrogen application was not statistically significant. RUE exhibited an upward trend in response to escalating nitrogen (N) application levels under the P1 treatment. Conversely, under the P2 and P3 treatments, RUE demonstrated an initial increase followed by a subsequent decline as nitrogen application levels rose. i.e., the highest N application was at N2, with an average of 1.74 g MJ−1. RUE exhibited an upward trend as the frequency of N applications increased while maintaining a constant total amount of nitrogen applied, but the differences between treatments were nonsignificant.
Table 4.
Effect of N management on radiation utilization efficiency of ZLY 819.
3.5. The Effect of N Application Frequency and Amount on NSCs in ZLY819
3.5.1. Effect of N Management on Soluble Sugars of ZLY819 Stem Sheaths
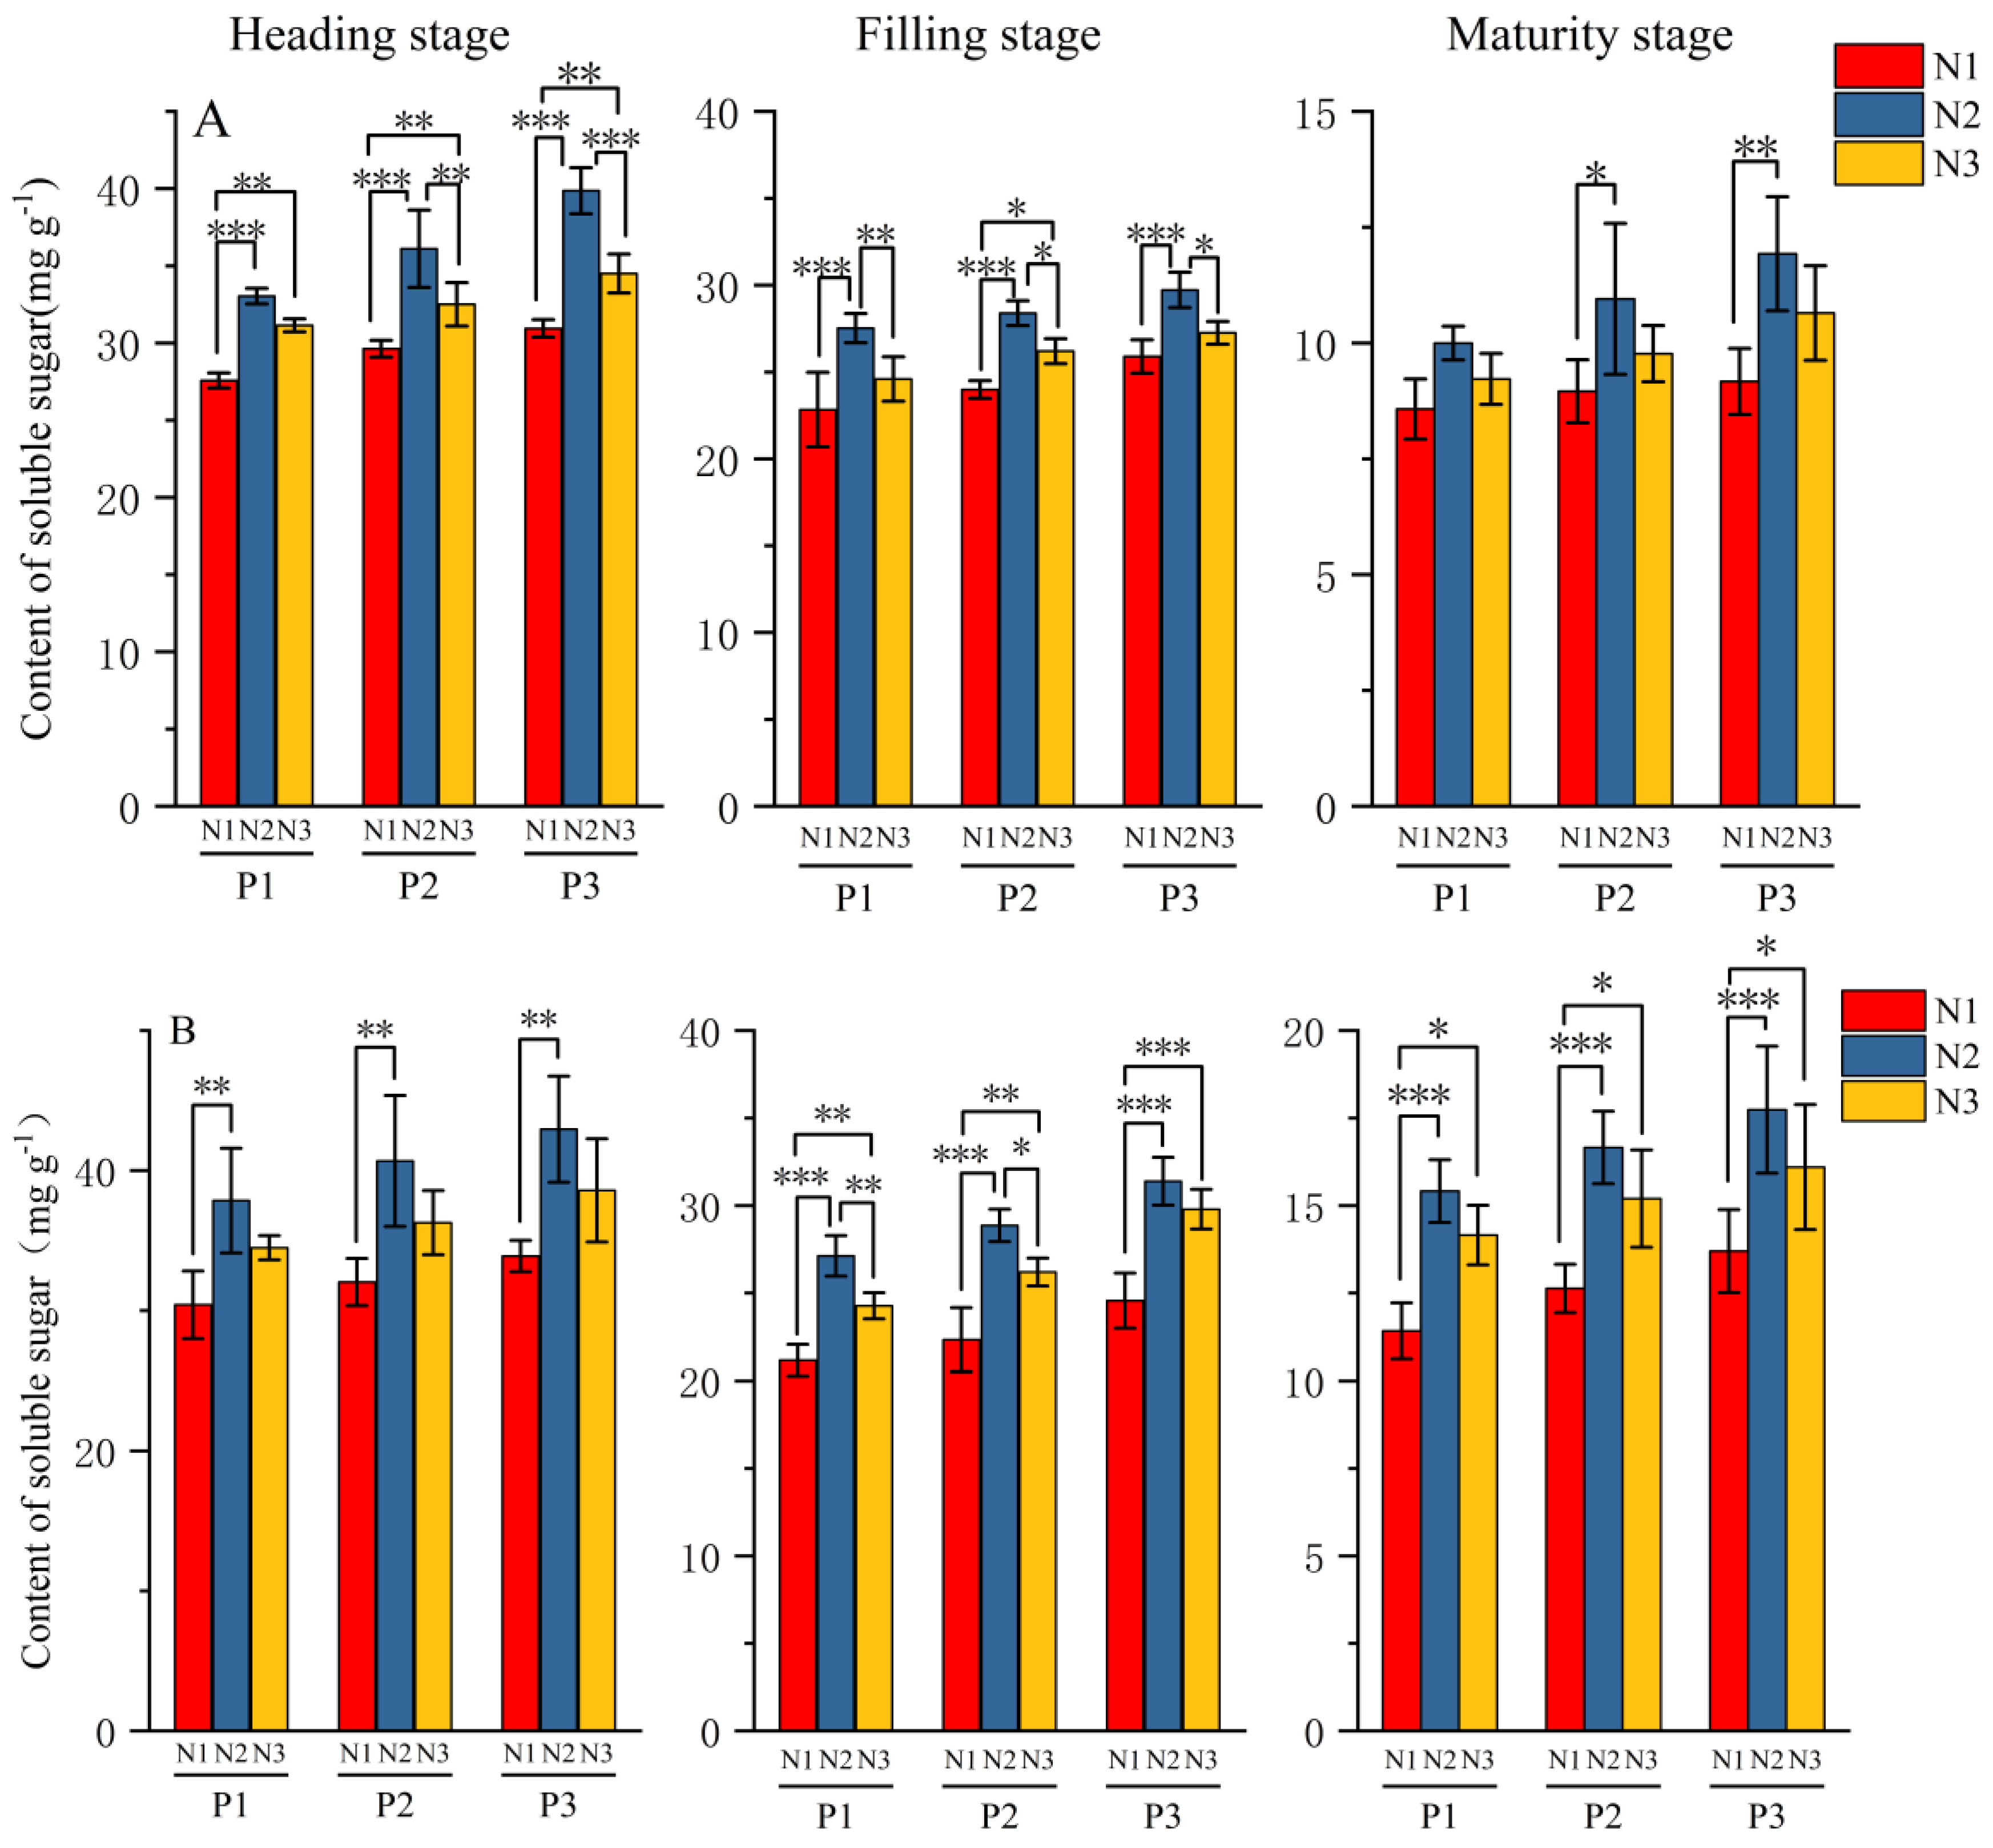
During the heading to maturity stage (Figure 3), the soluble sugar content of rice showed a decreasing trend with the advancement of the growth stage and was highest at the heading stage. At a consistent frequency of N application, the levels of soluble sugars in rice exhibited an initial increase followed by a subsequent decrease as the quantity of nitrogen applied increased. i.e., the highest soluble sugars were found at N2. With a consistent level of N application, the concentration of soluble sugars exhibited an increase corresponding to the frequency of N application, demonstrating a trend characterized by P1 < P2 < P3. The soluble sugar content was found to be greatest in the P3N2 during the heading, filling, and maturity stages.
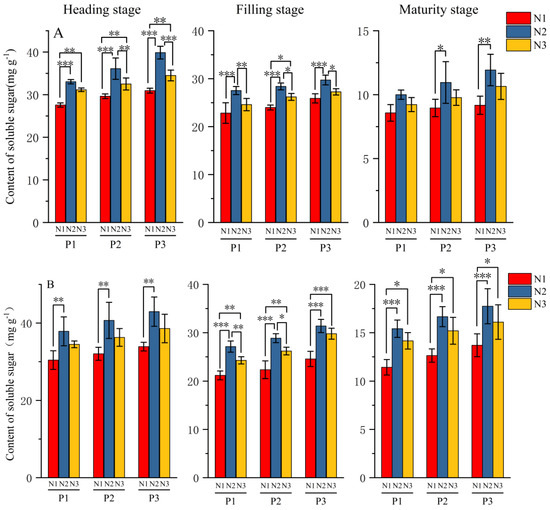
Figure 3.
Effect of N management on soluble sugars in ZLY819. (A,B) represent the values of ZLY819 in 2020 and 2021, respectively. *, **, *** significant at p < 0.05, p < 0.01, p < 0.001. The fertilizer application rate for N1, N2, and N3 in rice was 90, 150, and 210 kg N ha−1, respectively. P1 was tiller and base (5:5), P2 was base:tiller:panicle fertilizer (4:3:3), and P3 was base:tiller:panicle:granular fertilizer (4:3:2:1).
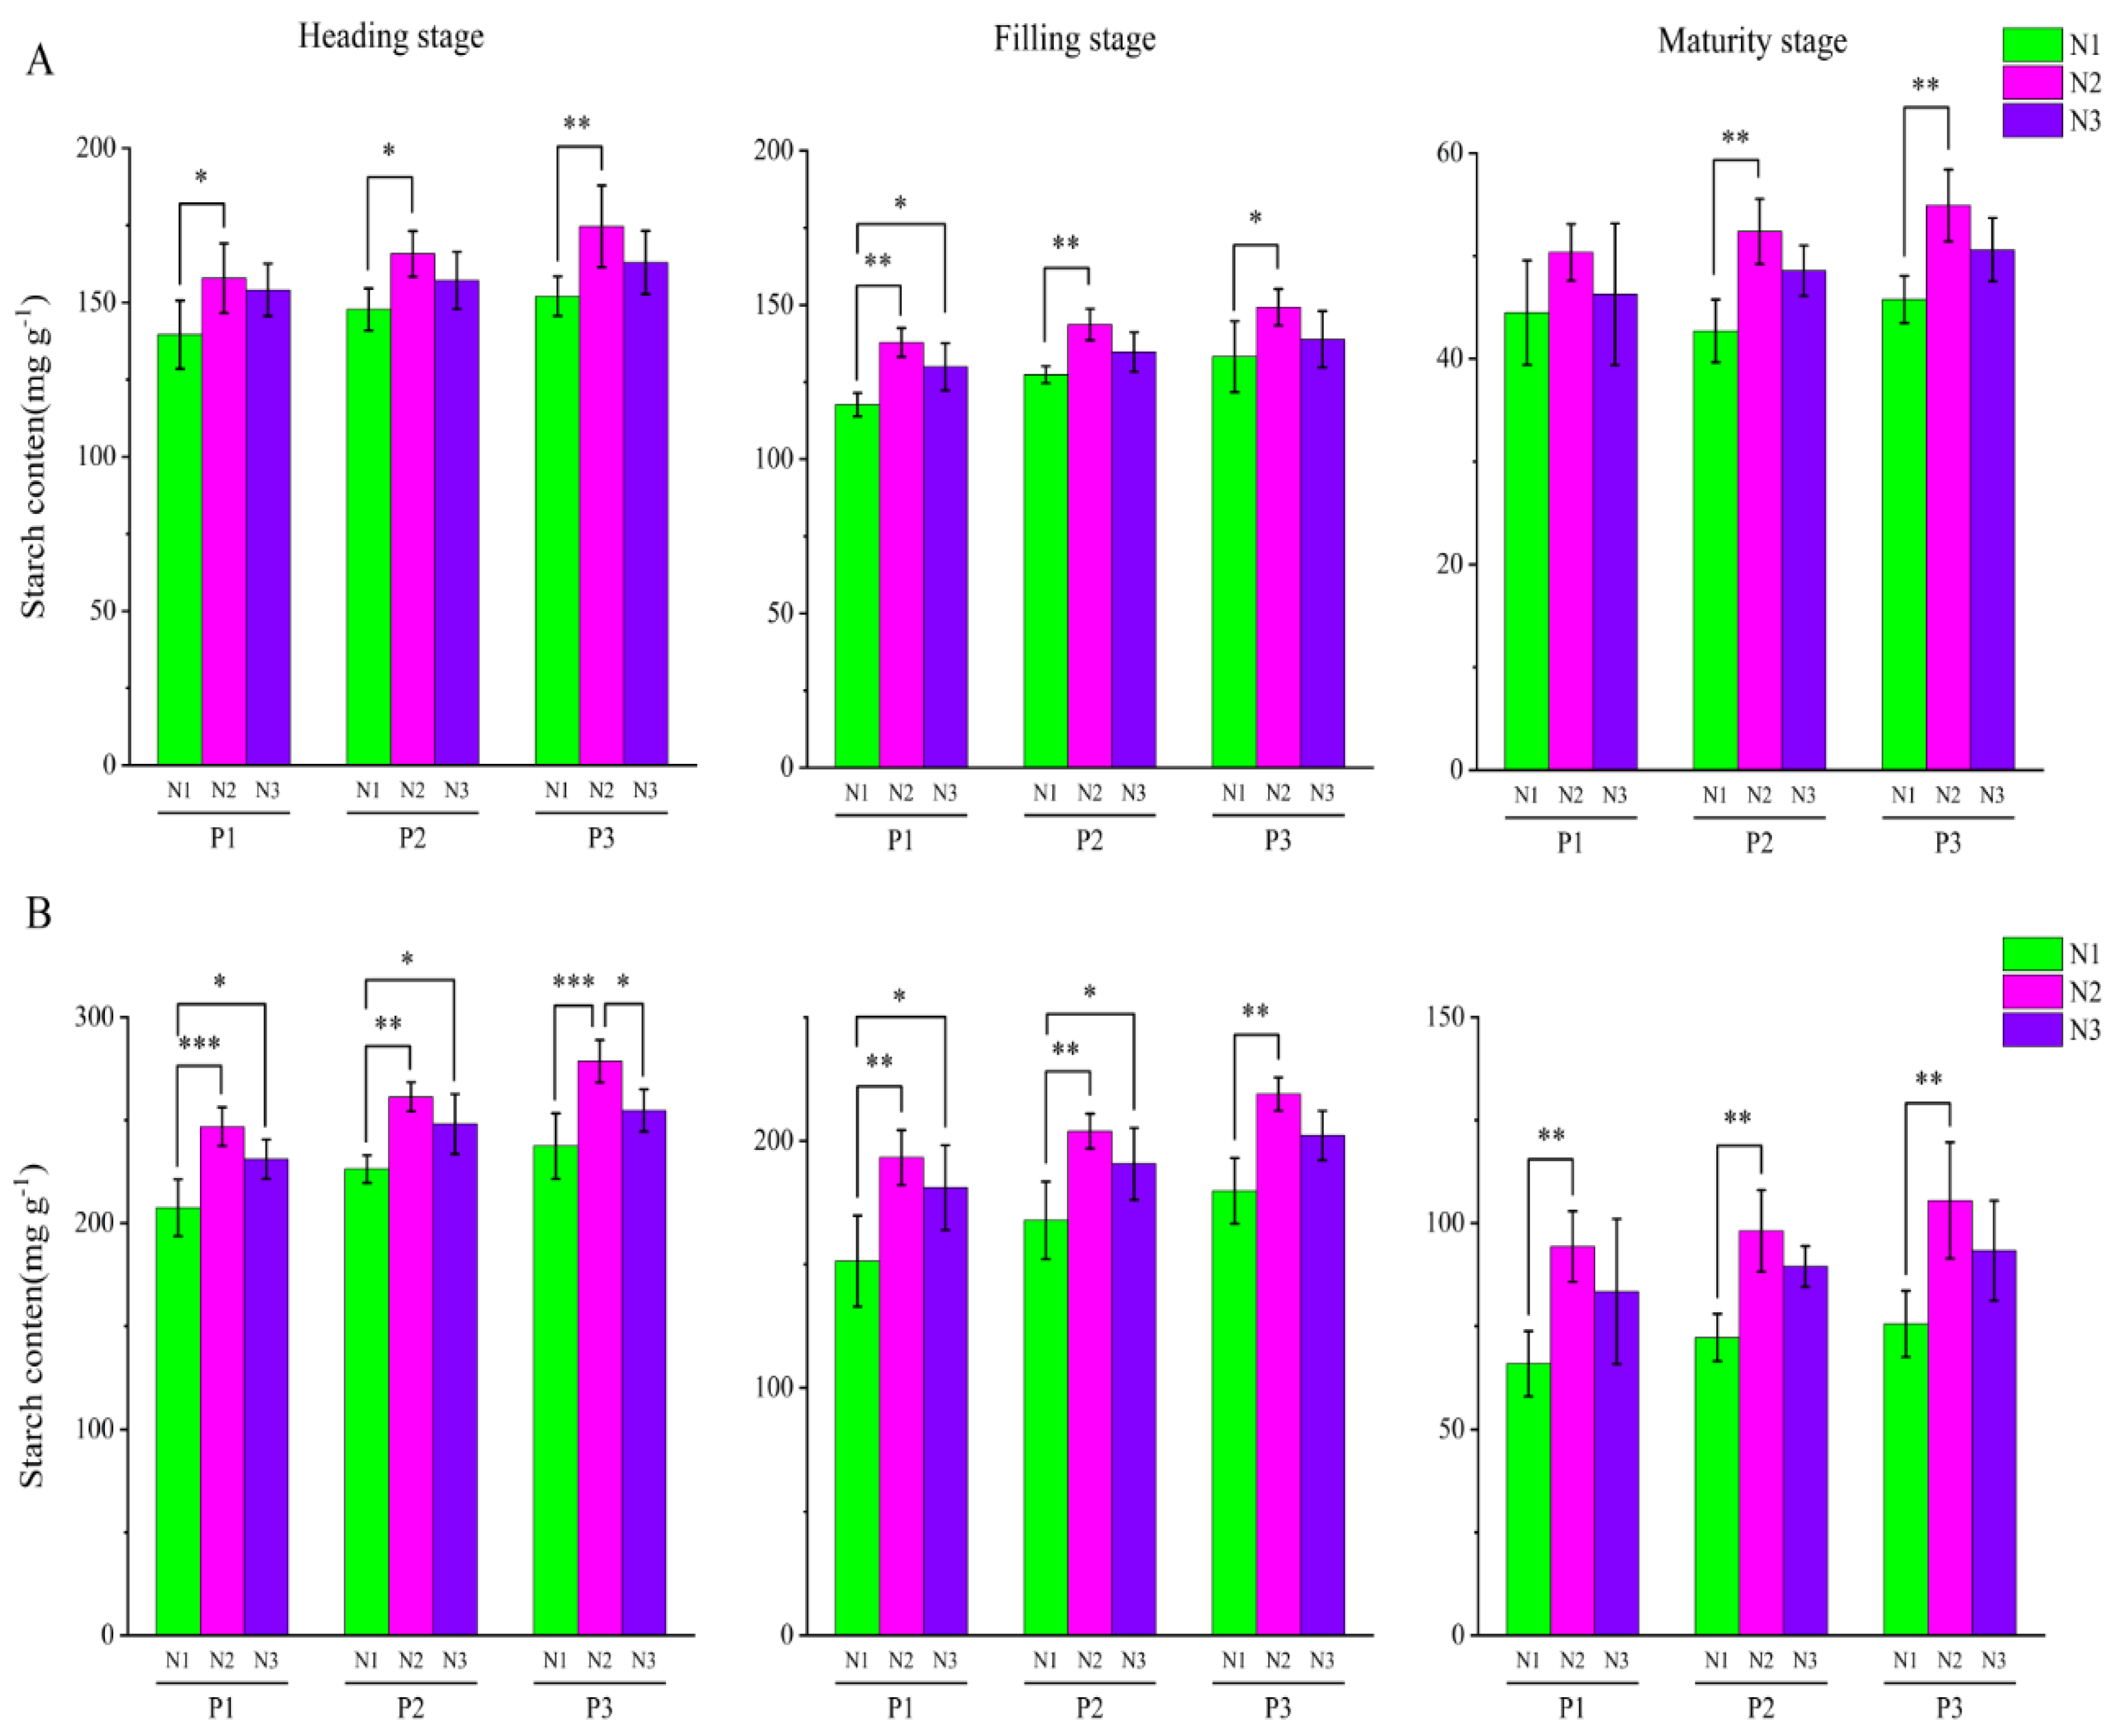
3.5.2. Effect of N Management on the Starch Content of Stem Sheaths in ZLY819
In the heading to maturity stage (Figure 4), rice starch content exhibited a declining trend as the growth stage progressed and was highest in the heading stage. At a consistent frequency of N application, rice starch content exhibited an initial increase followed by a subsequent decrease as the amount of N applied increased. The highest starch content was found under N2. Under the same N application amount, the trend of starch content was P1 < P2 < P3 as the frequencies of N applications increased. The starch content was greatest in the P3N2 during the heading, filling, and maturity stages.
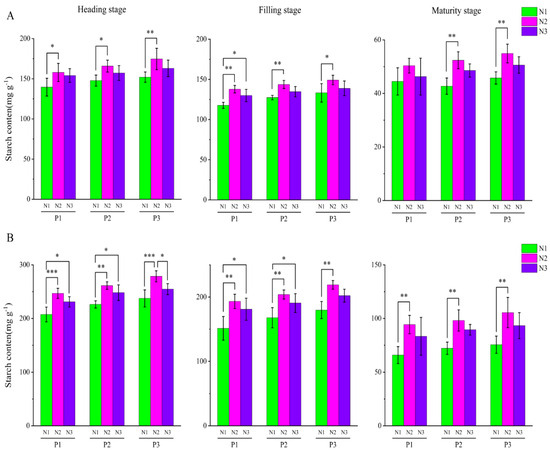
Figure 4.
Effect of nitrogen management on starch in ZLY819. (A,B) represent the values of ZLY819 in 2020 and 2021, respectively. *, **, *** significant at p < 0.05, p < 0.01, p < 0.001. The fertilizer application rate for N1, N2, and N3 in rice was 90, 150, and 210 kg N ha−1, respectively. P1 was tiller and base (5:5), P2 was base:tiller:panicle fertilizer (4:3:3), and P3 was base:tiller:panicle:granular fertilizer (4:3:2:1).
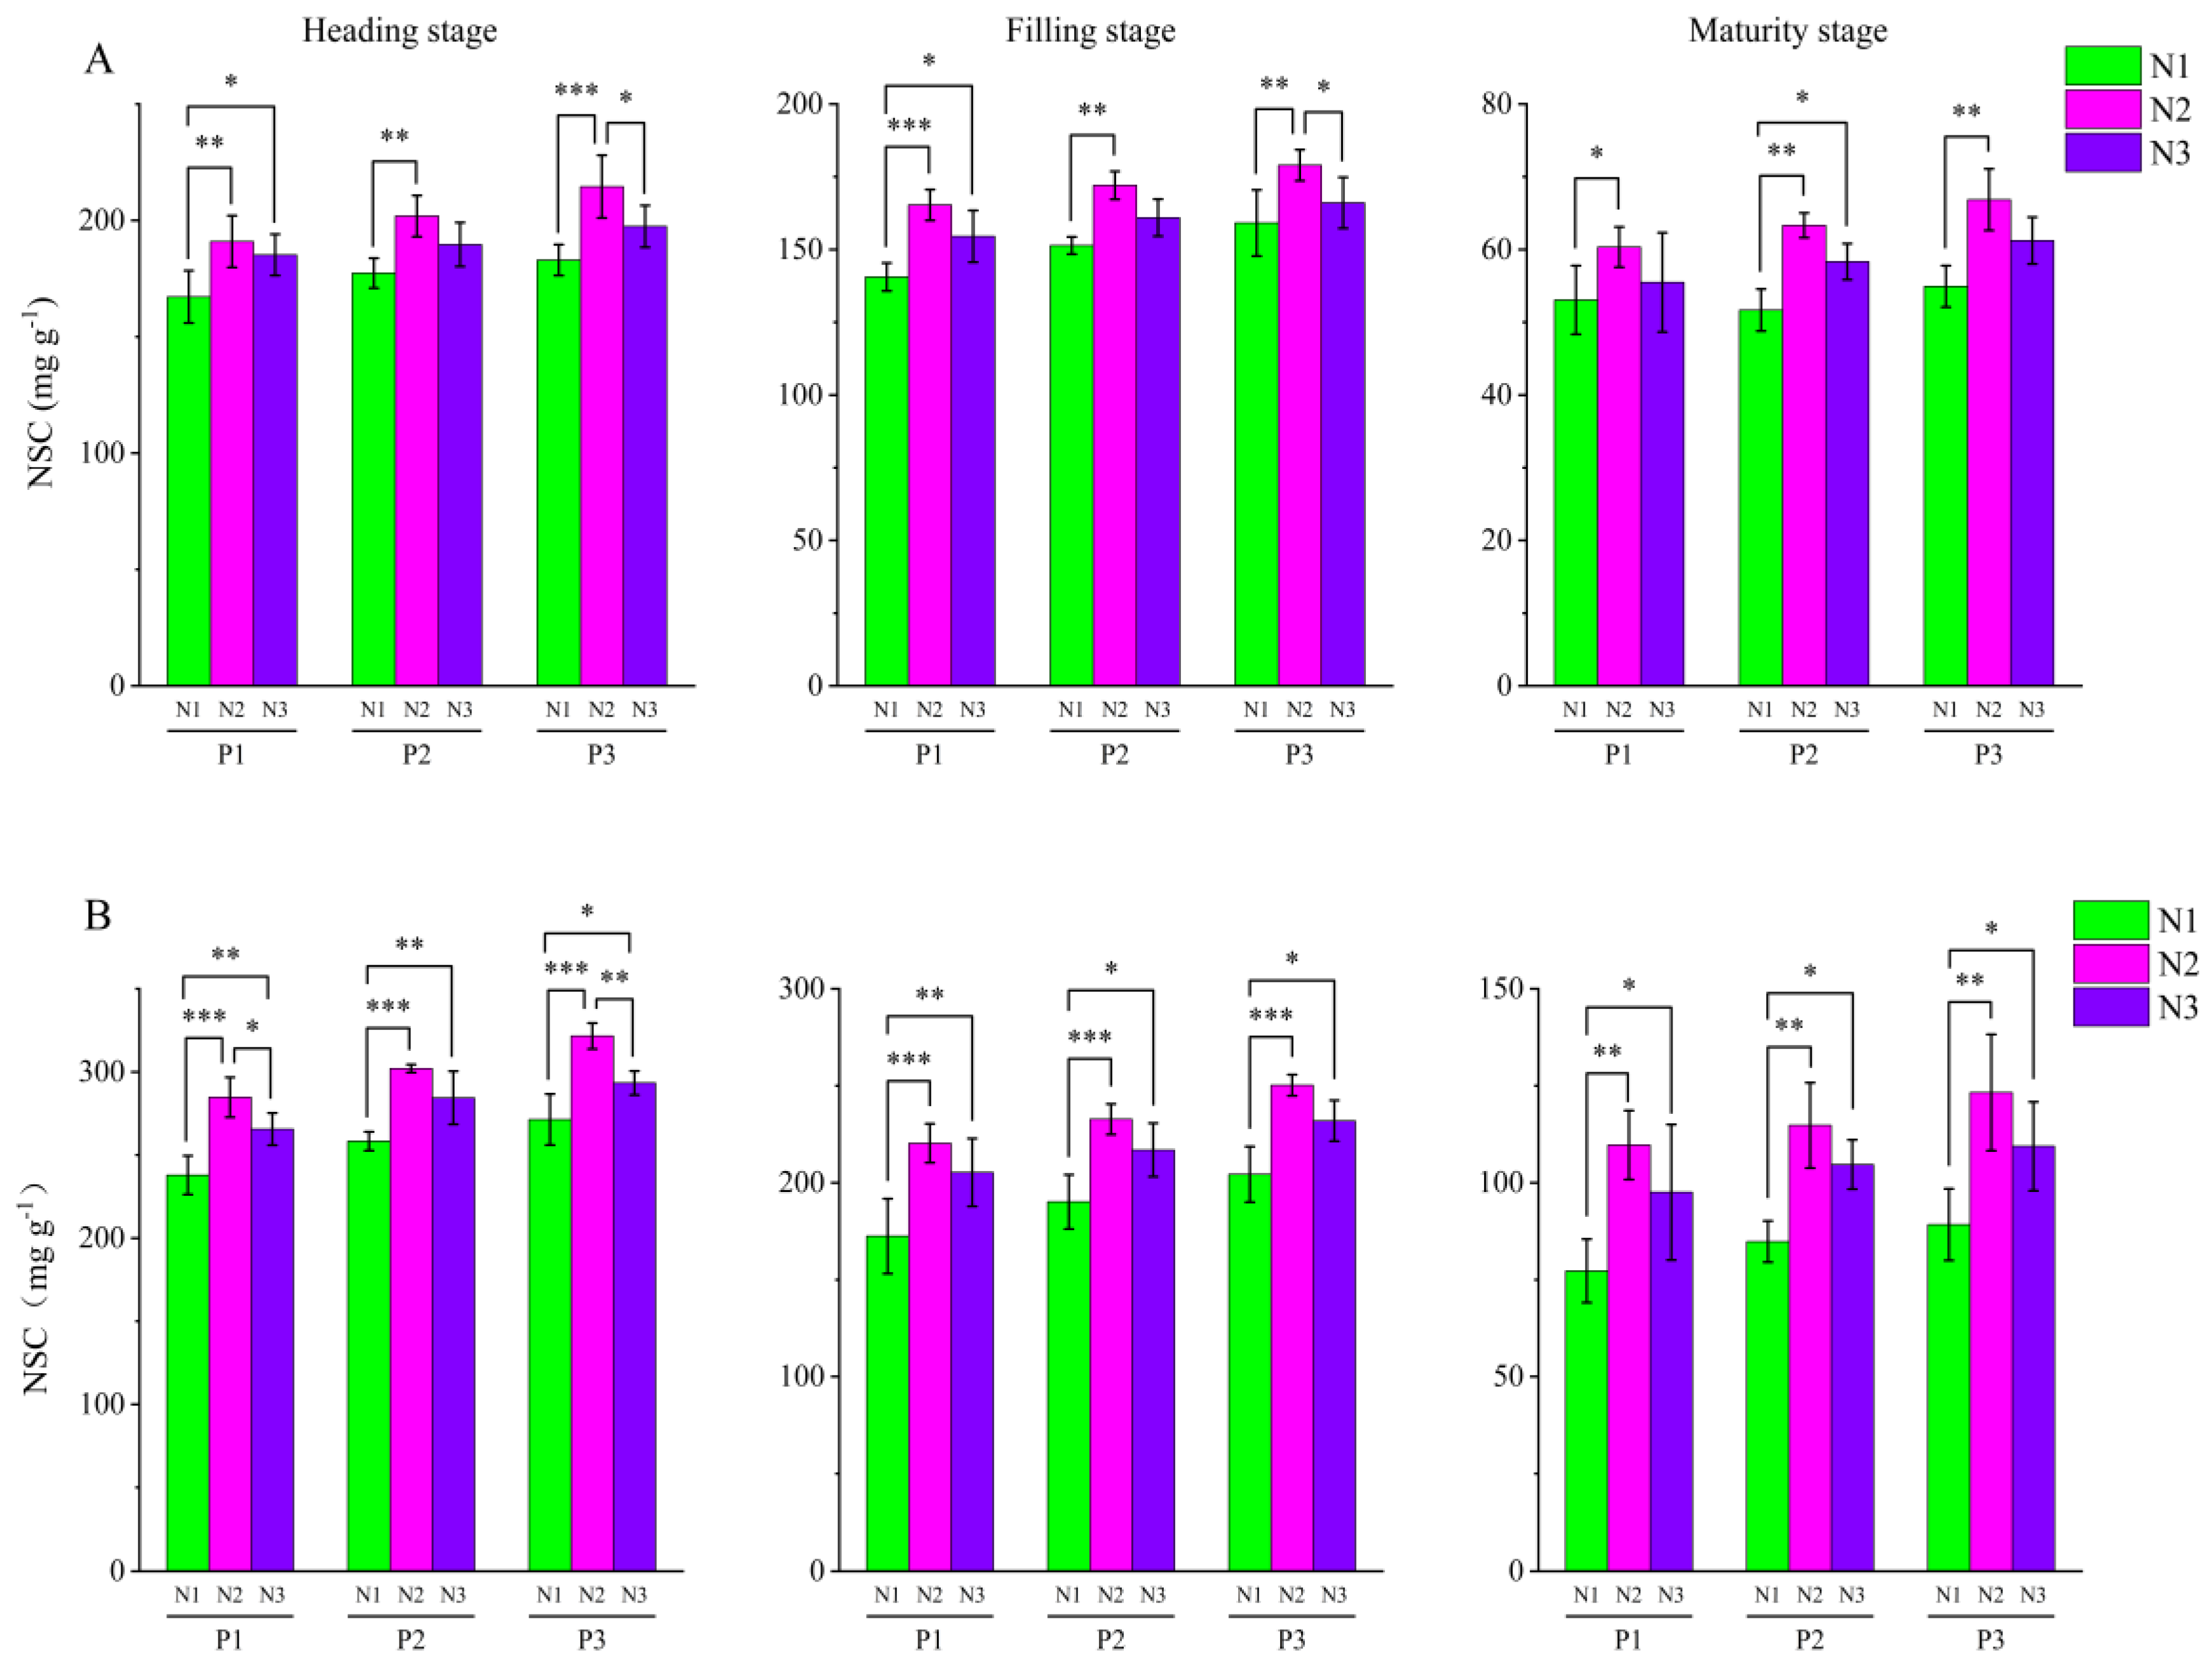
3.5.3. Effect of Nitrogen Management on NSCs of ZLY819 Stem Sheaths
The content of rice stem sheath NSCs of ZLY819 exhibited a declining trend as the growth stage progressed from heading to maturity (Figure 5), with the highest content during the heading stage and the lowest at the maturity stage. At a consistent frequency of N application, the content of NSCs in rice stem sheaths exhibited an initial increase followed by a decrease as nitrogen application levels rose from the heading stage to the maturity stage, i.e., the content was highest at N2. Among them, N2 of the ZLY819 was 5.85–7.71% and 13.62–18.35% higher than N3 and N1, respectively, at the heading stage.
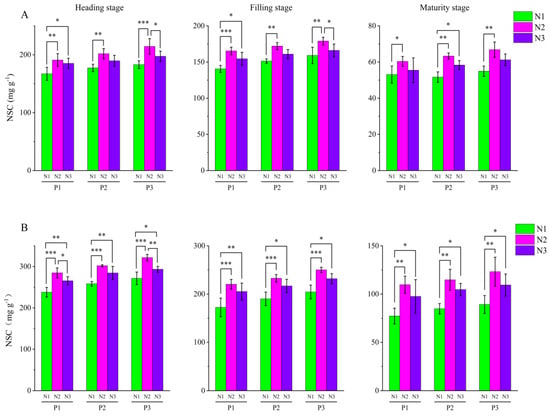
Figure 5.
Effect of nitrogen management on non-structural carbohydrate in ZLY819. (A,B) represent the values of ZLY819 in 2020 and 2021, respectively. *, **, *** significant at p < 0.05, p < 0.01, p < 0.001. The fertilizer application rate for N1, N2, and N3 in rice was 90, 150, and 210 kg N ha−1, respectively. P1 was tiller and base (5:5), P2 was base:tiller:panicle fertilizer (4:3:3), and P3 was base:tiller:panicle:granular fertilizer (4:3:2:1).
At the same amount of N application, the NSC content during the heading to maturity stage increased with the increasing frequency of N application from P1 < P2 < P3. During the heading stage, the NSC content of the P3 treatment was greater than that of the P2 and P1 treatments by 3.95–4.91% and 8.84–12.45%, respectively. The NSC content was observed to be at its peak in the P3N2 during the heading, filling, and maturity stages.
3.5.4. The Impact of N Management on NSC Accumulation and Transport in the Stem Sheath of ZLY819
From Table 5, it can be seen that the overall NSC accumulation, output, and contribution rate to grains of ZLY819 on the heading and maturity stage exhibited a trend characterized by an initial increase followed by a subsequent decrease in response to the escalating amount of N application. The trends in the data for the two years are generally consistent. During the heading and maturity stage, the NSC accumulation, output, and contribution rate to grains of ZLY819 were increased by an average of 38.45%, 42.35%, 36.92%, and 19.70% in the N2 treatment compared with N1; and by an average of 7.51%, 9.08%, 6.90%, and 4.50% in N2 compared with N3, respectively.
Table 5.
Effect of N management on stem and sheath transport in ZLY819.
There was a nonsignificant pattern in the transport rate and the differences among treatments were nonsignificant. The NSC accumulation, output, transport rate, and contribution rate to grains in ZLY819 increased with the increasing frequencies of N application during the heading and maturity stage, and the highest values were observed in the P3 treatment; the average increases were 15.97%, 10.02%, 17.83%, 1.55%, and 6.85%, respectively, compared with that in the P1 treatment. Comprehensively, it can be seen that the N application amount of 150 kg ha−1 and N fertilizer frequency of 4:3:2:1 were more conducive to NSC accumulation and translocation in ZLY819 (Table 5).
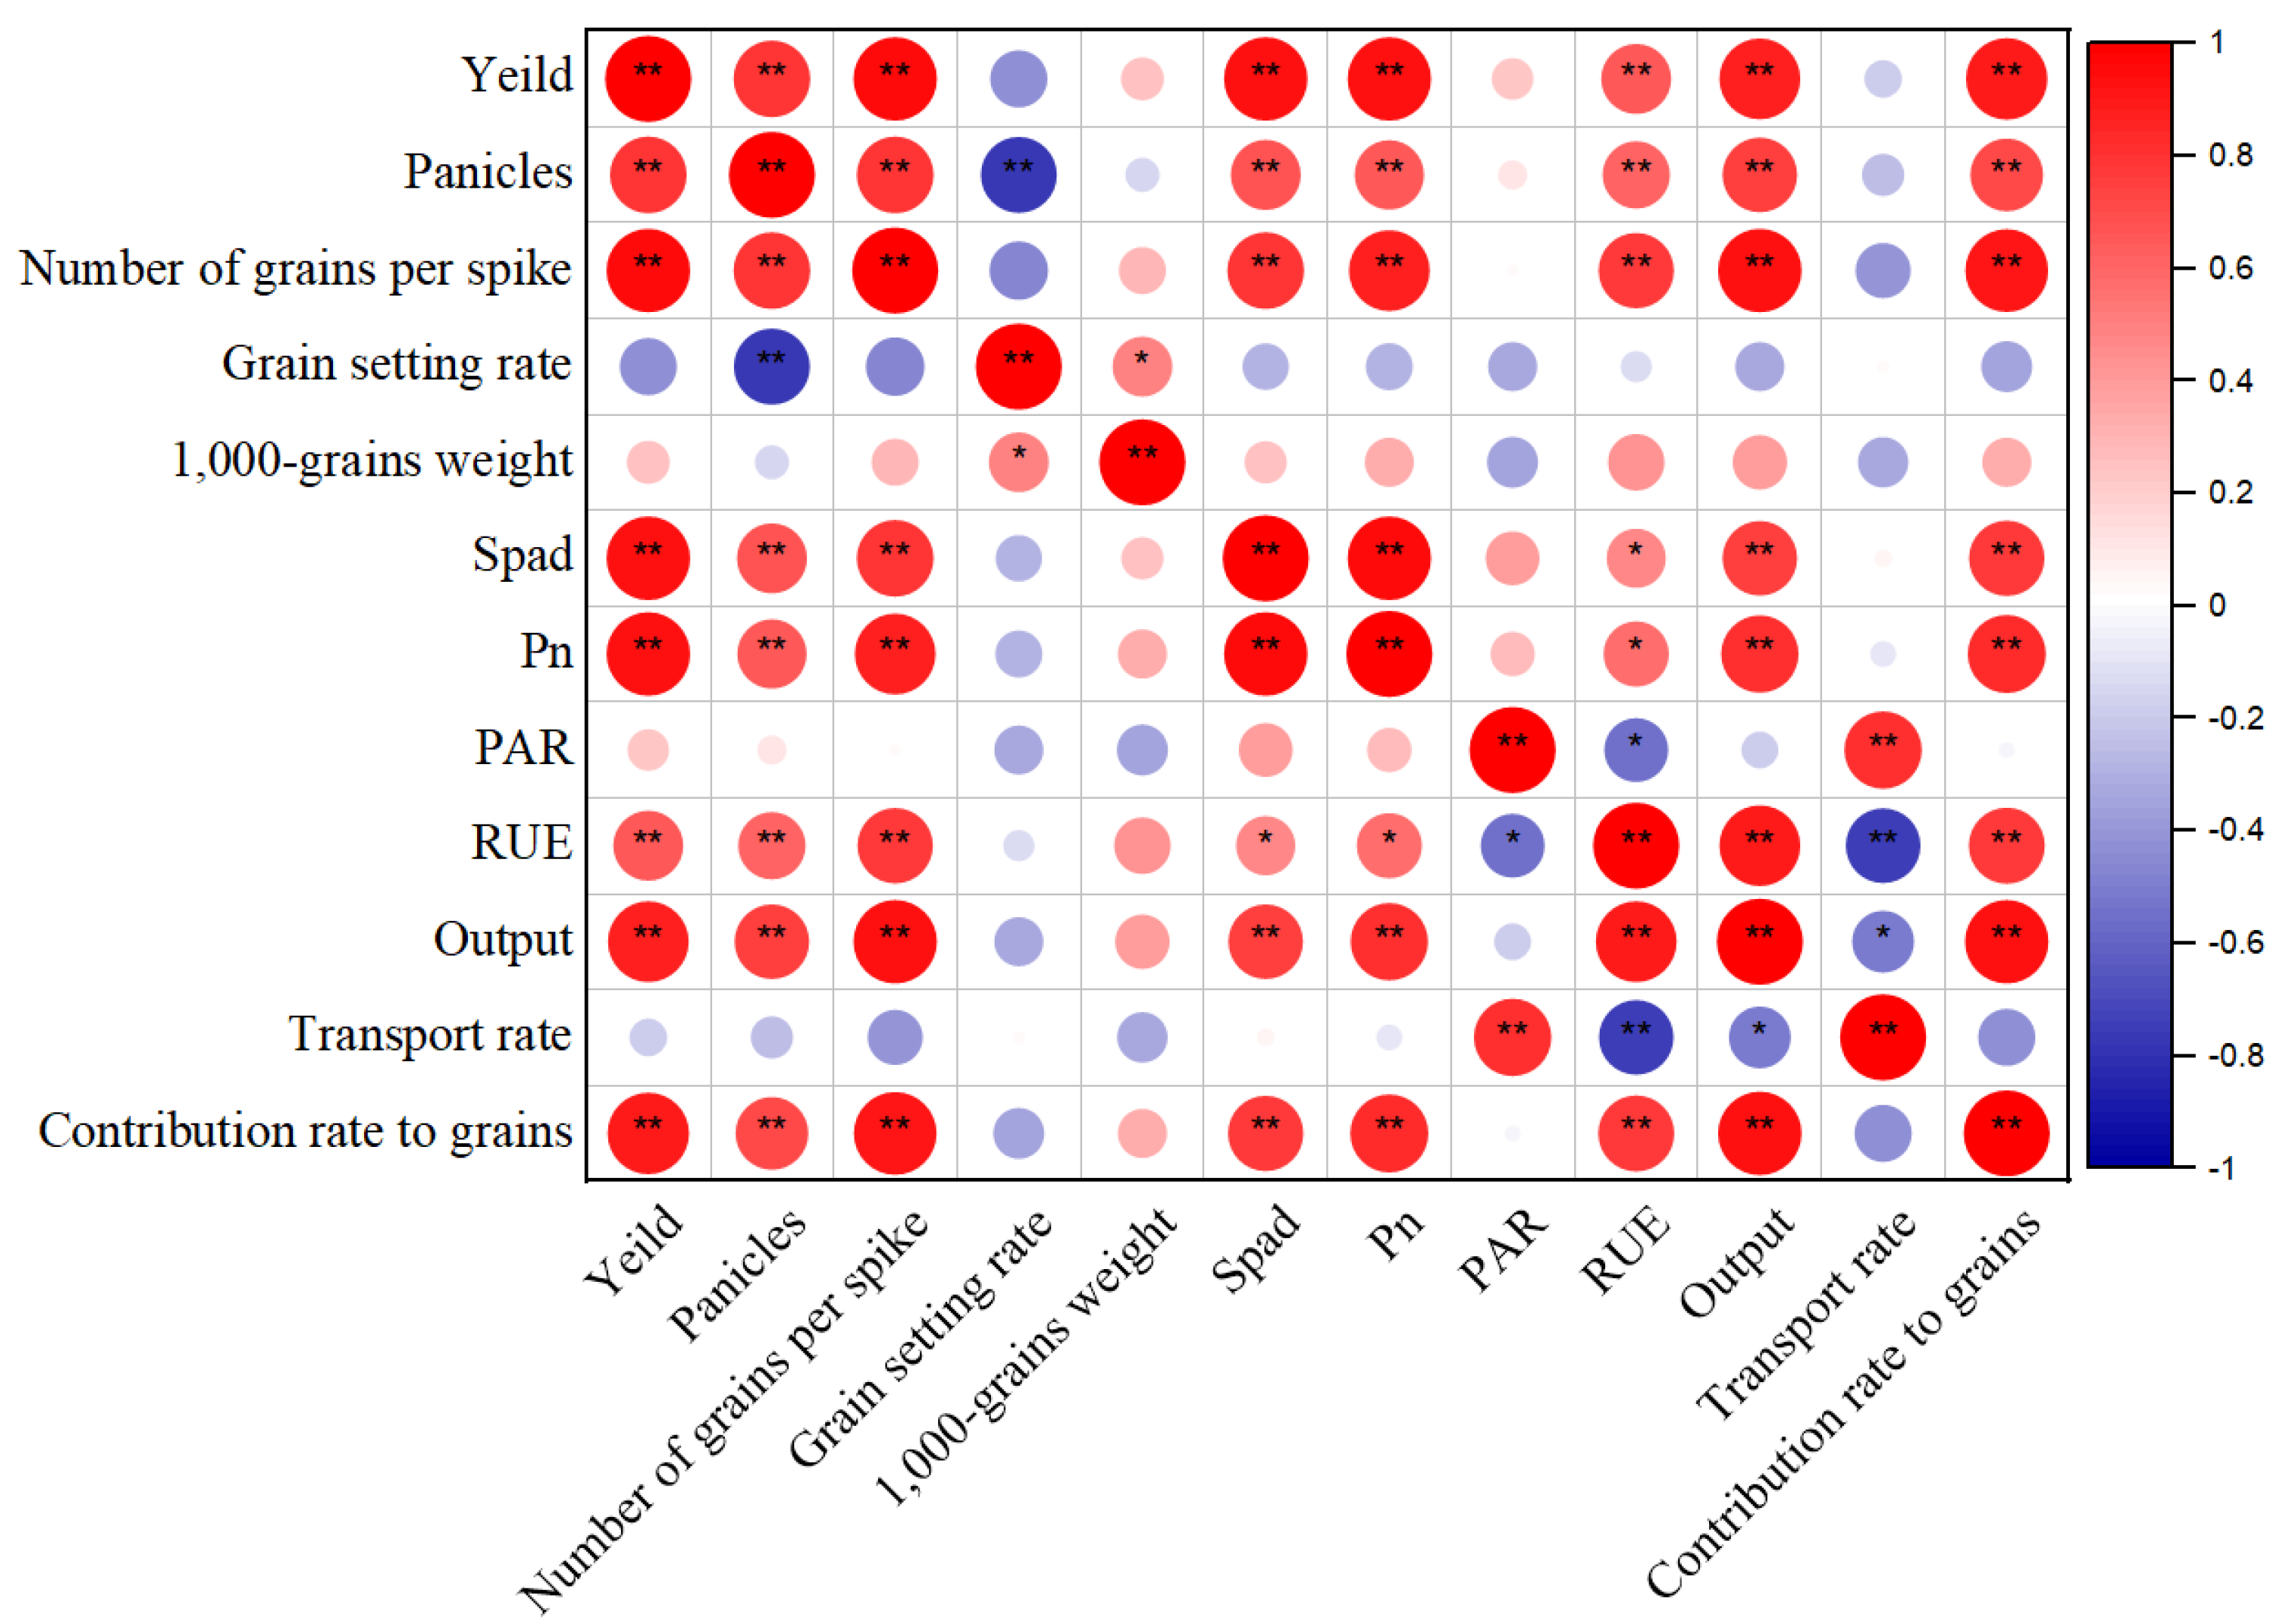
3.6. Heat Map of Correlation between Indicators
A statistically significant positive correlation was observed between rice yield and the density of effective spikes per hectare, number of grains per spike, SPAD, Pn, RUE, output, and contribution rate to grains (Figure 6). The Pn, SPAD, and RUE of ZLY819 were all highly significantly and positively correlated with the effective spikes and number of grains per spike. The Pn, SPAD, and RUE were also highly significantly and positively correlated with the output of NSCs and the contribution rate to the grain. The results showed that with the increase of SPAD, Pn, and RUE, the output of NSCs and the contribution rate to the grain increased, and the effective spikes and number of grains per spike were also improved. Appropriate nitrogen fertilizer management can improve photosynthetic characteristics and NSC accumulation, increase the effective spikes and number of grains per spike, and thus improve rice yield.

Figure 6.
Heat map of correlation between indicators. * and ** significant at p < 0.05 and p < 0.01, respectively.
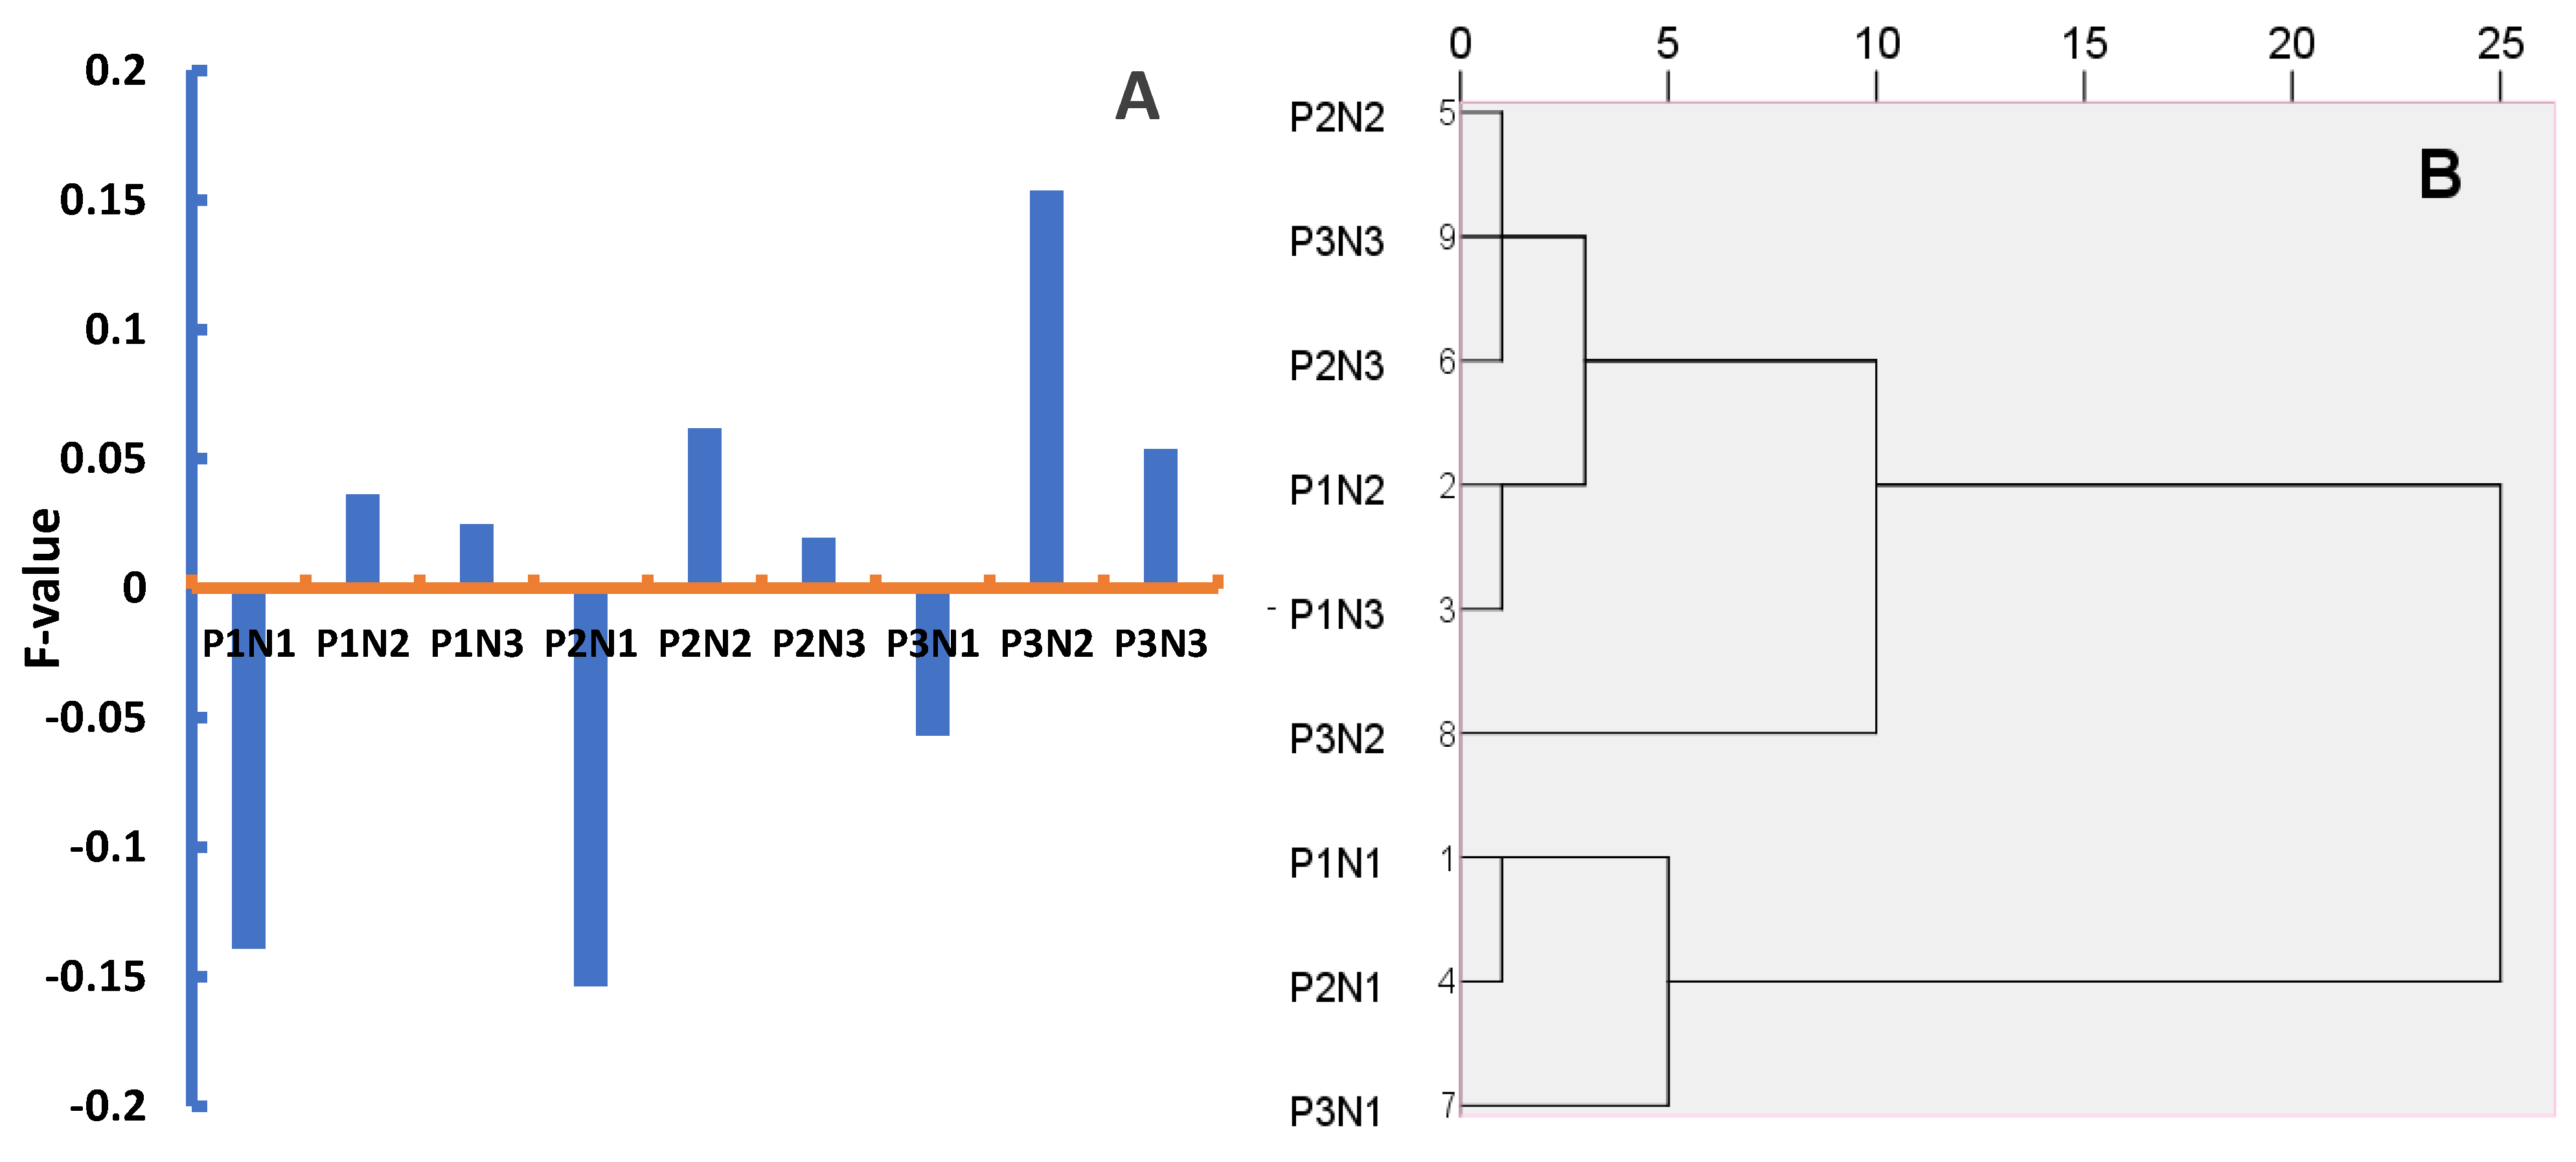
3.7. Principal Component Analysis (PCA) and Cluster Analysis
SPSS16.0 software was used to do a PCA analysis on 12 indicators of 9 treatments respectively, and the contribution rate of 2 principal components was obtained as 72.384 and 16.401 respectively, while the equation was obtained by calculation F = 0.102X1 + 0.056X2 + 0.083X3 + 0.016X4 + 0.085X5 + 0.117X6 + 0.112X7 + 0.095X8 + 0.088X9 + 0.106X10 + 0.045X12 + 0.099X13, and the data of the 12 indexes from each treatment were standardized and then brought into the equation to get the F-value. Through the F-value, it can be seen that the P3N2 treatment effect is the best (Figure 7A).
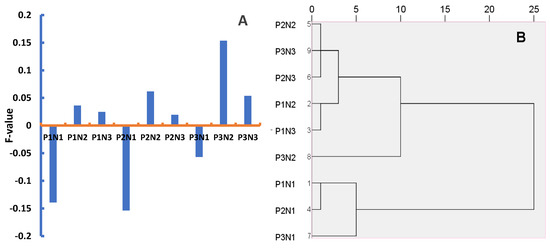
Figure 7.
Combined score (A) and cluster analysis (B) for each treatment.
The results of cluster analysis are consistent with the results of principal components. P1N1 and P2N1 have low F-values and are clustered together. P2N2, P3N3, and P2N3 have similar F-values, and all of them are clustered together (Figure 7B).
4. Discussion
4.1. The Optimal Frequencies and Amount of N Application Have the Potential to Substantially Enhance Grain Yield in the ZLY819
The N application frequency and amount is a vital cultivation technique to improve rice yield. Many previous studies have been conducted to clarify the optimal N application frequencies, amount, and yield potential of rice [26,27]. For example, rice yield no longer increased with increasing N application amount after applying more than 168.16 kg ha−1 but showed a decreasing trend [28]. Zhao C et al. [20] found that yield exhibited an upward trend in response to N application at 0–270 kg ha−1, while excessive N application (345 kg ha−1) caused a decrease in yield. At the same amount of N application, additional N fertilization later was beneficial for population dry matter accumulation and for increasing spikelets and yield [29]. Our previous research found that ZLY819 had the greatest yield at 150 kg ha−1 of the total N application amount; the yield exhibited an upward trend corresponding to the rising frequencies of the N application. Specifically, ZLY819 had a base fertilizer of 60 kg ha−1, a tiller fertilizer of 45 kg ha−1, a spike fertilizer of 30 kg ha−1, and a grain fertilizer of 15 kg ha−1. This fertilization strategy led to an enhancement in rice yield compared with the previous fertilizer application pattern [30]. It can be seen that under suitable N application, the backward shift of N fertilizer is beneficial to the yield potential of both varieties, which is consistent with prior research [8,31,32].
4.2. The Impact of N Application Frequency and Amount on Rice Yield Structure
An appropriate amount of N application promotes rice growth and development. It enhances the quantity of tillers, leaf area index, SPAD value, the Pn, the effective number of spikes, and dry matter accumulation. Conversely, the overuse of nitrogen fertilizer has adverse effects on the growth of rice [33]. Among the yield components, the total number of grains per spike and effective spike number were closely related to yield and contributed the most [30,34,35]. In this study, tiller spikes increased gradually in response to the escalating N application amount. The setting rate decreased gradually with the quantity of N application amounts in the ZLY819. The total number of grains per spike was highest at 150 kg ha−1 and 210 kg ha−1 of the total N application amount, respectively. The higher yield under N3 treatment can primarily be attributed to the high number of spikelets per panicle and high total glume yield. Suitable N application amount or frequency can increase the number of spikelets per panicle and expand the yield reservoir to achieve increased rice yield. The findings of this study align with those of prior research [8].
With the consistent total N application amount, N fertilization at different periods had different effects on rice population structure; N fertilization at the early stage of rice fertility mainly promoted the number of tillers, while fertilization at the later stage primarily focused on increasing the total number of spikelets per panicle and the setting rate [36]. It has been shown that applying grain fertilizer is the key to improving the setting rate. Xu et al. [37] demonstrated that the application of grain fertilizer at different periods could increase the adequate total number of spikes and the number of spikelets per panicle while maintaining a high SPAD value and Pn at the later stages, which is conducive to promoting photosynthesis, delaying leaf senescence, and improving dry matter accumulation. In this study, it was found that nitrogen management promoted high rice yields by promoting an effective number of spikes and number of grains per spike.
4.3. Effect of N Application Frequency and Amount on Photosynthesis of ZLY819
Rice canopy absorbs CO2 through photosynthesis to synthesize carbohydrates, a necessary basis for dry matter accumulation and improving rice yield. Some research investigations have indicated that pre-flowering dry matter accumulation in high-yielding rice varieties contributes up to 30% to rice yield and positively correlates with yield [38,39]. The backward shift of N fertilizer is conducive to improving photosynthesis, RUE, and delaying leaf senescence during the advanced growth phases of rice. The substances accumulated in the nutritional organs before flowering are mainly used to grow nutrition organs. In contrast, the substances formed by photosynthesis after flowering mainly act on yield, whose contribution to rice yield can reach 90%. Over 40% of canopy photosynthesis is attributed to the leaves [40]; extending the functional period of photosynthesis in the leaves after flowering is crucial for high rice yield [41,42]. The high yields of rice mainly depend on the photosynthetic capacity of the leaves from the tassel stage to maturity [43], and the most representative indicator of the strength of leaf photosynthesis is the Pn [44].
4.4. Effect of N Application Frequency and Amount on NSCs of ZLY819
The accumulation and translocation of NSCs in the stem sheath are regulated by the amount and frequency of N application. NSCs accumulated in the stem primarily consist of soluble sugars and starch, which are the main products of photosynthesis and important substrates for respiration in rice. The accumulation of NSCs in stalks before the heading stage, and the transfer of NSCs after the heading stage are favorable for accelerating the grain-filling process and increasing the formation of grain yield [16,17]. The overuse of N fertilizer leads to the late ripening of rice plants, and the distribution of assimilates to grains is reduced, resulting in the slow filling of grains [45]. When nitrogen application is too low, leaf area index decreases, photosynthetic capacity decreases, and source-side assimilate accumulation is limited [46]. Although NSC accumulation in stem sheaths and apparent contribution to seeds were increased in rice subjected to low N treatments, NSC accumulation in stem sheaths before tasseling and the photosynthetic capacity of functional leaves after tasseling were low, and thus higher yields could not be obtained [14]. Compared with no spike fertilization, spike fertilization facilitates the translocation of NSCs from the stems to the kernels. Additionally, it enhances the activity of critical enzymes involved in sucrose-starch metabolism, thereby promoting the filling of rice grains and ultimately contributing to an increase in rice yield [16]. The appropriate amount and frequency of N application can improve photosynthesis in rice, which is conducive to the formation of high light-efficient rice populations, thus promoting the accumulation of photosynthetic products and the amount of operation in rice. In the current investigation, the NSC content, the amount of NSC output, and the contribution to the grains were the largest under the P3N2 treatment at both heading and maturity, indicating that the higher photosynthetic capacity and NSC accumulation of plant leaves under the appropriate amount and frequency of N applications promoted the translocation of photosynthetically assimilated compounds to the grain after heading stage, thereby increasing rice yield.
5. Conclusions
Photosynthesis and NSCs play important roles in rice yield formation. In the present study, rice yield was found to be significantly and positively correlated with the effective spikes per unit area, number of grains per spike, SPAD, Pn, RUE, NSC accumulation, and contribution to seed grain. The highest SPAD, Pn, RUE, and NSC accumulation and contribution to seed grain were observed in rice when the application rate was 150 kg/ha. At the same N application amount, the effective spikes, number of grains per spike, SPAD, Pn, RUE, NSC accumulation, and contribution to seed grain of rice increased in P3 treatment. The appropriate amount and frequency of N application treatment (P3N2) was beneficial to increasing the effective spikes, number of grains per spike, SPAD, Pn, RUE, NSC accumulation, and contribution to seed grain, thus promoting the formation of rice yield.
Author Contributions
Conceptualization, X.W.; Data curation, X.H.; Formal analysis, X.H.; Funding acquisition, X.W.; Investigation, X.H., A.S. and W.T.; Project administration, X.W.; Resources, H.Z. and A.S.; Supervision, X.W.; Writing—original draft, X.H.; Writing—review and editing, H.Z. All authors have read and agreed to the published version of the manuscript.
Funding
This study was supported by the National Key Research and Development Program of China (2017YFD0301501) and the National Key R&D Program of China (2018YFD0301005).
Data Availability Statement
Data is contained within the article.
Conflicts of Interest
The authors declare that the research was conducted without any commercial or financial relationships that could be construed as a potential conflict of interest.
References
- Khush, G.S. What it will take to feed 5.0 billion rice consumers in 2030. Plant Mol. Biol. 2005, 59, 1–6. [Google Scholar] [CrossRef] [PubMed]
- Hu, K.M.; Qiu, D.Y.; Shen, X.L.; Li, X.H.; Wang, S.P. Isolation and manipulation of quantitative trait loci for disease resistance in rice using a candidate gene approach. Mol. Plant 2008, 1, 786–793. [Google Scholar] [CrossRef] [PubMed]
- Liu, X.; Wang, H.; Zhou, J.; Hu, F.; Zhu, D.; Chen, Z.; Liu, Y. Effect of N fertilization pattern on rice yield, N use efficiency, and fertilizer–N fate in the Yangtze River Basin, China. PloS ONE 2016, 11, e0166002. [Google Scholar] [CrossRef]
- Wu, K.; Ali, I.; Xie, H.; Ullah, S.; Iqbal1, A.; Wei, S.; He, L.; Huang, Q.; Wu, X.; Cheng, F.; et al. Impact of fertilization with reducing nitrogen and phosphorous application on rice growth, yield, and biomass accumulation (Oryza sativa L.) under a dual cropping system. PeerJ 2021, 9, e11668. [Google Scholar] [CrossRef]
- Yi, J.; Gao, J.P.; Zhang, W.Z.; Zhao, Y.Z.; Xin, W. Delayed timing of tillering fertilizer improved grain yield and nitrogen use efficiency in Japonica rice. Crop Sci. 2020, 60, 1021–1033. [Google Scholar] [CrossRef]
- Ladha, J.K.; Jat, M.L.; Stirling, C.M.; Chakraborty, D.; Pradhan, P.; Krupnik, T.J.; Sapkota, T.B.; Pathak, H.; Rana, D.S.; Tesfaye, K.; et al. Achieving the sustainable development goals in agriculture: The crucial role of nitrogen in cereal-based systems. Adv. Agron. 2020, 16, 39–116. [Google Scholar] [CrossRef]
- Tayefeh, M.; Sadeghi, S.M.; Noorhosseini, S.A.; Bacenetti, J.; Damalas, C.A. Environmental impact of rice production based on nitrogen fertilizer use. Environ. Sci. Pollut. Res. 2018, 25, 15885–15895. [Google Scholar] [CrossRef]
- Zhou, C.; Jia, B.; Wang, S.; Huang, Y.; Wang, Y.; Han, K.; Wang, W. Effects of nitrogen fertilizer applications on photosynthetic production and yield of japonica rice. Int. J. Plant Prod. 2021, 15, 599–613. [Google Scholar] [CrossRef]
- Zhang, W.; Wu, L.; Wu, X.; Ding, Y.; Li, G.; Li, J.; Weng, F.; Liu, Z.; Tang, S.; Ding, C.; et al. Lodging resistance of japonica rice (Oryza sativa L.): Morphological and anatomical traits due to top-dressing nitrogen application rates. Rice 2016, 9, 1–11. [Google Scholar] [CrossRef]
- Mi, W.; Yang, X.; Wu, L.; Ma, Q.; Liu, Y.; Zhang, X. Evaluation of nitrogen fertilizer and cultivation methods for agronomic performance of rice. Agron. J. 2016, 108, 1907–1916. [Google Scholar] [CrossRef]
- Jiang, Z.; Zhong, Y.; Yang, J.; Wu, Y.; Li, H.; Zheng, L. Effect of nitrogen fertilizer rates on carbon footprint and ecosystem service of carbon sequestration in rice production. Sci. Total Environ. 2019, 670, 210–217. [Google Scholar] [CrossRef] [PubMed]
- Kaysar, M.S.; Sarker, U.K.; Monira, S.; Hossain, M.A.; Somaddar, U.; Saha, G.; Hossain, S.F.; Mokarroma, N.; Chaki, A.K.; Bhuiya, M.S.U.; et al. Optimum nitrogen application acclimatizes root morpho-physiological traits and yield potential in rice under subtropical conditions. Life 2022, 12, 2051. [Google Scholar] [CrossRef] [PubMed]
- Xu, C.M.; Zhou, C.N.; Zheng, G.S.; Wang, D.Y.; Zhao, F.; Zhu, X.D.; Zhang, X.F. Effects of nitrogen fertilizer application and densities on non-structural carbohydrates accumulation distribution and quality of super late rice tianyouhua zhan. J. Agric. Sci. Technol. 2010, 12, 86–91. [Google Scholar]
- Pan, J.F. Effects of Nitrogen Treatments on Characteristics of Accumulation and Translocation of Nonstructural Carbohydrates in Stems and Their Genetic Basis; Huazhong Agricultural University: Wuhan, China, 2010. [Google Scholar]
- Deng, F.; Wang, L.; Mei, X.F.; Li, S.X.; Pu, S.L.; Ren, W.J. Polyaspartate urea and nitrogen management affect nonstructural carbohydrates and yield of rice. Crop Sci. 2016, 56, 3272–3285. [Google Scholar] [CrossRef]
- Zhou, S.; Liu, K.; Zhuo, X.; Wang, W.; Zhang, W.; Zhang, H.; Gu, J.; Yang, J.; Liu, L. Optimizing nitrogen regime improves dry matter and nitrogen accumulation during grain filling to increase rice yield. Agronomy 2023, 13, 1983. [Google Scholar] [CrossRef]
- Li, G.; Hu, Q.; Shi, Y.; Cui, K.; Nie, L.; Huang, J.; Peng, S. Low nitrogen application enhances starch-metabolizing enzyme activity and improves accumulation and translocation of non-structural carbohydrates in rice stems. Front. Plant Sci. 2018, 9, 1128. [Google Scholar] [CrossRef]
- Ding, J.; Li, F.; Xu, D.; Wu, P.; Zhu, M.; Li, C.; Zhu, X.; Chen, Y.; Guo, W. Tillage and nitrogen managements increased wheat yield through promoting vigor growth and production of tillers. Agron. J. 2021, 113, 1640–1652. [Google Scholar] [CrossRef]
- Zhou, W.; Yan, F.; Chen, Y.; Ren, W. Optimized nitrogen application increases rice yield by improving the quality of tillers. Plant Prod. Sci. 2022, 25, 311–319. [Google Scholar] [CrossRef]
- Zhao, C.; Liu, G.; Chen, Y.; Jiang, Y.; Shi, Y.; Zhao, L.; Liao, P.; Wang, W.; Xu, K.; Dai, Q.; et al. Excessive Nitrogen Application Leads to Lower Rice Yield and Grain Quality by Inhibiting the Grain Filling of Inferior Grains. Agriculture 2022, 12, 962. [Google Scholar] [CrossRef]
- Cong, X.H.; Shi, F.Z.; Ruan, X.M.; Luo, Y.X.; Ma, T.C.; Luo, Z.X. Effects of nitrogen fertilizer application rate on nitrogen use efficiency and grain yield and quality of different rice varieties. J. Appl. Ecol. 2017, 28, 1219–1226. [Google Scholar] [CrossRef]
- Guo, X.; Jiang, H.; Lan, Y.; Wang, H.; Xu, L.; Yin, D.; Zheng, G.; Lv, Y. Optimization of nitrogen fertilizer management for improving rice grain yield and nutrient accumulation and mobilization in saline-alkaline soils. Crop Sci. 2020, 60, 2621–2632. [Google Scholar] [CrossRef]
- Zou, J.; Xu, H.; Lan, C.; Qin, B.; Li, J.; Nyimbo, W.J.; Lin, H.; Pang, Z.; Fallah, N.; Guo, C.; et al. Regulation of photoassimilate transportation and nitrogen uptake to decrease greenhouse gas emissions in ratooning rice with higher economic return by optimized nitrogen supplies. Field Crops Res. 2024, 312, 109385. [Google Scholar] [CrossRef]
- Yu, A.H.; Long, J. Keeping the rice bowl firmly in your own hands. Guang Ming Daily, 22 March 2021; p. 005. [Google Scholar]
- Xu, C.J.; Chen, W.J.; Chen, K.S.; Zhang, S.L. A Simple Method for Determining the Content of Starch-Iodine Colorimety. Biotechnology 1998, 2, 41–43. [Google Scholar]
- Zhong, Y.; Wang, X.P.; Yang, J.P.; Zhao, X.; Ye, X.Y. Exploring a suitable nitrogen fertilizer rate to reduce greenhouse gas emissions and ensure rice yields in paddy fields. Sci. Total Environ. 2016, 565, 420–426. [Google Scholar] [CrossRef] [PubMed]
- Azarpour, E.; Moraditochaee, M.; Bozorgi, H.R. Effect of nitrogen fertilizer management on growth analysis of rice cultivars. Int. J. Biosci. 2014, 4, 35–47. [Google Scholar]
- Peng, J.F.; Liu, T.T.; Xu, G.L.; Feng, Y.H.; Wang, X.K.; Li, J.; Luo, Q.X.; Somsana, P.; Han, Z.L.; Lu, W. Response of leaf photosynthetic characteristics, photosynthetic nitrogen utilization efficiency, and yield to different nitrogen application rates in super hybrid rice. Chin. Rice 2021, 27, 30–36. [Google Scholar] [CrossRef]
- Ma, S.; Wang, G.; Su, S.; Lu, J.W.; Ren, T.; Cong, R.H.; Lu, Z.F.; Zhang, Y.Y.; Liao, S.P.; Li, X.K. Effects of optimized nitrogen fertilizer management on the yield, nitrogen uptake, and ammonia volatilization of direct-seeded rice. J. Sci. Food Agric. 2023, 103, 4553–4561. [Google Scholar] [CrossRef] [PubMed]
- He, X.E.; Zhu, H.J.; Shi, A.L.; Wang, X.H. Optimizing nitrogen fertilizer management enhances rice yield, dry matter, and nitrogen use efficiency. Agronomy. 2024, 14, 919. [Google Scholar] [CrossRef]
- Zhang, H.C.; Wu, G.C.; Dai, Q.G.; Huo, Z.Y.; Xu, K.; Gao, H.; Wei, H.Y.; Lu, X.T.; Wan, L.J.; Huang, Y.Z. Accurate backward migration of rice nitrogen fertilizer and its mechanism. Journal of Crops 2011, 37, 1837–1851. [Google Scholar]
- Mahajan, G.; Chauhan, B.S.; Gill, M.S. Optimal nitrogen fertilization timing and rate in dry-seeded rice in Northwest India. Agron. J. 2011, 103, 1676–1682. [Google Scholar] [CrossRef]
- Sun, Z.G.; Wang, B.X.; Yang, B.; Xu, B.; Xing, Y.G.; Bello, B.K.; Xu, D.Y. The effect of nitrogen application rate on nitrogen utilization efficiency and agronomic traits of different rice varieties. Jiangxi Agric. J. 2019, 31, 23–28. [Google Scholar]
- Wu, H.; Xiang, J.; Zhang, Y.; Zhang, Y.K.; Peng, S.B.; Chen, H.Z.; Zhu, D.F. Effects of post-anthesis nitrogen uptake and translocation on photosynthetic production and rice yield. Sci Rep. 2018, 8, 12891. [Google Scholar] [CrossRef] [PubMed]
- Bao, Y.; Huang, L.; Li, Y.; Wang, M.M.; Liang, Z.W. How different nitrogen application rates affect yield composition and nitrogen uptake of rice (oryza sativa l.) in a saline-sodic paddy field. Pol. J. Environ. Stud. 2019, 28, 553–564. [Google Scholar] [CrossRef] [PubMed]
- Deng, F.; Wang, L.; Ren, W.J.; Mei, X.F.; Li, S.X. Optimized nitrogen managements and polyaspartic acid urea improved dry matter production and yield of indica hybrid rice. Soil Tillage Res. 2015, 145, 1–9. [Google Scholar] [CrossRef]
- Xu, M.; Wang, H.P.; Yin, G.D.; Zhou, P.N.; Zhang, Y.J.; Su, Z.F.; Xu, N.X. The effect of panicle fertilizer application period on rice yield and population quality. Jiangsu Agric. Res. 2000, 02, 36–40. [Google Scholar]
- Lu, J.; Shan, L.; Gao, J. Mobilization and distribution of carbon assimilates of wheat under water deficits. Acta Agric. Nucleatae Sin. 2002, 16, 228–231. [Google Scholar]
- Zhang, J.H.; Li, J.L.; Zhang, J.B.; Zhao, F.T.; Cheng, Y.N.; Wang, W.P. Effects of nitrogen application rates on translocation of dry matter and nitrogen utilization in rice and wheat. Acta Agron. Sin. 2010, 36, 1736–1742. [Google Scholar] [CrossRef]
- Abdalla basyouni Abou-khalifa, A.; Misra, A.N.; Salem, A.E.A.K. Effect of leaf cutting on physiological traits and yield of two rice cultivars. Afr. J. Plant Sci. 2008, 2, 147–150. [Google Scholar]
- Deng, F.; Wang, L.; Liu, L.; Liu, D.Y.; Ren, W.J.; Yang, W.Y. Effect of cultivation methods on dry matter production and yield of rice under different ecological conditions. J. Crop Sci. 2012, 38, 1930–1942. [Google Scholar] [CrossRef]
- He, J.; Cui, Y.L.; Zhang, D.P.; Zheng, C.J.; Wang, J.Z.; Shi, W.D. Characteristics of dry matter accumulation and distribution in rice under different water fertilizer coupling conditions. J. Irrig. Drain. 2010, 5, 1–5. [Google Scholar]
- Xiong, Q.; Tang, G.; Zhong, L.; He, H.; Chen, X. Response to nitrogen deficiency and compensation on physiological characteristics, yield formation, and nitrogen utilization of rice. Front. Plant Sci. 2018, 9, 1075. [Google Scholar] [CrossRef] [PubMed]
- Hou, W.; Tränkner, M.; Lu, J.; Yan, J.; Huang, S.; Ren, T.; Cong, R.; Li, X. Interactive effects of nitrogen and potassium on photosynthesis and photosynthetic nitrogen allocation of rice leaves. BMC Plant Biol. 2019, 19, 1–13. [Google Scholar] [CrossRef] [PubMed]
- Yang, J.; Zhang, J. Approach and mechanism in enhancing the remobilization of assimilates and grain-filling in rice and wheat. Chin. Sci. Bull. 2018, 63, 2932–2943. [Google Scholar] [CrossRef]
- Gu, X.; Bai, W.; Li, J.; Kong, D.; Liu, J.; Wang, Y. Spatio-temporal changes and their relationship in water resources and agricultural disasters across China. Hydrol. Sci. J. 2019, 64, 490–505. [Google Scholar] [CrossRef]
Disclaimer/Publisher’s Note: The statements, opinions and data contained in all publications are solely those of the individual author(s) and contributor(s) and not of MDPI and/or the editor(s). MDPI and/or the editor(s) disclaim responsibility for any injury to people or property resulting from any ideas, methods, instructions or products referred to in the content. |
© 2024 by the authors. Licensee MDPI, Basel, Switzerland. This article is an open access article distributed under the terms and conditions of the Creative Commons Attribution (CC BY) license (https://creativecommons.org/licenses/by/4.0/).