Article

Utilization of Diversified Cover Crops as Green Manure-Enhanced Soil Organic Carbon, Nutrient Transformation, Microbial Activity, and Maize Growth

1
Department of Agrochemistry, Soil Science, Microbiology and Plant Nutrition, Faculty of AgriSciences, Mendel University in Brno, 613 00 Brno, Czech Republic
2
Guangdong Provincial Key Laboratory of Applied Botany, South China Botanical Garden, Chinese Academy of Sciences, Guangzhou 510650, China
3
Agricultural Research, Ltd., 664 41 Troubsko, Czech Republic
4
Department of Botany and Microbiology, College of Science, King Saud University, Riyadh 11451, Saudi Arabia
5
Agrovyzkum Rapotin, Ltd., Vyzkumniku 863, 788 13 Rapotin, Czech Republic
6
Institute of Soil and Environmental Sciences, University of Agriculture, Faisalabad 38040, Pakistan
*
Author to whom correspondence should be addressed.
Agronomy 2024, 14(9), 2001; https://doi.org/10.3390/agronomy14092001
Submission received: 19 July 2024 / Revised: 22 August 2024 / Accepted: 27 August 2024 / Published: 2 September 2024

Abstract

:
Studying green manure in several returning methods to enhance soil fertility and crop benefits is a strong foundation for cropland nutrient management. However, how different types of green manures and their variable doses affect the efficacy of applied manures, either buried or mulched, remain overlooked. The objective of this study was to optimize green manure management to enhance soil fertility and maize biomass using five types of green manures (white mustard, forest rye, fiddleneck, sufflower, and pea) in two different doses (low, 5 g per pot, and high, 10 g per pot), which were either buried or mulched before and after maize sowing. Results revealed that total carbon content increased due to green manure treatments, representing a 10% increase over control, particularly through buried w. mustard (10% increase before maize cultivation) and mulched safflower and pea (12% and 11% increase after maize cultivation over control). Dry maize aboveground biomass yields also improved across all variants, with buried mustard yielding 18.4 g·plant−1 (compared to 8.6 g·plant−1 in the control), mulched mustard yielding 16.4 g·plant−1, and buried pea yielding 17.8 g·plant−1. Green mulching generally acidified the soil (pH 5.71 compared to 6.21 in the control), except for buried fiddleneck (pH 6.39 after maize cultivation) at a high dose of manures. Carbon-mineralizing enzyme activities (dehydrogenase and β-glucosidase) were significantly increased by green manures, with buried fiddleneck showing a 22.6% and 20.6% increase over the control, and mulched fiddleneck showing a 24.5% and 22.4% increase under high doses. The study suggests that partially decomposed and mineralized mulched biomass may induce a negative priming effect on carbon-mineralizing enzymes due to a decrease in the C/N ratio of the soil. It emphasizes that the nutrient content and stoichiometry of green manures, alongside soil characteristics such as the C/N ratio, are critical factors for sustainable soil management and carbon sequestration. These findings underscore the need for careful selection and management of green manures to optimize soil health and carbon-storage outcomes.

1. Introduction

In agriculture, cover cropping involves growing plants to cover soil without harvesting, utilizing them as green manure or mulch. This practice offers economic benefits [1] and ecological services, such as mitigating the negative impacts of tillage on soil health and plant productivity [2,3]. In addition, cover cropping improves biomass production [4], consequently promoting the formation of soil organic matter (SOM) [5,6] and enhancing the physical, biological, and chemical properties of the soil [7,8,9].
The effect of cover crops depends on both intrinsic factors, such as soil and weather conditions, and extrinsic factors related to cover crop management. It also hinges on the quantity and quality of the residues themselves [3]. While the concept of cover crops is simple, successful implementation depends on effective management, including the use of green manure procedures. Green manures are cover crops incorporated into the soil to maximize their various agricultural benefits [2,10]. These benefits of green manure application include increased content of organic matter (OM) [11], higher organic carbon (OC) content compared to other manure types [12], increased nitrogen fixation [13,14], protection of the soil surface [15] and erosion prevention [16], improved soil structure [17], reduced susceptibility to nutrient leaching [10], and the provision of readily available nutrients to the next crop [18]. Furthermore, green manure offers additional benefits, such as its impact on soil ecology, including enhanced biological activity in the soil [19,20], changes in microbial biodiversity towards beneficial taxa [21,22], and protective activity such as the presence of biotoxic compounds found in Brassica species that act as fumigant chemicals against plant-parasitic nematodes when plant cells are raptured and incorporated into the soil [23].
Several factors influence the effectiveness and associated impacts of green manure, including the pre-application management of cover crop biomass. Cover crops can be either readily incorporated into the soil through tillage [19,24,25,26] or mulched after mowing before introduction into the soil [27,28,29]. One significant difference between these two distinct approaches to cover crop management (mulching or burying of the biomass) is the rate of nutrient transformation and their entry into the soil nutrient cycle. However, this rate is also affected by the concurrent impact of either no-till (with soil surface protection via mulching) or tillage events on soil integrity and related physico–chemical changes.
Green manure mulching is beneficial for nutrient retention, enzymatic activity [30], and the availability of soil nutrients, such as phosphorus (P) [31] and soil organic carbon content [32]. When applied together with reduced tillage, it can provide sustainable crop yields and improved soil porosity [33]. Nevertheless, green manure pre-mulching, along with increased crop biomass accumulation [29,34,35], may contribute to environmentally adverse nutrient losses [28,29,35].
On the contrary, the direct incorporation of green manure rapidly increases the release of nutrients from the buried plant biomass [26,36,37,38], leading to a noticeable improvement in crop yield [26,36,39,40] due to improved soil fertility. Under these conditions, the short-term use efficiency of nutrients [37] and enzymatic activity also improves [41]. Studies comparing and contrasting the varied effects of either mulching or burying preceding green manuring of plant biomass have recently been published [32,42,43]. However, there are still research gaps in understanding how cover crop green manure specifically impacts soil fertility and alters its properties depending on the pre-incorporation biomass management, except for a few reports [31,44].
Therefore, a pot experiment was conducted under controlled conditions using soil with a moderate SOM content. The soil was amended with various cover crops used as green manure, which was either mulched before introduced into the soil or buried immediately after harvest. Subsequently, this soil was sown and cultivated with maize (Zea mays L.). In particular, we used white mustard, perennial forest rye, fiddleneck, safflower, and pea stems as green manure. Mustard belongs to the brassica family, and as a cover crop, it is used mainly for its biofumigant characteristics due to a high content of glucosinolates [45]. Forest rye is used as a winter cover crop for scavenging nitrogen and because it rapidly produces a ground cover that holds soil in place against the forces of wind and water while suppressing weed growth. Fiddleneck, a member of the borage family, is used as a cover crop mainly due to its ability to fix nitrogen, although it is not as effective as legumes. Also, its growth can suppress weeds by outcompeting them for resources like sunlight, water, and nutrients [46]. Safflower is used mainly for weed suppression due to its rapid early growth. Pea belongs among leguminous plants that are known for their ability to form symbiotic relationships with nitrogen-fixing bacteria in their root nodules, allowing them to convert atmospheric nitrogen into a form that can be used by plants for growth [47].
This study aimed to assess how these experimental conditions affected maize yield, soil pH, and various soil chemical and biological soil traits related to carbon mineralization. The following hypotheses were tested:
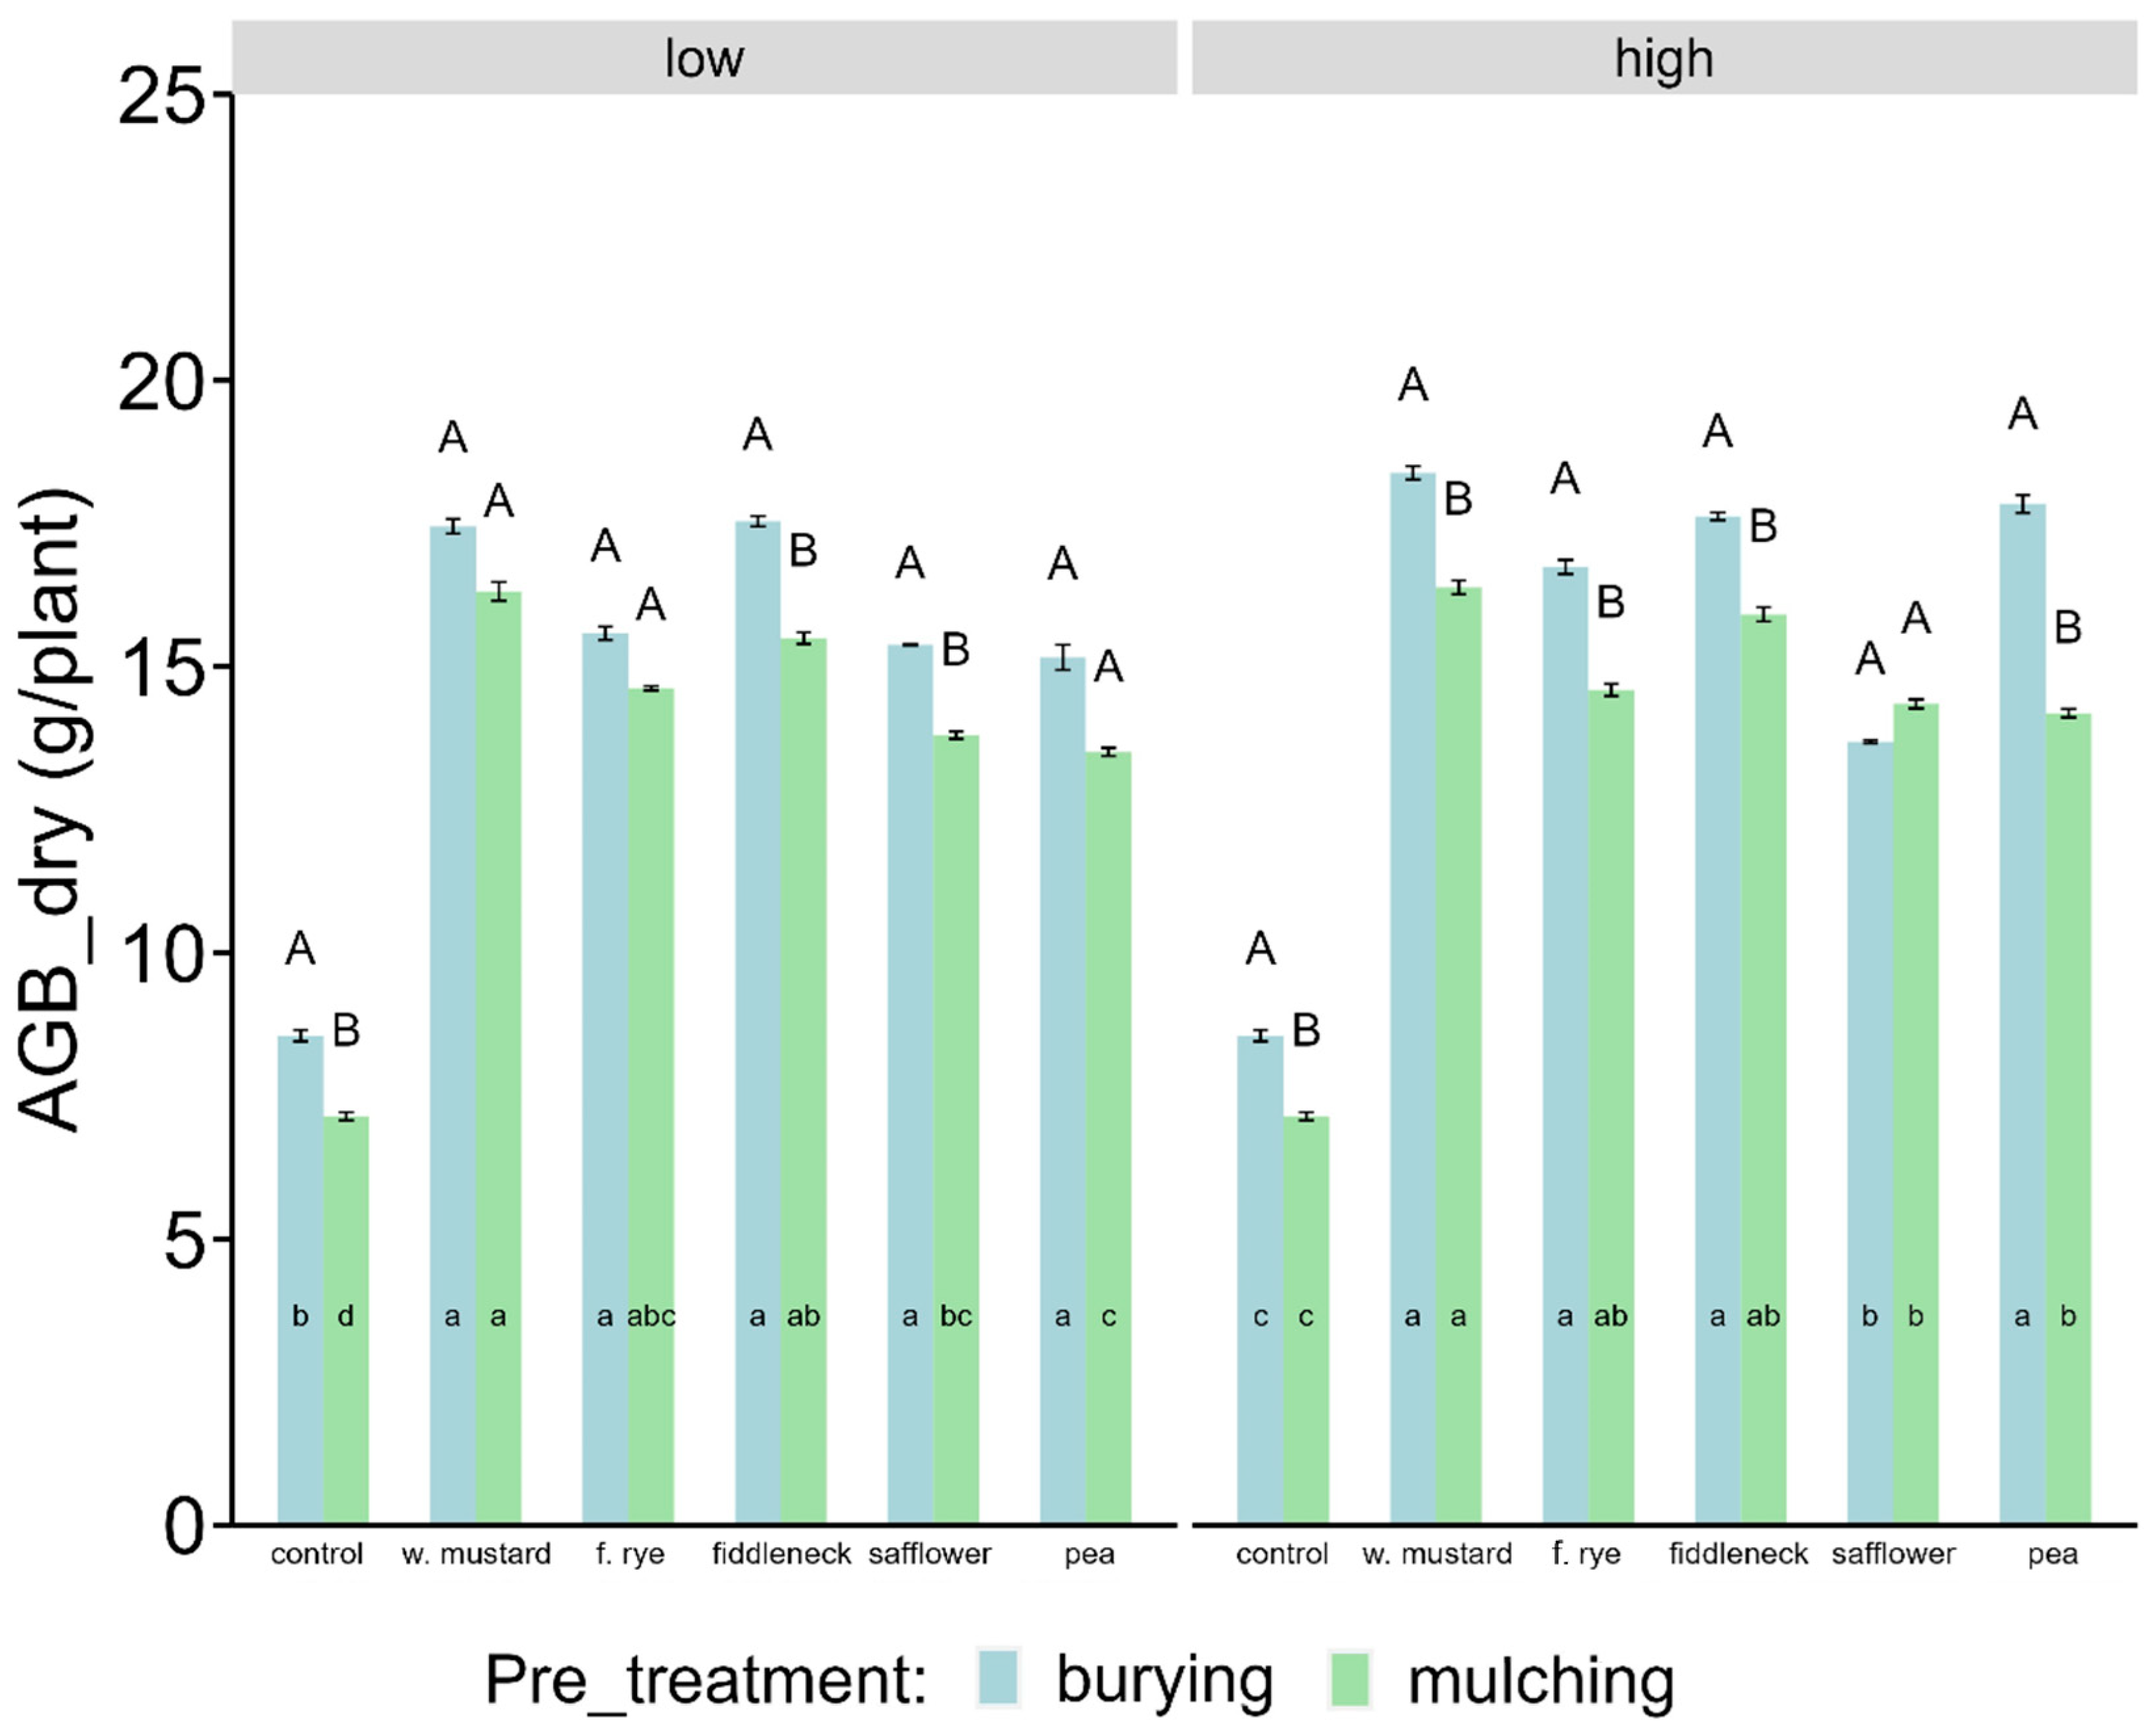
  • Green manuring limited to the incorporation of solely aboveground biomass (without roots) of cover crops increases the dry maize biomass compared to untreated soil, regardless of the pre-treatment (both after burying or mulching).
  • The type of cover crop and its nutrient characteristics determine the yield of dry maize biomass. For example, N-rich biomass may derive a higher yield than others.
  • The pre-treatment of green-manured cover crop biomass determines the differences (between burying and mulching) in the soil organic carbon mineralization.

2. Materials and Methods

2.1. Soil Collection and Properties

The soil used for the pot experiment was at the Experimental Field of Mendel University in Žabčice, Czechia. Žabčice is located in the South Moravian region (49°0′42″ N, 16°36′9″ E), approximately 25 km from the town of Brno, with an altitude of 180 m above sea level. The experimental soil was classified as Gleyic Fluvisol Clayic, heavily textured with medium organic carbon content (Table 1). Coarse particles were removed from soil by sieving through a mesh (Retsch GmbH, Haan, Germany) to obtain a homogenized material with particle size ≤ 2 mm.

2.2. Preparation, Procurement, and Composition of Green Manure Biomass

The fresh biomass of six various crops for green manuring, such as white mustard, (Sinapis alba L.) according to the BBCH scale 75; 50% of fruits have reached final size, perennial forest rye (Secale cereale L. var. multicaule Metzg. ex Alef.), according to the BBCH scale 29; end of tillering, nine or more tillers visible, fiddleneck (Phacelia tanacetifolia Benth.), according to the BBCH 62; 20% of flowers open, safflower (Carthamus tinctorius L.), according to the BBCH 37; stems reached 70% final length, pea (Pisum sativum L.), according to the BBCH 65; full flowering, 50% of flowers open, was grown and harvested on 23 November 2021, on fields near the locality Nová Ves (49°5′54.5922″ N, 16°18′49.9788″ E), South Moravia District, Czech Republic, Central Europe. The experimental areas were located in beet production area; the geological basis is loess and loess clay of the Czech massif; a smaller part of the territory consists of calcareous clay with sands, falling into the Carpathian system. The soil type is modal brown soil. The pre-crop for the experimental fields was winter wheat (Triticum aestivum L.). After the wheat harvest, the subsoil was tilled to a depth of 8 cm, together with shallow incorporation of the post-harvest residues into the upper soil layer. Cover crops were sown on 16 August, 2021, using a sowing machine AMAZONE AD-P Special 3000 (Amazonenwerk. Hasbergen, Germany). Sowing doses were as follows: white mustard 10 kg·ha−1, rye 100 kg·ha−1, safflower 30 kg·ha−1, fiddleneck 12 kg·ha−1, and peas 110 kg·ha−1.
In order to (gravimetrically) determine dry mass of each green manure crop, the plant samples were dried at 60 °C to the constant weight and weighed. The chemical and nutritional composition of green manures was determined as follows: lignin (ADL content) was measured in accordance with [51], cellulose content was calculated as a difference between acid detergent fibre (ADF) and ADL [52], and hemicellulose was determined as a difference between neutral detergent fibre (NDF) and ADF [53] on the ANKOM 200 Fibre Analyser (ANKOM Technology, Macedon, NY, USA). The content of sugars (reducing saccharides) was determined using the Luf–Schoorl method [54,55]; ash content was determined according to [56]; content of lipids was determined gravimetrically using the water-cooled Soxhlet extractor BEHR 6 (Behr Labor–Technik GmbH, Düsseldorf, Germany) by direct sample extraction with diethyl ether [57]. The carbon content (C) in green manure was determined by CNH analyzer [58]; nitrogen (N) was determined by Kjeldahl method according to [59]; all other nutrients (P, K, Ca, Mg) were determined after mineralization by AAS (Atomic Absorption Spectrometer Agilent 55B, Agilent Technologies, Santa Clara, CA, USA) [60].

2.3. Plant Growth Experiment and Treatment Description

Plant growth experiments were performed in a covered vegetation hall at Mendel University in Brno. Sieved and homogenized soil (1.8 kg) was placed in experimental plastic pots with a volume of 2 L (surface 171 cm2), with four replications of each experimental variant (Table 2). Fresh biomass from green manure crops, equivalent to 5 g (low dose, which equals 2.92 t·ha−1) or 10 g (high dose, which equals 5.84 t·ha−1) of dry plant mass per pot, was cut into pieces 0.5–1 cm in size and added to the respective pots. In half of the pots, the green manure was thoroughly mixed into the soil (referred to as “buried”), while in the other half, it was left on the soil surface (referred to as “mulched”). All pots prepared in this way were left over the winter for 5 months (start of December 2021 till the end of April 2022). In end of April 2022, the soil in each pot was thoroughly mixed to homogenize it in the buried variants and to incorporate the incubated green manure into the soil of the mulched variants. Soil from each pot was then sampled, sieved through a 2 mm mesh sieve, and subsampled for further analyses.
Each pre-incubated pot was sown with one plant of maize (Zea mays L.) and watered with 50 mL of distilled water. Soil moisture was controlled gravimetrically, and the water content was maintained (two-to-three times a week) at approximately 60% of the water-holding capacity (WHC) during the experiment. Specifically, 1 g of soil was regularly sampled, and the water content was determined gravimetrically. Accordingly, calculated volume of water was dosed to the pot to keep 60% of soil’s water-holding capacity. Pot placement was randomized during the whole experiment, and pots were rotated once a week to maintain homogeneity of growing conditions. The plants were harvested 12 weeks after sowing.
The maize shoots were cut off at ground level, and the roots were gently cleaned off of soil and washed with water. Shoots and roots were dried at 60 °C to constant weight, resulting in dry aboveground biomass (AGB_dry), and root biomass was determined gravimetrically by weighing on analytical scales. The mixed soil samples, collected from each pot at the end of pot experiment, were sieved through a 2 mm mesh sieve and subsampled for further analyses.

2.4. Soil Analyses

The air-dried subsample was used to determine pH(CaCl2) according to [61] and to determine total soil carbon (Ctot) and nitrogen (Ntot) using the Vario Macro Cube (Elementar Analysensysteme GmbH, Langenselbold, Germany) according to [48,49]. The 4 °C-stored samples were used for determination of dehydrogenase activity (DHA) using the 2,3,5-triphenyltetrazolium chloride (TTC) method [62]; results were expressed in µg TPF·g−1·h−1. Other enzyme activities (GLU, Phos Ure) were measured on freeze-dried samples spectrophotometrically according to [63]. Nitrophenyl derivates of natural substrates were used for the measurement of GLU, Phos (at an emission wavelength 405 nm) and urea served as a substrate for Ure (measured at a wavelength 650 nm), with values expressed in µmol NH3·g−1·min−1 (urease) and in µmol (p-nitrophenol) PNP·g−1·min−1. Further, the samples stored at 4 °C were used for D-glucose (Glc-IR) measurements. This analysis, using a MicroResp device according to the James Hutton Institute protocol, was based on the method established by [64] and on assay supplied with Glc-IR, followed by colorimetric indication of CO2 emissions, with values expressed in µg CO2·g−1·h−1.

2.5. Data Processing and Statistical Analyses

Data storage and basic data mining were conducted using the online version of Microsoft Excel 365. All statistical analyses were conducted using the R software, Version 4.3.2 [65]. For advanced data processing, the additional package “dplyr” was also used [66]. Package “ggplot2” [67], together with “scales” [66], “gridExtra” [68], and “ggthemes” [69], were used for creating advanced statistical graphs. Three-way analysis of variance (ANOVA), using a Type I (sequential) sum of squares at a 5% significance level [70], was also applied separately to the examined variants and soil depths. To discern differences among factor-level means between response and categorical variables following ANOVA and Tukey’s honestly significant difference (HSD) test was employed from package “agricolae” [71], also at a significance level of 0.05. The calculation of factor-level means with standard error of the mean (SEM) in relation to the examined variants was facilitated through the use of “treatment contrasts” [72]. In the case of PCA, the results were additionally presented graphically using Rohlf’s biplot for standardised PCA. For this purpose, packages “FactoMineR” [73] and “factoextra” [74] were used. Correlation analysis was performed to measure the linear dependence between soil properties. Pearson’s correlation coefficient (r) was interpreted as follows: 0.0 < r < 0.3 (negligible correlation), 0.3 < r < 0.5 (low correlation), 0.5 < r < 0.7 (moderate correlation), 0.7 < r < 0.9 (high correlation), 0.9 < r < 1.0 (very high correlation) [75]. Package “PerformanceAnalytics” [76] and “corrplot” [77] were used for creating correlograms. After conducting all statistical analyses, the assumptions of the selected models were also verified at a significance level of 0.05, employing various statistical tests and diagnostic plots [72,78].

3. Results

3.1. Nutritional and Biomass Characteristics of Green Manure

The nitrogen content in dry aboveground biomass (N_AGB) was significantly (p < 0.001) lowest in fiddleneck and the highest in forest rye (39.1 g·kg−1, increased by 69% over the fiddleneck value; Table 3). The phosphorus content (P_AGB) was the lowest (p < 0.001) in safflower and the highest in forest rye (4.4 g·kg−1, increased by 90%) again. The significantly (p < 0.001) lowest contents of potassium (K_AGB) and calcium (Ca_AGB) were observed in peas, while fiddleneck had the highest K_AGB (46 g·kg−1, increased by 76%) and Ca_AGB (22.7 g·kg−1, increased by 195%; Table 3). Mg_AGB was consistent across all green manures (GM), except for significantly increased (p < 0.001) safflower, higher by 32% (2.8 g·kg−1) over the lowest (in average) fiddleneck. The carbon content (C_AGB) showed no significant differences among all green manures. Nevertheless, forest rye tended to be the lowest and pea the highest (by 9%, 495 g·kg−1) C_AGB.
Pea green manure had significantly (p < 0.001) highest hemicellulose (223 g·kg−1, i.e., 15-fold increase compared to the lowest value of all GM), sugars (301 g·kg−1, i.e., 1.8-fold increase), and lipids (34.6 g·kg−1, i.e., increased by 76%), while lignin and cellulose were the highest in white mustard (values increased by 182% and 104%, i.e., 69.5 g·kg−1 and 199 g·kg−1, respectively). Conversely, safflower contained the lowest content of hemicellulose and sugar lipids, while forest rye contained the lowest content of lignin and fiddleneck contained the lowest content of cellulose (Table 3).
The strongest mutual Pearson’s correlation (Figure S1) showed K_AGB with Ca_AGB (p ≤ 0.001, r = 0.84), K_AGB with ash (p ≤ 0.001, r = 0.94), cellulose and hemicellulose with sugars with lipids (p ≤ 0.001, r varied from 0.71 to 0.75), and hemicellulose with sugars (p ≤ 0.001, r = 0.99). Hemicellulose, sugars, and lipids were negatively related to Ca_AGB (p ≤ 0.001, r varied from −0.83 to −0.90) and ash (p ≤ 0.001, r varied from −0.73 to −0.92).

3.2. Dry Aboveground Biomass of Maize

Soil green-manured crops (WM, R, F, S, P) with buried or mulched biomass at low or high doses (5 g or 10 g) significantly (p ≤ 0.05) increased maize AGB_dry compared to controls (CB, CM; Figure 1). The highest values showed WMHB and PHB (18.4 and 17.8 g·plant−1, increased by 115% and 109% over CB, respectively), as well as WMHM and FHM (16.4 and 15.9 g·plant−1, increased by 130% and 123% over CM, respectively).
Variants with buried biomass (FLB, SLB, WMHB, RHB, FHB, PHB) had significantly (p ≤ 0.05) higher AGB_dry than those with mulched biomass (FLM, SLM, WMHM, RHM, FHM, PHM) by 11% to 26%. AGB_dry values were dose-dependent in variants WMLB/WMHB and PLB/PHB. The highest AGB_dry values were observed in WMLB, FLB, WMHB, and PHB variants, while the lowest values were in SLM, PLM, SHM, and PHM.
The variants FLB, SLB, PLB, WMHB, RHB, FHB, and PHB (buried green manures) had significantly higher AGB_dry than FLM, SLM, PLM, WMHM, RHM, SHM, and PLM (mulched green manures). Maize AGB_dry values were directly dependent on the green manure dose in the case of w. mustard and pea (xxHB and xxHM higher by 5.4–17.7% and 0.4–5.0% than xxLB and xxLM, respectively). The green-manured variants SHB, SHM, and PLM (13.7, 14.4, 13.5 g·plant−1, respectively) showed the lowest AGB_dry (Figure 1). AGB_dry correlated positively with K_AGB (p ≤ 0.01, r = 0.53, Figure S1).

3.3. Soil pH(CaCl2)

The interaction of factors “Variant” and “Collection” (soil sampling before and after maize cultivation) were determined pH(CaCl2) to have significantly increased (p < 0.001; value 0.36 of ETA squared test = eta.sq.part). The pH(CaCl2) in the soil after maize cultivation significantly decreased as compared to values before the cultivation (two-way ANOVA, p < 0.001, Table S1), particularly decreasing the most in variants RLM_II (by 3.6% compared to RLM_I), RHM_II (by 5.4%), SHB_II (by 1.8%), and PLB_II (by 2.5%; Figure 2). On the contrary, variants with fiddleneck FLM_II and FHM_II increased in pH (CaCl2) after maize cultivation by 3.2% and 3.5% (compared to Collection I values), respectively. Thus, all low-dose buried green manures (except WMLB) before maize, and completely all five GMs after maize, decreased pH (CaCl2) compared to CB_I and CB_II. FHB_I and FHB_II variants (by 3%, both) increased pH (CaCl2) compared to CB_I and CB_II, whereas all other high-dose buried green manures before and after maize led to a decrease (Figure 2). The variants RLB_I and RLB_II (by 8.3%, 7.6%) and RHB_I and RHB_II (by 8.2%, 8.1%) decreased the most in comparison to CB_I or CB_II.
The low-dose mulched green manures before maize (except RLM_I) and after maize (except WMLM_II) decreased pH (CaCl2) compared to CM_I and CM_II, too. While WMHM_I, FHM_I, and PHM_I and WMHM_II, RHM_II, and PHM_II decreased, high-dose mulched green manures RHM_I and SHM_I before maize and FHM_II and SHM_II after maize were comparable to CM_I and CM_II (Figure 2). The variants PLM_I and PLM_II (by 7.5% and 8.2%) and FLM_I and RHM_II (by 6.4% and 7.5%) decreased the most in comparison to CB_I or CB_II.
The buried green manures RLB_I, RLB_II, and RHB_I and SLB_II, SHB_II, and WMLB_II significantly (p < 2.2 × 10⁻¹⁶) decreased pH (CaCl2) compared to mulched green manures RLM_I, RLM_II, and RHM_I and SLM_II, SHM_II, and WMLM_II. On the contrary, mulched green manures were more acidifying in the case of FLM_I, FHM_I, and FHM_II and PLM_I, PLM_II compared to FLB_I, FHB_I, and FHB_II and PLB_I and PLB_II (Figure 2).
The pH (CaCl2), was also indirectly dependent on green manure doses in the case of w. mustard: WMHB and WMHM were decreased compared to WMLB and WMLM before (by 5.3%, 4.3%) and after (by 3.0%, 3.6%) maize. The GMs’ fiddleneck and sufflower showed direct dependence of pH(CaCl2) on the green manure dose: FHB and FHM and SHB and SHM were decreased compared to FLB and FLM and SLB and SLM before (by 7.3%, 2.5% and 3.6%, 3.4%) and after (by 3.4%, 4.9% and 6.3%, 2.8%) maize (Figure 2). pH (CaCl2) correlated positively with dehydrogenase (DHA) before and after maize (p ≤ 0.001, r was 0.68 to 0.76) and negatively with N_AGB after maize (p ≤ 0.001, r = 0.65, Figure S1).

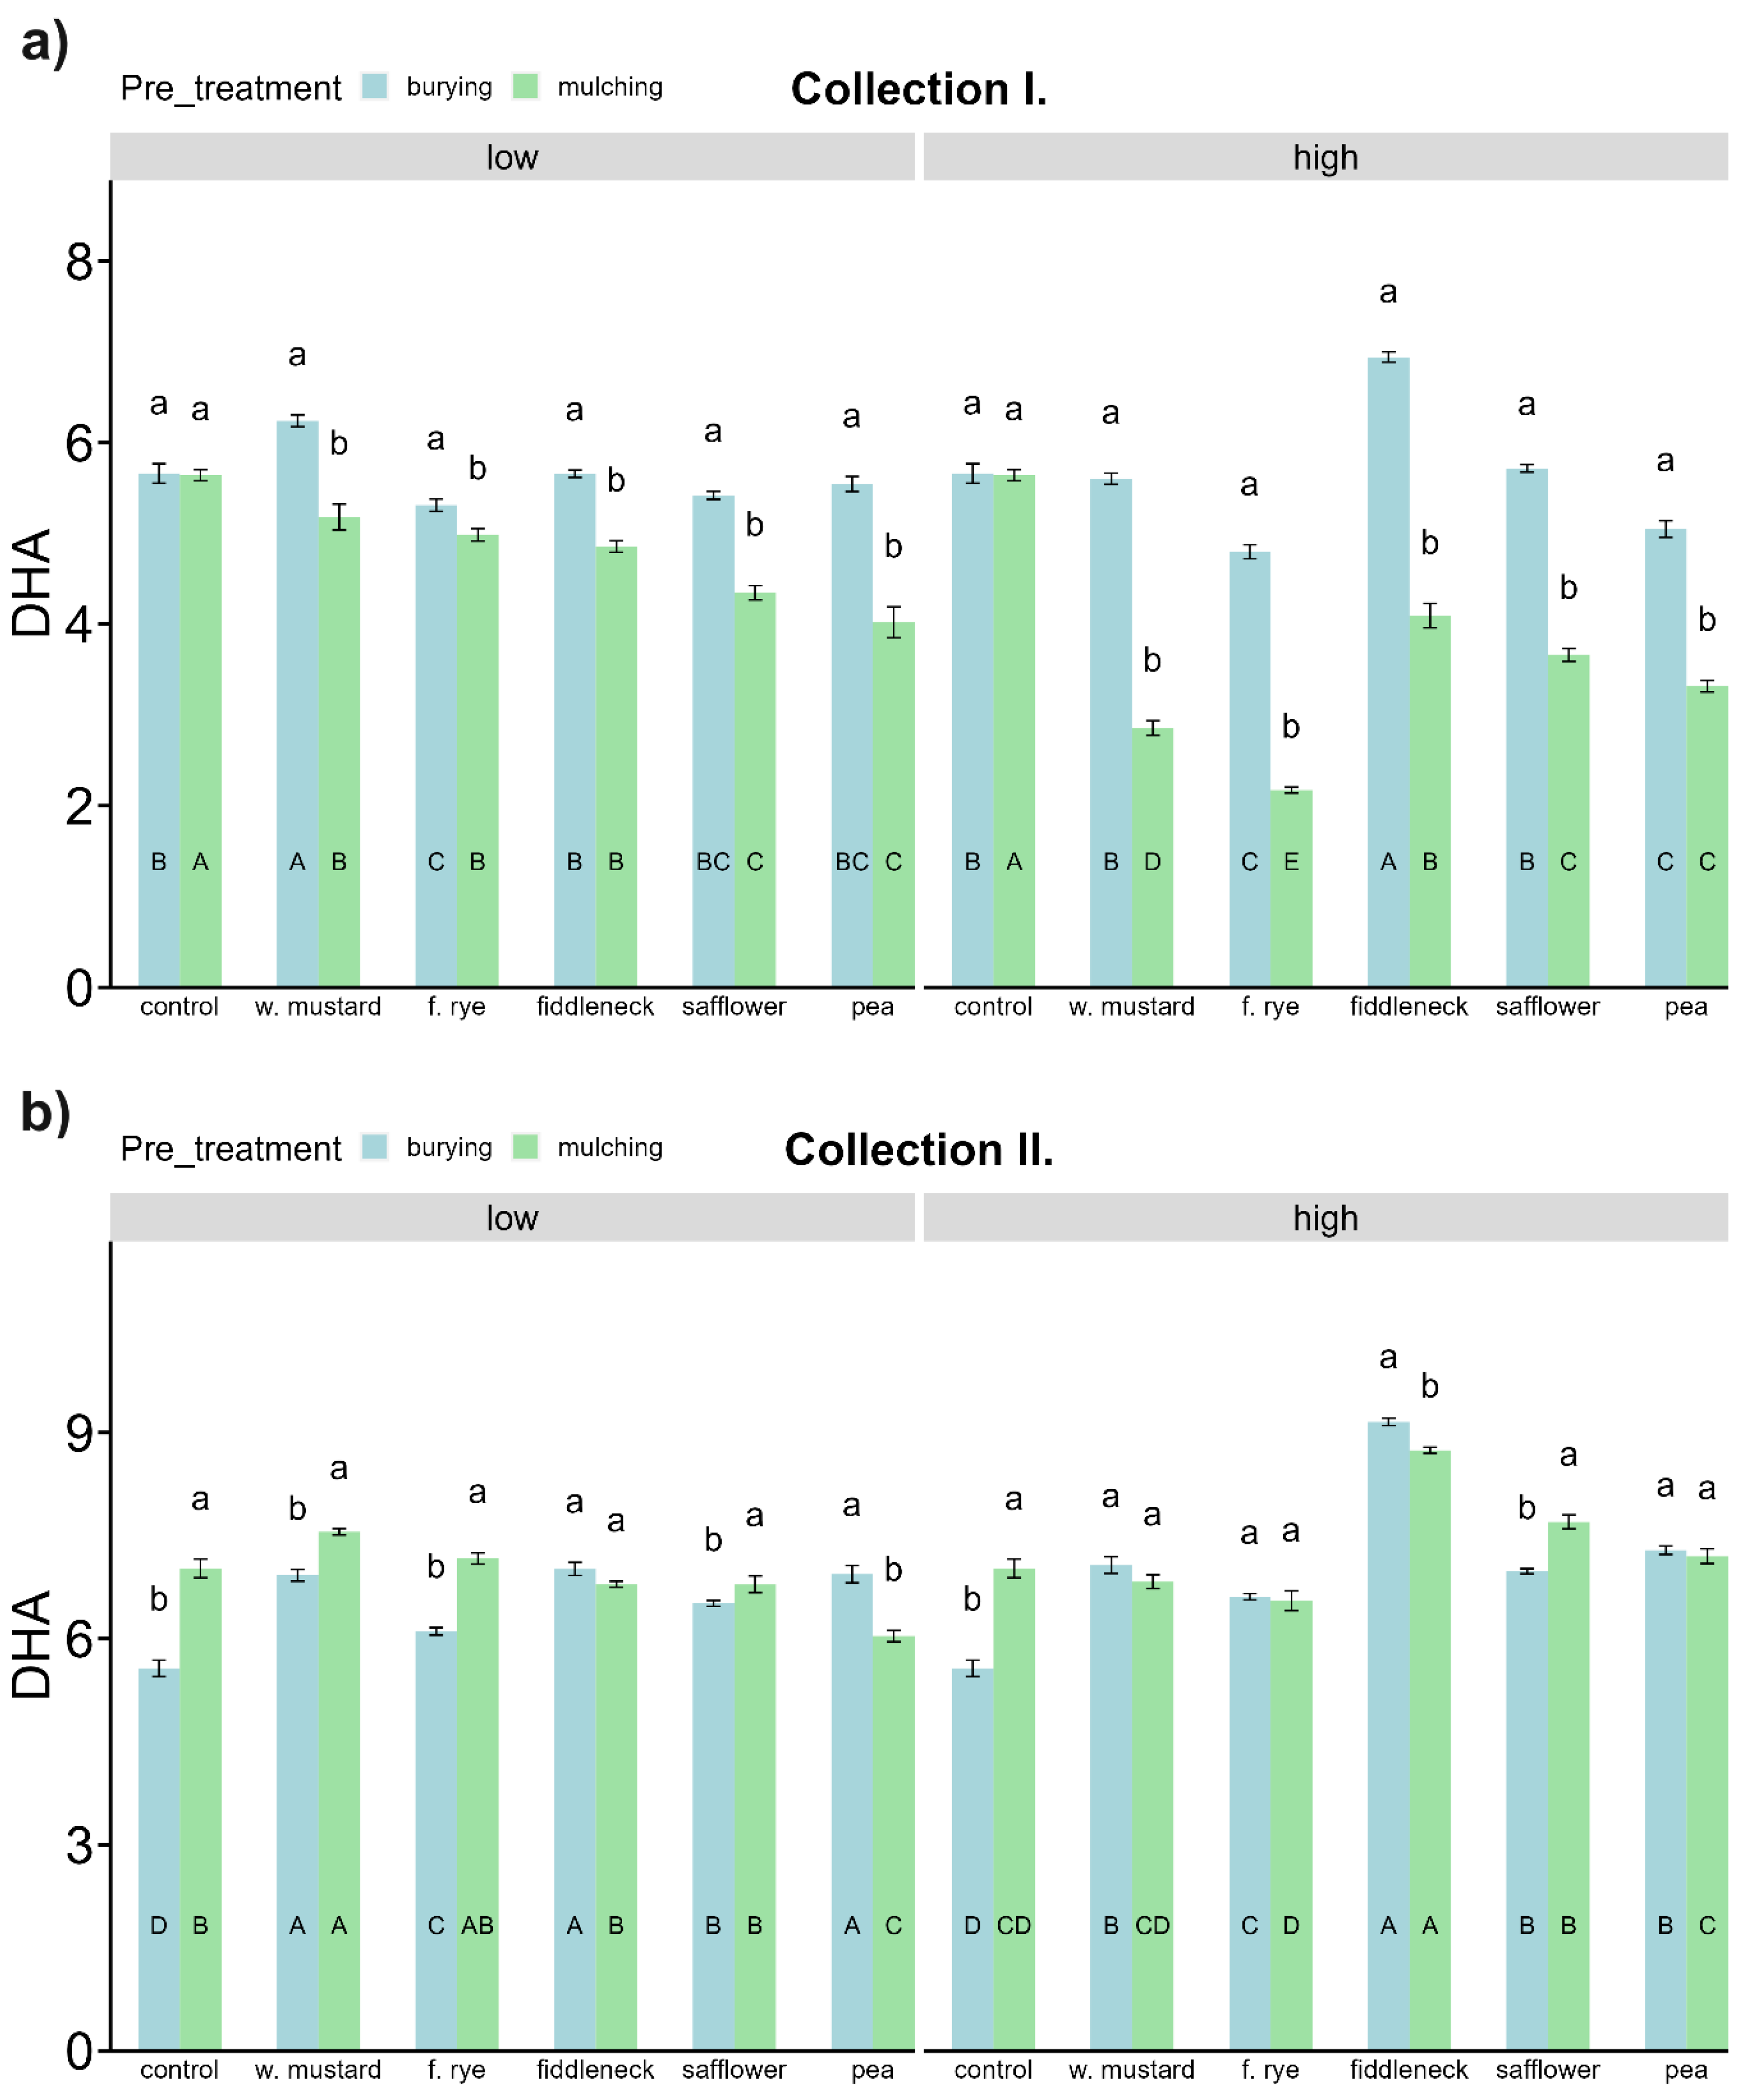
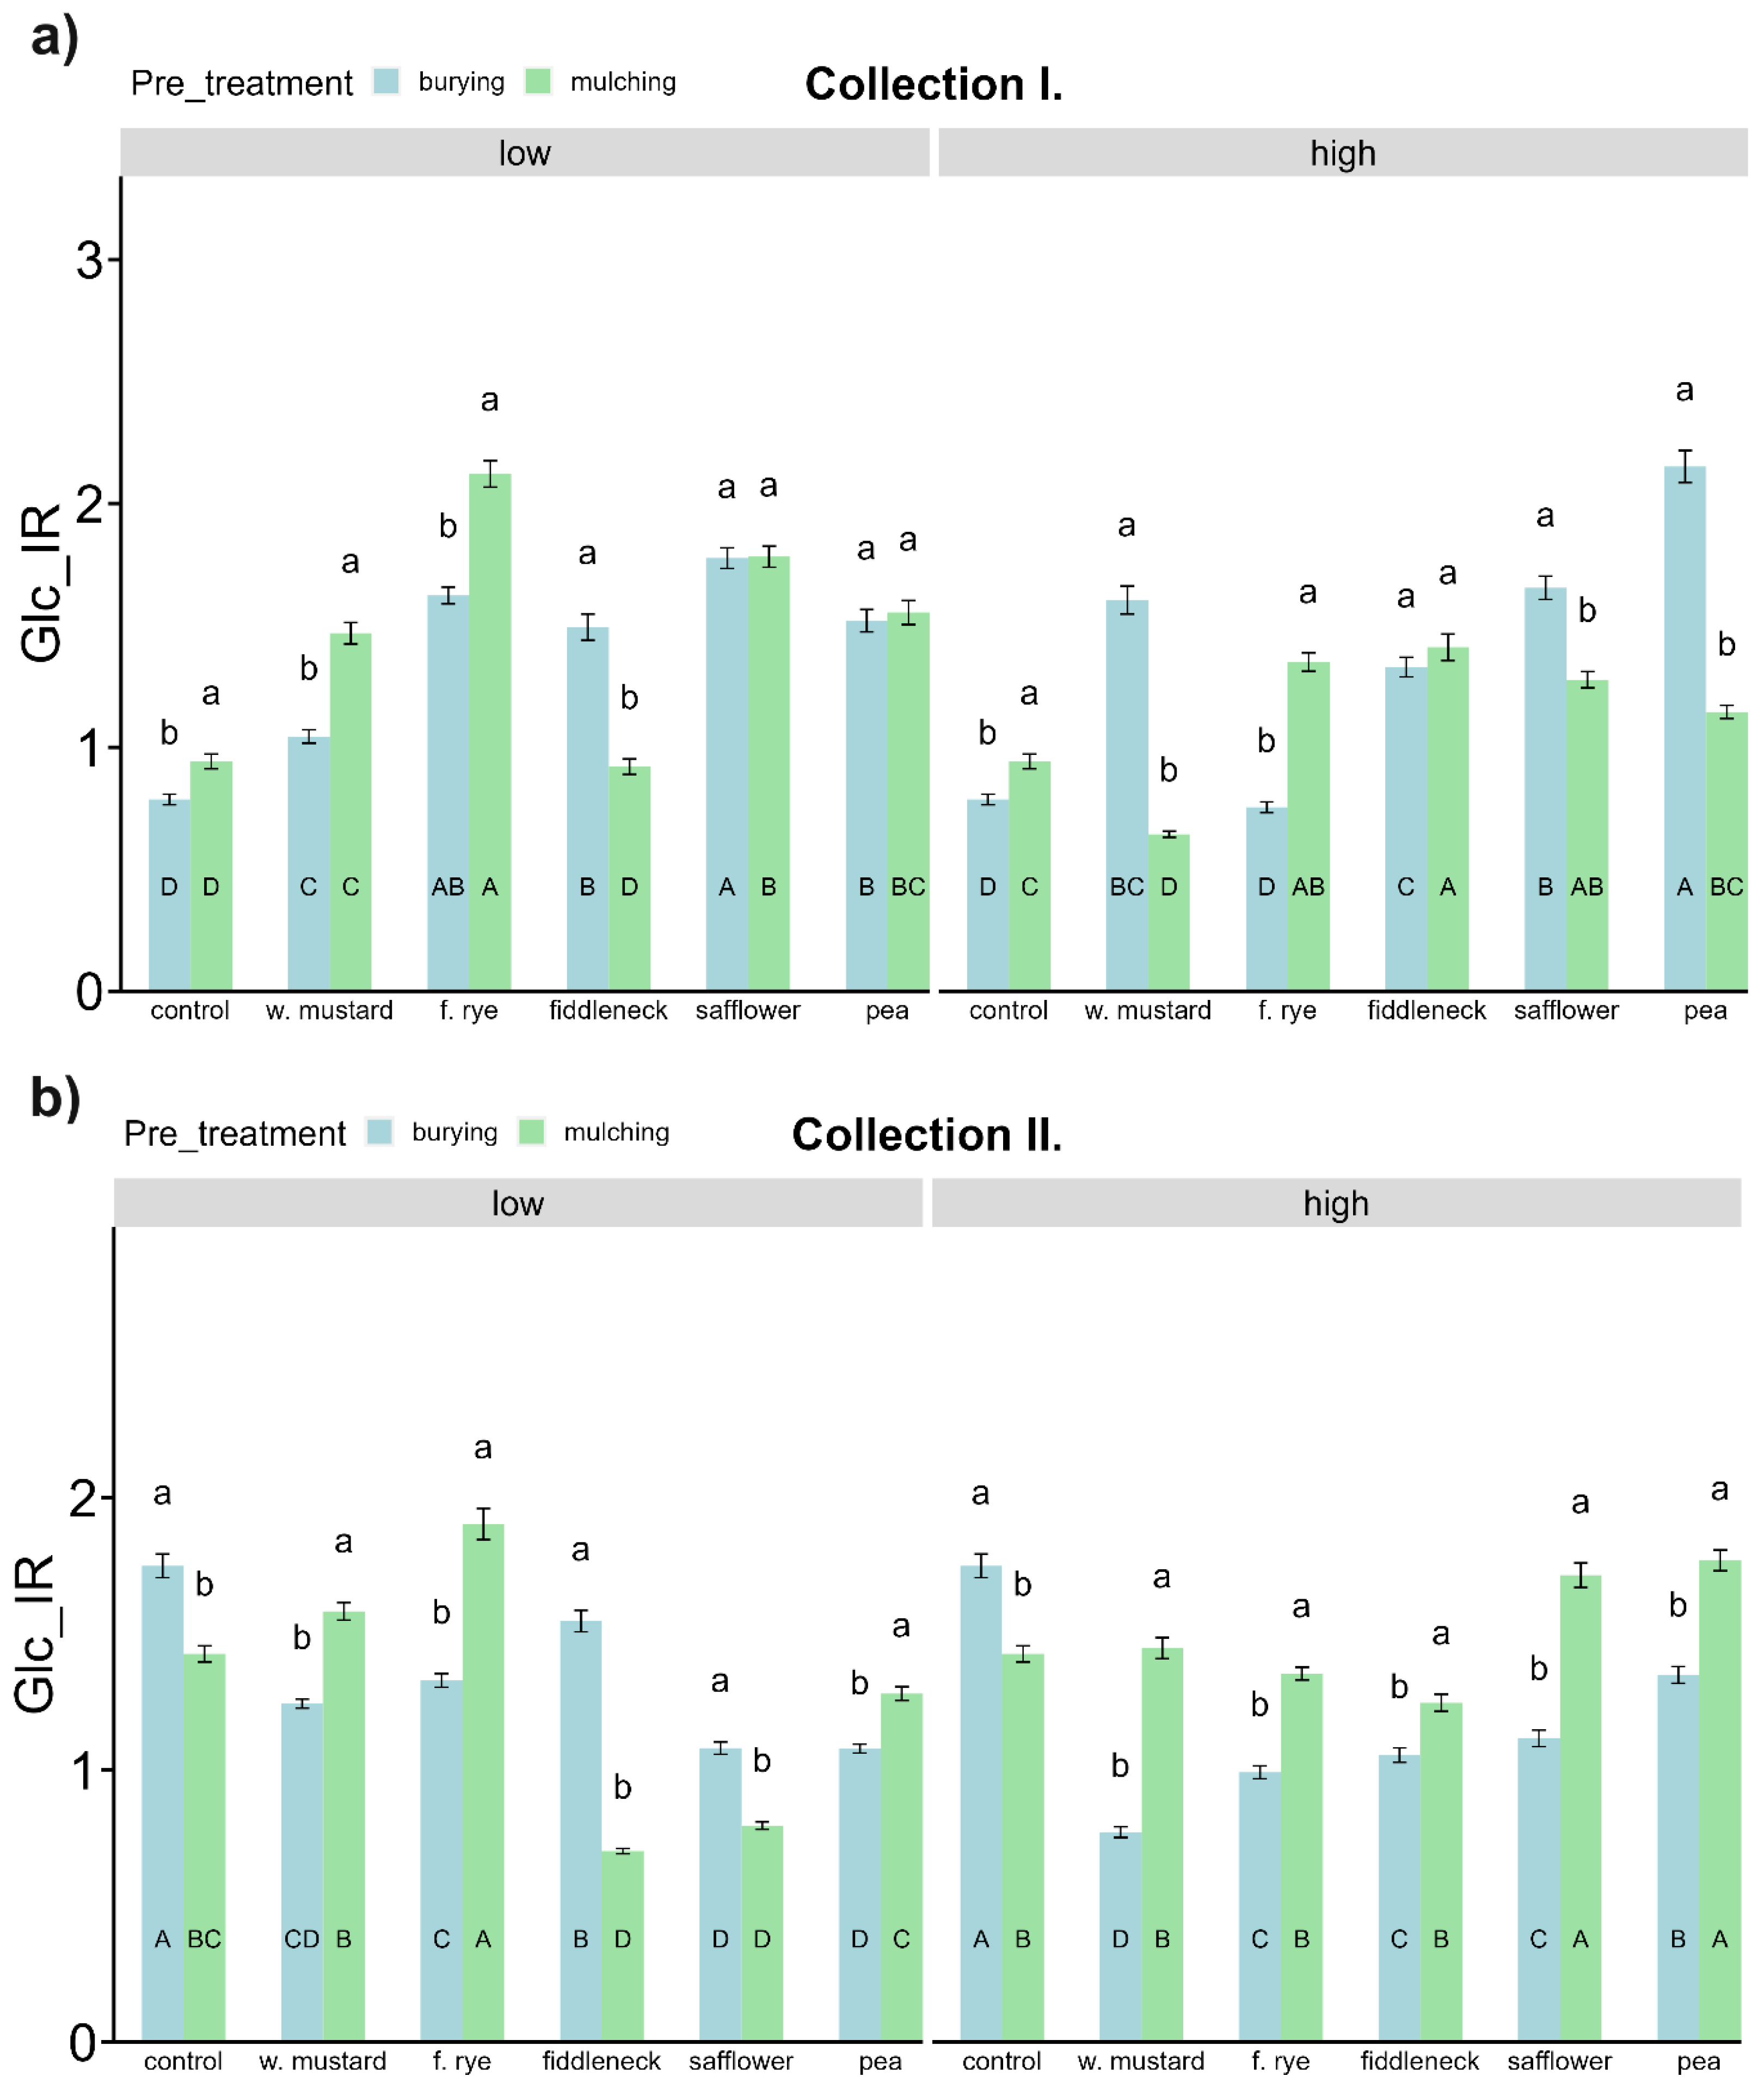
3.4. Soil Carbon (C) and C Mineralizing Microbial Activities

The interaction of factors “Variant” and “Collection” determined the total soil carbon (Ctot) (p ≤ 4.6 × 10⁻¹⁴; eta.sq.part 0.54). The Ctot in soil before and after maize did not differ significantly (two-way ANOVA, Table S1) in general, although variants RHM_II, SHM_II, and PHM_II increased Ctot (to values 13.7, 14.7, and 14.5 g·kg−1 dry soil) in comparison to RHM_I, SHM_I, and PHM_I (by 13.2%, 13.4%, 14.7%, respectively; Figure 3).
Green-manuring with low-dose buried biomass significantly (p ≤ 0.05) increased Ctot in WMLB_I compared to CB_I before maize, while no significant variability was found after maize (Figure 3). Higher-dose buried green manures changed Ctot before maize insignificantly and after maize, while FHB_II was higher (p ≤ 0.05) than CB_II. Consequently, low-dose mulched green manures showed no significant Ctot differences both before and after maize, while high-dose mulched GMs decreased the Ctot of WMHM_I, RHM_I, and PHM_I (by 9.9%, 10.9%, 7.3%) as compared to CM_I and after maize, while SHM_II and PHM_II increased (by 12.2% and 10.7%) Ctot compared to CM_II (Figure 3).
Before maize cultivation, the buried green manures FLB_I, FHB_I, RHB_I, and PHB_I significantly (p < 2.2 × 10⁻¹⁶) increased Ctot compared to mulched green manures FLM_I, FHM_I, RHM_I, and PHM_I (by 7.1%, 8.0%, 9.2%, 6.3%, respectively). After maize, mulched sufflower SHM_II increased Ctot (by 8.2%) in comparison to SHB_II. Before maize cultivation, Ctot was also indirectly dependent on green manure doses in the case of WMHB_I and WMHM_I (decreased by 11.0% and 14.1%), RHB_I and RHM_I (decreased by 7.5% and 12.5%), and SHB_I and SHM_I (decreased by 4.2% and 3.7%) in comparison to the respective low-dose GM variants (Figure 3). After maize, WMHB_II and WMHM_II decreased Ctot (by 6.6%, both) compared to WMLB_II and WMLM_II again, whereas SHB_II and SHM_II and PHB_II and PHM_II increased Ctot compared to low-dose SLB_II and SLM_II and PLB_II and PLM_II (by 2.3%, 8.9% and 7.1%, 8.2%, respectively; Figure 3). The Ctot correlated positively with total nitrogen (Ntot) before maize (p ≤ 0.001, r ranged from 0.89 to 0.94) and with DHA in mulched green manured soil before and after maize (p ≤ 0.001, r values were 0.70 and 0.51, Figure S1).
The interaction of factors “Variant” and “Collection” determined DHA significantly (p < 2.2 × 10⁻¹⁶; eta.sq.part 0.59). The DHA in the soil after the maize was significantly increased as compared to before maize (two-way ANOVA, p < 2.2 × 10⁻¹⁶, Table S1), high-dose mulched green manures derived the highest increase: WMHM_II, RHM_II, FHM_II, SHM_II, and PHM_II were increased by 58%, 67%, 53%, 52%, and 54%, respectively (compared to Collection I values, Figure 4). WMLB_I increased and RLB_I decreased DHA compared to CB_I before maize, while after maize, all low-dose buried green manures increased DHA compared to CB_II (Figure 4). Furthermore, RHB_I and PHB_I decreased and FHB_I increased DHA compared to CB_I before maize, and all high-dose buried green manures increased DHA compared to CB_II after maize (Figure 4). The most increased (compared to CB_I, CB_II) DHA were in WMLB_I and FHB_I (by 10%, 23%) and in WMHB_II, FHB_II, and PHB_II (by 27%, 64%, and 31%, respectively).
In contrast, all mulched variants at both doses (L, H) decreased DHA compared to CM_I before maize, with the biggest decreases coming in WMHM_I, RHM_I, SHM_I, and PHM_I (by 49%, 61%, 35%, 41%). WMLM_II increased and PLM_II decreased DHA at low doses, and FHM_II and SHM_II increased DHA at high doses compared to CM_II after maize (Figure 4). The most increased (compared to CM_II) DHA were in WMLM_II and FHM_II (by 8%, 25%). Before maize cultivation, all buried green manures at both doses (p ≤ 0.05) had significantly higher DHA than mulched variants (Figure 4). In contrast, mulched GMs after maize cultivation increased DHA over buried ones: SLM_II, SHM_II, WMLM_II, and RLM_II were higher than SLB_II, SHB_II, WMLB_II, and RLB_II (by 8%, 15%, 4%, 9%, respectively).
The DHA was also indirectly dependent on the green manure dose before maize: WMHB_I and WMHM_I were higher than WMLB_I and WMLM_I (by 10% and 45%), and RHB_I and RHM_I were higher than RLB_I and RLM_I (by 10% and 56%). After maize, DHA showed direct dependence on green manure doses: FHB_II and FHM_II were higher than FLB_II and FLM_II (by 31% and 29%), SHB_II and SHM_II were higher than SLB_II and SLM_II (by 7% and 13%), and PHB_II and PHM_II were higher than PLB_II and PLM_II (by 5% and 19%). DHA correlated positively with Ntot before maize in soil with buried and mulched GMs (p ≤ 0.001, r coefficients were 0.51 and 0.72, Figure S1).
β-glucosidase (GLU) was significantly determined by the interaction of factors “Variant” and “Collection” DHA (p < 2.2 × 10⁻¹⁶; eta.sq.part 0.22). The GLU in soil after maize was significantly increased as compared to before maize (two-way ANOVA, p < 2.2 × 10⁻¹⁶, Table S1); e.g., WMHB_II, WMHM_II, and PHM_II increased GLU compared to WMHB_I, WMHM_I, and PHM_I by 21%, 43%, and 32%, respectively (Figure 5). WMLB_I, WMLB_II, and SLB_II increased GLU compared to CB_I and CB_II (p ≤ 0.05), while all other low-dose buried green manures changed DHA insignificantly both before and after maize.
RHB_I decreased and FHB_I increased GLU compared to CB_I and after maize, while WMHB_II, FHB_II, and PHB_II increased GLU compared to CB_II. The highest GLU values were in WMLB_I, FHB_I, WMLB_II, and WMHB_II (higher by 19%, 21%, 23%, 29% over CB_I, CB_II). Before maize, none of mulched green manures at any dose increased GLU significantly (p ≤ 0.05). On the contrary, FLM_I and all high-dose mulched GMs (except FHM_I) decreased GLU compared to CM_I. In contrast, all low-dose mulched GMs increased GLU significantly (p ≤ 0.05) in comparison to CM_II after maize, while high-dose mulched GMs increased GLU in the variants WMHM_II, FHM_II, and PHM_II (Figure 5). The mulched GMs WMLM_II and WMHM_II increased GLU the most compared to CM_II (by 28%, and 25%).
Before maize cultivation, all buried green manures at both doses (except RLB_I and PLB_I) had significantly (p ≤ 0.05) higher GLU than mulched variants (Figure 5). In contrast, almost all (except RLB_II, which was lower than RLM_II) buried and mulched green manures at both doses did not differ significantly after maize. GLU was indirectly dependent on doses of green manure: before maize cultivation, in variants WMHB_I, WMHM_I, RHB_I, and RHM_I, which were decreased compared to WMLB_I, WMLM_I, RLB_I, and RLM_I (by 18%, 22%, 9%, 20%), and after maize, in variants RHB_II, RHM_II, SHB_II, and SHM_II (decreased by 3%, 16%, 8%, and 8% compared to low doses).
Glc_IR was significantly determined by the interaction of factors “Variant” and “Collection” DHA (p < 2.2 × 10⁻¹⁶; eta.sq.part 0.60). The Glc_IR in soil before maize was significantly increased as compared to after maize (two-way ANOVA, p < 2.2 × 10⁻¹⁶, Table S1), while WMHB_I, SLB_I, SLM_I, and PHB_I were increased by 108%, 64%, 123%, and 59% (compared to Collection II values, Figure 6). All low- and high-dose buried green manures (except RHB_I) increased Glc_IR compared to CB_I before maize, whereas all low- and high-dose buried green manures after maize decreased Glc_IR significantly compared to CB_II (Figure 6). Mulched green manures increased Glc_IR in all low-dose variants, except FLM_I, and all high-dose variants, except WMHM_I and PHM_I as compared to CM_I before maize. After maize, RLM_II, SHM_II, and PHM_II increased and FLM_II and SM_II decreased Glc_IR compared to CM_II (Figure 6). The variants RLM_I, SLB_I, and PHB_I had the most increased Glc-IR (by 125%, 126%, and 174% over CM_I and CB_I) before maize, while RLM_II and PHM_II were the most increased (by 33% and 24% over CM_II) after maize.
Before maize cultivation, mulched green manures had higher Glc_IR than buried green manures at low rates of (WMLM_I vs. WMLB_I) both doses (RLM_I and RHM_I vs. RLB_I and RHB_I), whereas high doses of buried GMs—WMHB_I, SHB_I, PHB_I—increased Glc_IR significantly (p ≤ 0.05) compared to mulched WMHM_I, SHM_I, and PHM_I before maize (Figure 6). After maize cultivation, low doses of buried GMs lead to either an increase (FLB_II and SLB_II) or decrease (WMLB_II, RLB_II, and PLB_II) in comparison to respective low-dosed mulched ones, while high-dosed buried GM variants were all decreased compared to high-dosed mulched ones (Figure 6). Before maize, Glc_IR was indirectly dependent on doses of mulched green manures only: WMHM_I, RHM_I, SHM_I, and PHM_I were decreased compared to WMLM_I, RLM_I, SLM_I, and PLM_I by 56%, 36%, 28%, and 26% (Figure 6). After maize, Glc_IR was directly dependent on doses of mulched green manures: FHM_II, SHM_II, and PHM_II were increased compared to FLM_II, SLM_II, and PLM_II by 79%, 115%, and 38%. Glc_IR correlated positively with Ntot after maize in soil with buried GMs (p ≤ 0.001, r = 0.65, Figure S1).

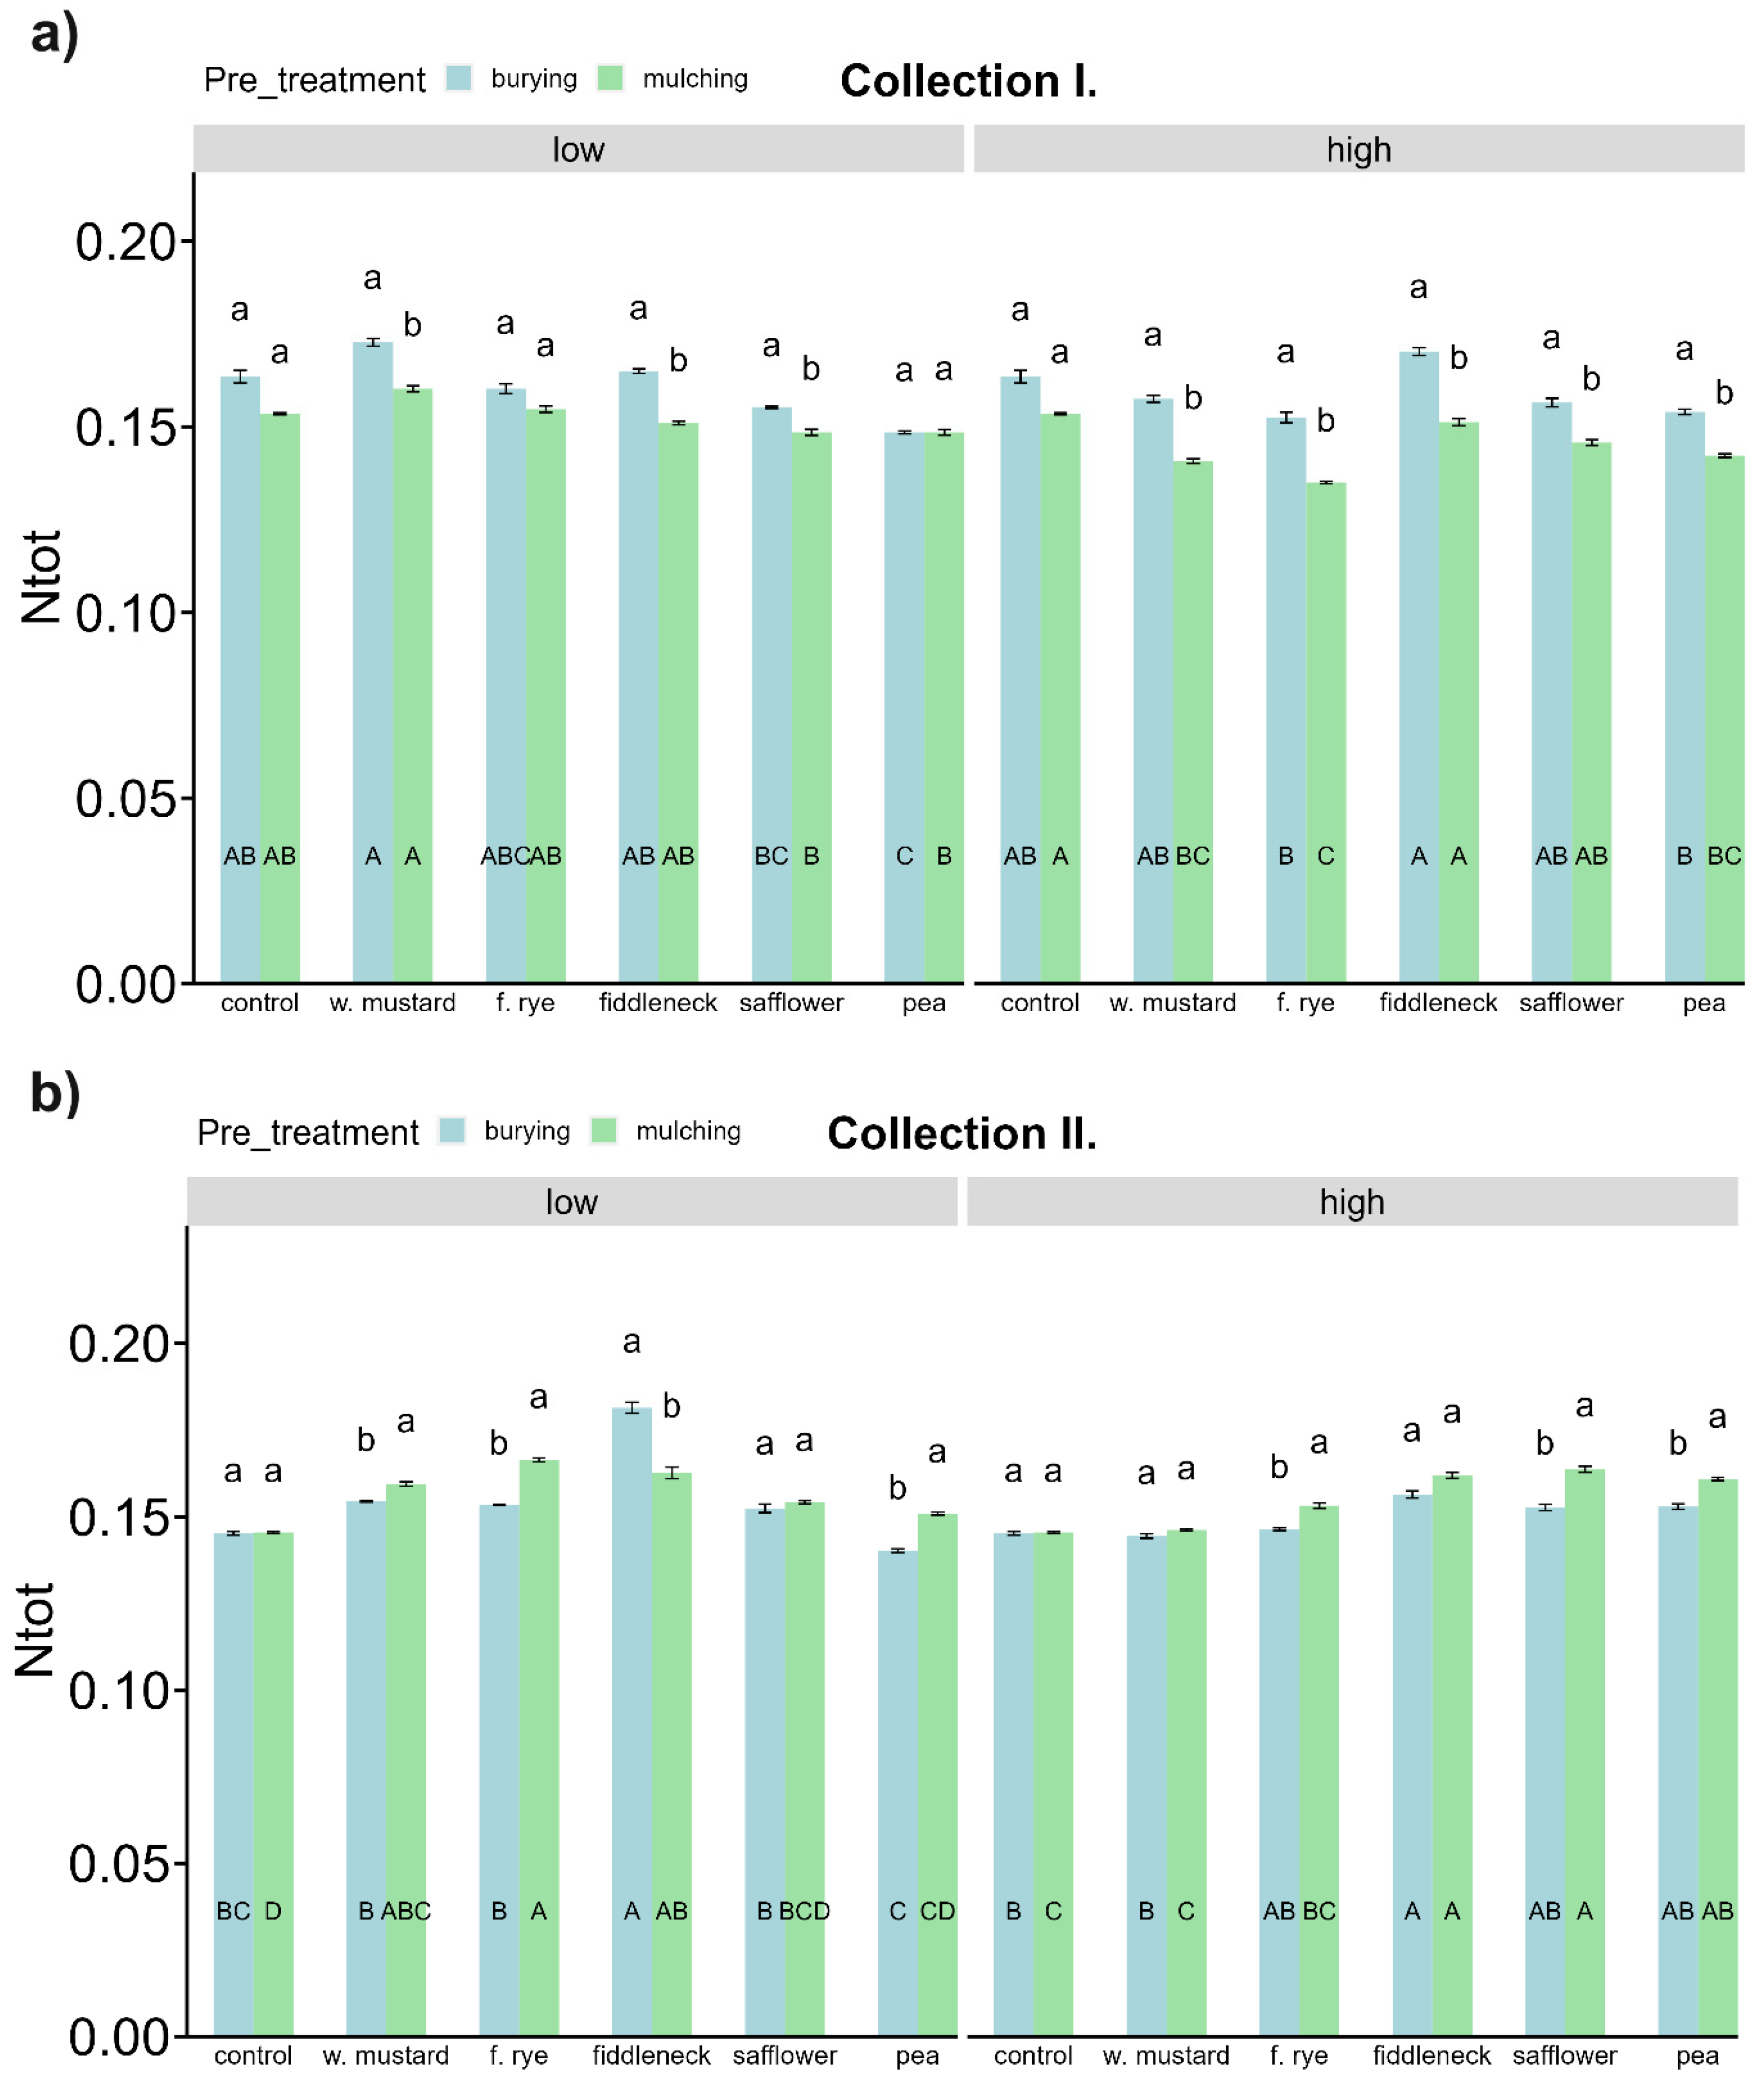
3.5. Soil Nitrogen (N) and N, P Mineralizing Microbial Activities

The interaction of factors “Variant” and “Collection” determined Ntot significantly (p < 2.2 × 10⁻¹⁶; eta.sq.part 0.64). However, the factor “Collection” had no significant effect (p = 0.26, eta.sq.part 0.01, Table S1). The Ntot was comparable in soil before and after maize (two-way ANOVA, Table S1). Nevertheless, WMLB_I and WMHB_I were higher than WMLB_II and WMHB_II by 15% and 13% (Figure 7).
Green-manuring with low and high doses of buried biomass before maize derived no significant differences in Ntot compared to CB_I, except decreased PLB_I. After maize, low and high doses of buried green manures increased Ntot only in FLB_II and FHB_II (by 20% and 7%, compared to CB_II, Figure 7).
Green-manuring with low doses of mulched biomass before maize caused no significant differences in Ntot, while high-dose mulched GMs WMHM_I, RHM_I, and PHM_I decreased Ntot compared to CM_I before maize. After maize, low and high doses of mulched green manures increased Ntot in WMLM_II, RLM_II, FLM_II, FHM_II, SHM_II, and PHM_II compared to CM_II (Figure 7). The overall highly positive effect on Ntot showed fiddleneck variants FHB_I, FLB_II, and FHM_II were higher than CB_I, CB_II, and CM_II by 4%, 20%, and 7%.
Before maize cultivation, all buried green manures at both doses (except RLB_I and PLB_I) had significantly (p ≤ 0.05) higher Ntot than mulched variants (Figure 5). On the contrary, low- and high-mulched GMs mostly increased Ntot in comparison to buried green manures after maize, i.e., WMLM_II, RLM_II, PLM_II, FHM_II, SHM_II, and PHM_II were higher than relevant buried GM variants (by 6%, 12%, 7%, 6%, 6%, and 6%, p ≤ 0.05; Figure 7).
Before maize cultivation, Ntot was indirectly dependent on green manure doses in the case of WMHB_I, WMHM_I, RHB_I, and RHM_I, which were lower than WMLB_I, WMLM_I, RLB_I, and RLM_I (by 9%, 12%, 5%, and 13%).
Urease (Ure) activity was significantly determined by the interaction of factors “Variant” and “Collection” DHA (p < 2.2 × 10⁻¹⁶; eta.sq.part 0.28). The Ure in the soil after maize was significantly increased as compared to before maize (two-way ANOVA, p < 2.2 × 10⁻¹⁶, Table S1), while WMLM_II, FLM_II, and SLB_II were higher than WMLM_I, FLM_I, and SLB_I by 56%, 35%, and 34% (p ≤ 0.05, Figure 8).
Before maize, low- and high-dose buried green manures changed Ure activity compared to CB_I either insignificantly or with a decrease (p ≤ 0.05): RLB_I, SLB_I, WMHB_I, RHB_I, and PHB_I. After maize, low-dose buried green manures either did not change or increase (WMLB_II, SLB_II) Ure compared to CB_II, high doses derived no significant differences (Figure 8).
Mulched green manures before maize decreased Ure in all variants (in the case of high doses) or only in FLM_I, SLM_I, and PLM_I. In contrast, after maize, Ure values were increased by low-dose mulched GMs (except PLB_II) and high-dose mulched GMs FHM_II and SHM_II (and RHM_II decreased; Figure 8). The comparison of Ure in buried and mulched GM variants showed that before maize, buried variants mostly increased Ure compared to mulched ones, i.e., WMLB_I, WMHB_I, FLB_I, FHB_I, SHB_I, and PLB_I were increased over WMLM_I, WMHM_I, FLM_I, FHM_I, SHM_I, and PLM_I by 34%, 30%, 31%, 30%, 29%, and 8%. After maize, Ure showed indirect dependency on green manure doses as the variants WMHB_II, WMHM_II, RHB_II, RHM_II, SHB_II, and SHM_II were decreased compared to WMLB_II, WMLM_II, RLB_II, RLM_II, SLB_II, and SLM_II by 21%, 19%, 2%, 5%, 19%, and 4% (Figure 8).
Phosphatase (Phos) activity was significantly but weakly determined by the interaction of factors “Variant” and “Collection” DHA (p < 2.2 × 10⁻¹⁶; eta.sq.part 0.12). The Phos in soil after maize was significantly increased as compared to before maize (two-way ANOVA, p < 2.2 × 10⁻¹⁶, Table S1), while WMHB_II, FLM_II, and FHM_II were increased compared to WMHB_I, FLM_I, and FHM_I by 18%, 22%, and 14% (p ≤ 0.05, Figure 9).
Low-dose buried green manures increased Phos activity in almost all variants (except WMLB_I) both before and after maize (as compared to CB_I and CB_II; p ≤ 0.05). Similarly, high-dose buried green manures increased Phos activity in almost all variants (except RHB_I) both before and after maize (as compared to CB_I and CB_II; p ≤ 0.05, Figure 9). Both low- and high-dose mulched green manures increased Phos activity in almost all variants (except WMLM_I, RLM_II, WMHM_I, and RHM_II) both before and after maize (as compared to CM_I and CM_II; p ≤ 0.05, Figure 9). The highest Phos activity increases were in WMHB_II, SLB_I, SLB_II, SLM_I, SLM_II, and PLM_I (increased over CB_I, CB_II, CM_I, and CM_II by 46%, 30%, 49%, 43%, 52%, and 36%; Figure 9).
Before maize, both low- and high-dose buried variants mostly increased Phos compared to corresponding mulched variants, i.e., RLB_I, FLB_I, WMHB_I, FHB_I, SHB_I, and PHB_I were significantly higher (p ≤ 0.05) than RLM_I, FLM_I, WMHM_I, FHM_I, SHM_I, and PHM_I. After maize, only buried fiddleneck tended to increase Phos activity compared to the mulched one at both doses (RLB_II and RHB_II were higher than RLM_II and RHM_II; p ≤ 0.05, Figure 9). Both before and after maize, Phos showed indirect dependency on green manure doses, as the variants RHB_I, RHM_I, FHB_I, SHB_I, SHM_I, PHB_I, and PHM_I were decreased in comparison to RLB_I, RLM_I, FLB_I, SLB_I, SLM_I, PLB_I, and PLM_I by 10%, 2%, 1%, 8%, 22%, 4%, and 17%, and the variants RHB_II, RHM_II, FHM_II, SHB_II, SHM_II, PHB_II, and PHM_II were decreased in comparison to RLB_II, RLM_II, FLM_II, SLB_II, SLM_II, PLB_II, and PLM_II by 4%, 5%, 5%, 23%, 22%, 17%, and 5% (Figure 9).

3.6. Statistical Evaluation of the Green Manure Treatment on Soil and Plant Parameters

The Pearson correlation coefficients are reported in Figure S1a–d in SI. The correlations were calculated for each pre-treatment, i.e., buried and mulched both before and after maize cultivation. The most significant correlations are discussed in the text further below. In the context of Pearson correlation results reported further on, the asterisks (*) denote the level of statistical significance of the correlation coefficient. In particular, *** means that the correlation is significant at the 0.001 level (p < 0.001), ** means that the correlation is significant at the 0.01 level (p < 0.01), and * means that the correlation is significant at the 0.05 level (p ≤ 0.05).

4. Discussion

4.1. Impact on Soil Prior to Sowing

In this study, the selected cover crop biomass was predominantly of a cellulose type (Table 3), which, unlike plants with a higher lignin content, undergoes relatively rapid biodegradation [79]. Biodegradation of any type of organic matter (OM) in arable soil is dependent on specific conditions such as soil types, minerology, tillage practices, and or climatic variables, as are the variations observed between the buried and mulching treatments in the present study. Optimal conditions for OM biodegradation primarily include the presence of degrading microorganisms, suitable temperature and moisture levels, nutrients, and oxygen access [80]. In an ideal case, during biodegradation, there is a proliferation of organisms and gradual decomposition of biomass coupled with C and N metabolism, resulting in CO2 release and N fixation in microbial biomass (depending on the stage of the plant) [81].
The results indicate that mulching before the sowing of maize led to a slight increase or even a decrease in total carbon (Ctot) and nitrogen (N) as compared to burying. This suggests mulching caused faster biodegradation, resulting in lower C and N content in soil pre-sowing (Figure 3). This aligns with the notion that deeper soil layers have poorer conditions for biodegradation due to reduced oxygen levels. Also, the DHA activity, which indicates the intensity of soil biochemical processes [82], was lower in the mulching variant compared to both the control and burying variants, which indicates that the biodegradation in the mulching variant has already finished. In addition, the comparison of Pearson coefficients in Figure S1 for burying and mulching variants shows a closer connection (more significant correlations) of green manure characteristics with soil Ctot and Ntot for burying variants. They include a negative correlation with contents of lignin (ADL), hemicellulose, sugars, and lipids, and a positive correlation with potassium, calcium, and ash. This indicates a larger effect of buried (and better mixed) cover crop biomass on soil properties compared to mulching, the effect of which would probably be stronger on the soil surface.
However, these findings contradict the general understanding that the direct incorporation of green manure rapidly increases nutrient release from buried plant biomass [26,36,37,38]. Nevertheless, it is important to consider that our work utilized pot experiments, which have specific characteristics, especially if they are conducted under constant conditions. Additionally, soil texture plays a crucial role in water retention and oxygen distribution, as well as nutrient status and microorganism abundance and diversity [83].
Regarding the chosen crops, the highest N content was exhibited by forest rye, followed by safflower and mustard (89% and 87% of rye N_AGB, Section 3.1, Table 3). Surprisingly, pea, as the only leguminous plant used in this study, showed the lowest content. Therefore, it would be logical for forest rye to exhibit the quickest biomass degradation and increase in C and N contents. However, Ctot and N contents (Figure 3 and Figure 6) do not confirm Hypothesis (3) for both low- and high-dosage variants.
In the case of pea application, a decrease in Ctot and N contents was observed with high-dosage applications in the mulching variant. Decreases in Ctot and N content after adding labile substrate, whether in the form of pure substances [84,85] or plant residues [86], is often linked to the priming effect, which mainly leads to C and N mineralization [87]. Priming effects can be both positive and negative, with distinctions between positive and negative effects relating to either accelerated or decelerated decomposition of SOM. The chemical composition of the substrate and the stoichiometry of the containing nutrients can have varying effects on the priming effect [88]. As can be seen in Table 3, pea had a significantly high content of hemicellulose and sugars, which are microbially labile compounds, causing a fast biodegradation of pea tissues.
Additionally, breakthroughs in the analysis of microbial functional genes suggest that microbial genes associated with nutrient cycling are closely linked to SOM decomposition and priming effect [89,90,91]. Both positive and negative priming effects of PE are linked to the availability of inorganic nutrients, particularly mineral nitrogen [84]. Although pea has the lowest nitrogen (N_AGB) content across all applied green manures, its content is still around 3%, which is relatively high. In fact, low mineral N availability is expected to induce a positive priming effect as soil microbes begin to decompose OM to satisfy their nitrogen needs [92]. Conversely, high N availability leads to a negative priming effect as there is no need to invest energy in producing enzymes that decompose OM, as described by the “N mining theory” [93]. Alternatively, the “stoichiometric decomposition theory” proposes [94] that OM decomposition is driven by substrate stoichiometry and microbial energy demands, with microbial activity and, thus, OM decomposition being highest when the C:N ratio of the substrate matches microbial demands. Studies involving both C and N additions have shown that adding N can either increase [85,95,96,97] or decrease the priming effect [85,98].
However, based on our results, it is not straightforward to determine which of these two theories is applicable in our case. Indeed, it is necessary to consider that the soil used in our experiment was rich in N, as indicated by the C:N ratio 8.7 (Table 1), whereas generally soils have a C:N content between 10 and 14 [99]. Therefore, the addition of pea cover crops did not increase the N demands of the microorganisms, as indicated by Figure 8 showing unchanged urease enzyme levels and Pearson correlation coefficients between Ctot of soil and C:N of green manures, which resulted in 0.31* for the burying variant and 0.35* for the mulching variant. Specifically, in the case the soil is N-deficient, the correlation would be negative, indicating a higher demand for N instead of C.
Therefore, in our case, the priming effect is driven by the deficiency of another nutrient, such as phosphorus (P), with the increased demand suggested by the elevated phosphatase activity in pea samples (Figure 9), indicating a higher need for P, which is necessary for organism proliferation. Therefore, in our case, the reduction in C and N is likely due to accelerated SOM degradation, with the reason for the priming effect probably being a lack of P. These conclusions are consistent with the findings of [100], who observed a similar influence of increased N in the absence of P on SOM decomposition. In addition, this conclusion is also supported by the Pearson correlation coefficient between Phos activity and P in green manure (SI, Figure S1), which resulted in negative significant values such as −0.38* (for burying variants) and −0.61*** (for mulching variants). The negative values indicate that at the observed elevated Phos activity (Figure 9), at which the demand for additional phosphorus increased, the green manure with higher P content sufficiently supplied available phosphorus to the soil. The addition of other green manure crops was also expected to increase Ctot and Ntot content in soil after application. However, none of the variants, whether at low or high dosage, resulted in an increased Ctot or Ntot. This suggests that the type and amount of green manure must be properly chosen to avoid positive priming. Furthermore, it appears that N content is not the primary factor affecting soil quality after the application of cover crops. Instead, the application method and type of cover crops seem to be the main determinants.

4.2. Impact on Soil after the Harvest

Contrary to the pre-sowing scenario, the influence of green manuring on soil post-corn sowing was stronger, as suggested by the closer correlation between green manure characteristics with AGB_dry and with soil parameters. This observation is intriguing, considering that some soil parameters appeared weaker before sowing. The increase can mainly be explained by the synergistic interaction of cover crop residues and the maize root system, likely in combination with the soil type.

4.2.1. Influence of Cover Crops on above Ground Biomass Production

Green manuring can exert both direct and indirect effects on aboveground biomass. Upon incorporation into the soil, the decomposition of green manure commences. The biodegradation of cover crop residues releases nutrients into the soil, enriching it and providing a nutrient source for subsequent crops.
As hypothesized (1), compared to untreated control soil, green manuring with either buried or mulched cover crops enhanced the yield of dry maize aboveground biomass (AGB_dry) in all variants. These results also supported Hypothesis 2 and align with the documented benefits of cover crop green manure, whether buried or mulched, in yielding higher biomass for subsequent crops [25,29]. On the contrary, these findings contrast with studies where mustard, used as green manure, had a weak impact on the biomass of successive crops [101,102]. Several factors can be responsible for such differences such as soil conditions (variations in pH, soil types, and microbial activity), climate and weather conditions, green manure management (buried or mulched, as is the case in the present study), and the varietal differences of green manure crops and their rotation and sequence.
We found that the buried variant showed higher ABG_dry yield compared to mulching (a small exception was safflower in the high-dose variant). This is in accordance with findings from [25] where the authors observed similar results for pea biomass. However, in the context of the rate of biomass biodegradation discussed in the previous chapter, this observation is rather surprising. We speculate that this may be caused by an enhanced enzymatic level in soil prior to sowing, as discussed in the last chapter.
As shown in Figure 1, the AGB_dry was the most enhanced in burying variants for w. mustard and forest rye, with forest rye in the low-dose variant and w. mustard in the high-dose variant. The pea variant, with the lowest N dose, showed a lower yield compared to others in the low-dosage variant. However, forest rye had the highest N content, which failed to exhibit the highest AGB_dry yield. The Pearson correlation coefficient between ABG_dry and N content in green manure showed no significant correlation for both treatments, thus rejecting Hypothesis 3.
The results by [103] suggested that cover crops with high C:N ratios can lead to potential N immobilization for the subsequent crop and can negatively impact yields. This was not observed in our study, where all variants exhibited higher AGB compared to the control. However, N content in green manure does not seem to be the main factor influencing AGB in either buried or mulching variants at lower green-manuring dosages, as suggested by insignificant Pearson correlation coefficients (SI, Table 3).
In conclusion, cover crops have proven to be a suitable method for increasing AGB, but their application may not always correlate with a positive impact on soil. In soils with higher N content, cover crop application can be associated with rapid nutrient (C, N, P) mineralization (as shown by high DHA, GLU, Ure, and Phos activities in high fiddleneck dose variants after maize cultivation) and higher demands for other nutrients.

4.2.2. Influence of Green Manure on Soil Microbial Characteristics

Despite a negative trend in DHA activity in the buried variants before sowing, all variants showed positive changes in DHA activity after maize cultivation, similar to Ctot values in the mulched variants. These findings align with the presumed decrease in SOM degradation in green manure-treated soil due to the priming effect that mitigated mineralization processes, as the limiting nutrients (mainly available N) were sufficiently supplied. However, these changes were much more significant in the mulched variants than in the buried ones, as it was hypothesized (3).
Buried green-manured cover crops significantly enhanced DHA over the untreated control, which is in line with the enhancement of carbon mineralizing enzymes reported in cover crop green-manuring studies [104,105,106,107]. Furthermore, a strong indirect dependence of DHA on the dose of the mulched cover crops before sowing was found, resulting in reduced DHA activity in the high-dose-mulched variants compared to the high-dose-buried variants. This suggests that mulching of the cover crop biomass led to early priming of soil carbon losses, accelerating the mineralization of OM before the introduction of plant into soil or delaying the enhancement of DHA due to a shortened interval of soil–green manure interaction before maize sowing, similarly as reported [108]. Both assumed mechanisms, acting synergistically, may also be responsible for the observed negative priming effect on DHA activity. It was found that the green manure cover crops that mediated the highest Ctot values also most significantly stimulated DHA activity: white mustard at a lower dose, and fiddleneck at a higher dose after maize cultivation.
β-glucosidase activity depends on soil management, showing a marked increase after maize cultivation, particularly in the mulched green manure-treated soil. This difference between the impacts of immediately buried versus mulched (later incorporated) cover crop green manure aligns with the previous finding [109], and the overall benefit of specific cover crops (mainly white mustard, fiddleneck, and pea) to GLU activity after maize cultivation is supported by other reports [107,110]. GLU activity was indirectly dependent on the biomass dose, regardless of pre-treatment type, in the variants with white mustard and forest rye before the maize cultivation, suggesting that a shorter period from biomass incorporation, without maize rhizosphere-mediated change in soil microbiome composition, provided higher access to OM, leading to the priming effect and retardation of mineralization.
D-glucose-induced respiration is an indicator of the soil’s potential to mineralize organic C aerobically. It serves for partial quantification of the soil degraders’ microbial biomass. It was more stimulated before maize cultivation, mainly by forest rye, safflower, and pea at low doses and by buried white mustard, safflower, and pea at high doses. These results align with previously reported positive effects of green manure on soil respiration [109]. In contrast, after maize cultivation, Glc_IR was mitigated, mainly by buried green manure at both doses, contrasting with earlier results [109]. Overall, the findings after maize cultivation at a high biomass dose showed that Glc_IR was increased more by mulched green manure than by the buried variant. These findings correspond with the noted mitigation of other (non-respiratory) C-mineralizing activities (DHA, GLU) in the soil before sowing and contrasted activities after maize cultivation. This corroborated the presumption that the prior priming effect on carbon mineralization of OM was followed by subsequently more intensive microbial activity associated with SOM degradation as a consequence of increased plant and microbial nutrient demand. Hypothesis 3 was partially verified, and the non-adverse impact of increased CO2 emission, promoted by some of the tested green manure variants, was evident, as the balance before and after maize sowing and cultivation was not negative both for carbon sequestration (indicated by Ctot) and utilization (indicated by C mineralizing enzymes).
In addition, correlation coefficients revealed a link between DHA activity and N levels in green manure, which was significant only in the burying variant (−0.68***). As the DHA activity generally increased (Figure 4), this correlation indicates that the more N that was added to green manure, the lower the DHA activity. We speculate that the higher nitrogen level (which was already present in soil before sowing, see the discussion above) leads to an imbalance in the carbon-to-nitrogen (C:N) ratio in the soil. As many soil microorganisms require a balanced C:N ratio for optimal growth and activity, the excess of nitrogen relative to carbon can inhibit microbial activity, including that of dehydrogenases [111]. Among them are, for instance, actinobacteria or some saprophytic fungi, which are involved in breaking down complex organic substances. On the contrary, high nitrogen availability from green manures can stimulate microorganisms, such as nitrifying bacteria (see also discussion in the section dealing with soil pH), leading to nitrogen immobilization [112]. Microorganisms take up inorganic nitrogen and incorporate it into their biomass, temporarily sequestering it and reducing the amount of measurable soil nitrogen.
Furthermore, the burying variant showed also a negative correlation of Ntot in soil with the N content of green manures (i.e., −0.48**). Again, the explanation can be connected with the high N availability. In fact, green manures with higher nitrogen content released nitrogen into the soil upon decomposition. This readily available nitrogen is taken up by the growing plants, leading to a reduction in the measured soil nitrogen content. As a result, vigorous plant growth was observed in the burying variant compared to the mulching variant.

4.2.3. Soil pH (CaCl2)

The determination of soil pH (CaCl2) showed that cover crops used as green manure were either unchanged or prevalently acidified soil, except buried fiddleneck at high doses, the application of which was coupled with increased pH. Other authors referred mainly to unchanged or increased soil pH due to the cover crop green manure application [32,109,113,114]. Immediate burying in comparison to mulching decreased soil pH (CaCl2), mainly in the case of forest rye (both doses) before maize cultivation, and in the case of safflower (both doses) after maize cultivation. The mulching of pea biomass (low) decreased pH (CaCl2) more than burying both before and after maize cultivation. The previous reports found only weak or no effect of peas used as green manure on soil pH [115], but other green manure legumes may potentially decrease soil pH [116]. The mulching of fiddleneck biomass (both doses) decreased pH (CaCl2) more than burying before maize cultivation.
As indicated by Pearson correlation coefficients, there is a significant negative correlation between pH and N content in the green manure crop biomass for both buried (−0.65***) and mulched (−0.37*) variants. The explanation is associated with the above-discussed input of N into the soil and its positive effect on the activity of nitrifying bacteria. In fact, the nitrification process involves the conversion of ammonium (NH4+) to nitrate (NO3), which is accompanied by a release of hydrogen ions (H+) into the soil [117]. Consequently, soil pH decreases affect also immobilization and the leaching of metal ions such as potassium (−0.63***) and calcium (−0.59***).

5. Conclusions

The beneficial impact of green manure treatments, particularly buried white mustard before maize cultivation and mulched safflower and pea after maize cultivation, increased the total organic soil content, indicating soil organic matter enrichment. However, when pea was buried in higher doses, both soil total carbon and nitrogen decreased due to a priming effect, attributed to phosphorus deficiency despite higher nitrogen content in the original soil. Green manuring consistently enhanced dry maize aboveground biomass yield across all variants, with the highest yields achieved by low-dose mulched white mustard and high-dose buried white mustard and pea. Green mulching generally acidified the soil, contrasting with previous findings, except for the high-dose buried fiddleneck, while buried forest rye resulted in the lowest pH.
These findings highlight that the stoichiometry of green manure, in conjunction with soil characteristics such as the C:N ratio, plays a crucial role in sustainable soil management and carbon sequestration. Introducing green manures with specific substrates rich in labile carbon and high nitrogen content can accelerate biodegradation, potentially disrupting the nutrient balance in the original soil and leading to a positive priming effect that may negatively impact soil health and function.

Supplementary Materials

The following supporting information can be downloaded at: https://www.mdpi.com/article/10.3390/agronomy14092001/s1, Table S1: Two-way ANOVA, ETA squared test, Tukey’s HSD posthoc test of soil properties of variants “buried” and “mulched” after 1. and 2. Collection; Figure S1a: Pearson correlation coefficients between individual parameters for variants “buried” before maize; Figure S1b: Pearson correlation coefficients between individual parameters for variants “mulched” before maize; Figure S1c: Pearson correlation coefficients between individual parameters for variants “buried” after maize cultivation; Figure S1d: Pearson correlation coefficients between individual parameters for variants “mulched” after maize cultivation.

Author Contributions

Conceptualization, A.M., A.K., J.K. and M.B.; methodology, J.S., J.H. and T.H.; software, T.H., T.B. and A.K.; validation, O.M., J.S. and O.L.; formal analysis, M.B., A.M., J.S., A.K., O.M., J.H. and T.H.; resources, A.K., J.S., T.B., S.A., O.M. and O.L.; data curation, T.B., O.M., J.S., J.K. and O.L.; writing—original draft preparation, J.K., M.B. and J.H.; writing—review and editing, J.H., A.M., T.H., M.B., S.A., M.N. and J.K.; supervision, M.B., A.M., M.N. and J.H.; project administration, A.K., J.H., S.A. and M.B.; funding acquisition, M.B., J.H., S.A. and A.K. All authors have read and agreed to the published version of the manuscript.

Funding

The work was supported by the projects of the Ministry of Agriculture of the Czech Republic—QK21010161, institutional support MZE-RO1224, MZE-RO1724, and the Researchers Supporting Project number (RSP2024R194), King Saud University, Riyadh, Saudi Arabia.

Data Availability Statement

The original contributions presented in the study are included in the article/supplementary material, further inquiries can be directed to the corresponding author.

Acknowledgments

The authors sincerely acknowledge the Researchers Supporting Project number (RSP2024R194), King Saud University, Riyadh, Saudi Arabia.

Conflicts of Interest

Author Antonin Kintl and Julie Sobotkova were employed by the company Agricultural Research, Ltd. Author Oldrich Latal, Jiri Holatko were employed by the company Agrovyzkum Rapotin, Ltd. The remaining authors declare that the research was conducted in the absence of any commercial or financial relationships that could be construed as a potential conflict of interest.

References

  1. Schnitkey, G.D.; Sellars, S.C.; Gentry, L.F. Cover crops, farm economics, and policy. Appl. Econ. Perspect. Policy 2023, 46, 595–608. [Google Scholar] [CrossRef]
  2. Boulet, A.K.; Alarcão, C.; Ferreira, C.; Kalantari, Z.; Veiga, A.; Campos, L.; Ferreira, A.; Hessel, R. Agro-ecological services delivered by legume cover crops grown in succession with grain corn crops in the Mediterranean region. Open Agric. 2021, 6, 609–626. [Google Scholar] [CrossRef]
  3. Thapa, R.; Tully, K.L.; Reberg-Horton, C.; Cabrera, M.; Davis, B.W.; Fleisher, D.; Gaskin, J.; Hitchcock, R.; Poncet, A.; Schomberg, H.H. Cover crop residue decomposition in no-till cropping systems: Insights from multi-state on-farm litter bag studies. Agric. Ecosyst. Environ. 2022, 326, 107823. [Google Scholar] [CrossRef]
  4. Antosh, E.; Liebig, M.A.; Archer, D.W.; Luciano, R. Cover crop interseeding effects on aboveground biomass and corn grain yield in western North Dakota. Crop Forage Turfgrass Manag. 2022, 8, e20148. [Google Scholar] [CrossRef]
  5. Adetunji, A.T.; Ncube, B.; Mulidzi, R.; Lewu, F.B. Management impact and benefit of cover crops on soil quality: A review. Soil Tillage Res. 2020, 204, 104717. [Google Scholar] [CrossRef]
  6. dos Santos Cordeiro, C.F.; Echer, F.R.; Araujo, F.F. Cover Crops Impact Crops Yields by Improving Microbiological Activity and Fertility in Sandy Soil. J. Soil Sci. Plant Nutr. 2021, 21, 1968–1977. [Google Scholar] [CrossRef]
  7. Saleem, M.; Pervaiz, Z.H.; Contreras, J.; Lindenberger, J.H.; Hupp, B.M.; Chen, D.; Zhang, Q.; Wang, C.; Iqbal, J.; Twigg, P. Cover crop diversity improves multiple soil properties via altering root architectural traits. Rhizosphere 2020, 16, 100248. [Google Scholar] [CrossRef]
  8. Arruda, B.; Herrera, W.F.B.; Rojas-García, J.C.; Turner, C.; Pavinato, P.S. Cover crop species and mycorrhizal colonization on soil phosphorus dynamics. Rhizosphere 2021, 19, 100396. [Google Scholar] [CrossRef]
  9. Feng, H.; Sekaran, U.; Wang, T.; Kumar, S. On-farm assessment of cover cropping effects on soil C and N pools, enzyme activities, and microbial community structure. J. Agric. Sci. 2021, 159, 216–226. [Google Scholar] [CrossRef]
  10. Couëdel, A.; Alletto, L.; Justes, É. Crucifer-legume cover crop mixtures provide effective sulphate catch crop and sulphur green manure services. Plant Soil 2018, 426, 61–76. [Google Scholar] [CrossRef]
  11. Bogužas, V.; Mikučionienė, R.; Šlepetienė, A.; Sinkevičienė, A.; Feiza, V.; Steponavičienė, V.; Adamavičienė, A. Long-term effect of tillage systems, straw and green manure combinations on soil organic matter. Zemdirbyste-Agriculture 2015, 102, 243–250. [Google Scholar] [CrossRef]
  12. Liu, A.; Ku, Y.S.; Contador, C.A.; Lam, H.M. The Impacts of Domestication and Agricultural Practices on Legume Nutrient Acquisition through Symbiosis With Rhizobia and Arbuscular Mycorrhizal Fungi. Front. Genet. 2020, 11, 583954. [Google Scholar] [CrossRef]
  13. Ferreira, L.L.; Dalbosco, L.E.; Carvalho, I.R.; Carnevale, A.B.; Moura, N.B.; Lautenchleger, F. Multivariate and canonical models applied to corn: Benefits of green manure with Vigna unguiculate. Holos 2020, 7, 1–15. [Google Scholar] [CrossRef]
  14. Li, S.; Liang, H.; Wang, Y.; Zhang, Z.; Zhang, L.; Zhou, G.; Gao, S.; Cao, W. Responses of functional genes involved in nitrogen cycling to green manuring in different paddy soils in south China. Plant Soil 2022, 478, 519–532. [Google Scholar] [CrossRef]
  15. Vásquez-Castro, D.C.; Rodrigues, R.R.; Meli, P.; Brancalion, P.H.S.; Silva, R.R.; Couto, H.T.Z.d. Preliminary results of using green manure species as a cost-effective option for forest restoration. Sci. For. 2020, 48, 7. [Google Scholar] [CrossRef]
  16. Kolota, E.; Adamczewska-Sowinska, K. Living mulches in vegetable crops production: Perspectives and limitations (a reviev). Acta Sci. Pol. Hortorum Cultus 2013, 12, 127–142. [Google Scholar]
  17. Garcia-Franco, N.; Albaladejo, J.; Almagro, M.; Martínez-Mena, M. Beneficial effects of reduced tillage and green manure on soil aggregation and stabilization of organic carbon in a Mediterranean agroecosystem. Soil Tillage Res. 2015, 153, 66–75. [Google Scholar] [CrossRef]
  18. Su, G.; Zhao, R.; Wang, Y.; Yang, Y.; Wu, X.; Wang, J.; Ge, J. Green Manure Return Strategies to Improve Soil Properties and Spring Maize Productivity under Nitrogen Reduction in the North China Plain. Agronomy 2022, 12, 2734. [Google Scholar] [CrossRef]
  19. Li, P.; Jia, L.; Chen, Q.; Zhang, H.; Deng, J.; Lu, J.; Xu, L.; Li, H.; Hu, F.; Jiao, J. Adaptive evaluation for agricultural sustainability of different fertilizer management options for a green manure-maize rotation system: Impacts on crop yield, soil biochemical properties and organic carbon fractions. Sci. Total Environ. 2024, 908, 168170. [Google Scholar] [CrossRef]
  20. Xu, W.; Yang, Q.; Jiang, Y.; Yu, J.; Li, J.; Liu, W.; Wu, Z. Improving soil pH, nutrient concentrations, and enzyme activities by green manure returning in young and mature rubber plantation on Hainan Island, China. Plant Soil 2023, 495, 341–358. [Google Scholar] [CrossRef]
  21. Ablimit, R.; Li, W.; Zhang, J.; Gao, H.; Zhao, Y.; Cheng, M.; Meng, X.; An, L.; Chen, Y. Altering microbial community for improving soil properties and agricultural sustainability during a 10-year maize-green manure intercropping in Northwest China. J. Environ. Manag. 2022, 321, 115859. [Google Scholar] [CrossRef] [PubMed]
  22. LeBlanc, N. Green Manures Alter Taxonomic and Functional Characteristics of Soil Bacterial Communities. Microb. Ecol. 2022, 85, 684–697. [Google Scholar] [CrossRef] [PubMed]
  23. Bui, H.X.; Desaeger, J.A. Volatile compounds as potential bio-fumigants against plant-parasitic nematodes—A mini review. J. Nematol. 2021, 53, 1–12. [Google Scholar] [CrossRef] [PubMed]
  24. Hu, Z.; Zhao, Q.; Zhang, X.; Ning, X.; Liang, H.; Cao, W. Winter Green Manure Decreases Subsoil Nitrate Accumulation and Increases N Use Efficiencies of Maize Production in North China Plain. Plants 2023, 12, 311. [Google Scholar] [CrossRef] [PubMed]
  25. Stein, S.; Hartung, J.; Perkons, U.; Möller, K.; Zikeli, S. Plant and soil N of different winter cover crops as green manure for subsequent organic white cabbage. Nutr. Cycl. Agroecosyst. 2023, 127, 285–298. [Google Scholar] [CrossRef]
  26. Zhang, J.; Nie, J.; Cao, W.; Gao, Y.; Lu, Y.; Liao, Y. Long-term green manuring to substitute partial chemical fertilizer simultaneously improving crop productivity and soil quality in a double-rice cropping system. Eur. J. Agron. 2023, 142, 126641. [Google Scholar] [CrossRef]
  27. Kumar, S.; Meena, R.N.; Singh, R.K.; Srivastava, V.K.; Kumar, V.; Hemalatha, K. Studies on tillage and green manuring for enhancing productivity of wheat (Triticum aestivum). Indian J. Agric. Sci. 2022, 92, 353–356. [Google Scholar] [CrossRef]
  28. Luo, Y.; Xiao, H.B.; Wu, X.; Wu, X.; Wu, Y.P.; Jiang, Y.B.; Hu, R.G. Mitigation of nutrient runoff loss using reduced nitrogen application and green manure planting in citrus orchard in Hubei, China. J. Soils Sediments 2023, 23, 582–595. [Google Scholar] [CrossRef]
  29. Regina, K.; Singh, P.; Känkänen, H. Impacts of green manure on crop yield, nitrogen leaching and nitrous oxide emissions in sandy and clay soil lysimeters. Agric. Food Sci. 2021, 30, 53–62. [Google Scholar] [CrossRef]
  30. Elfstrand, S.; Båth, B.; Mårtensson, A. Influence of various forms of green manure amendment on soil microbial community composition, enzyme activity and nutrient levels in leek. Appl. Soil Ecol. 2007, 36, 70–82. [Google Scholar] [CrossRef]
  31. Piotrowska-Dlugosz, A.; Wilczewski, E. Influence of field pea (Pisum sativum L.) as catch crop cultivated for green manure on soil phosphorus and P-cycling enzyme activity. Arch. Agron. Soil Sci. 2020, 66, 1570–1582. [Google Scholar] [CrossRef]
  32. Xu, J.; Si, L.L.; Zhang, X.; Cao, K.; Wang, J.H. Various green manure-fertilizer combinations affect the soil microbial community and function in immature red soil. Front. Microbiol. 2023, 14, 16. [Google Scholar] [CrossRef] [PubMed]
  33. Glab, T.; Kulig, B. Effect of mulch and tillage system on soil porosity under wheat (Triticum aestivum). Soil Tillage Res. 2008, 99, 169–178. [Google Scholar] [CrossRef]
  34. Frøseth, R.B.; Bakken, A.K.; Bleken, M.A.; Riley, H.; Pommeresche, R.; Thorup-Kristensen, K.; Hansen, S. Effects of green manure herbage management and its digestate from biogas production on barley yield, N recovery, soil structure and earthworm populations. Eur. J. Agron. 2014, 52, 90–102. [Google Scholar] [CrossRef]
  35. Dahlin, A.S.; Stenberg, M.; Marstorp, H. Mulch N recycling in green manure leys under Scandinavian conditions. Nutr. Cycl. Agroecosyst. 2011, 91, 119–129. [Google Scholar] [CrossRef]
  36. Sharma, A.R.; Ghosh, A. Effect of green manuring with Sesbania aculeata and nitrogen fertilization on the performance of direct-seeded flood-prone lowland rice. Nutr. Cycl. Agroecosyst. 2000, 57, 141–153. [Google Scholar] [CrossRef]
  37. Ranaivoson, L.; Falconnier, G.N.; Affholder, F.; Leroux, L.; Autfray, P.; Muller, B.; Auzoux, S.; Ripoche, A. Can green manure contribute to sustainable intensification of rainfed rice production in Madagascar? Field Crops Res. 2022, 289, 14. [Google Scholar] [CrossRef]
  38. Liu, J.X.; Peng, S.J.; Faivre-Vuillin, B.; Xu, Z.H.; Zhang, D.Q.; Zhou, G.Y. Erigeron annuus (L.) Pers., as a green manure for ameliorating soil exposed to acid rain in Southern China. J. Soils Sediments 2008, 8, 452–460. [Google Scholar] [CrossRef]
  39. Xie, Z.J.; Shah, F.R.; Zhou, C.H. Combining Rice Straw Biochar with Leguminous Cover Crop as Green Manure and Mineral Fertilizer Enhances Soil Microbial Biomass and Rice Yield in South China. Front. Plant Sci. 2022, 13, 778738. [Google Scholar] [CrossRef]
  40. Gautam, R.; Shriwastav, C.P.; Lamichhane, S.; Baral, B.R. The Residual Effect of Pre-Rice Green Manuring on a Succeeding Wheat Crop (Triticum aestivum L.) in the Rice-Wheat Cropping System in Banke, Nepal. Int. J. Agron. 2021, 2021, 4142743. [Google Scholar] [CrossRef]
  41. Balota, E.L.; Chaves, J.C. Enzymatic activity and mineralization of carbon and nitrogen in soil cultivated with coffee and green manures. Rev. Bras. Cienc. Solo 2010, 34, 1573–1583. [Google Scholar] [CrossRef]
  42. Nazir, S.; Zaman, Q.U.; Abbasi, A.; Komal, N.; Riaz, U.; Ashraf, K.; Ahmad, N.; Agarwal, S.; Nasir, R.; Chen, Y.L. Bioresource Nutrient Recycling in the Rice-Wheat Cropping System: Cornerstone of Organic Agriculture. Plants 2021, 10, 2323. [Google Scholar] [CrossRef] [PubMed]
  43. Liaudanskiene, I.; Zukaitis, T.; Velykis, A.; Satkus, A.; Parasotas, I. The impact of tillage practices on the distribution of humified organic carbon in a clay loam. Zemdirbyste-Agriculture 2021, 108, 11–18. [Google Scholar] [CrossRef]
  44. Wilczewski, E.; Sadkiewicz, J.; Piotrowska-Dlugosz, A.; Galezewski, L. Change of Plant Nutrients in Soil and Spring Barley Depending on the Field Pea Management as a Catch Crop. Agriculture 2021, 11, 394. [Google Scholar] [CrossRef]
  45. Gimsing, A.L.; Kirkegaard, J.A. Glucosinolate and isothiocyanate concentration in soil following incorporation of Brassica biofumigants. Soil Biol. Biochem. 2006, 38, 2255–2264. [Google Scholar] [CrossRef]
  46. Ates, E.; Tekeli, A.S.; Boynukara, B. Performance of fodder pea (Pisum arvense L.)-fiddleneck (Phacelia tanacetifolia Benth.) mixture under different nitrogen doses. Rom. Agric. Res. 2014, 31, 213–218. [Google Scholar]
  47. Wysokinski, A.; Lozak, I. The Dynamic of Nitrogen Uptake from Different Sources by Pea (Pisum sativum L.). Agriculture 2021, 11, 81. [Google Scholar] [CrossRef]
  48. ISO_13878; Soil Quality—Determination of Total Nitrogen Content by Dry Combustion (Elemental Analysis). International Organization for Standardization: Geneva, Switzerland, 1998.
  49. ISO_10694; Soil Quality—Determination of Organic and Total Carbon after Dry Combustion (Elemental Analysis). International Organization for Standardization: Geneva, Switzerland, 1995.
  50. Mehlich, A. Mehlich 3 soil test extractant: A modification of Mehlich 2 extractant. Commun. Soil Sci. Plant Anal. 2008, 15, 1409–1416. [Google Scholar] [CrossRef]
  51. ISO_13906; Animal Feeding Stuffs—Determination of Acid Detergent Fibre (ADF) and Acid Detergent Lignin (ADL) Contents. International Organization for Standardization: Geneva, Switzerland, 2008.
  52. Van Soest, P.J.; Robertson, J.B.; Lewis, B.A. Methods for Dietary Fiber, Neutral Detergent Fiber, and Nonstarch Polysaccharides in Relation to Animal Nutrition. J. Dairy Sci. 1991, 74, 3583–3597. [Google Scholar] [CrossRef]
  53. Tambone, F.; Genevini, P.; D’Imporzano, G.; Adani, F. Assessing amendment properties of digestate by studying the organic matter composition and the degree of biological stability during the anaerobic digestion of the organic fraction of MSW. Bioresour. Technol. 2009, 100, 3140–3142. [Google Scholar] [CrossRef]
  54. Marrubini, G.; Papetti, A.; Genorini, E.; Ulrici, A. Determination of the Sugar Content in Commercial Plant Milks by Near Infrared Spectroscopy and Luff-Schoorl Total Glucose Titration. Food Anal. Methods 2017, 10, 1556–1567. [Google Scholar] [CrossRef]
  55. Kintl, A.; Hammerschmiedt, T.; Vítěz, T.; Brtnický, M.; Vejražka, K.; Huňady, I.; Látal, O.; Elbl, J. Possibility of using tannins to control greenhouse gas production during digestate storage. Waste Manag. 2023, 156, 75–83. [Google Scholar] [CrossRef] [PubMed]
  56. ISO_6865; Animal Feeding Stuffs—Determination of Crude Fibre Content—Method with Intermediate Filtration. International Organization for Standardization: Geneva, Switzerland, 2000.
  57. Priego-Capote, F.; De Castro, M.L. Analytical uses of ultrasound I. Sample preparation. Trends Analyt. Chem. 2004, 23, 644–653. [Google Scholar] [CrossRef]
  58. Dhaliwal, G.S.; Gupta, N.; Kukal, S.S.; Meetpal, S. Standardization of Automated Vario EL III CHNS Analyzer for Total Carbon and Nitrogen Determination in Plants. Commun. Soil Sci. Plant Anal. 2014, 45, 1316–1324. [Google Scholar] [CrossRef]
  59. ISO_11261; Soil Quality—Determination of Total Nitrogen: Modified Kjeldahl Method. International Organization for Standardization: Geneva, Switzerland, 1995.
  60. ISO_6869; Animal Feeding Stuffs—Determination of the Contents of Calcium, Copper, Iron, Magnesium, Manganese, Potassium, Sodium and Zinc—Method Using Atomic Absorption Spectrometry. International Organization for Standardization: Geneva, Switzerland, 2000.
  61. ISO_10390; Soil Quality—Determination of pH. International Organization for Standardization: Geneva, Switzerland, 2005.
  62. Doi, R.; Ranamukhaarachchi, S.L. Soil dehydrogenase in a land degradation-rehabilitation gradient: Observations from a savanna site with a wet/dry seasonal cycle. Rev. Biol. Trop. 2009, 57, 223–234. [Google Scholar] [CrossRef]
  63. ISO_20130; Soil Quality—Measurement of Enzyme Activity Patterns in Soil Samples Using Colorimetric Substrates in Micro-Well Plates. International Organization for Standardization: Geneva, Switzerland, 2018.
  64. Campbell, C.D.; Chapman, S.J.; Cameron, C.M.; Davidson, M.S.; Potts, J.M. A rapid microtiter plate method to measure carbon dioxide evolved from carbon substrate amendments so as to determine the physiological profiles of soil microbial communities by using whole soil. Appl. Environ. Microbiol. 2003, 69, 3593–3599. [Google Scholar] [CrossRef]
  65. R_Core_Team. R: A Language and Environment for Statistical Computing; R Foundation for Statistical Computing: Vienna, Austria, 2023; Available online: https://www.R-project.org/ (accessed on 23 August 2024).
  66. Wickham, H.; Pedersen, T.; Seidel, D. Scale Functions for Visualization. 2023. Available online: https://scales.r-lib.org (accessed on 23 August 2024).
  67. Wickham, H. ggplot2: Elegant Graphics for Data Analysis; Wickham, H., Navarro, D., Pedersen, T.L., Eds.; Taylor & Francis: Abingdon, UK, 2016. [Google Scholar]
  68. Auguie, B.; Antonov, A. gridExtra: Miscellaneous Functions for "Grid" Graphics, R Package Version 2.3; 2017. Available online: https://CRAN.R-project.org/package=gridExtra (accessed on 23 August 2024).
  69. Arnold, J. ggthemes: Extra Themes, Scales and Geoms for ‘ggplot2’. 2023. Available online: https://cran.r-project.org/web/packages/ggthemes/index.html (accessed on 23 August 2024).
  70. Zar, J.H. Biostatistical Analysis, 2nd ed.; Prentice-Hall, Inc.: Englewood Cliffs, NJ, USA, 1984; p. 718. [Google Scholar]
  71. Mendiburu, F. Agricolae: Statistical Procedures for Agricultural Research, version 1.3.7; 2023. Available online: https://cran.r-project.org/web/packages/agricolae/index.html (accessed on 23 August 2024).
  72. Faraway, R.J.J. Linear Models with R; Chapman & Hall/CRC Press: Boca Raton, FL, USA, 2014. [Google Scholar]
  73. Lê, S.; Josse, J.; Husson, F. FactoMineR: An R Package for Multivariate Analysis. J. Stat. Softw. 2008, 25, 1–18. [Google Scholar] [CrossRef]
  74. Kassambara, A.; Mundt, F. Factoextra: Extract and Visualize the Results of Multivariate Data Analyses, version 1.0.7; 2020. Available online: https://CRAN.R-project.org/package=factoextra (accessed on 23 August 2024).
  75. Hinkle, D.E.; Wiersma, W.; Jurs, S.G. Applied Statistics for the Behavioral Sciences, 5th ed.; Houghton Mifflin: Boston, MA, USA, 2003. [Google Scholar]
  76. Peterson, B.; Carl, P. PerformanceAnalytics: Econometric Tools for Performance and Risk Analysis (R Package Version 2.0. 4) [Computer Software]. 2020. Available online: https://rdrr.io/cran/PerformanceAnalytics/ (accessed on 23 August 2024).
  77. Wei, T.; Simko, V. R Package “Corrplot”: Visualization of a Correlation Matrix, Version 0.92; 2021. Available online: https://rdrr.io/cran/corrplot/ (accessed on 23 August 2024).
  78. Pekár, S.; Brabec, M. Modern Analysis of Biological Data. Generalized Linear Models in R; Masaryk University Press: Brno, Czech Republic, 2016. [Google Scholar]
  79. Yue, K.; Peng, C.; Yang, W.; Peng, Y.; Zhang, C.; Huang, C.; Wu, F. Degradation of lignin and cellulose during foliar litter decomposition in an alpine forest river. Ecosphere 2016, 7, e01523. [Google Scholar] [CrossRef]
  80. Palucha, N.; Fojt, J.; Holátko, J.; Hammerschmiedt, T.; Kintl, A.; Brtnický, M.; Řezáčová, V.; De Winterb, K.; Uitterhaegen, E.; Kučerík, J. Does poly-3-hydroxybutyrate biodegradation affect the quality of soil organic matter? Chemosphere 2024, 352, 141300. [Google Scholar] [CrossRef]
  81. Eckel, F.; Sinzinger, K.; Van Opdenbosch, D.; Schieder, D.; Sieber, V.; Zollfrank, C. Influence of microbial biomass content on biodegradation and mechanical properties of poly(3-hydroxybutyrate) composites. Biodegradation 2024, 35, 209–224. [Google Scholar] [CrossRef]
  82. Nannipieri, P.; Ascher, J.; Ceccherini, M.T.; Landi, L.; Pietramellara, G.; Renella, G. Microbial diversity and soil functions. Eur. J. Soil Sci. 2003, 54, 655–670. [Google Scholar] [CrossRef]
  83. Xia, Q.; Rufty, T.; Shi, W. Soil microbial diversity and composition: Links to soil texture and associated properties. Soil Biol. Biochem. 2020, 149, 107953. [Google Scholar] [CrossRef]
  84. Fontaine, S.; Henault, C.; Aamor, A.; Bdioui, N.; Bloor, J.M.G.; Maire, V.; Mary, B.; Revaillot, S.; Maron, P.A. Fungi mediate long term sequestration of carbon and nitrogen in soil through their priming effect. Soil Biol. Biochem. 2011, 43, 86–96. [Google Scholar] [CrossRef]
  85. Chowdhury, S.; Farrell, M.; Bolan, N. Priming of soil organic carbon by malic acid addition is differentially affected by nutrient availability. Soil Biol. Biochem. 2014, 77, 158–169. [Google Scholar] [CrossRef]
  86. Sauvadet, M.; Lashermes, G.; Alavoine, G.; Recous, S.; Chauvat, M.; Maron, P.-A.; Bertrand, I. High carbon use efficiency and low priming effect promote soil C stabilization under reduced tillage. Soil Biol. Biochem. 2018, 123, 64–73. [Google Scholar] [CrossRef]
  87. Razanamalala, K.; Fanomezana, R.; Razafimbelo, T.; Chevallier, T.; Trap, J.; Blanchart, E.; Bernard, L. The priming effect generated by stoichiometric decomposition and nutrient mining in cultivated tropical soils: Actors and drivers. Appl. Soil Ecol. 2018, 126, 21–33. [Google Scholar] [CrossRef]
  88. Guenet, B.; Neill, C.; Bardoux, G.; Abbadie, L. Is there a linear relationship between priming effect intensity and the amount of organic matter input? Appl. Soil Ecol. 2010, 46, 436–442. [Google Scholar] [CrossRef]
  89. Zhao, F.; Wang, J.; Li, Y.; Xu, X.; He, L.; Wang, J.; Ren, C.; Guo, Y. Microbial functional genes driving the positive priming effect in forest soils along an elevation gradient. Soil Biol. Biochem. 2022, 165, 108498. [Google Scholar] [CrossRef]
  90. Bernard, L.; Basile-Doelsch, I.; Derrien, D.; Fanin, N.; Fontaine, S.; Guenet, B.; Karimi, B.; Marsden, C.; Maron, P.-A. Advancing the mechanistic understanding of the priming effect on soil organic matter mineralisation. Funct. Ecol. 2022, 36, 1355–1377. [Google Scholar] [CrossRef]
  91. Xu, M.; Zeng, Q.; Liu, Y.; Liu, C.; Zhang, Q.; Mei, K.; Yuan, X.; Zhang, X.; Chen, Y. Keystone Soil Microbial Modules Associated with Priming Effect under Nitrogen- and Glucose-Addition Treatments. Forests 2023, 14, 1207. [Google Scholar] [CrossRef]
  92. Dijkstra, F.A.; Carrillo, Y.; Pendall, E.; Morgan, J.A. Rhizosphere priming: A nutrient perspective. Front. Microbiol. 2013, 4, 216. [Google Scholar] [CrossRef]
  93. Moorhead, D.L.; Sinsabaugh, R.L. A theoretical model of litter decay and microbial interaction. Ecol. Monogr. 2006, 76, 151–174. [Google Scholar] [CrossRef]
  94. Craine, J.M.; Morrow, C.; Fierer, N. Microbial nitrogen limitation increases decomposition. Ecology 2007, 88, 2105–2113. [Google Scholar] [CrossRef]
  95. Tian, Q.; Yang, X.; Wang, X.; Liao, C.; Li, Q.; Wang, M.; Wu, Y.; Liu, F. Microbial community mediated response of organic carbon mineralization to labile carbon and nitrogen addition in topsoil and subsoil. Biogeochemistry 2016, 128, 125–139. [Google Scholar] [CrossRef]
  96. Wild, B.; Schnecker, J.; Alves, R.J.E.; Barsukov, P.; Bárta, J.; Čapek, P.; Gentsch, N.; Gittel, A.; Guggenberger, G.; Lashchinskiy, N.; et al. Input of easily available organic C and N stimulates microbial decomposition of soil organic matter in arctic permafrost soil. Soil Biol. Biochem. 2014, 75, 143–151. [Google Scholar] [CrossRef]
  97. Koranda, M.; Kaiser, C.; Fuchslueger, L.; Kitzler, B.; Sessitsch, A.; Zechmeister-Boltenstern, S.; Richter, A. Fungal and bacterial utilization of organic substrates depends on substrate complexity and N availability. FEMS Microbiol. Ecol. 2014, 87, 142–152. [Google Scholar] [CrossRef]
  98. Murphy, C.J.; Baggs, E.M.; Morley, N.; Wall, D.P.; Paterson, E. Rhizosphere priming can promote mobilisation of N-rich compounds from soil organic matter. Soil Biol. Biochem. 2015, 81, 236–243. [Google Scholar] [CrossRef]
  99. Tipping, E.; Somerville, C.J.; Luster, J. The C:N:P:S stoichiometry of soil organic matter. Biogeochemistry 2016, 130, 117–131. [Google Scholar] [CrossRef]
  100. Fang, X.-M.; Zhang, X.-L.; Chen, F.-S.; Zong, Y.-Y.; Bu, W.-S.; Wan, S.-Z.; Luo, Y.; Wang, H. Phosphorus addition alters the response of soil organic carbon decomposition to nitrogen deposition in a subtropical forest. Soil Biol. Biochem. 2019, 133, 119–128. [Google Scholar] [CrossRef]
  101. Lenzi, A.; Antichi, D.; Bigongiali, F.; Mazzoncini, M.; Migliorini, P.; Tesi, R. Effect of different cover crops on organic tomato production. Renew. Agric. Food Syst. 2009, 24, 92–101. [Google Scholar] [CrossRef]
  102. Marinari, S.; Mancinelli, R.; Brunetti, P.; Campiglia, E. Soil quality, microbial functions and tomato yield under cover crop mulching in the Mediterranean environment. Soil Tillage Res. 2015, 145, 20–28. [Google Scholar] [CrossRef]
  103. Wayne Reeves, D.; Follett, R.; Delgado, J. Winter Cover Crops. In Encyclopedia of Soil Science, 2nd ed.; Springer: Berlin/Heidelberg, Germany, 2005. [Google Scholar] [CrossRef]
  104. Zhang, D.B.; Yao, Z.Y.; Chen, J.; Yao, P.W.; Zhao, N.; He, W.X.; Li, Y.Y.; Zhang, S.Q.; Zhai, B.N.; Wang, Z.H.; et al. Improving soil aggregation, aggregate-associated C and N, and enzyme activities by green manure crops in the Loess Plateau of China. Eur. J. Soil Sci. 2019, 70, 1267–1279. [Google Scholar] [CrossRef]
  105. Caban, J.R.; Kuppusamy, S.; Kim, J.H.; Yoon, Y.E.; Kim, S.Y.; Lee, Y.B. Green manure amendment enhances microbial activity and diversity in antibiotic-contaminated soil. Appl. Soil Ecol. 2018, 129, 72–76. [Google Scholar] [CrossRef]
  106. Janusauskaite, D.; Arlauskienė, A.; Maikštėnienė, S. Soil mineral nitrogen and microbial parameters as influenced by catch crops and straw management. Zemdirbyste-Agriculture 2013, 100, 9–18. [Google Scholar] [CrossRef]
  107. Ansari, M.A.; Babu, S.; Choudhary, J.; Ravisankar, N.; Panwar, A.S. Soil quality restoration and yield stabilization in acidic soils of northeastern Himalayas: Five years impact of green manuring and crop residue management. Front. Environ. Sci. 2022, 10, 940349. [Google Scholar] [CrossRef]
  108. Scavo, A.; Fontanazza, S.; Restuccia, A.; Pesce, G.R.; Abbate, C.; Mauromicale, G. The role of cover crops in improving soil fertility and plant nutritional status in temperate climates. A review. Agron. Sustain. Dev. 2022, 42, 93. [Google Scholar] [CrossRef]
  109. Piotrowska-Dlugosz, A.; Wilczewski, E. Influences of Catch Crop and Its Incorporation Time on Soil Carbon and Carbon-Related Enzymes. Pedosphere 2015, 25, 569–579. [Google Scholar] [CrossRef]
  110. Solangi, F.; Bai, J.S.; Gao, S.J.; Yang, L.; Zhou, G.P.; Cao, W.D. Improved Accumulation Capabilities of Phosphorus and Potassium in Green Manures and Its Relationship with Soil Properties and Enzymatic Activities. Agronomy 2019, 9, 708. [Google Scholar] [CrossRef]
  111. Dick, R.P. Soil Enzyme Activities as Indicators of Soil Quality. In Defining Soil Quality for a Sustainable Environment; Wiley: Hoboken, NJ, USA, 1994; pp. 107–124. [Google Scholar]
  112. Fierer, N.; Bradford, M.A.; Jackson, R.B. Toward an ecological classification of soil bacteria. Ecology 2007, 88, 1354–1364. [Google Scholar] [CrossRef]
  113. Ding, T.; Yan, Z.; Zhang, W.; Duan, T. Green Manure Crops Affected Soil Chemical Properties and Fungal Diversity and Community of Apple Orchard in the Loess Plateau of China. J. Soil Sci. Plant Nutr. 2021, 21, 1089–1102. [Google Scholar] [CrossRef]
  114. Gao, H.; Tian, G.; Khashi, U.R.M.; Wu, F. Cover Crop Species Composition Alters the Soil Bacterial Community in a Continuous Pepper Cropping System. Front. Microbiol. 2021, 12, 789034. [Google Scholar] [CrossRef] [PubMed]
  115. Domagała-Świątkiewicz, I.; Siwek, P. Effect of field pea (Pisum sativum subsp. arvense (L.) Asch.) and pea-oat (Avena sativa L.) biculture cover crops on high tunnel vegetable under organic production system. Org. Agric. 2022, 12, 91–106. [Google Scholar] [CrossRef]
  116. Céspedes, C.; Espinoza, S.; Maass, V. Nitrogen transfer from legume green manure in a crop rotation to an onion crop using 15N natural abundance technique. Chil. J. Agric. Res. 2022, 82, 44–51. [Google Scholar] [CrossRef]
  117. Guo, J.H.; Liu, X.J.; Zhang, Y.; Shen, J.L.; Han, W.X.; Zhang, W.F.; Christie, P.; Goulding, K.W.; Vitousek, P.M.; Zhang, F.S. Significant acidification in major Chinese croplands. Science 2010, 327, 1008–1010. [Google Scholar] [CrossRef]
Figure 1. Dry aboveground biomass of maize grown in the soil with various cover crops used as green manure. Mean values (n = 3) ± standard error of mean (SE; error bars) in units g·plant−1; uppercase letters indicate differences between variants (discriminated by each pre-treatment burying and mulching), lowercase letters indicated differences between types of pre-treatment within each variant; differences were calculated by two-way ANOVA and Tukey’s HSD test at a statistical level of significance p ≤ 0.05.
Agronomy 14 02001 g001
Figure 2. pH(CaCl2) in the soil before (a) and after (b) maize cultivation with various cover crops used as green manure. Mean values (n = 3) ± standard error of mean (SE; error bars); uppercase letters indicate differences between variants (discriminated by each pre-treatment burying and mulching), lowercase letters indicated differences between types of pre-treatment within each variant; differences were calculated by two-way ANOVA and Tukey’s HSD test at a statistical level of significance p ≤ 0.05.
Agronomy 14 02001 g002
Figure 3. Total carbon (Ctot) in the soil before (a) and after (b) maize cultivation with various cover crops used as green manure. Mean values (n = 3) ± standard error of mean (SE; error bars) in units % (w/w); uppercase letters indicate differences between variants (discriminated by each pre-treatment burying and mulching), lowercase letters indicated differences between types of pre-treatment within each variant; differences were calculated by two-way ANOVA and Tukey’s HSD test at a statistical level of significance p ≤ 0.05.
Agronomy 14 02001 g003
Figure 4. Dehydrogenase (DHA) in the soil before (a) and after (b) maize cultivation with various cover crops used as green manure. Mean values (n = 3) ± standard error of mean (SE; error bars) in units μg TPF·g−1·h−1; uppercase letters indicate differences between variants (discriminated by each pre-treatment burying and mulching), lowercase letters indicated differences between types of pre-treatment within each variant; differences were calculated by two-way ANOVA and Tukey’s HSD test at a statistical level of significance p ≤ 0.05.
Agronomy 14 02001 g004
Figure 5. β-glucosidase (GLU) in the soil before (a) and after (b) maize cultivation with various cover crops used as green manure. Mean values (n = 3) ± standard error of mean (SE; error bars) in units nmol PNP·g−1·min−1; uppercase letters indicate differences between variants (discriminated by each pre-treatment burying and mulching), lowercase letters indicated differences between types of pre-treatment within each variant; differences were calculated by two-way ANOVA and Tukey’s HSD test at a statistical level of significance p ≤ 0.05.
Agronomy 14 02001 g005
Figure 6. Respiration induced by D-glucose (Glc_SIR) in the soil before (a) and after (b) maize cultivation with various cover crops used as green manure. Mean values (n = 3) ± standard error of mean (SE; error bars) in units μg CO2·g−1·h−1; uppercase letters indicate differences between variants (discriminated by each pre-treatment burying and mulching), lowercase letters indicated differences between types of pre-treatment within each variant; differences were calculated by two-way ANOVA and Tukey’s HSD test at a statistical level of significance p ≤ 0.05.
Agronomy 14 02001 g006
Figure 7. Total nitrogen (Ntot) in the soil before (a) and after (b) maize cultivation with various cover crops used as green manure. Mean values (n = 3) ± standard error of mean (SE; error bars) in units % (w/w); uppercase letters indicate differences between variants (discriminated by each pre-treatment burying and mulching), lowercase letters indicated differences between types of pre-treatment within each variant; differences were calculated by two-way ANOVA and Tukey’s HSD test at a statistical level of significance p ≤ 0.05.
Agronomy 14 02001 g007
Figure 8. Urease (Ure) in the soil before (a) and after (b) maize cultivation with various cover crops used as green manure. Mean values (n = 3) ± standard error of mean (SE; error bars) in units nmol NH3·g−1·min−1; uppercase letters indicate differences between variants (discriminated by each pre-treatment burying and mulching), lowercase letters indicated differences between types of pre-treatment within each variant; differences were calculated by two-way ANOVA and Tukey’s HSD test at a statistical level of significance p ≤ 0.05.
Agronomy 14 02001 g008
Figure 9. Phosphatase (Phos) in the soil before (a) and after (b) maize cultivation with various cover crops used as green manure. Mean values (n = 3) ± standard error of mean (SE; error bars) in units nmol PNP·g−1·min−1; uppercase letters indicate differences between variants (discriminated by each pre-treatment burying and mulching), lowercase letters indicated differences between types of pre-treatment within each variant; differences were calculated by two-way ANOVA and Tukey’s HSD test at a statistical level of significance p ≤ 0.05.
Agronomy 14 02001 g009
Table 1. The basic properties of experimental soil.
DepthCtot [%]Ntot [%]C:NP [mg·kg −1]K [mg·kg −1]Mg [mg·kg −1]Ca [mg·kg −1]
Mean1.560.188.7118.00298.93234.232954.33
SD0.150.021.11.7325.923.589.81
Mean values (n = 3) ± standard deviation (SD), properties were determined by methods as follows: total carbon (Ctot) and nitrogen (Ntot) according to [48,49], and P, K, Mg, Ca was measured according to Mehlich 3 standard method [50].
Table 2. Arrangement of the experimental variants and collection schedule.
Green Manure TypeBiomass DoseTreatmentAbbreviationCollection
BeforeAfter
Control (no plant)—C-buriedCBCB_ICB_II
-mulchedCMCM_ICM_II
White mustard (Sinapis alba L.)—WMlowburiedWMLBWMLB_IWMLB_II
mulchedWMLMWMLM_IWMLM_II
highburiedWMHBWMHB_IWMHB_II
mulchedWMHMWMHM_IWMHM_II
Forest rye (Secale cereale L. var. multicaule Metzg. ex Alef.)—RlowburiedRLBRLB_IRLB_II
mulchedRLMRLM_IRLM_II
highburiedRHBRHB_IRHB_II
mulchedRHMRHM_IRHM_II
Fiddleneck (Phacelia tanacetifolia Benth.)—FlowburiedFLBFLB_IFLB_II
mulchedFLMFLM_IFLM_II
highburiedFHBFHB_IFHB_II
mulchedFHMFHM_IFHM_II
Safflower (Carthamus tinctorius L.)—SlowburiedSLBSLB_ISLB_II
mulchedSLMSLM_ISLM_II
highburiedSHBSHB_ISHB_II
mulchedSHMSHM_ISHM_II
Pea (Pisum sativum L.)—PlowburiedPLBPLB_IPLB_II
mulchedPLMPLM_IPLM_II
highburiedPHBPHB_IPHB_II
mulchedPHMPHM_IPHM_II
Table 3. Selected characteristics of green manure. The values are reported in w/w percentages in dry mass.
Green ManureRepetitionDry MassLigninCelluloseHemicelluloseSugarsLipidsAsh
White mustardmean93.146.9519.892.3012.533.1713.74
SE0.030.160.080.290.290.030.16
HSDaaabcbb
Perennial forest ryemean93.182.4613.901.4012.572.2114.56
SE0.040.030.110.220.030.050.35
HSDaebbccab
Fiddleneckmean92.835.419.732.2214.121.9715.75
SE0.030.100.140.030.030.060.39
HSDbcdbbca
Safflowermean92.734.4211.521.3810.681.9713.12
SE0.050.040.240.170.020.030.34
HSDbdcbdcb
Peamean93.116.2114.6222.3130.133.468.32
SE0.060.110.000.0710.060.070.10
HSDabbaaac
Green ManureRepetitionN_AGBP_AGBK_AGBC_AGBCa_AGBMg_AGB
White mustardmean3.410.383.8046.531.740.22
SE0.090.010.091.290.040.00
HSDbcbbabb
Perennial forest ryemean3.910.443.8045.431.690.21
SE0.100.010.081.250.030.01
HSDaababb
Fiddleneckmean2.320.304.6045.662.270.21
SE0.060.010.111.230.050.01
HSDdcaaab
Safflowermean3.470.233.3547.232.080.28
SE0.080.000.081.040.050.01
HSDabdcaaa
Peamean2.970.232.6249.460.770.22
SE0.080.000.060.950.020.00
HSDcddacb
Mean values (n = 3) ± standard error of mean (SE; error bars) are displayed in units: % (dry mass) and g·kg−1 of dry mass (all other displayed nutrient characteristics); lowercase letters indicated differences among properties of green manures, which were calculated by one-way ANOVA and Tukey’s HSD test at a statistical level of significance p ≤ 0.05.
Disclaimer/Publisher’s Note: The statements, opinions and data contained in all publications are solely those of the individual author(s) and contributor(s) and not of MDPI and/or the editor(s). MDPI and/or the editor(s) disclaim responsibility for any injury to people or property resulting from any ideas, methods, instructions or products referred to in the content.

