Article

Soil Organic Matter and Bulk Density: Driving Factors in the Vegetation-Mediated Restoration of Coastal Saline Lands in North China

by
Weiliu Li
1,2,*,
Jingsong Li
2,3,
Yujie Wu
1,2,
Kai Guo
1,2,
Xiaohui Feng
1,2 and
Xiaojing Liu
1,2
1
Key Laboratory of Agricultural Water Resources, CAS Engineering Laboratory for Efficient Utilization of Saline Resources, Center for Agricultural Resources Research, Institute of Genetics and Developmental Biology, Chinese Academy of Sciences, Shijiazhuang 050021, China
2
University of Chinese Academy of Sciences, Beijing 100049, China
3
The Institute of Agricultural Information and Economics (IAIE), Hebei Academy of Agriculture and Forestry Sciences, Shijiazhuang 050051, China
*
Author to whom correspondence should be addressed.
Agronomy 2024, 14(9), 2007; https://doi.org/10.3390/agronomy14092007
Submission received: 4 August 2024 / Revised: 28 August 2024 / Accepted: 2 September 2024 / Published: 3 September 2024
(This article belongs to the Section Grassland and Pasture Science)

Abstract

:
Coastal saline soils are an important soil resource that, when restored, can enhance arable land and preserve the natural ecology. With the aim of improving the use of coastal saline soils, we conducted a spot survey at Bohai coastal saline land to investigate the differences in soil properties between different vegetation types. The soil physical and chemical properties of various vegetation types, including Aeluropus sinensis, Imperata cylindrica, Tamarix chinensis, Lycium chinense, Hibiscus moscheutos, Helianthus annuus, Gossypium hirsutum, and Zea mays, were examined at two depth layers: 0–20 cm and 20–40 cm, and in two seasons, spring and autumn. The soil properties were compared with bare land as a control. The results indicated that the electrical conductivity, total soil salt content, sodium adsorption ratio, and bulk density of soils with vegetation cover were lower than those with bare land. On the other hand, soil pH, organic matter content, mean weight diameter, and saturated hydraulic conductivity were higher. The redundancy analysis results revealed a substantial positive correlation between soil pH, saturated hydraulic conductivity, water content, mean weight diameter, and organic matter content, as well as a significant positive correlation between soil electrical conductivity, total soil salt content, sodium adsorption ratio, and bulk density. Soil pH, saturated hydraulic conductivity, water content, mean weight diameter, organic matter content, and soil electrical conductivity, total soil salt content, sodium adsorption ratio, and bulk density were negatively correlated. The results of the structural equation model and variance decomposition showed that soil organic matter and bulk density were the key factors affecting the degree of soil salinization, and compared with their independent effects, their combined effect on soil salinization was greater. This study’s conclusions can provide a point of reference for further research on the mechanisms of soil improvement and desalinization in coastal saline land.

1. Introduction

Soil salinization is one of the biggest obstacles to the growth of agroforestry productivity and the enhancement of land-use efficiency [1,2]. About 20% of irrigated land is impacted by saline–alkali land, which is extensively dispersed throughout more than 100 countries and covers 800 million hectares, or 6% of the world’s total land area [3,4]. China has a coastline that spans 32,000 km, and the coastal area covers 2.17 million hectares; coastal saline–alkali land is widely distributed in these areas [5]. Because of groundwater infiltration and capillary water coming from the sea, the salt content in the soil is increased in coastal areas [6,7]. Several studies have demonstrated the resilience of coastal saline vegetation systems in the face of storms, tsunamis, a rise in sea level, and other natural disasters. These vegetation systems play a crucial role in preserving the ecological stability of coastal zones. Therefore, reclaiming vegetation in coastal areas is a cost-effective approach to ecological restoration [8,9].
The relationship between vegetation and soil is one of reciprocal influence and mutual restriction, with both promoting the growth and development of the other. This symbiotic relationship is beneficial for the long-term and sustainable development of land [10,11,12]. The growth and development of plants mostly rely on the adaptability of species to their surroundings [13]. Meanwhile, vegetation, in turn, can drive underlying environmental variation and change the soil’s physicochemical properties [14,15]. Considerable variations in the impacts of different types of vegetation on the quality of saline–alkali soil have been observed [16,17]. Soil salinity has a significant impact on the availability of soil nutrients and water in saline–alkali land. This leads to intricate connections between enzymes, microorganisms, and nutrients in the soil across different types of vegetation [18,19]. The alleviation of soil salinity in saline land after vegetation restoration was reported [20]. However, the understanding of how vegetation influences soil salinity and its underlying mechanisms is relatively inadequate, particularly in coastal saline land environments.
As soil salinity is remarkably related to the soil hydrological process at the study site, which is affected by a monsoon climate with concentrated rainfall in summer, there are seasonal dynamics of soil salinity; the soil salt content gradually increases as salt accumulates from the shallow saline groundwater during spring and sharply decreases after rainwater infiltration and salt leaching in autumn [21,22]. To investigate the impacts of different types of vegetation on changes in soil salinity and nutrient, physical, and chemical properties, spot investigations were conducted in spring and autumn at coastal saline land near the Bohai Sea, North China. At the study site, after 10 years of vegetation restoration, we selected eight types of plant patterns, namely, Aeluropus sinensis (AS), Imperata cylindrica (IC), Tamarix chinensis (TC), Lycium chinense (LC), Hibiscus moscheutos (HM), Helianthus annuus (HA), Gossypium hirsutum (GH), and Zea mays (ZM). Quantitative soil physicochemical properties were measured under different vegetation patterns and compared with those of bare land (CK) in soil layers at depths of 0–20 cm and 20–40 cm. Then, redundancy analysis (RDA), the structural equation model (SEM), and variance decomposition were used to analyze interrelationships and the comprehensive influence of the key soil factors on soil desalinization. The results of this study could serve as a guide for enhancing soil quality through the use of vegetation on coastal salt-affected land.

2. Materials and Methods

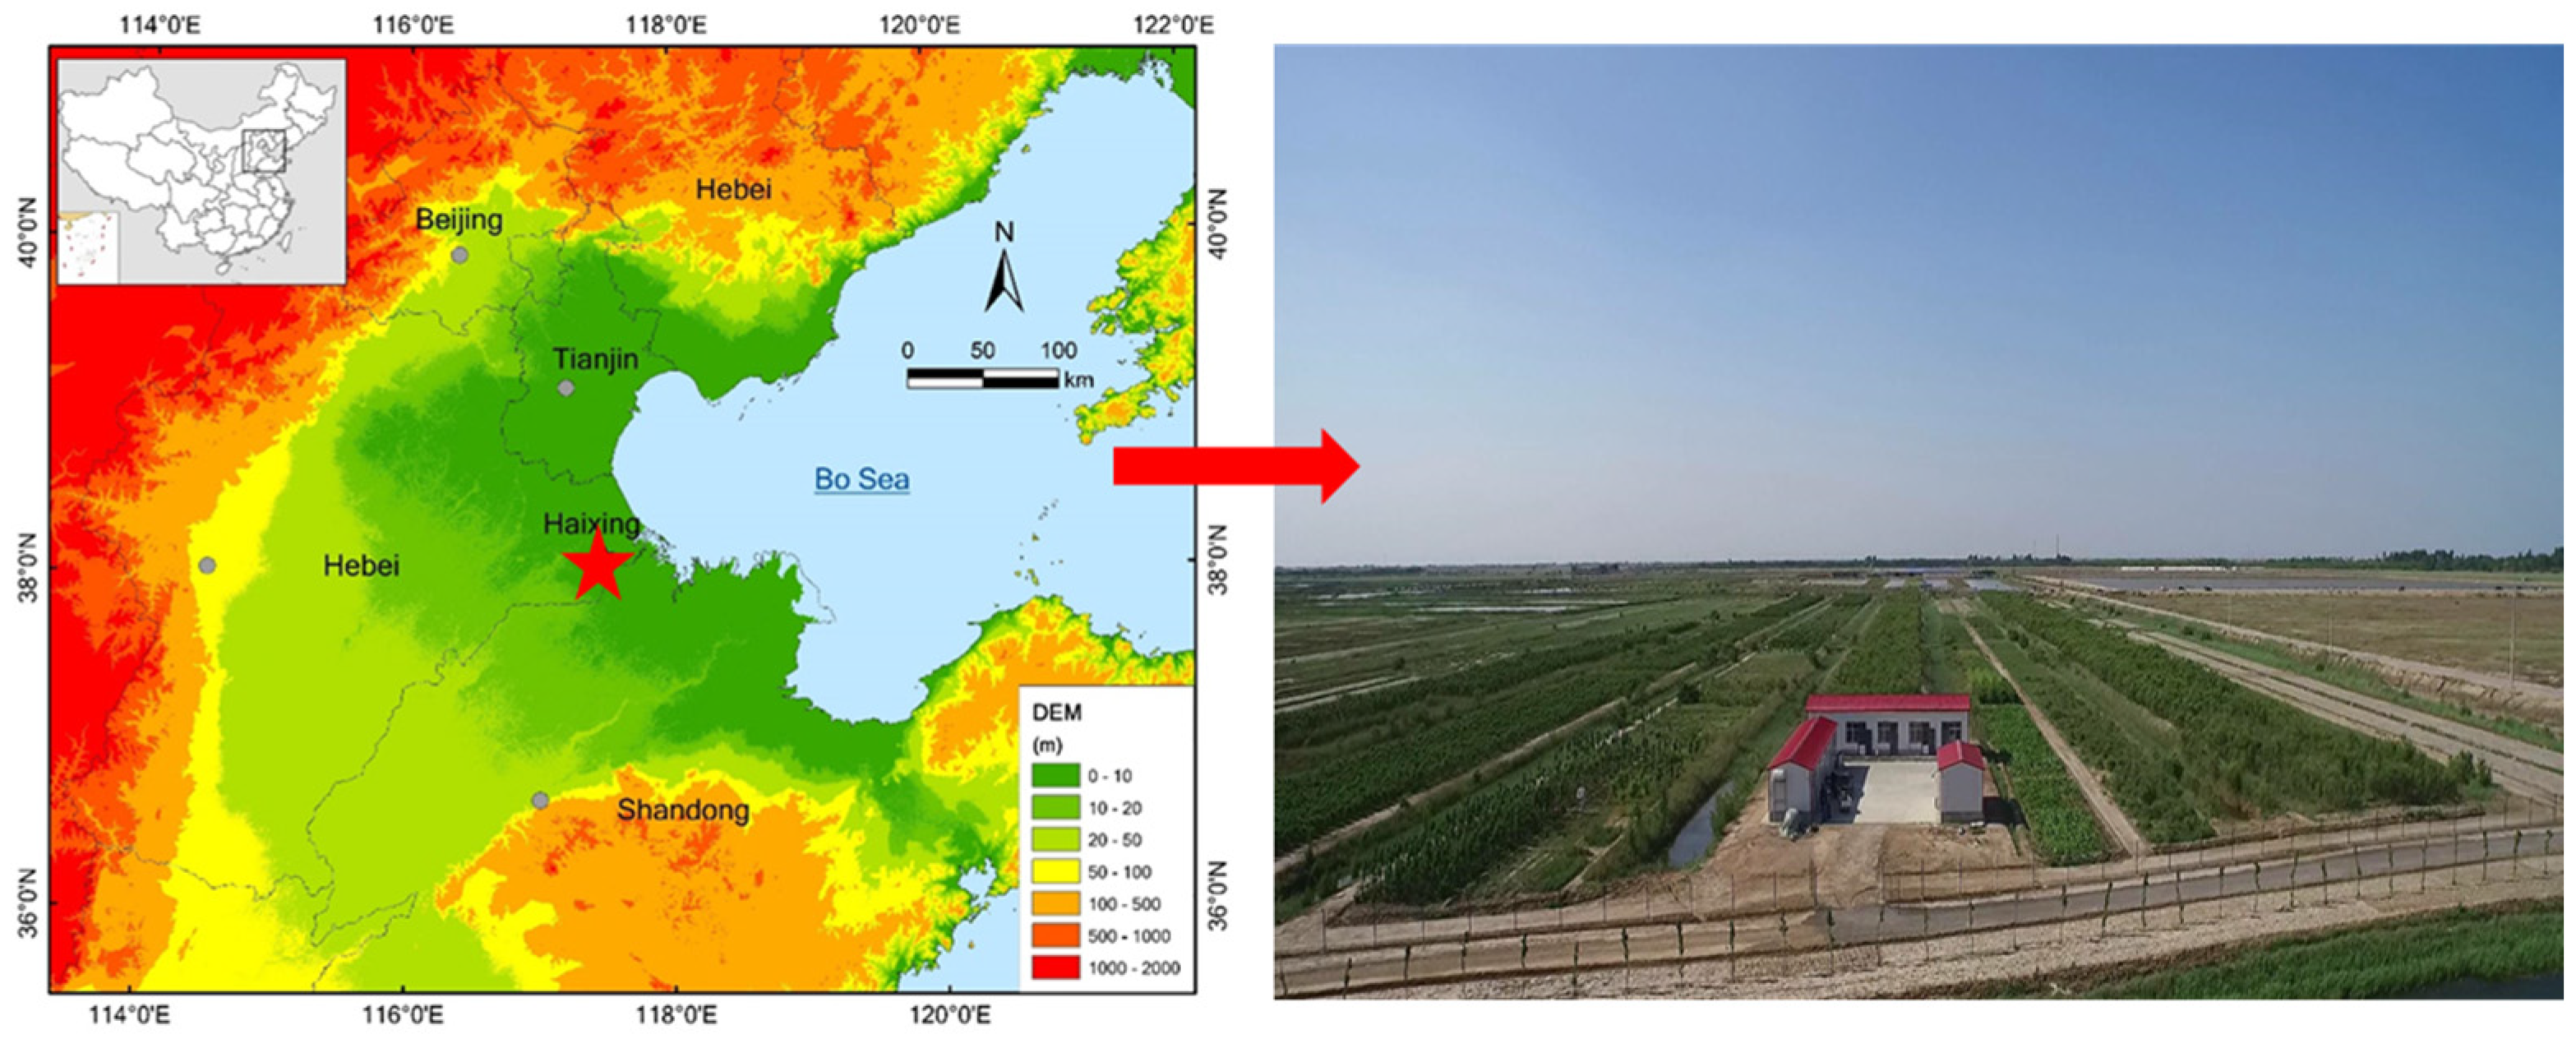
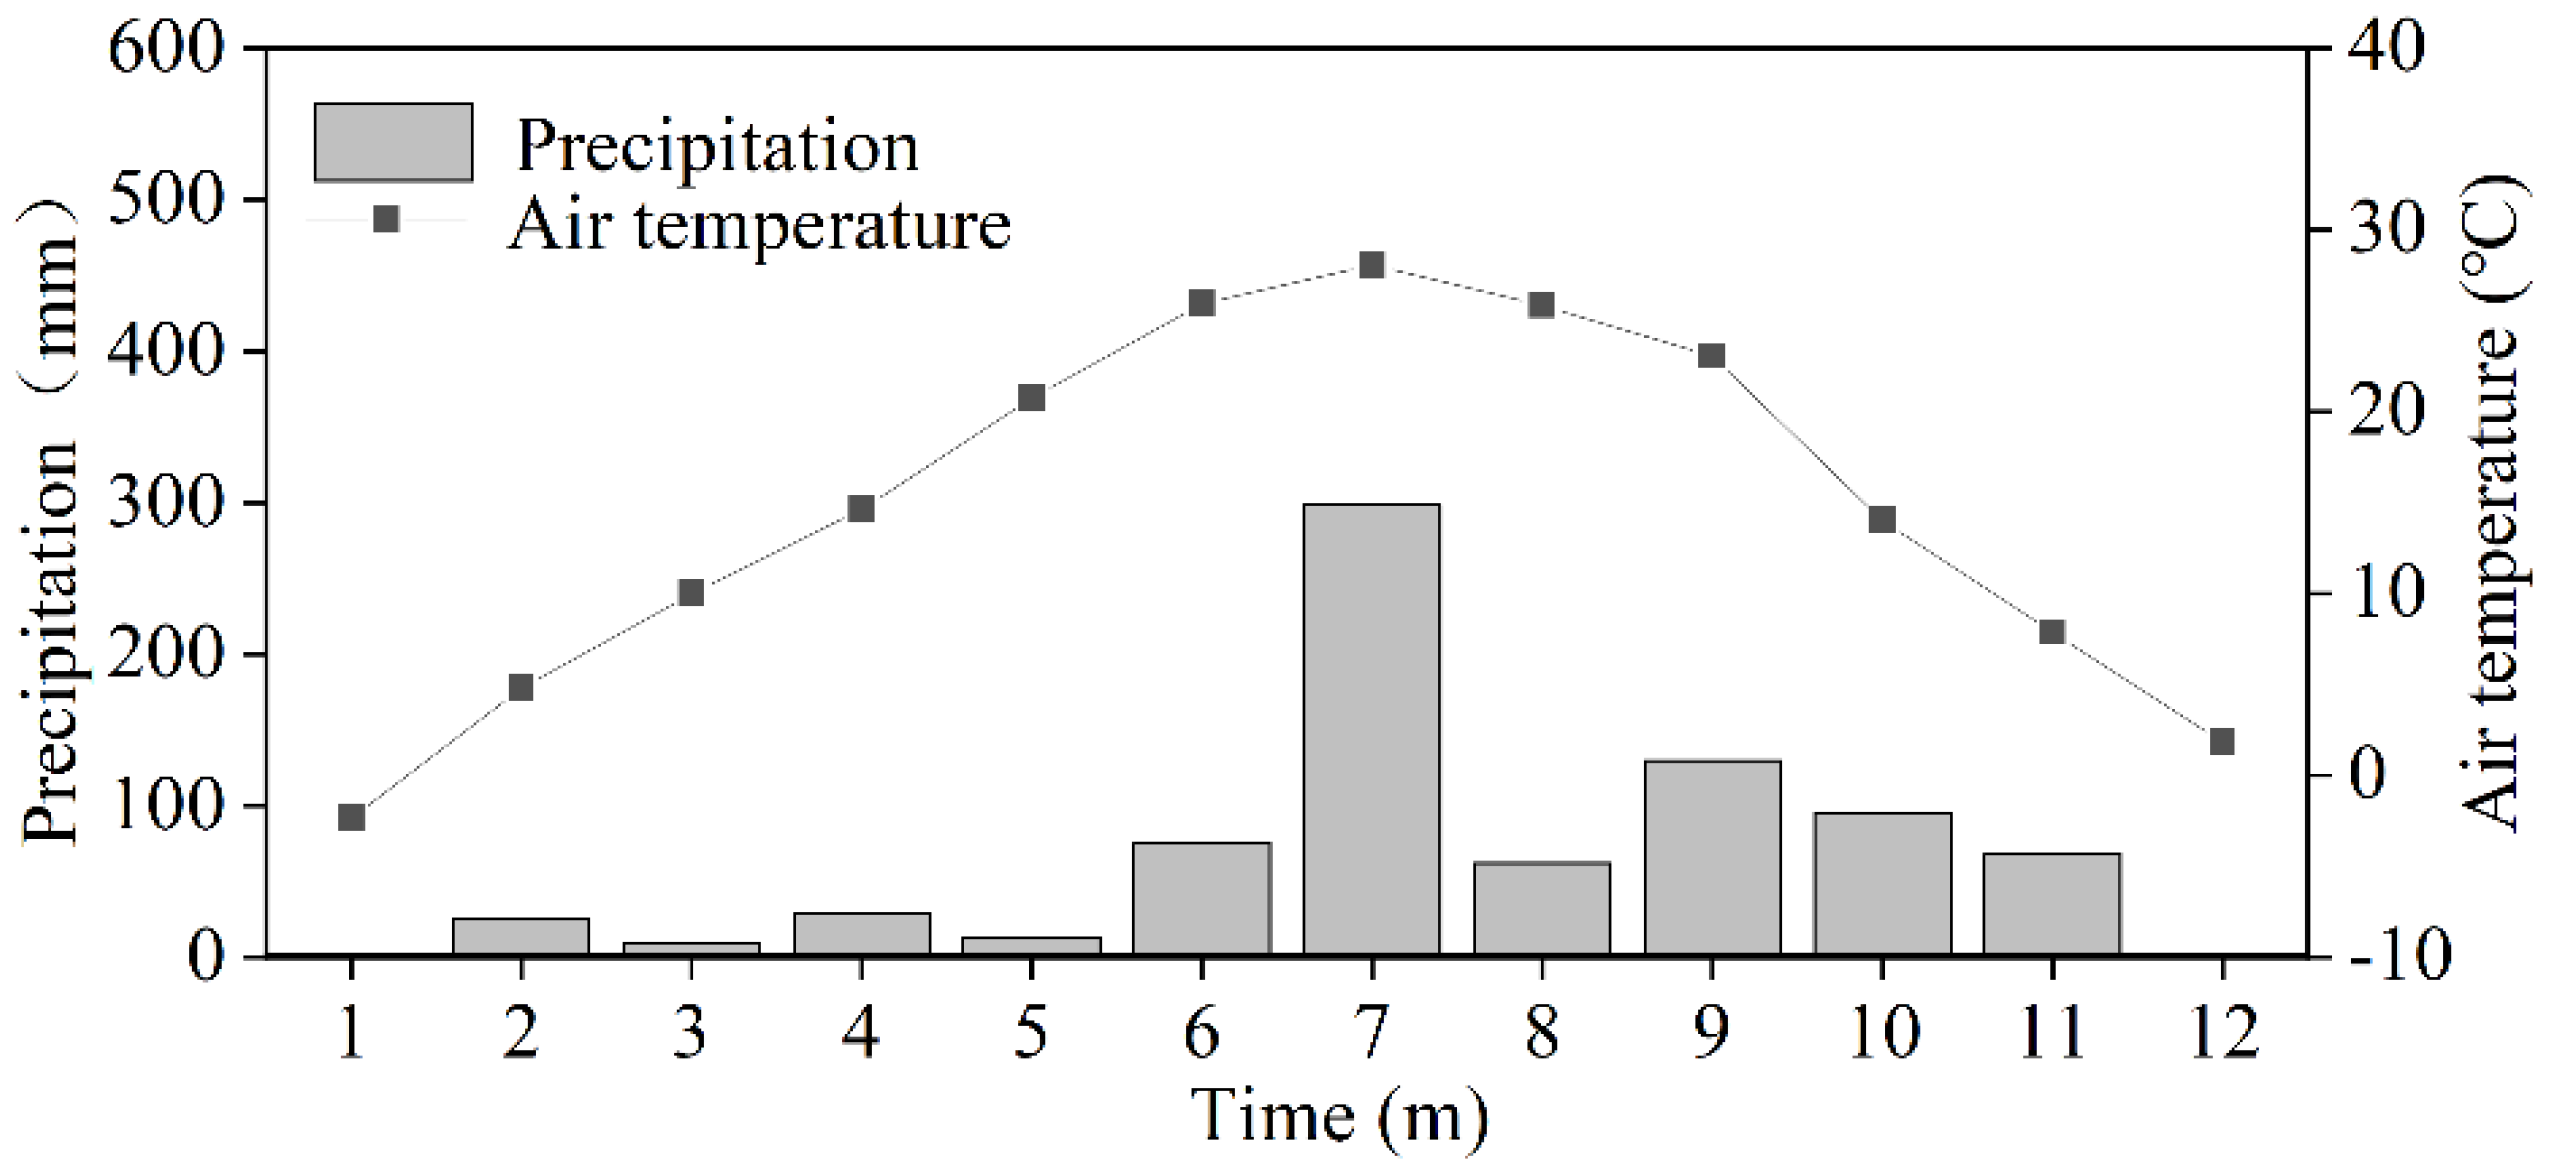
2.1. Experimental Site
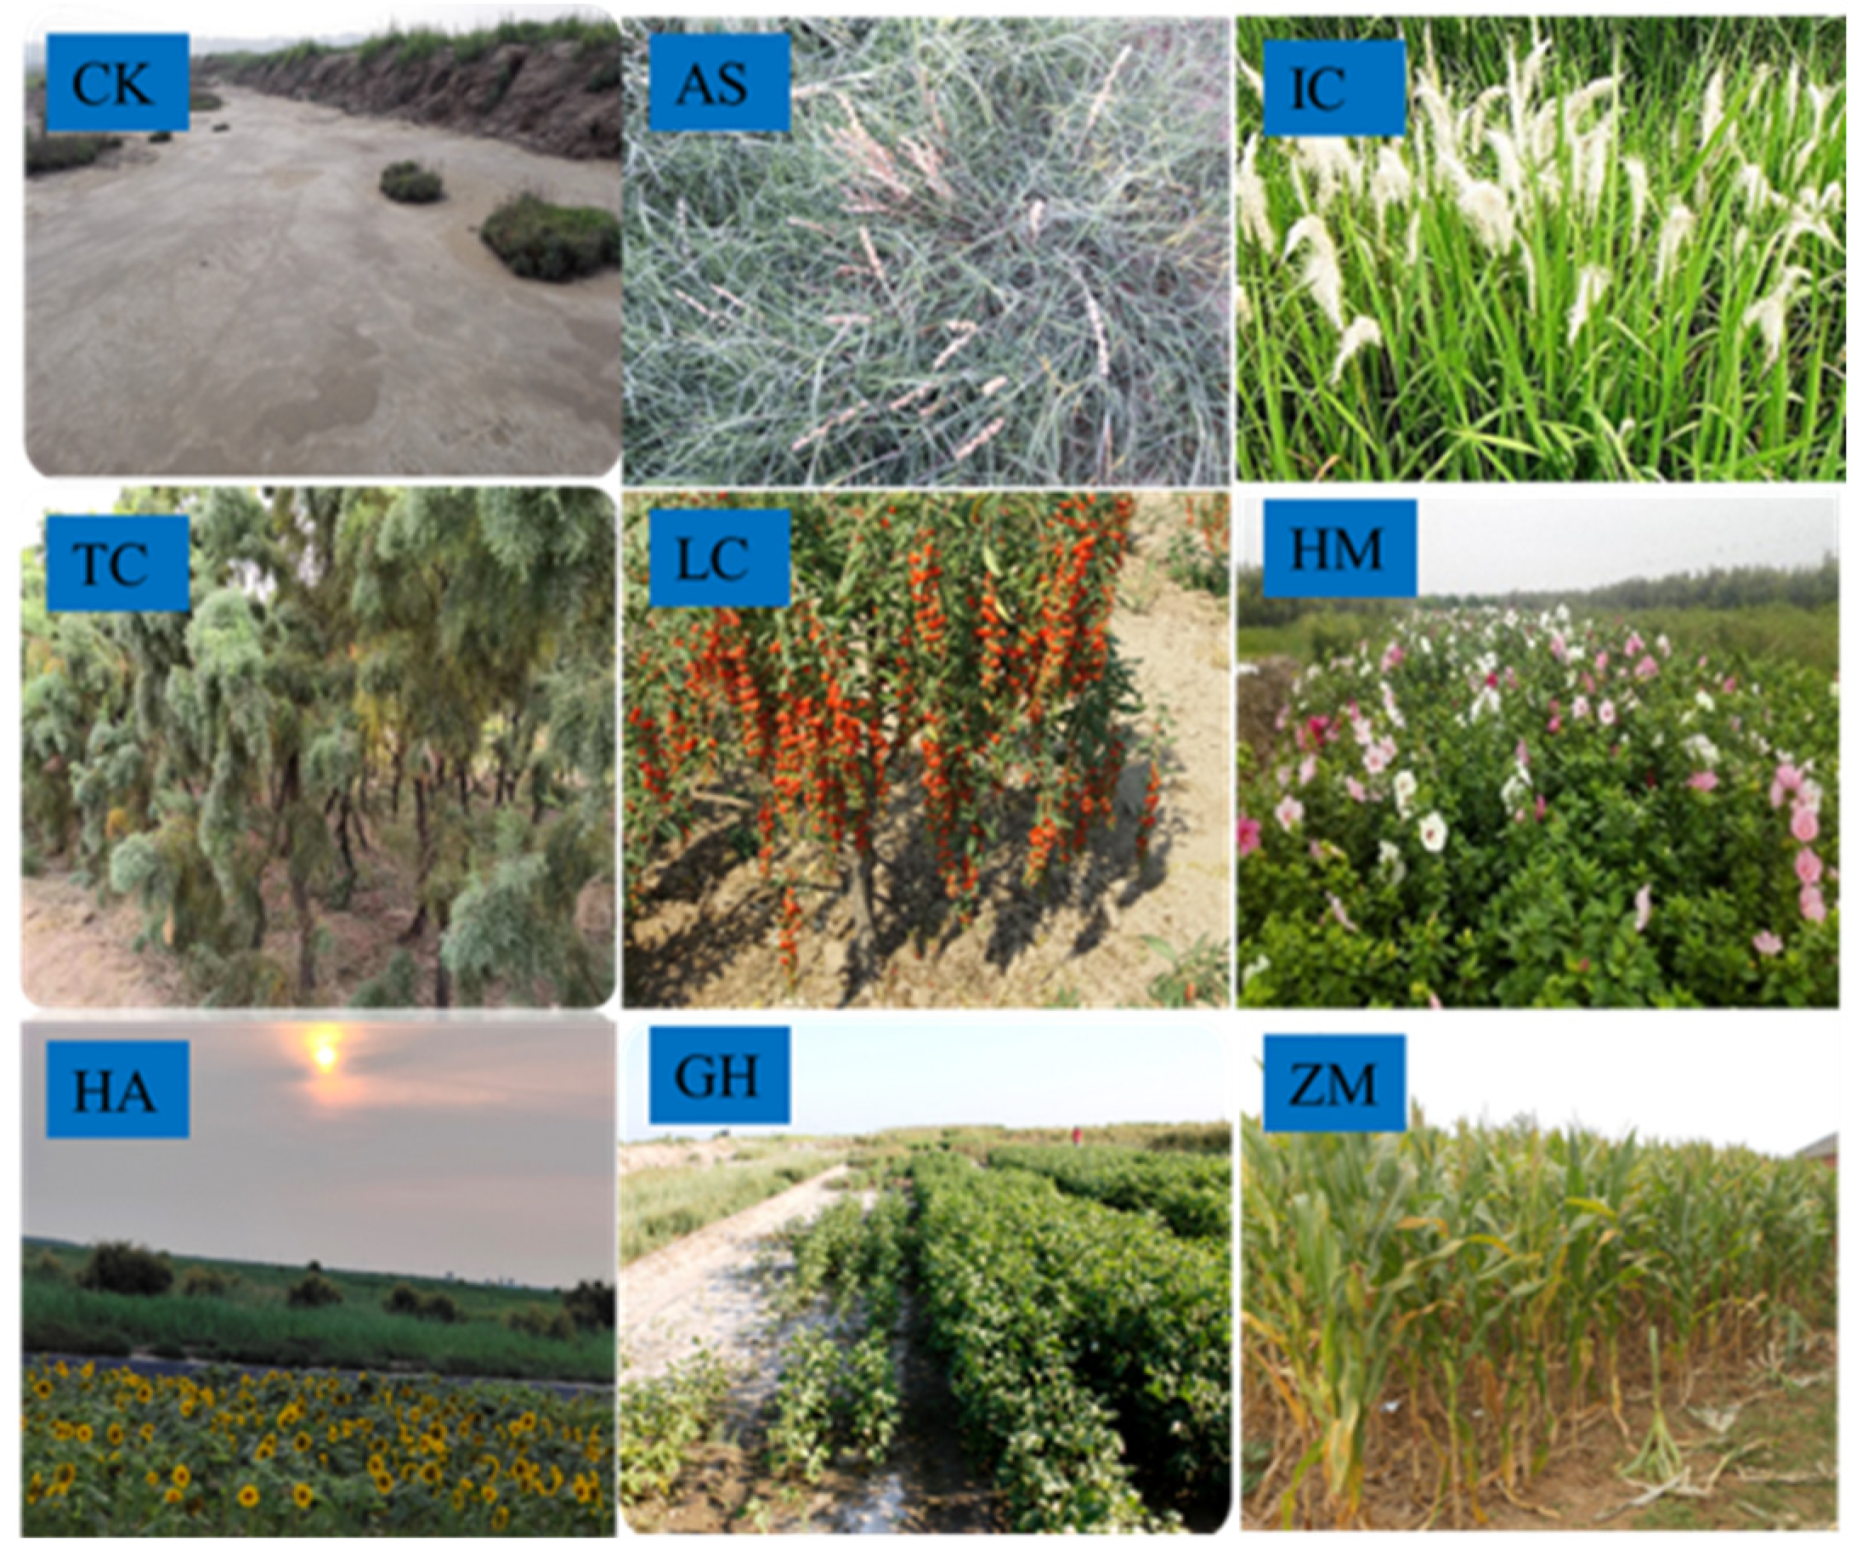
This study was carried out at the Haixing Experimental Station for the Efficient Utilization of Saline–Alkali Land Resources, Chinese Academy of Sciences, which is located in Haixing County, Hebei Province, North China. The coordinates of the station are 117°57′17′′–117°58′31′′ E, 38°16′83′′–38°17′59′′ N (Figure 1). The study site was located 24.8 km from the Bohai coastline, which is characterized as a prototypical coastal salt marsh. The WRB (World Reference Base for Soil Resources) classified the soil at this site as solonchaks. The main horizons included the O and A horizon (0–20 cm), and the B horizon (>20 cm). The site’s geology was a gulf plain, and the parent material was marine sediment. The field location was situated in an area with shallow groundwater that sustained a high salinity range of 10–40 g L−1, with an average elevation of 2.8 m [23].
The region experiences a semi-humid continental monsoon climate, which is characterized by a brief rainy summer and prolonged dry seasons in spring, autumn, and winter. A weather station (INSENTEK, Beijing, China) at the study site provided the precipitation and air temperature data in 2021 (Figure 2). The mean annual air temperature was 14.5 °C, while the annual precipitation was 808 mm. Around 61% of the yearly rainfall took place from July to September. Affected by the characteristics of rainfall, there are dynamic changes in the topsoil salt content in this region. During spring, the high evapotranspiration/precipitation ratio results in the gradual accumulation of salt in the soil, and the topsoil salinity reaches its highest value each year. On the contrary, after the concentrated precipitation in summer, due to salt leaching caused by rainfall, the topsoil salinity is at its lowest at that point.

2.2. Plot Sampling

In April and October 2021, respectively, during the seasons of spring and autumn, spot investigations were conducted at the study site. Samples of soil were taken at 0–20 cm and 20–40 cm layers beneath these different types of vegetation, and bare land was used as a control (CK) (Figure 3). Each group sample had three duplicates. The soil bulk density (BD) and saturated hydraulic conductivity (Ks) were measured using 100 cm3 steel rings with the digging method. Undisturbed soil blocks were collected for soil water-stable aggregate measurement analysis. Soil samples that had been disrupted were used to quantify various soil properties, including the soil water content (SWC), soil electrical conductivity (EC), total soil salt content (TSS), soil sodium adsorption ratio (SAR), soil pH, and soil organic matter (SOM) content.

2.3. Sample Measurement

Soil BD was measured using the steel-ring method. Soil SWC was measured using the oven-drying method. Soil SOM was measured using the potassium dichromate–concentrated sulfuric acid titration method [24]. The standard wet method was used to determine the soil water-stable aggregate stability [25]. Soil MWD was determined by applying the following equation:
MWD = ∑Xi × Wi
where Xi represents the mean diameter of each size fraction, and Wi represents the percentage of soil aggregate weights in the relevant size fraction [26].
Soil EC and pH were measured in 1:5 soil–water extracts using a conductivity meter (Horiba, B-173) and a digital pH meter (Sartorius, PB-10), respectively, following the methods reported by Guo and Liu [27]. The concentrations of the primary soil cations (sum of Na+ and K+, Ca2+, and Mg2+) and anions (Cl, HCO3, and SO42−) were measured via titration. This was accomplished by passing dry soil through a sieve with a 1 mm mesh size [28]. Soil TSS was determined by adding up the concentrations of the principal ions in the soil, including Na+ and K+, Ca2+, Mg2+, Cl, HCO3, and SO42−.
The following formula was used to determine soil SAR [29]:
SAR = Na+/√(Ca2+ + Mg2+)/2
where Na+, Ca2+, and Mg2+ indicate the respective ions’ concentrations (mmol L−1).
Soil Ks was measured using the constant-head method with a soil permeability tester (four-point formula). According to Daiki’s law (DIK-4012), the following equation was used:
q = Q/At
Ks = qL/(ΔH)
where Ks is the saturated hydraulic conductivity (cm h−1), Q is the flow rate (cm3), q is the water flow flux (cm h−1), ΔH is the head height difference (cm), L is the height of the soil sample (cm), A is the cross-sectional area of the soil sample (cm2), and t is the time (h).

2.4. Data Analysis

One-way ANOVA and LSD for analysis of variance and multiple comparisons (p ≤ 0.05), respectively, were conducted to investigate significant differences in the soil properties. SPSS 16.0 (SPSS Inc., Chicago, IL, USA) was used to carry out the statistical operations. Origin 2018 (Origin Lab, USA) was used for drawing. RDA was conducted using the CANOCO 5 software. The lavaan package in R was used to run the SEM. The vegan package in R was used to carry out the variance decomposition.

3. Results

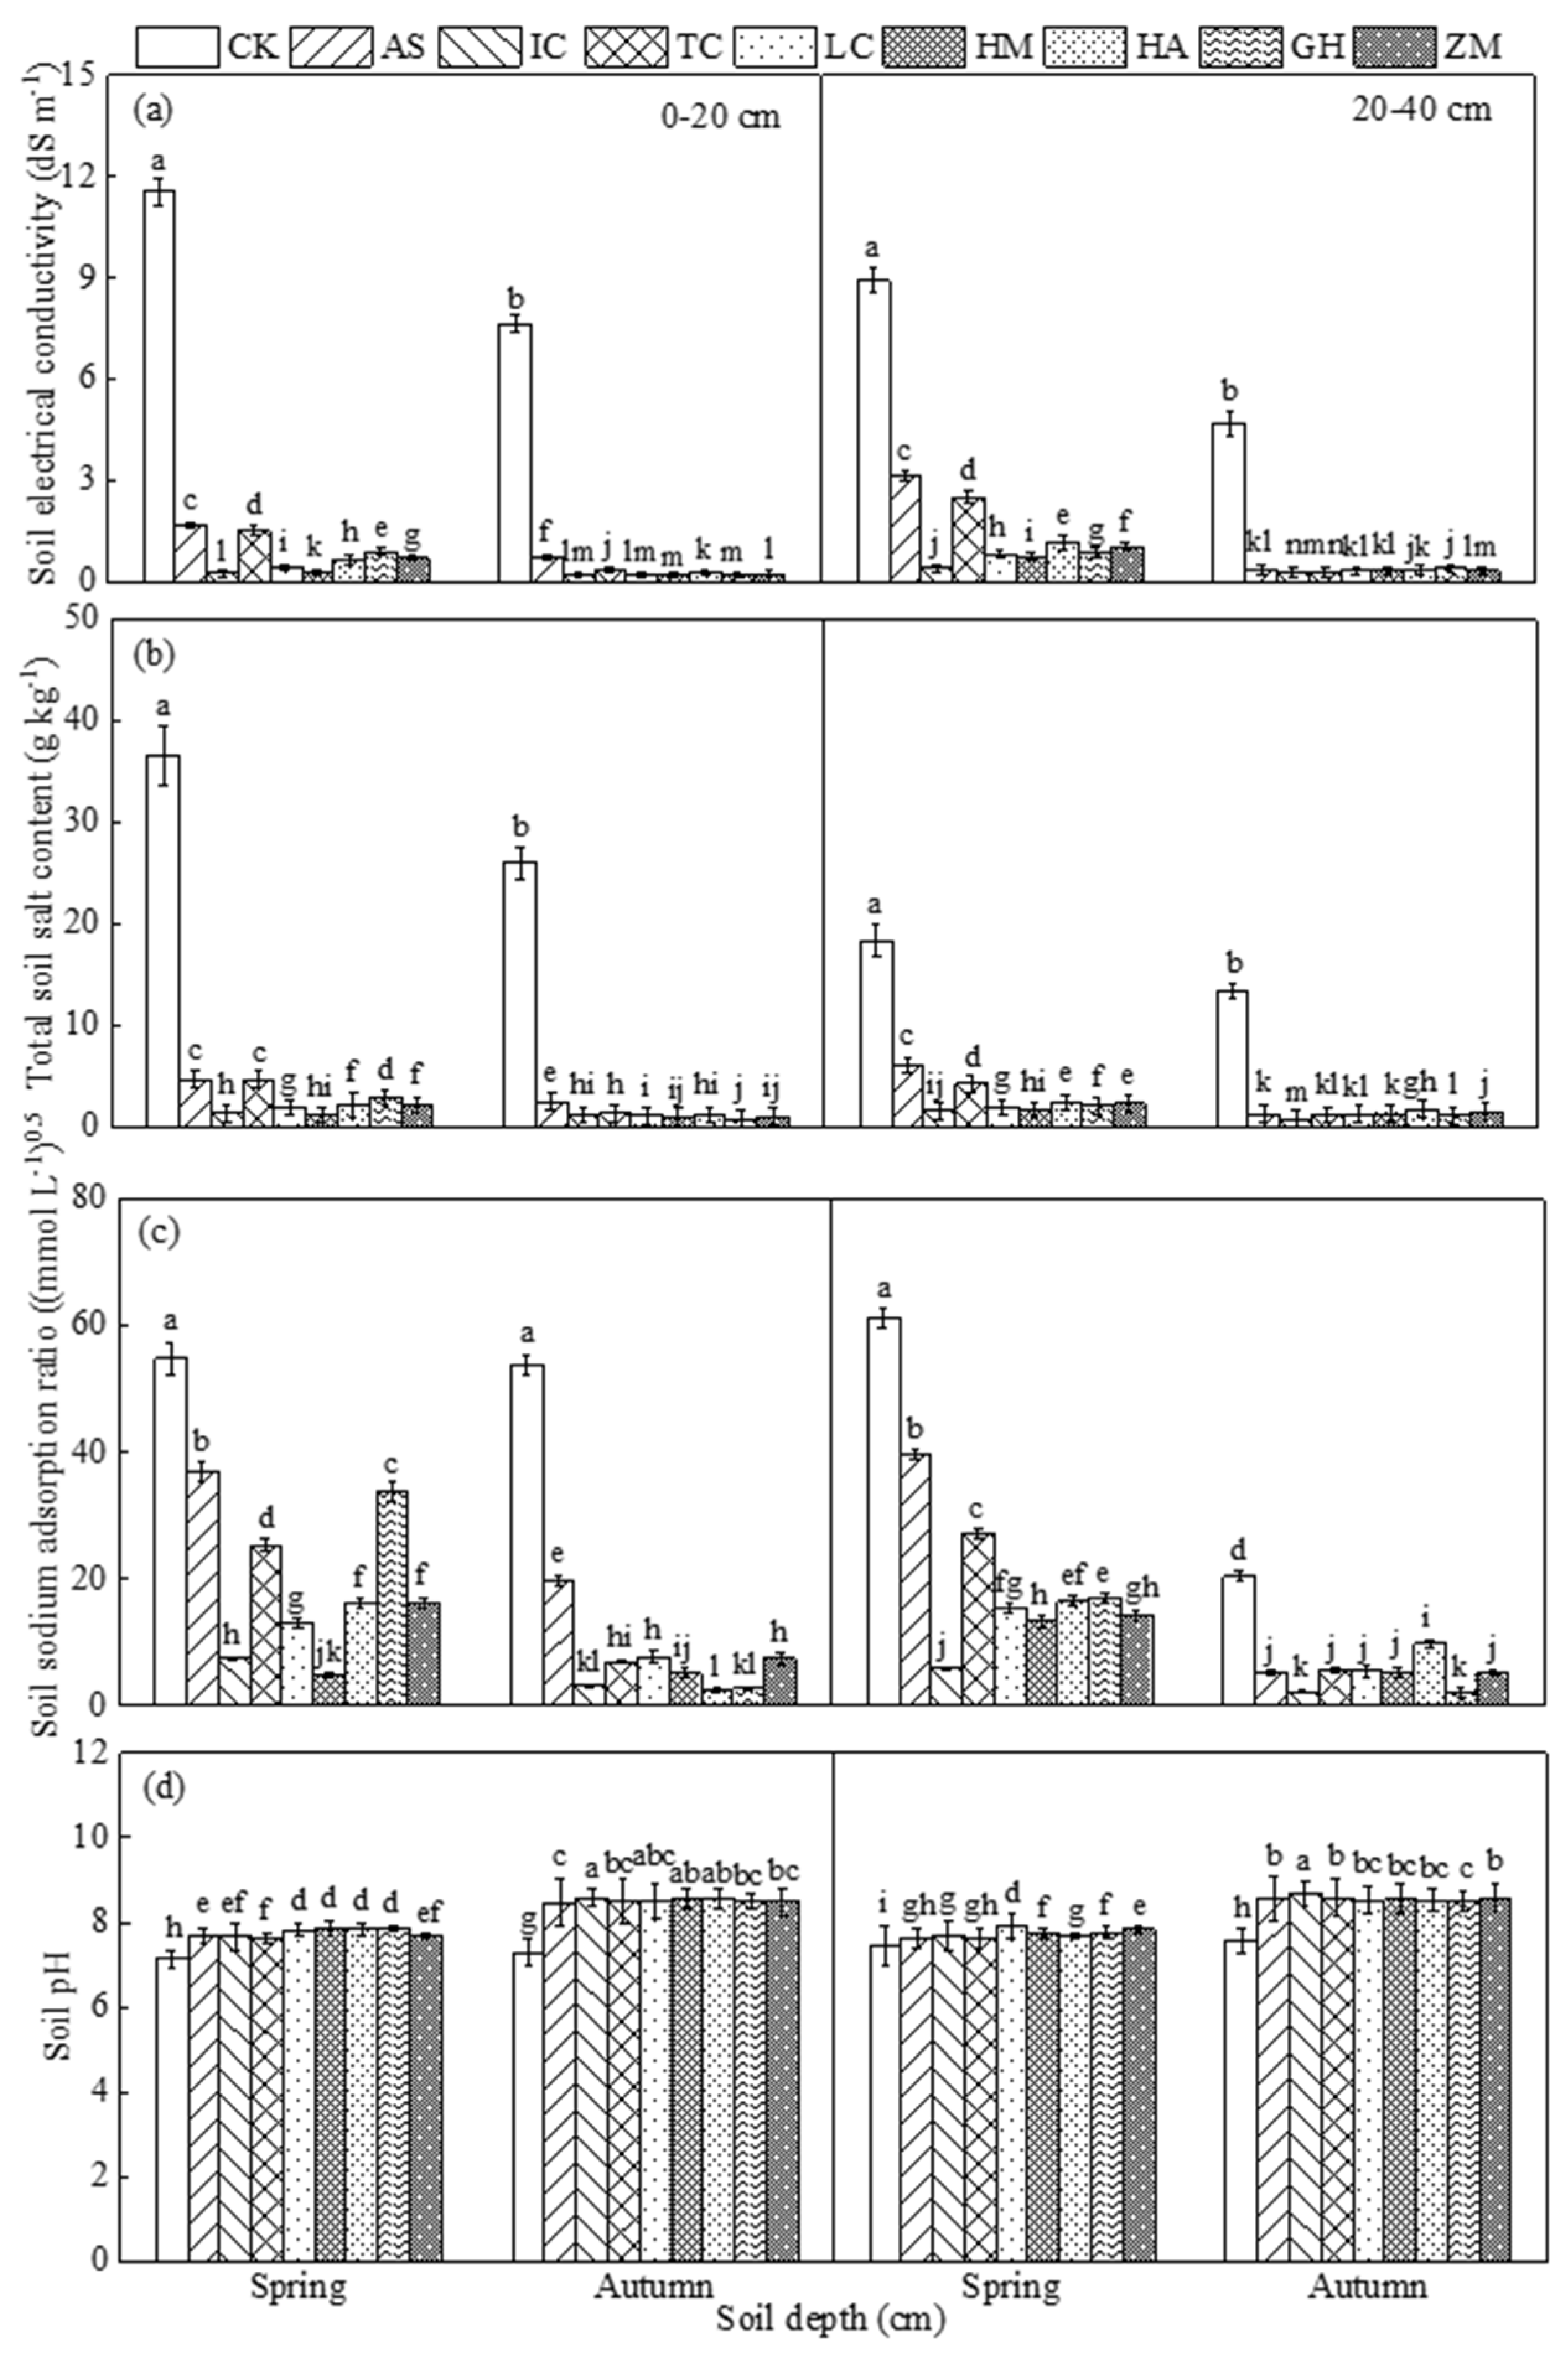
3.1. Changes in Soil Salinization Indicators Due to Vegetation

According to Figure 4, the introduction of vegetation considerably reduced the EC of the soil in both the 0–20 cm and 20–40 cm soil layers. Soil with vegetation cover typically had a lower EC than CK, and in both spring and autumn, there was significant variation in the EC between soil under vegetation restoration and CK. For the 0–20 cm soil layer in spring, the EC of the CK land was 11.55 dS m−1, while the EC of the IC land was only 0.26 dS m−1. In addition, there was little difference in the EC between different types of vegetation. Due to the rainfall-induced salt leaching, the EC in autumn was generally lower than that in spring. Moreover, it was found that for CK, the value of EC and TSS in the 20–40 cm soil layer was significantly lower than that in the 0–20 cm soil layer in spring, which suggested salt accumulation at the soil surface. However, after vegetation, more salt was observed in the 20–40 cm soil layer in spring. For example, the TSS of AS and TC in the 20–40 cm layer was significantly higher than that in the 0–20 cm layer. Compared with that in CK, the TSS of the soil in the vegetation-covered areas was generally lower, and there was a significant difference in the TSS between the soils in the vegetation-covered areas and CK at both the 0–20 cm and 20–40 cm soil layers. Vegetation coverage was able to greatly reduce the TSS value of the surface soil, and in the vegetation-covered areas, the difference in the TSS between different soil layers was relatively small (0.8 to 6.1 g kg−1). Compared with that in spring, the TSS of all vegetation types in autumn was lower. At different soil levels, the SAR of CK was much higher than that of the other vegetation types, regardless of whether the season was spring or autumn. In spring, the highest SAR of CK was 61.31% in the 20–40 cm soil layer, compared with only 5.79% for IC. Furthermore, compared with that in autumn, the SAR of different vegetation types was substantially higher in spring. Whether the land was in spring or autumn, the pH of CK was lower than that of vegetation-covered land at the two different soil depths: 0–20 cm and 20–40 cm. The pH of the different vegetation treatments varied very little. In spring, CK had the lowest pH of 7.13 in the 0–20 cm soil layer, while HM had the greatest pH of 7.87; in autumn, CK had the lowest pH of 7.29 in the 0–40 cm soil layer, while IC had the highest pH of 8.67. The pH of the soil in autumn was found to be significantly higher than that in spring, except for bare ground, when the pH of CK and other types of vegetation was compared.

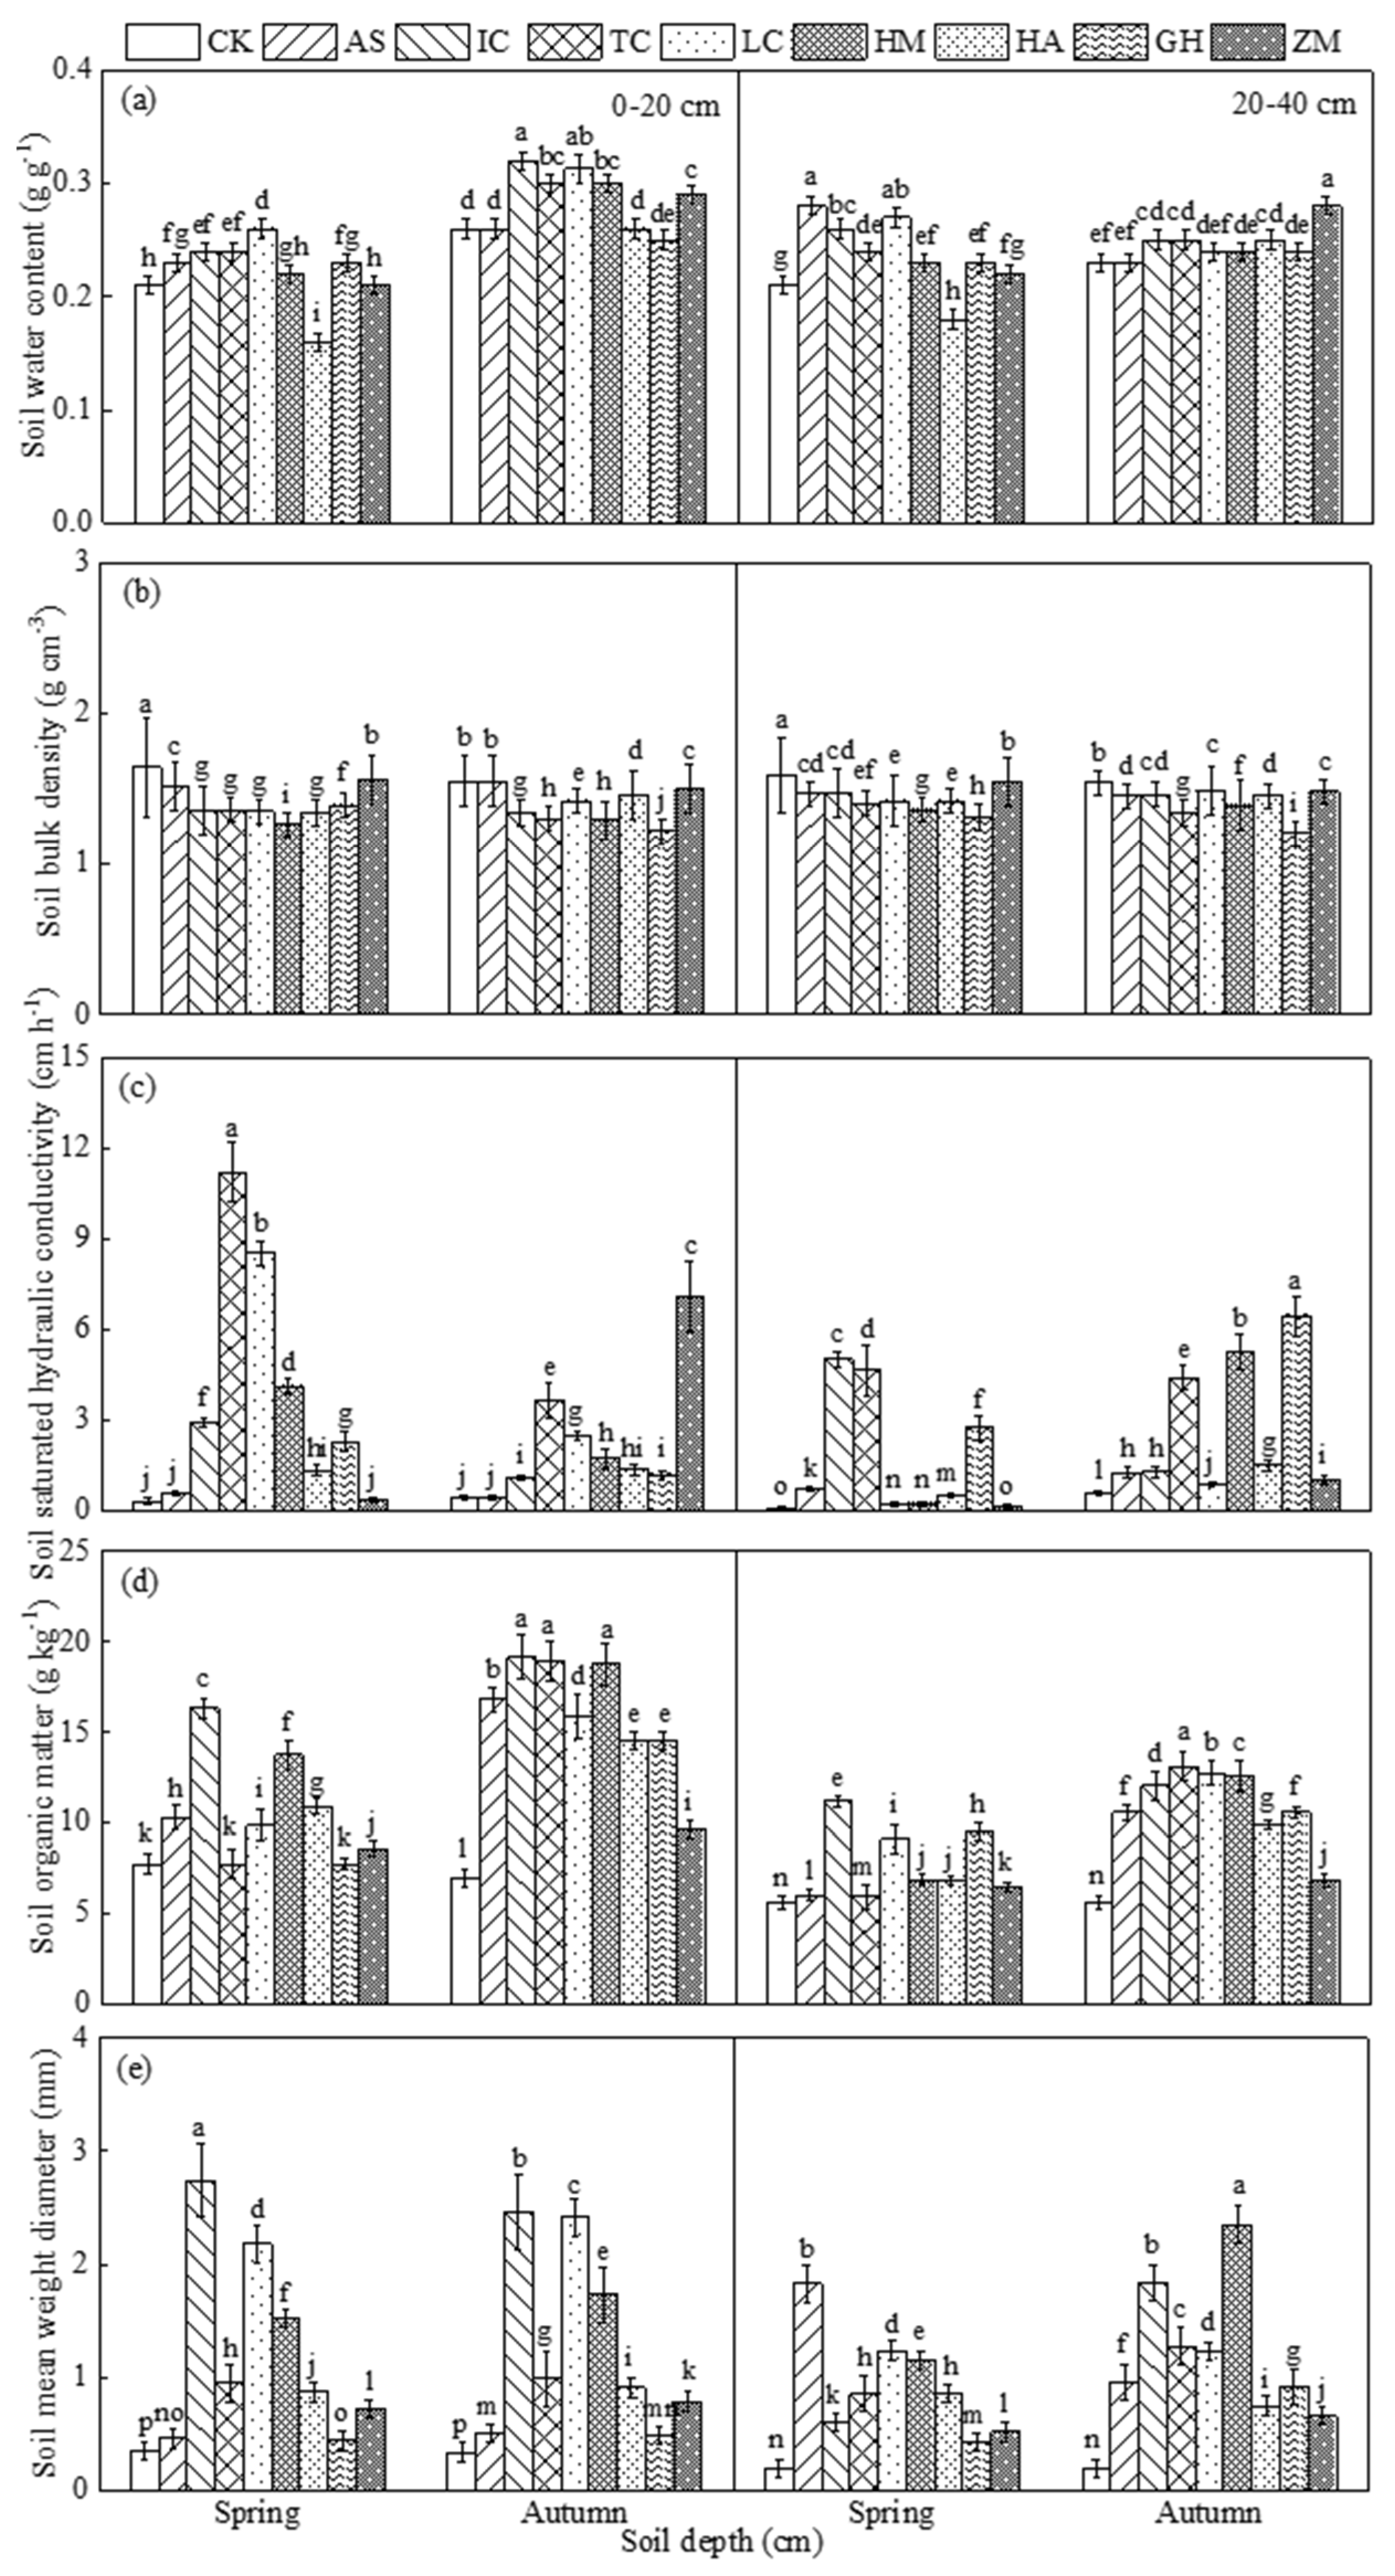
3.2. Changes in Soil Fertility Indicators Due to Vegetation

Table 1 demonstrates that, across all vegetation types, the soil’s grain size was primarily that of silt, followed by sand, with clay making up the smallest fraction. Most treatments were substantially different from CK. However, not every distinction between the various vegetation types was noteworthy. The range of sand particle proportions was 6.98% to 18.52%, the range of silt particle proportions was 80.25% to 92.23%, and the range of clay particle proportions was 0.37% to 2.34%.
As illustrated in Figure 5, regardless of whether the area had vegetation or not, the SWC of the top 20 cm of soil was marginally lower in spring than that of the 20–40 cm of subsoil. In autumn, the reverse was true. A small difference existed between the SWC of the 0–20 cm soil layer and the 20–40 cm sublayer. There was little variation in SWC between the various vegetation types in spring and autumn. The BD of CK was higher than that of other vegetation-covered areas in the 0–20 cm and 20–40 cm soil layers, regardless of whether the season was spring or autumn. This effect was most pronounced in the 0–20 cm soil layer in spring, where the BD of CK reached 1.64 g cm–3, whereas the BD of HM only reached 1.26 g cm–3, a decrease of 23.2% from that of CK. This demonstrated that vegetation cover was able to significantly lower the surface BD, lessen soil compaction, and increase the soil’s ability to support the vegetation’s root growth. The vegetation in the 0–20 cm soil layer had the lowest BD in HM, which was 23.2% lower than that in CK. At depths of 0–20 cm and 20–40 cm, the K in CK was considerably lower than that of other vegetation types regardless of whether it was spring or autumn. This indicated that the presence of vegetation could significantly reduce the value of Ks. Using the 0–20 cm soil layer in the spring as an example, the Ks in TC was up to 11.22 cm h−1, more than 35 times higher than that in CK, whereas the Ks in CK was just 0.32 cm h−1. The Ks in IC was 2.94 cm h−1, more than nine times that in CK, and the Ks in HM was 4.13 cm h−1, more than 12 times that in CK. Within the depths of the 0–20 cm and 20–40 cm soil layers, the SOM of the vegetated areas was substantially higher than that of the CK. This may suggest that vegetation cover can significantly increase the SOM value. With the exception of CK, all vegetation types had much higher SOM in autumn than in spring, and the SOM in the 20–40 cm layer of soil was significantly lower than that in the top 0–20 cm of soil. Regardless of whether it was spring or autumn, the MWD of CK on coastal saline–alkali land was significantly lower than that of other forms of plants at various soil depths. This indicated that vegetation cover was able to significantly enhance the stability of soil aggregates. At the 0–40 cm soil depth in spring, the minimum MWD of CK was 0.20 mm, while the maximum MWD of IC was 2.74 mm. In the depth of the 0–40 cm soil layer in autumn, the minimum MWD of CK was 0.19 mm, while the maximum MWD of IC was 2.46 mm. This showed that the soil aggregate stability was lowest in CK and highest in IC. Moreover, there was not much difference in MWD among the different vegetation types in spring and autumn.

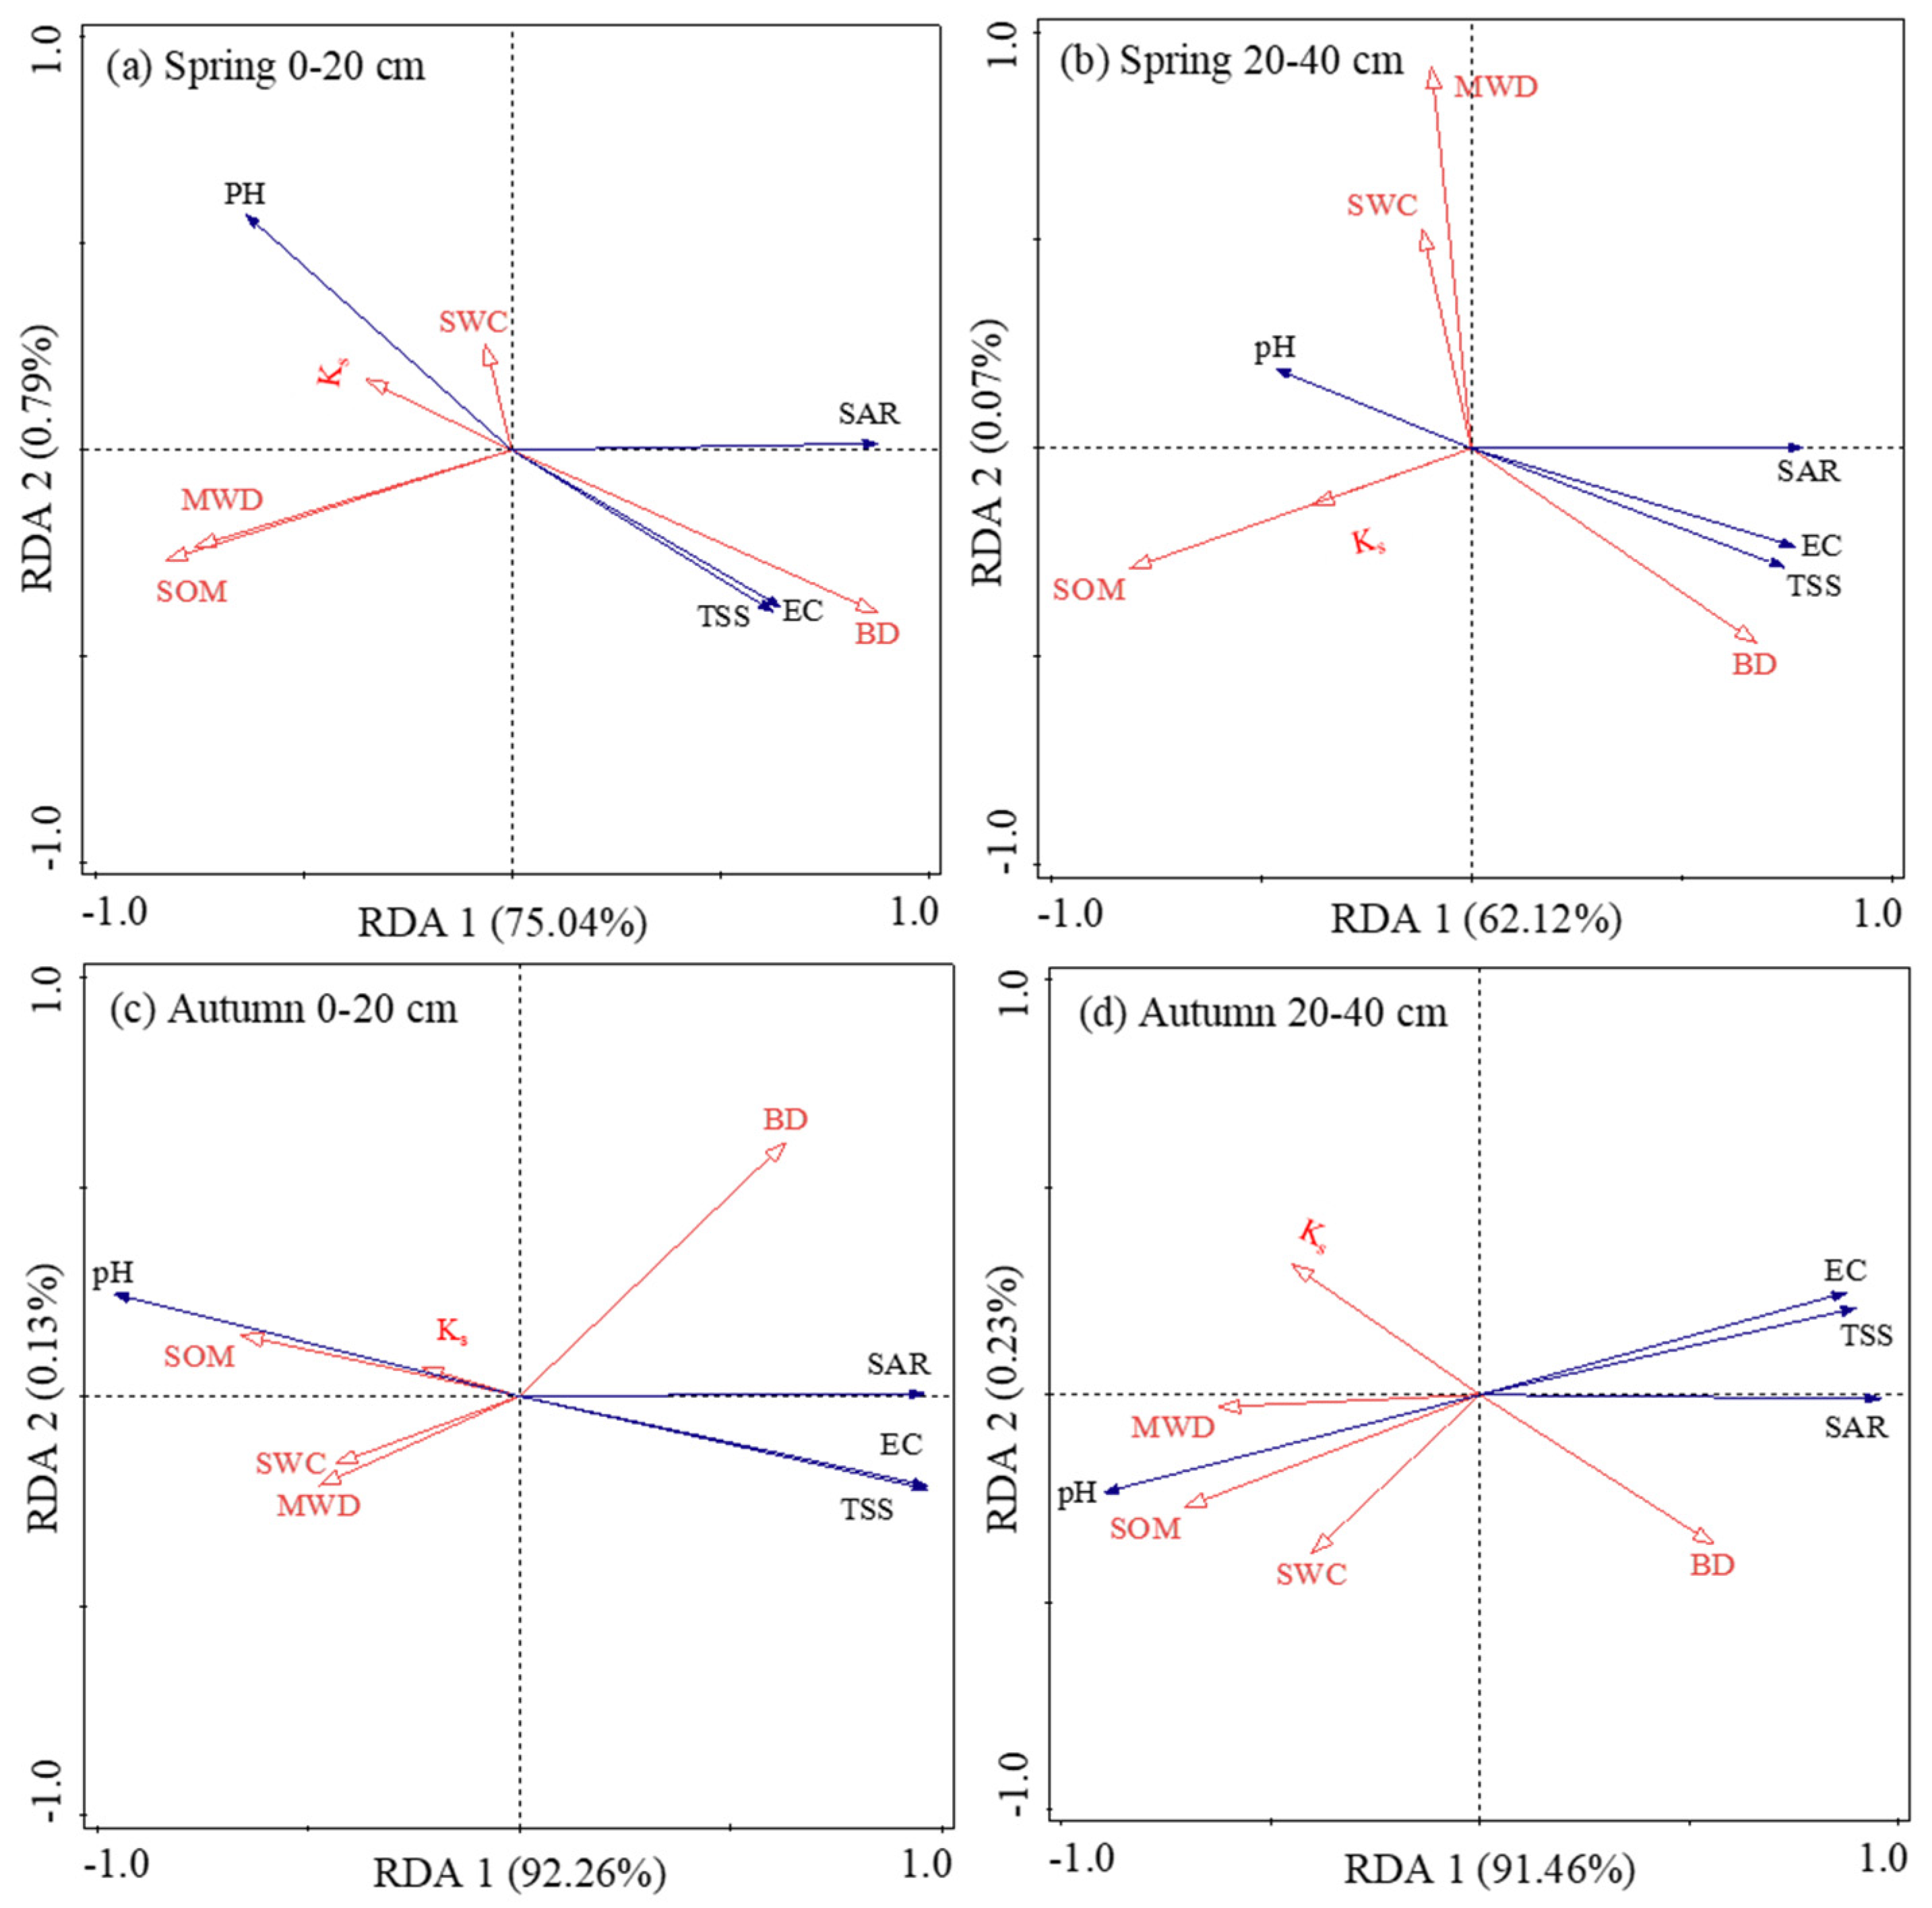
3.3. The Interrelationship between Soil Salinization and Soil Fertility Indicators

It was found that indicators of soil fertility explained 75.04% and 0.79% of the salinization characteristics of the soil in the first and second axes for the 0–20 cm soil layer in spring (Figure 6a). SAR, EC, BD, and TSS showed a positive association, and pH, Ks, SWC, MWD, and SOM showed a positive correlation. SAR, EC, BD, and TSS had negative correlations with pH, Ks, SWC, MWD, and SOM. We determined the order of the impact of soil fertility indicators on soil salinization by ranking their significance: BD > SOM > MWD > SWC > Ks (Table 2). This suggests that BD was the most significant indicator influencing soil salinity in the 0–20 cm soil layer in spring, followed by SOM. In spring, the correlation among pH, Ks, SWC, MWD, SOM, SAR, EC, BD, and TSS was the same in the soil layer at a depth of 20–40 cm as it was in the 0–20 cm soil layer, as previously indicated (Figure 6b). By evaluating the significance of the soil fertility indicators, we determined that the impacts of various soil parameters on the degree of soil salinization were in the following order: SOM > BD > MWD > SWC > Ks. According to this, BD was the second most significant indication of soil salinity in the springtime 20–40 cm soil layer after SOM. The relationship among pH, Ks, SWC, MWD, SOM, SAR, EC, BD, and TSS for the soil layer at a depth of 0–20 cm in autumn was the same as that observed for the 0–20 cm soil layer indicated above in spring (Figure 6c). The order of the impacts of various soil parameters on the degree of soil salinization was determined by ranking the significance of the soil fertility indicators as follows: BD > SOM > MWD > SWC > Ks. This suggests that BD was the most significant indicator influencing soil salinity in the 0–20 cm soil layer in autumn, followed by SOM. As with the 0–20 cm soil layer in spring, as discussed above, the correlation among pH, Ks, SWC, MWD, SOM, SAR, EC, BD, and TSS was also present at a depth of 20–40 cm in autumn (Figure 6d). We determined the impacts of various soil parameters on soil salinization by ordering the significance of soil fertility indicators as follows: SOM > BD > SWC > Ks > MWD. This suggests that in autumn, SOM was the most important indicator influencing soil salinity in the 20–40 cm soil layer, followed by BD.

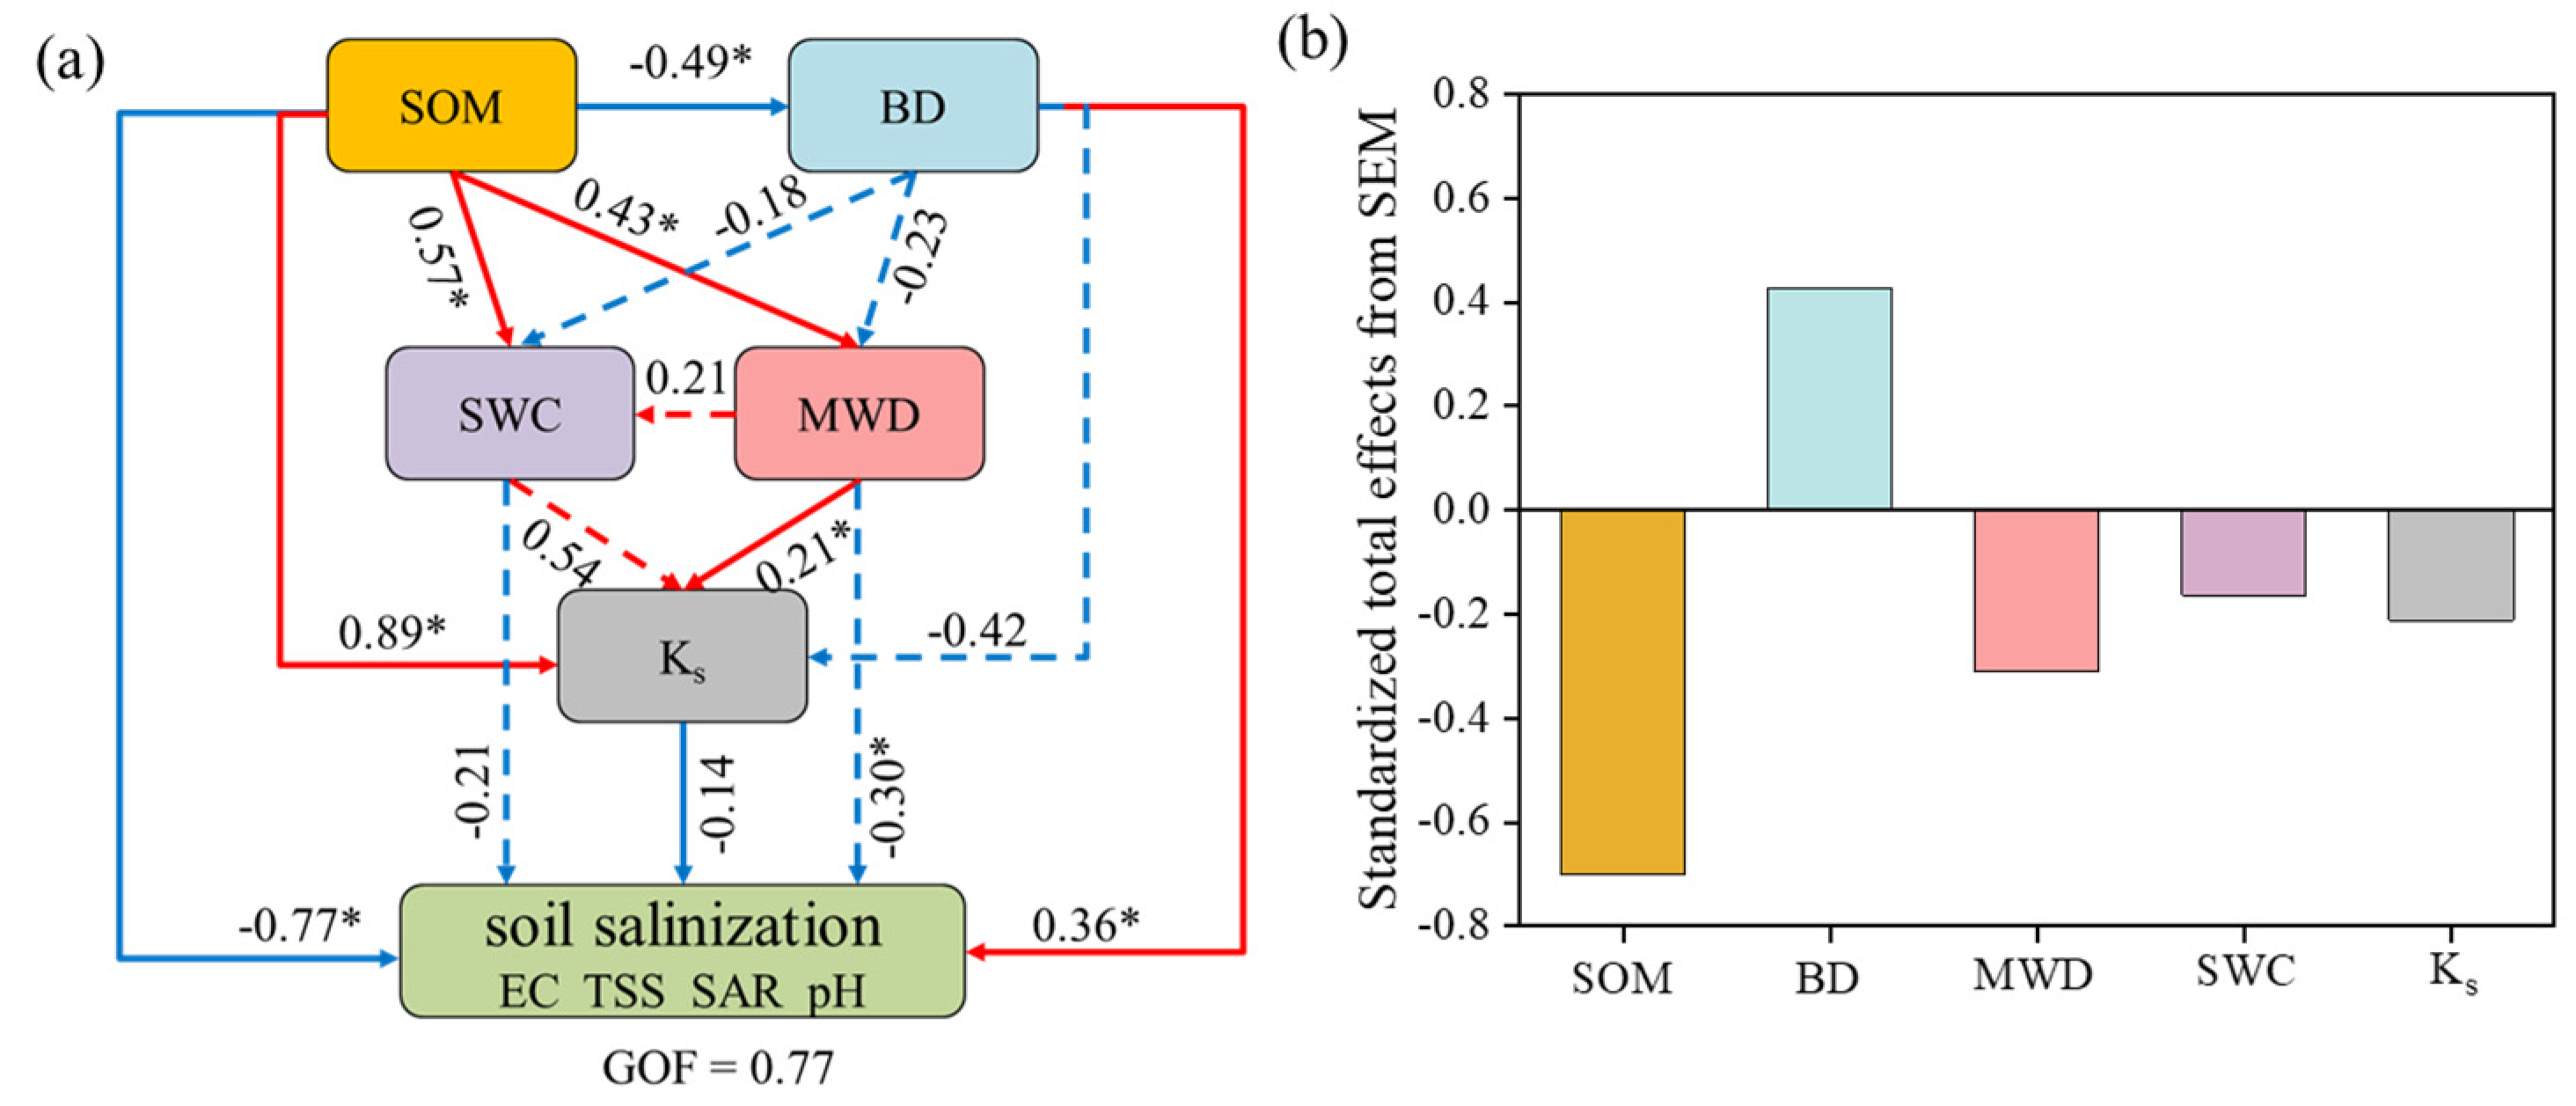
3.4. Quantification of the Comprehensive Influence of Soil Fertility Indicators on Soil Salinization

The structural equation model (SEM) was used to analyze the contribution of soil fertility factors (SOM, BD, MWD, SWC, and Ks) to soil salinization; the goodness of fit was 0.77, indicating a successful fit (Figure 7a). The soil salinization was directly influenced by SOM, BD, MWD, SWC, and Ks, for which standardized path coefficients were −0.77, 0.36, and −0.30 (p ≤ 0.05), −0.21, and −0.14 (p > 0.05), respectively. In addition, SOM significantly affected BD, MWD, SWC, and Ks, for which standardized path coefficients were −0.49, 0.43, 0.57, and 0.89, respectively. And Ks was directly and significantly influenced by MWD, for which the standardized path coefficient was 0.21 (p ≤ 0.05). The total standardized effects from the SEM showed that SOM, for which the total standardized effect was −0.70, was the most important explanatory variable for soil salinization, followed by BD, MWD, KS, and SWC, for which total standardized effects were 0.43, −0.311, −0.21, and −0.16, respectively (Figure 7b). The positive effect of BD to soil salinization was the greatest. And the negative effect of SOM for soil salinization was the greatest, and was 2.26, 3.31, and 4.28 times higher than those of MWD, KS, and SWC, respectively. In summary, SOM and BD were critical factors affecting soil salinization in these coastal saline lands. The results of variance decomposition showed that SOM explained more variations in soil salinization than BD, and the common effects of SOM and BD were greater than the independent influence of SOM on soil salinization in the coastal saline lands (Figure 8). Among them, SOM and BD jointly explained 26.7% of salinization variations, which was greater than the independent influence of SOM (20.5%) or BD (6.9%). For this reason, while improving saline soils, both SOM and BD must be taken into account simultaneously.

4. Discussion

4.1. Soil Restoration Functions of Various Vegetation Patterns in Coastal Saline Land

From the study of soils with different vegetation types, it was found that vegetation was able to significantly reduce the TSS in the 0–40 cm soil layer of the coastal saline zone in comparison with CK, and the degree of soil salinity mitigation varied between different vegetation types, which may have been due to their different degrees of ground surface coverage (Figure 4), which is in line with the results of previous studies [30,31,32]. In this study, the soil salinity content was significantly higher in spring than in autumn, primarily because of the significant increase in summer precipitation in the research area, which attenuated the effect of the SWC on the spatial distribution of soil salinity at the surface. In addition, summertime vegetation cover increased dramatically in springtime, which decreased salt accumulation and surface soil water evaporation. It has also been noted that there is a strong relationship between vegetation cover and season [33]. According to other studies, temperature is the second most significant climatic factor influencing variations in vegetation cover after precipitation [34]. Seasons have a major impact on precipitation and the vegetation index [35]. While there was no salt surface polymerization of salinity in the vegetative cover area, this study found that there was a large polymerization of TSS on the salt surface in CK, which is consistent with the findings of earlier investigations [36,37]. This was mainly because vegetation cover enhanced the stability of soil aggregates, increased the SWC, reduced the BD, increased the SOM, and improved Ks compared with CK (Figure 5) [38,39,40]. Several studies have shown that plant roots can make the soil more porous, which, in turn, makes it better at holding water, and plants can also improve the SOM through apoplastic matter or root secretions, which make the soil stick together more and make it more fertile. Meanwhile, vegetation also increases the ability of micro-organisms to survive in saline soils, and the presence of micro-organisms accelerates the decomposition of organic matter [41,42,43,44]. In this study, TSS was significantly lower in the vegetation-covered areas than in CK, indicating improved soil desalination. This was mainly because the soils of vegetation-covered areas contained higher SOM. Artificial vegetation alters the physicochemical properties of the soil more significantly and quickly than natural vegetation, which is primarily due to its ability to introduce more organic matter into the soil [45]. As a result, we prefer to recommend the use of artificial vegetation when restoring coastal saline soils.

4.2. Changes in Soil Physical–Chemical Properties Induced Salt Leaching

A significant correlation between soil fertility (BD, Ks, SWC, MWD, and SOM) and salinity (SAR, EC, BD, and pH) indicators was found in this study (Figure 6). It was noted that pH was negatively correlated with EC, EC was positively correlated with SAR, and SOM was positively correlated with SWC and negatively correlated with TSS and BD, which was consistent with the results of other studies [46,47,48,49,50]. Previous research has also shown that TSS is significantly negatively correlated with SOM, and wheat yield and biomass are significantly positively correlated with SOM, suggesting that increasing SOM may reduce TSS and, thus, increase wheat yield [51]. We found that soil salinity was mainly influenced by the BD in the 0–20 cm layer and by the SOM in the 20–40 cm layer. It has been shown that soil litter content is the main factor affecting soil salinity, while soil litter is the main source of SOM, which indicates that SOM is the main factor affecting soil salinity [52]. It has also been pointed out that the increase in the number of years of vegetation reclamation not only significantly reduces soil salinity but also significantly promotes soil nutrient accumulation; ultimately, after redundancy analyses, it was pointed out that organic matter is a key factor in differences in soil salinity [53]. The above-mentioned research supports the results of this study. Many amendments have been used to lessen the effects of salinization on soil [54]. According to the results of this study, in coastal saline soils, we prefer to recommend organic amendments over inorganic amendments; artificial vegetation can be an effective long-term method for improving saline soils by improving the soil physicochemical properties.

5. Conclusions

After vegetation restoration, TSS was significantly reduced in both the 0–20 and 20–40 cm soil layers. When compared with CK, the general rule for salt buildup was found to be that more TSS was deposited in the 20–40 cm layer under plants than in the 0–20 cm layer of topsoil. This suggested that the soil salt profile was changed as a result of vegetation-induced changes in soil characteristics. This was mostly because the increased SOM and MWD boosted K and decreased BD, which together accelerated the process of salt leaching from precipitation. We found that among these physical and chemical characteristics of the soil, the variations in SOM and BD were most strongly associated with soil desalination, and the interaction relationship between SOM and BD was the key to limiting soil salinization. Furthermore, SOM showed a more significant negative correlation with BD. Decreasing BD and increasing SOM may be the key to improving soil salinization in coastal saline lands which will require comprehensive improvement in management measures.

Author Contributions

Conceptualization, K.G.; methodology, J.L.; software, W.L. and Y.W.; validation, X.L., K.G. and X.F.; formal analysis, W.L.; investigation, W.L. and Y.W.; resources, X.L.; data curation, W.L.; writing—original draft preparation, W.L.; writing—review and editing, K.G.; visualization, X.F.; supervision, J.L.; project administration, K.G.; funding acquisition, K.G. All authors have read and agreed to the published version of the manuscript.

Funding

This research was funded by the National Key Research and Development Program of China (Nos. 2022YFD1900103, 2021YFD1900904) and the CAS Engineering Laboratory for Efficient Utilization of Saline Alkali Land Resources, Chinese Academy of Sciences (No. KFJ-PTXM-017).

Data Availability Statement

The data can be obtained from the corresponding author upon reasonable request.

Acknowledgments

The authors wish to thank all of the workers at the Haixing Experimental Site for the Efficient Utilization of Saline–Alkali Land Resources, Chinese Academy of Sciences, for collecting and measuring the samples.

Conflicts of Interest

The authors declare that they have no known competing financial interests or personal relationships that could have appeared to influence the work reported in this paper.

References

  1. Zhao, W.; Wang, S.; Liu, L.; Xiao, J.; Wang, S.; Tang, L.; Chen, G. Effect of Biochar Amendment on Saline-alkaline Soil Amelioration and Plant Growth: A Literature Review. Chin. J. Soil Sci. 2024, 55, 551–561. [Google Scholar]
  2. Yu, P.J.; Liu, S.W.; Yang, H.T.; Fan, G.H.; Zhou, D.W. Short-term land use conversions influence the profile distribution of soil salinity and sodicity in northeastern China. Ecol. Indic. 2018, 88, 79–87. [Google Scholar] [CrossRef]
  3. Wang, S.; Feng, H.; Wang, K.; Gao, Z.; Hu, S. Advances of soil microbial ecological characteristics in saline-alkali soil. Chin. J. Soil Sci. 2019, 50, 233–239. [Google Scholar] [CrossRef]
  4. Baloch, M.Y.J.; Zhang, W.J.; Sultana, T.; Akram, M.; Shoumik, B.A.; Khan, M.Z.; Farooq, M.A. Utilization of sewage sludge to manage saline-alkali soil and increase crop production: Is it safe or not? Environ. Technol. Innov. 2023, 32, 103266. [Google Scholar] [CrossRef]
  5. Long, X.H.; Liu, L.P.; Shao, T.Y.; Shao, H.B.; Liu, Z.P. Developing and sustainably utilize the coastal mudflat areas in China. Sci. Total Environ. 2016, 569, 1077–1086. [Google Scholar] [CrossRef]
  6. Rose, D.A.; Konukcu, F.; Gowing, J.W. Effect of watertable depth on evaporation and salt accumulation from saline groundwater. Aust. J. Soil Res. 2005, 43, 565–573. [Google Scholar] [CrossRef]
  7. Skrzypek, G.; Dogramaci, S.; Rouillard, A.; Grierson, P.F. Groundwater seepage controls salinity in a hydrologically terminal basin of semi-arid northwest Australia. J. Hydrol. 2016, 542, 627–636. [Google Scholar] [CrossRef]
  8. Tanaka, N. Vegetation bioshields for tsunami mitigation: Review of effectiveness, limitations, construction, and sustainable management. Landsc. Ecol. Eng. 2009, 5, 71–79. [Google Scholar] [CrossRef]
  9. Veettil, B.K.; Wickramasinghe, D.; Amarakoon, V. Mangrove forests in Sri Lanka: An updated review on distribution, diversity, current state of research and future perspectives. Reg. Stud. Mar. Sci. 2023, 62, 102932. [Google Scholar] [CrossRef]
  10. Wang, G.; Jia, J.; Zhang, J. Plant soil feedback theory and its applications and prospects in natural and agricultural ecosystems. Acta Ecol. Sin. 2021, 41, 9130–9143. [Google Scholar] [CrossRef]
  11. Li, Z.K.; Li, X.Y.; Zhou, S.; Yang, X.F.; Fu, Y.S.; Miao, C.Y.; Wang, S.; Zhang, G.H.; Wu, X.C.; Yang, C.; et al. A comprehensive review on coupled processes and mechanisms of soil-vegetation-hydrology, and recent research advances. Sci. China-Earth Sci. 2022, 65, 2083–2114. [Google Scholar] [CrossRef]
  12. Yacine, Y.; Kutáková, E.; Zandt, D.I.; Hadincová, V.; Semerád, J.; Cajthaml, T.; Münzbergová, Z. Between- versus within-species variation in plant-soil feedback relates to different functional traits, but exudate variability is involved at both scales. Funct. Ecol. 2024, 38, 1156–1171. [Google Scholar] [CrossRef]
  13. Li, J.S.; Hussain, T.; Feng, X.H.; Guo, K.; Chen, H.Y.; Yang, C.; Liu, X.J. Comparative study on the resistance of Suaeda glauca and Suaeda salsa to drought, salt, and alkali stresses. Ecol. Eng. 2019, 140, 105593. [Google Scholar] [CrossRef]
  14. Bagstad, K.J.; Lite, S.J.; Stromberg, J.C. Vegetation, soils, and hydrogeomorphology of riparian patch types of a dryland river. West. N. Am. Nat. 2006, 66, 23–44. [Google Scholar] [CrossRef]
  15. Butterfield, B.J.; Briggs, J.M. Patch dynamics of soil biotic feedbacks in the Sonoran Desert. J. Arid Environ. 2009, 73, 96–102. [Google Scholar] [CrossRef]
  16. Liu, S.L.; Hou, X.Y.; Yang, M.; Cheng, F.Y.; Coxixo, A.; Wu, X.; Zhang, Y.Q. Factors driving the relationships between vegetation and soil properties in the Yellow River Delta, China. Catena 2018, 165, 279–285. [Google Scholar] [CrossRef]
  17. Lyu, D.; Liu, Q.M.; Xie, T.; Yang, Y.H. Impacts of Different Types of Vegetation Restoration on the Physicochemical Properties of Sandy Soil. Forests 2023, 14, 1740. [Google Scholar] [CrossRef]
  18. Li, P.; Zhang, X.; Hao, M.; Cui, Y.; Zhang, Y.; Zhu, S. Effects of Vegetation Restoration on Soil Physicochemical Properties, Enzyme Activities, and Fungal Community of Reconstructed Soil in a Mining Area on Loess Plateau. Bull. Soil Water Conserv. 2019, 39, 1–7. [Google Scholar] [CrossRef]
  19. Wang, A.N.; Zhang, Y.F.; Wang, G.L.; Zhang, Z.Q. Soil physicochemical properties and microorganisms jointly regulate the variations of soil carbon and nitrogen cycles along vegetation restoration on the Loess Plateau, China. Plant Soil 2024, 494, 413–436. [Google Scholar] [CrossRef]
  20. Xia, J.B.; Ren, J.Y.; Zhang, S.Y.; Wang, Y.H.; Fang, Y. Forest and grass composite patterns improve the soil quality in the coastal saline-alkali land of the Yellow River Delta, China. Geoderma 2019, 349, 25–35. [Google Scholar] [CrossRef]
  21. Chi, Y.; Sun, J.K.; Liu, W.Q.; Wang, J.; Zhao, M.W. Mapping coastal wetland soil salinity in different seasons using an improved comprehensive land surface factor system. Ecol. Indic. 2019, 107, 13. [Google Scholar] [CrossRef]
  22. Song, Y.; Gao, M.X.; Wang, Z.R.; Gong, T.F.; Chen, W.F. Spatio-Temporal Variability Characteristics of Coastal Soil Salinization and Its Driving Factors Detection. Water 2022, 14, 3326. [Google Scholar] [CrossRef]
  23. Ju, Z.Q.; Du, Z.L.; Guo, K.; Liu, X.J. Irrigation with freezing saline water for 6years alters salt ion distribution within soil aggregates. J. Soils Sediments 2019, 19, 97–105. [Google Scholar] [CrossRef]
  24. Dong, X.J.; Sun, H.Y.; Wang, J.T.; Liu, X.J.; Singh, B.P. Wheat-derived soil organic carbon accumulates more than its maize counterpart in a wheat–maize cropping system after 21 years. Eur. J. Soil Sci. 2019, 71, 695–705. [Google Scholar] [CrossRef]
  25. Kemper, W.D.; Chepil, W.S. Size distribution of aggregation. In Methods of Soil Analysis; Black, C.A., Ed.; American Society of Agronomy: Madison, WI, USA, 1965; pp. 499–510. [Google Scholar]
  26. Kemper, W.D.; Rosenau, R.C. Aggregate stability and size distribution. In Methods of Soil Analysis: Part I-Physical and Mineralogical Methods, 2nd ed.; Klute, A., Ed.; American Society of Agronomy and Soil Science: Madison, WI, USA, 1986; pp. 425–442. [Google Scholar]
  27. Guo, K.; Liu, X.J. Dynamics of meltwater quality and quantity during saline ice melting and its effects on the infiltration and desalinization of coastal saline soils. Agric. Water Manag. 2014, 139, 1–6. [Google Scholar] [CrossRef]
  28. Lao, J.S. Handbook of Soil and Agricultural Chemistry Analysis; Agricultural Press: Beijing, China, 1988. [Google Scholar]
  29. Suarez, D.L.; Wood, J.D.; Lesch, S.M. Effect of SAR on water infiltration under a sequential rain-irrigation management system. Agric. Water Manag. 2006, 86, 150–164. [Google Scholar] [CrossRef]
  30. Tao, Y.; Yu, K.; He, P.; Sun, B.; Li, C.; Zhao, M.; Fang, S. Distribution of scirpus mariqueter on nanhui coasts after reclamation and the associated affecting factors. Resour. Environ. Yangtze Basin 2017, 26, 1032–1041. [Google Scholar] [CrossRef]
  31. Chernov, T.I.; Tkhakakhova, A.K.; Lebedeva, M.P.; Zhelezova, A.D.; Bgazhba, N.A.; Kutovaya, O.V. Microbiomes of the Soils of Solonetzic Complex with Contrasting Salinization on the Volga-Ural Interfluve. Eurasian Soil Sci. 2018, 51, 1057–1066. [Google Scholar] [CrossRef]
  32. Tirgan, S.; Naqinezhad, A.; Moradi, H.; Kazemi, Z.; Vasefi, N.; Fenu, G. Caspian remnant coastal dunes: How do natural and anthropogenic factors impact on plant diversity and vegetation? Plant Biosyst. 2022, 156, 1456–1469. [Google Scholar] [CrossRef]
  33. Sobhani, B.; Abad, B.; Motlagh, O.M.K. Identification of Vegetation Coverage Seasons in Iran Using Enhanced Vegetation Index (EVI). Appl. Ecol. Environ. Res. 2018, 16, 3861–3872. [Google Scholar] [CrossRef]
  34. Su, Y.T.; Wang, D.C.; Zhao, S.; Shi, J.C.; Shi, Y.Q.; Wei, D.Y. Examining long-term natural vegetation dynamics in the Aral Sea Basin applying the linear spectral mixture model. PeerJ 2021, 9, e10747. [Google Scholar] [CrossRef] [PubMed]
  35. Nezlin, N.P.; Kostianoy, A.G.; Li, B.L. Inter-annual variability and interaction of remote-sensed vegetation index and atmospheric precipitation in the Aral Sea region. J. Arid Environ. 2005, 62, 677–700. [Google Scholar] [CrossRef]
  36. Qiao, B.; He, T.; Wu, C.; Su, Z. Spatial characteristics of soil physicochemical properties on ditch slope in the Yinchuan Plain. Agric. Res. Arid. Areas 2018, 36, 43. [Google Scholar] [CrossRef]
  37. Wang, J.; Wang, M.; Liu, G.; Chu, G.; Wu, Y.; Zhang, F. Analysis of the Typical Halophytic Vegetation Resistance and Restoration Process in Abandoned Salinized Field. Xinjiang Agric. Sci. 2015, 52, 129–136. [Google Scholar]
  38. Mei, X.M.; Ma, L.; Zhu, Q.K.; Wang, S.; Zhang, D.; Wang, Y. Responses of soil moisture to vegetation restoration type and slope length on the loess hillslope. J. Mt. Sci. 2018, 15, 548–562. [Google Scholar] [CrossRef]
  39. Wang, D.; Zou, W.; Yang, H.; Li, Y.; Liu, J.; Tian, F.; Li, X.; Yuan, L. Spatial pattern of soil carbon storage in salt marsh wetlands around the Chongming Island in the Yangtze River Estuary. Acta Ecol. Sin. 2023, 43, 8465–8475. [Google Scholar] [CrossRef]
  40. Li, Y.; Wang, Z.; Wang, B.; Zhang, B.; Zhang, N. Differences in Soil Physical Properties of Typical Vegetation in Loess Hilly Region and Effects on Water Conductivity. J. Soil Water Conserv. 2019, 33, 176. [Google Scholar] [CrossRef]
  41. Yang, C.; Chen, H.Y.; Feng, X.H.; Zheng, C.Y.; Liu, X.J.; Zhu, F. Soil Physicochemical Properties and Salt Leaching Associated with Typical Plant Communities in Coastal Saline Land. J. Soil Sci. Plant Nutr. 2023, 10, 5542–5551. [Google Scholar] [CrossRef]
  42. Cui, B.S.; Yang, Q.C.; Yang, Z.F.; Zhang, K.J. Evaluating the ecological performance of wetland restoration in the Yellow River Delta, China. Ecol. Eng. 2009, 35, 1090–1103. [Google Scholar] [CrossRef]
  43. Luo, S.S.; Tian, L.; Chang, C.L.; Wang, S.J.; Zhang, J.F.; Zhou, X.; Li, X.J.; Tran, L.S.P.; Tian, C.J. Grass and maize vegetation systems restore saline-sodic soils in the Songnen Plain of northeast China. Land Degrad. Dev. 2018, 29, 1107–1119. [Google Scholar] [CrossRef]
  44. Cheng, T.L.; Wang, X.P. Shrub-soil interaction and its feedbacks to vegetation patterns in Alxa plateau in NW China. Plant Soil 2023, 485, 349–360. [Google Scholar] [CrossRef]
  45. Kim, G.; Ahn, J.; Chang, H.N.; An, J.E.; Khamzina, A.; Kim, G.; Son, Y. Effect of vegetation introduction versus natural recovery on topsoil properties in the dried Aral Sea bed. Land Degrad. Dev. 2024, 35, 4121–4132. [Google Scholar] [CrossRef]
  46. Endo, T.; Sadahiro, Y.; Haruta, T.; Kitamura, Y.; Li, Z.B.; Li, P.; Honna, T. Soil Salinization Related to Soil Morphological and Physicochemical Characteristics in the Luohui Irrigation Scheme, China. Arid Land Res. Manag. 2012, 26, 122–136. [Google Scholar] [CrossRef]
  47. Liu, Q.S.; Liu, G.H.; Huang, C.; Li, H. Soil physicochemical properties associated with quasi-circular vegetation patches in the Yellow River Delta, China. Geoderma 2019, 337, 202–214. [Google Scholar] [CrossRef]
  48. Zhang, J.; Wang, L.; Xie, J.; Zhao, T.; Cao, J. Distribution and influencing factors of soil organic carbon in Dunhuang Yangguan wetland. Chin. J. Ecol. 2017, 36, 2455–2464. [Google Scholar] [CrossRef]
  49. Chenchouni, H. Edaphic factors controlling the distribution of inland halophytes in an ephemeral salt lake “Sabkha ecosystem” at North African semi-arid lands. Sci. Total Environ. 2017, 575, 660–671. [Google Scholar] [CrossRef] [PubMed]
  50. Zhang, X.; Jia, K.; Wei, H.; Li, X. Spatial differentiation and influencing factors of soil salinity in Yinchuan Plain based on MGWR model. Journal of Yunnan University. Nat. Sci. 2023, 45, 949–960. [Google Scholar] [CrossRef]
  51. Xie, W.; Zhang, Y.; Zhang, M.; Li, R.; Wu, L.; Ouyang, Z. Relationships between soil physicochemical propertiesand wheat production in coastal saline soil. Acta Pedol. Sin. 2015, 52, 461–466. [Google Scholar] [CrossRef]
  52. Dong, Z.; Zhao, Y.; Lei, J.; Xi, Y. Distribution pattern and influencing factors of soil salinity at Tamarix cones in the Taklimakan Desert. Chin. J. Plant Ecol. 2018, 42, 873–884. [Google Scholar] [CrossRef]
  53. Xie, X.F.; Pu, L.J.; Zhu, M.; Xu, Y.; Wang, X.H. Linkage between soil salinization indicators and physicochemical properties in a long-term intensive agricultural coastal reclamation area, Eastern China. J. Soils Sediments 2019, 19, 3699–3707. [Google Scholar] [CrossRef]
  54. Elmeknassi, M.; Elghali, A.; de Carvalho, H.W.P.; Laamrani, A.; Benzaazoua, M. A review of organic and inorganic amendments to treat saline-sodic soils: Emphasis on waste valorization for a circular economy approach. Sci. Total Environ. 2024, 921, 171087. [Google Scholar] [CrossRef] [PubMed]
Figure 1. The location and an image of the research site.
Agronomy 14 02007 g001
Figure 2. Monthly precipitation and air temperature at the research site in 2021.
Agronomy 14 02007 g002
Figure 3. Different types of vegetation at the study site. Note: CK, bare land; AS, Aeluropus sinensis; IC, Imperata cylindrica; TC, Tamarix chinensis; LC, Lycium chinense; HM, Hibiscus moscheutos; HA, Helianthus annuus; GH, Gossypium hirsutum; ZM, Zea mays.
Agronomy 14 02007 g003
Figure 4. Effects of vegetation types on the soil electrical conductivity (a), total soil salt content (b), soil sodium adsorption ratio (c), and soil pH (d) distributions. Note: Values for each treatment in the same layer that are not labeled with the same letter indicate a significant difference (p ≤ 0.05).
Agronomy 14 02007 g004
Figure 5. Effects of vegetation types on the soil water content (a), soil bulk density (b), soil saturated hydraulic conductivity (c), soil organic matter content (d), and soil mean weight diameter (e) distributions. Note: Values for each treatment in the same layer that are not labeled with the same letter indicate a significant difference (p ≤ 0.05).
Agronomy 14 02007 g005
Figure 6. Redundancy analysis (RDA) showing the improvement in vegetation-induced soil properties. Note: red arrow, soil fertility factors; blue arrow, soil salinization factors.
Agronomy 14 02007 g006
Figure 7. The relationships and mode of importance of soil fertility factors on soil salinization. (a) The structural equation model (SEM) showed the relationships between soil fertility factors and soil salinization. (b) Standardized total effects from the SEM showed the importance of key soil fertility factors on soil salinization. Note: *, significance level at p ≤ 0.05. yellow box, SOM; bule box, BD; purple box, SWC; pink box, MWD; grey box, Ks.
Agronomy 14 02007 g007
Figure 8. The soil salinization variation partitioning analysis results. Note: numbers indicated the proportion (%) of explained variations.
Agronomy 14 02007 g008
Table 1. Soil grain sizes with different vegetation types.
Vegetation TypesSand (%)Silt (%)Clay (%)
0–20 cm20–40 cm0–20 cm20–40 cm0–20 cm20–40 cm
CK16.11 ± 0.04 b13.30 ± 0.21 c83.50 ± 0.04 f85.94 ± 0.16 e0.37 ± 0.02 d0.74 ± 0.02 gh
AS18.13 ± 0.08 a18.52 ± 0.08 a81.03 ± 0.02 g80.50 ± 0.03 g0.84 ± 0.03 c0.98 ± 0.02 e
IC8.84 ± 0.02 h7.07 ± 0.02 f90.13 ± 0.08 a92.23 ± 0.82 a1.03 ± 0.02 b0.70 ± 0.02 h
TC11.22 ± 0.03 f9.02 ± 0.02 e87.75 ± 0.16 c89.92 ± 0.16 c1.03 ± 0.02 b1.06 ± 0.05 d
LC12.70 ± 0.08 e9.29 ± 0.08 e86.24 ± 0.16 d89.84 ± 0.24 b1.06 ± 0.00 a0.88 ± 0.02 f
HM18.22 ± 0.26 a6.98 ± 0.21 f80.25 ± 0.25 h90.68 ± 0.21 e1.53 ± 0.00 a2.34 ± 0.00 a
HA13.56 ± 0.07 d13.21 ± 0.04 c85.14 ± 0.07 e85.50 ± 0.04 e1.30 ± 0.00 b1.30 ± 0.26 b
GH14.10 ± 0.17 c 9.90 ± 0.15 d 85.01 ± 0.16 e 88.98 ± 0.15 d 0.89 ± 0.02 d 1.12 ± 0.26 c
ZM10.65 ± 0.12 g14.51 ± 0.22 b88.32 ± 0.12 b84.73 ± 0.21 f1.03 ± 0.00 c0.76 ± 0.26 g
Note: Values represent means ± S.D. Values for each treatment in the same layer that are not labeled with the same letter indicate a significant difference (p ≤ 0.05).
Table 2. The importance rankings and significance test results for the soil fertility indicators.
SeasonsDepthIndicatorsExplains %Contribution %Pseudo-Fp
Spring0–20 cmBD58 76.5 9.7 0.032 *
SOM9.6 12.7 1.8 0.042 *
MWD4.25.60.70.034 *
SWC3.54.6 0.60.418
Ks 0.60.8<0.10.802
20–40 cmSOM41 66 4.9 0.036 *
BD11.1 17.9 1.4 0.031 *
MWD6.911.10.70.042 *
SWC2.33.70.30.468
Ks0.8 1.3 <0.10.824
Autumn0–20 cmBD36.9 39.9 4.1 0.034 *
SOM22.524.46.90.014 *
MWD17.6 193.9 0.106
SWC12131.40.481
Ks 3.43.70.50.072
20–40 cmSOM45.8 50 5.9 0.042 *
BD23.125.250.034 *
SWC10.1113.60.076
Ks 8.18.91.10.394
MWD4.6510.196
Note: *, significance level at p ≤ 0.05.
Disclaimer/Publisher’s Note: The statements, opinions and data contained in all publications are solely those of the individual author(s) and contributor(s) and not of MDPI and/or the editor(s). MDPI and/or the editor(s) disclaim responsibility for any injury to people or property resulting from any ideas, methods, instructions or products referred to in the content.

