Abstract
Soil is the basis of bamboo growth and quality formation of bamboo shoots and has an important contribution to the sustainable development of agriculture. To this end, We studied the soil properties and microbial communities of Dendrocalamus brandisii by collecting twenty-one soil samples from its seven typical geographic provenances in Yunnan Province, China. Bacterial 16S rRNA gene amplicons were used to detect soil bacteria and predict bacterial functions using Tax4Fun. The results indicated that the soil bacterial diversity indices (ACE, Chao1, Simpson, and Shannon) were significantly different among different geographical provenances. The dominant bacterial groups at the phylum level in all seven regions were Proteobacteria (19.78~29.06%), Actinobacteria (13.53~30.01%), Chloroflexi (8.03~31.47%), and Acidobacteria (7.12~19.17%), with markedly different constitution proportions. Total phosphorus, available potassium, and pH were the main environmental factors affecting soil bacterial communities. There were significant differences in the secondary metabolic pathways and phenotypes of soil bacterial functions, exhibiting a diversity of functions. The geographical variables of the soil bacterial community in D. brandisii varied with spatial scales. Environmental factors such as available potassium (AK), pH, and total nitrogen (TN) have an impact on soil bacterial communities.
1. Introduction
Bamboo exhibits several advantageous traits, including rapid growth, efficient afforestation, long-term utilization, short production cycles, and high productivity. These characteristics play a significant role in poverty reduction, enhancing human livelihoods, and mitigating climate change [1]. China is abundant in bamboo resources [2], which hold substantial economic value. The bamboo industry empowers the socio-economic development in major bamboo-producing areas and constitutes the primary source of income for numerous farming households in China [3]. Dendrocalamus brandisii is widely distributed from Southwest- to South China and stands out for its excellent quality of fresh shoots, characterized by a pleasant taste without bitterness, making it suitable for various culinary preparations such as fresh eating, stewing, and frying. D. brandisii emerges as an exceptional bamboo species for both shoot consumption and material applications due to its tall stalk and versatile stalk material [4]. D. brandisii belongs to the thermophilic and hygrophilous large clumping bamboo species in the Bambusoideae subfamily. It demonstrates strong adaptability and grows well in low mountains, gentle slopes, and river valley areas. It is mainly produced in Yunnan, including cities such as Baoshan, Dehong, Lincang, Puer, Honghe, and Yuxi [5].
The majority of nutrients and water required for bamboo growth are obtained from the soil, making it the foundation for bamboo growth and shoot quality [6]. Within the soil, a diverse array of microbial communities engage in decomposition and transformation processes, facilitating nutrient availability for plant growth [7]. Additionally, microorganisms can indirectly enhance plant growth by improving soil quality, producing humic acids, and increasing plant stress resistance [8]. Among these microorganisms, bamboo forest soil bacteria have the most active metabolic function, which promotes plant nutrient absorption and utilization [9]. Therefore, it is crucial to understand the structure and function of soil bacterial communities. Previous studies have indicated that soil bacteria are typically responsive to the physical and chemical properties of their habitat [10,11,12], as well as to environmental factors such as temperature, precipitation, humidity, and climate change [13,14,15]. Moreover, solar radiation and soil erosion play significant roles in shaping soil temperature, water retention and availability, and nutrient dynamics, thereby influencing the composition and activity of soil bacterial communities [16,17]. Additionally, topographic and altitude factors exert notable influences on the soil bacterial community, with significant differences observed in soil bacterial communities across different slopes and slope orientations [18]. An increase in altitude can lead to vertical zoning differentiation of vegetation due to differences in water and heat, resulting in significant changes in vegetation diversity and the quantity of above and below-ground litter inputs.
Studies have proven that distance and environmental variables are the main drivers of microbial communities [19,20]. The soil bacterial communities within China’s six major apple-producing areas have exhibited alteration due to changes in the spatial scale. Environmental factors indirectly affect apple fruit quality by shaping soil bacterial communities [21]. Several studies have disclosed substantial alterations in the taxonomy and functional diversity of underground microorganisms over time, especially under various soil conditions [22,23]. Moreover, there are changes in the soil properties, composition, and the diversity of soil microbial communities beneath different tree species [24]. Despite these findings, there is limited information available regarding the soil bacterial communities of the same vegetation across distinct geographical locations and the interaction between soil physical and chemical properties and bacterial communities.
In recent years, research on D. brandisii from different geographic seed sources has mainly focused on the nutritional quality of bamboo shoots [25]. However, there is currently a lack of studies investigating the composition and functional characteristics of soil microbial communities associated with D. brandisii. Therefore, this study aims to address this research gap by selecting seven representative D. brandisii sources in Yunnan Province. Our particular aims are as follows: (i) exploring the structural characteristics and diversity differences of soil bacterial communities among different geographic seed sources of D. brandisii; (ii) Discussing the relationship between soil chemical properties and bacterial community structure in different seed sources of D. brandisii; (iii) Predicting the bacterial functions of the soil in different geographic seed sources of D. brandisii.
2. Materials and Methods
2.1. Overview of the Research Area
The sampling sites of this research area included seven D. brandisii cultivation bases located in Changning County, Baoshan City, Mang County, Dehong Prefecture, Cangyuan County, Lincang City, Matai Township, Linxiang District, Lincang City, Simao District, Pu’er City, Shiping County, Honghe Prefecture, and Xinping County, Yuxi City All seven sampling sites were artificially pure forest communities and were extensively managed. The collection period was from 16 August to 8 September 2022. The basic information for each sampling site is presented in Table 1. To facilitate subsequent analysis, the seven regions were abbreviated as CN (Changning County, Baoshan City), MS (Mang County, Dehong Prefecture), CY (Cangyuan County, Lincang City), MT (Matai Township, Linxiang District), SM (Simao District, Pu’er City), SP (Shiping County, Honghe Prefecture), and XP (Xinping County, Yuxi City), with each named using the uppercase initials of their location.

Table 1.
Basic situation of sampling sites.
2.2. Soil Sampling
For each research area, we selected clusters of D. brandisii with similar growth conditions and management practices for sampling. Three sample clusters were chosen as biological replicates, resulting in a total of 21 samples. The soil sampling process involved removing surface litter and humus, followed by collecting mixed soil samples from depths of 0 to 20 cm using the five-point sampling method [26]. Subsequently, each soil sample was sieved through a 2 mm mesh. Half of the samples were stored at −80 °C before soil DNA extraction, and the others were stored at −4 °C before soil property analysis.
2.3. Soil Properties Analysis
The pH of the soil was determined using a pH meter (1:2.5 soil-to-water ratio) [27]. Soil organic matter (SOM) was determined by the potassium dichromate volumetric method [28]. Available phosphorus (AP) was extracted with a hydrochloric acid-ammonium fluoride solution and determined by a visible spectrophotometer [29]. The available potassium (AK) was extracted by 1 mol·L-1 ammonium acetate acid and then determined via flame photometry [30]. Total nitrogen (TN) was determined by the Kjeldahl method [31], and then the total phosphorus (TP) was measured using the molybdenum antimony blue colorimetric method [32]. Total potassium (TK) was measured by a flame photometer [33].
2.4. DNA Extractions and 16S RNA High-Throughput Sequencing
DNA extraction was carried out using the MagAttract PowerSoil Pro DNA Kit (QIAGEN, Hilden, Germany), followed by the instructions. The quality of the extracted genomic DNA was assessed by 1% agarose gel electrophoresis, and the DNA concentration and purity were measured using NanoDrop2000 (Thermo Scientific, Waltham, MA, USA). Bacterial 16S rRNA was amplified using upstream primer 338F (5′-ACTCCTACGGGGAGGCAGCAG-3′) and downstream primer 806R (5′-GGACTACHVGGGGTWTCTAAT-3′), which carry Barcode sequences. The PCR reaction system consisted of 4 μL of 5 × TransStart FastPfu Buffer, 2 μL of 2.5 mM dNTPs, 0.8 μL of upstream primer (5 μM), 0.8 μL of downstream primer (5 μM), 0.4 μL of TransStart FastPfu DNA polymerase, and 10 ng of template DNA; the volume was adjusted to 20 μL. Library construction was performed using the NEXTFLEX Rapid DNA-Seq Kit, and sequencing was carried out on the Miseq PE300 platform of Illumina (performed by Shanghai Meiji Biomedical Technology Co., Ltd., Shanghai, China).
After obtaining the raw sequencing data, quality control and assembly were performed using FASTP (version 0.19.6) and FLASH (version 1.2.11) [34,35]. We used UPARSE (version 7.1) to cluster operational taxonomic units (OTUs) based on 97% similarity in the sequences after quality control and assembly, and chimeras were removed. The alignment with the Silva 16S rRNA gene database (version 138) for OTU species taxonomic annotation was performed using the RDP (version 2.11). The confidence threshold was set at 70%, and community compositions at different taxonomic levels were recorded for each sample. For 16S functional prediction analysis, we utilized the software PICRUSt2 [36] (version 2.2.0).
2.5. Data Statistics and Analysis
Alpha diversity indices, such as Chao1 and Shannon, were calculated using the software Mothur v.1.30.0, and intergroup differences in Alpha diversity were conducted using the one-way ANOVA. Beta diversity analysis involved NMDS (Non-metric multidimensional scaling) analysis based on the Bray–Curtis distance algorithm to assess the similarity of microbial community structures between samples. The significance of differences in microbial community structures between sample groups was analyzed using the non-parametric test ANOSIM (Analysis of similarities). Redundancy analysis (RDA) was employed to examine the impact of soil chemical indicators on the structure of soil bacterial communities. Bacterial functional prediction was performed using Tax4Fun, while phenotypic prediction was carried out using Bugbase. Statistical analysis of the basic data was performed using Excel (2019) and SPSS (version 25.0).
3. Results
3.1. Soil Factors
There were significant differences in soil environmental factors among the seven areas (p < 0.05) (Table 2). The pH values of all seven areas were less than 7, indicating acidic soil. Among them, the SM area had the lowest pH value, making its soil more acidic, while the SP area had the highest pH value, suggesting less acidic soil compared to the other six areas. The organic matter content in CY’s soil area was significantly higher than that of areas MS, MT, and SM (p < 0.05), with no significant difference observed compared to CN, SP, and XP areas. The available phosphorus content in MT’s soil was significantly higher than in the other six areas (p < 0.05), with MS having the least available phosphorus content. The available potassium content in SP’s soil was significantly higher than in CN, MS, CY, and SM (p < 0.05), with CN having the lowest content. The total nitrogen content in XP’s soil was significantly higher than in MS, MT, and SM areas (p < 0.05), with no significant difference observed compared to CN, CY, and SP. The total phosphorus content in MT’s soil was significantly higher than in CN, MS, SM, SP, and XP areas (p < 0.05), with a slight difference from CY, while SM had the lowest content. The total potassium content in XP’s soil was significantly higher than in the other six areas (p < 0.05), with the lowest content observed in SP areas.
Table 2.
Soil properties in the seven studied geographical provenance sites.
3.2. Soil Bacterial Community Diversity
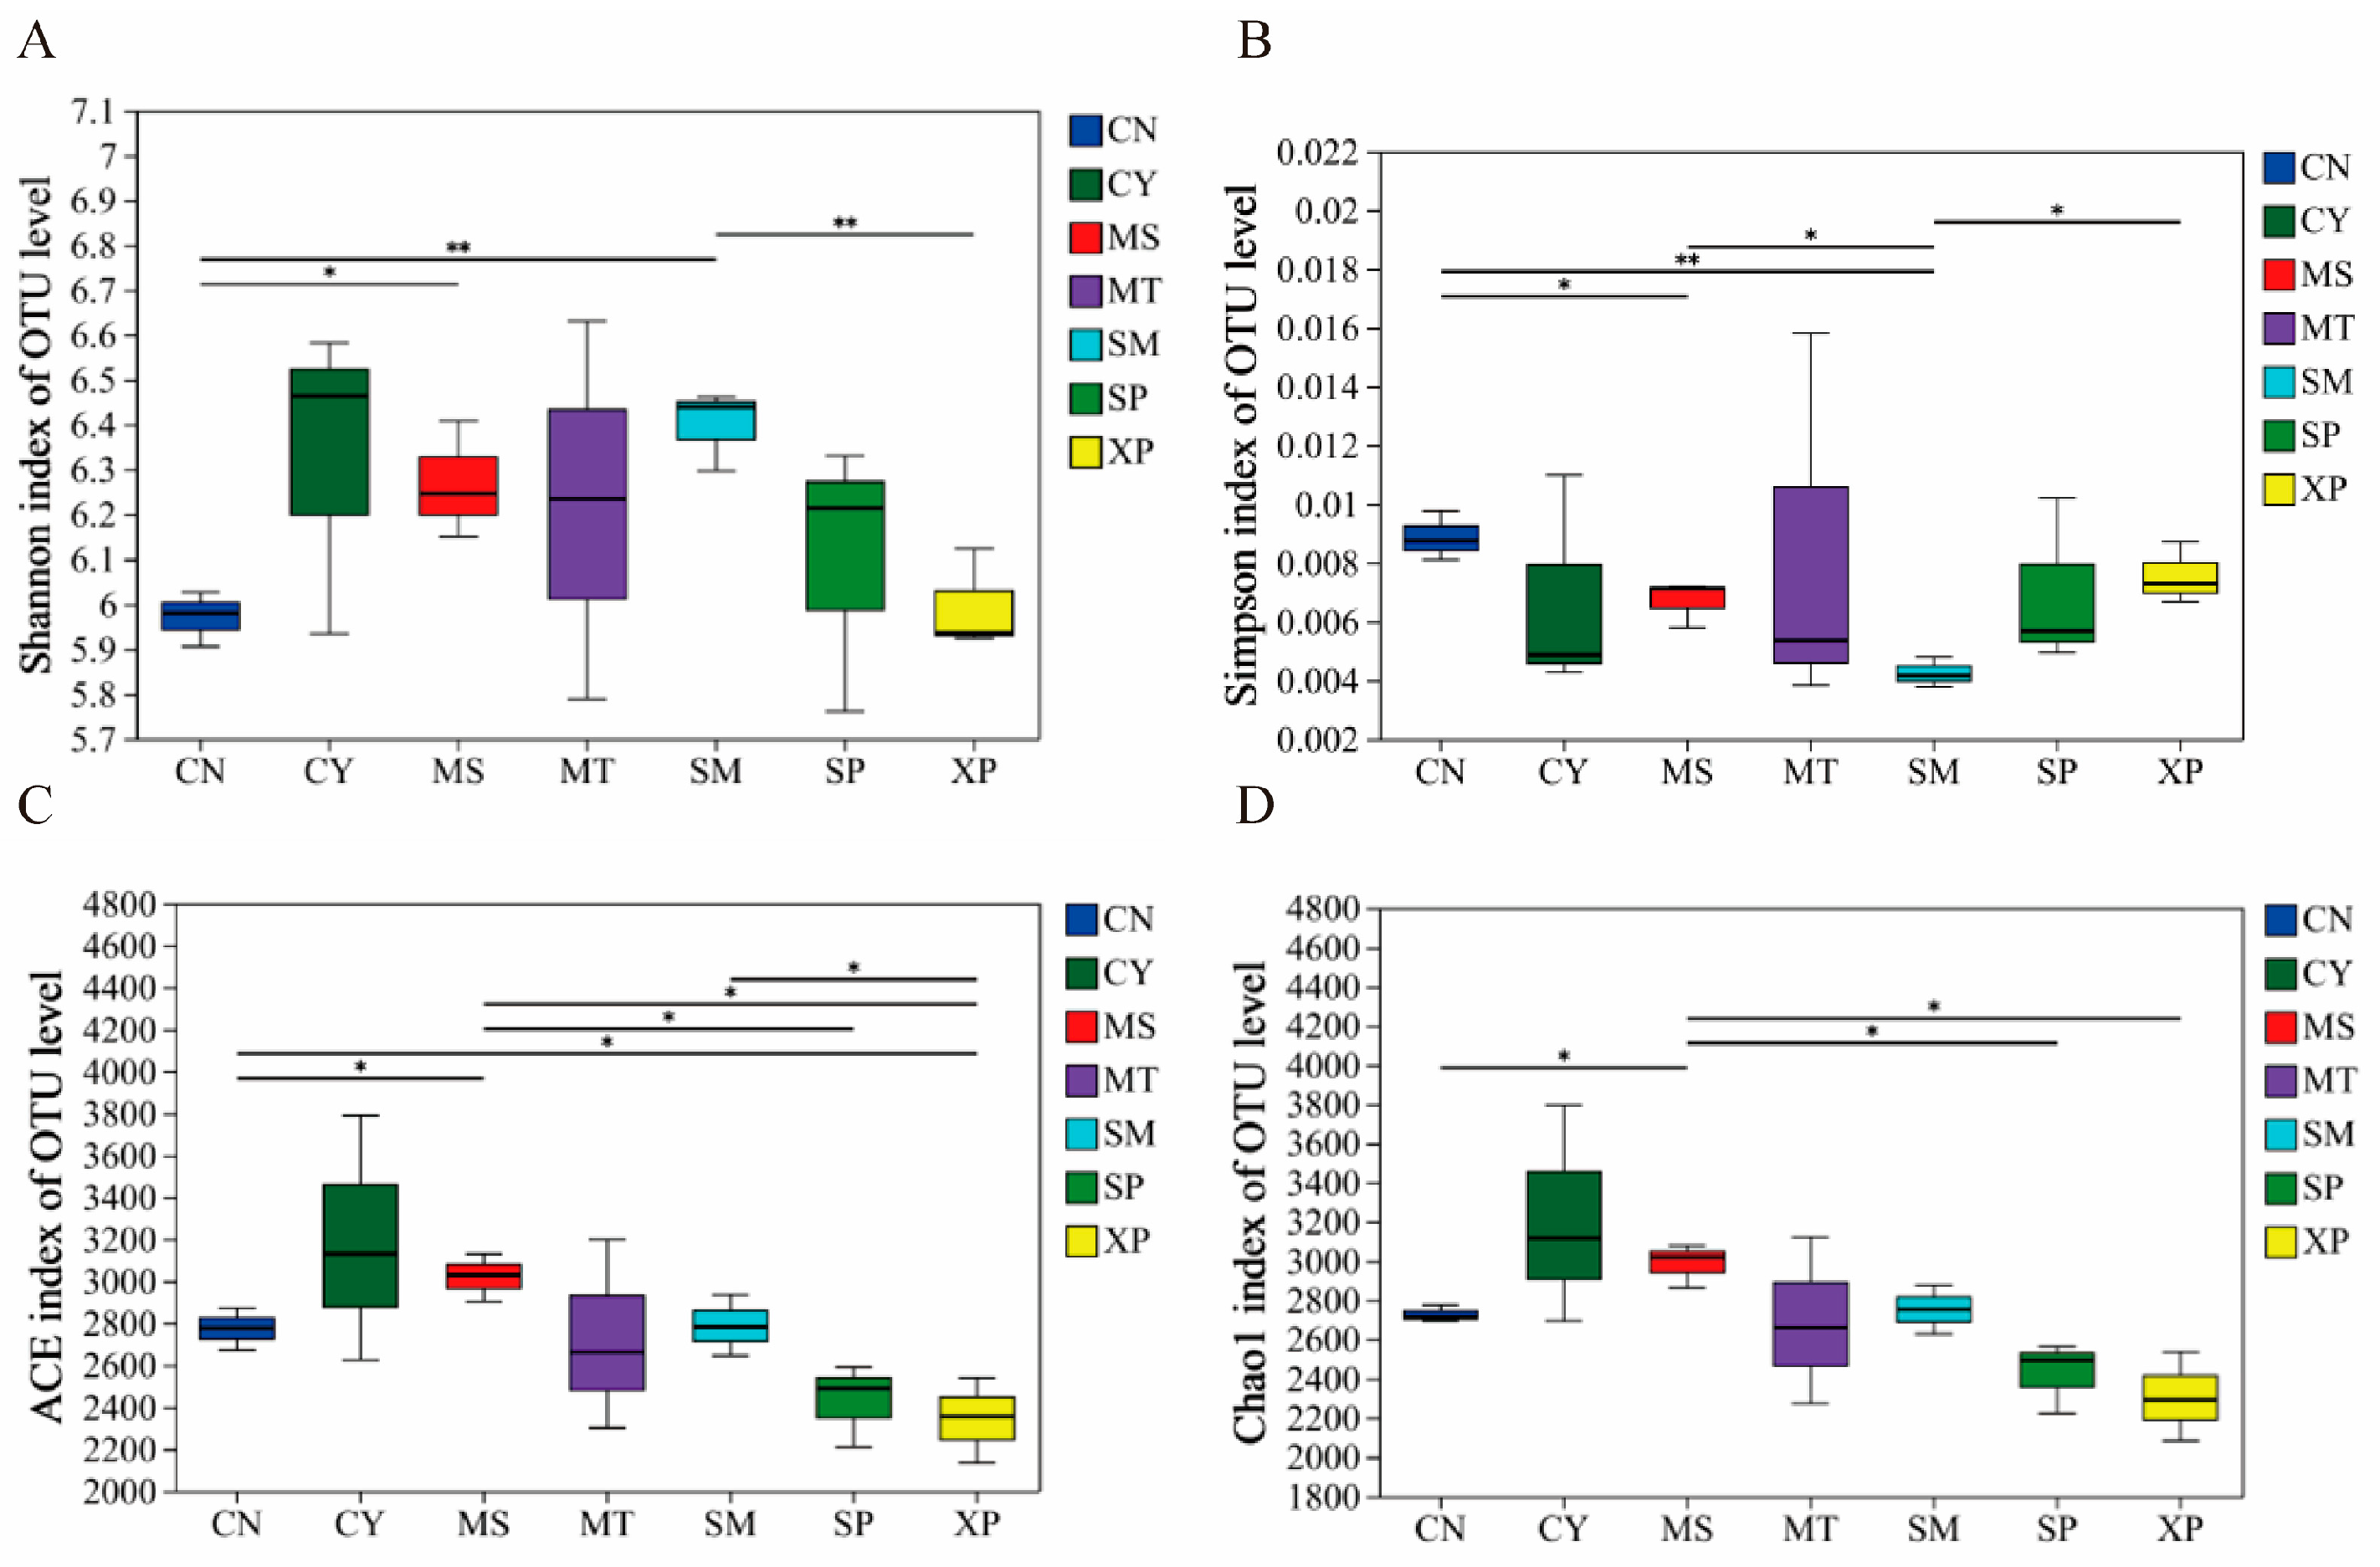
The diversity index of soil bacterial communities in different geographical provenances was tested by one-way ANOVA. The results showed that there were significant differences in the ACE, Chao1, Shannon, and Simpson indices (Figure 1). The Shannon and Simpson indices of bacterial communities showed extremely significant differences (p < 0.01) between CN, SM, and XP. The ACE and Chao1 indices of bacterial communities exhibited significant differences in five and six areas, respectively (p < 0.05). The bacterial community was analyzed by NMDS (Figure 2), and the difference in community structure between groups was tested by the detection of ANOSIM significance. The stress function value of the model was 0.093, indicating a good ordination. The soil bacterial communities of SM, CN, and XP were relatively clustered, while MT, SP, and CY were more separate. Additionally, SP and XP exhibited clustering, suggesting that the bacterial community structure of SP and XP was similar. However, overall, the soil bacterial community structures of D. brandisii in the seven areas exhibited significant differences (R = 0.834, p = 0.001).

Figure 1.
Alpha diversity indices including OTU Shannon (A), Simpson (B), ACE (C) and Chao1 (D) of soil bacterial communities. ** (p < 0.05) and * (p < 0.01) indicate significant differences among geographical provenances based on a one-way ANOVA followed by a Welch t-test. CN: Changning County, Baoshan City; CY: Cangyuan County, Lincang City; MS: Mang County, Dehong Prefecture; MT: Matai Township, Linxiang District, Lincang City; SM: Simao District, Pu’er City; SP: Shiping County, Honghe Prefecture; and XP: Xinping County, Yuxi City.
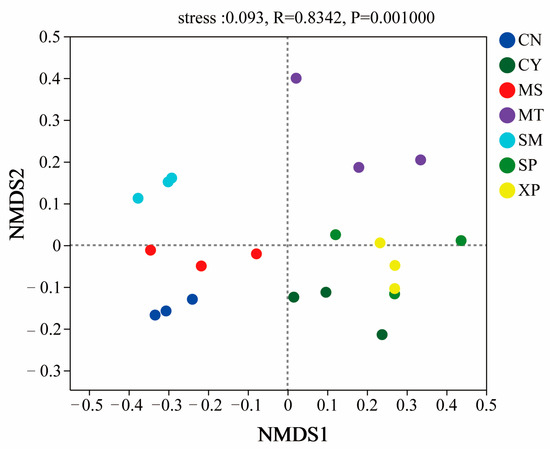
Figure 2.
NMDS analysis of soil bacterial communities. CN: Changning County, Baoshan City; CY: Cangyuan County, Lincang City; MS: Mang County, Dehong Prefecture; MT: Matai Township, Linxiang District, Lincang City; SM: Simao District, Pu’er City; SP: Shiping County, Honghe Prefecture; and XP: Xinping County, Yuxi City.
3.3. Bacterial Community Composition in Different Sources
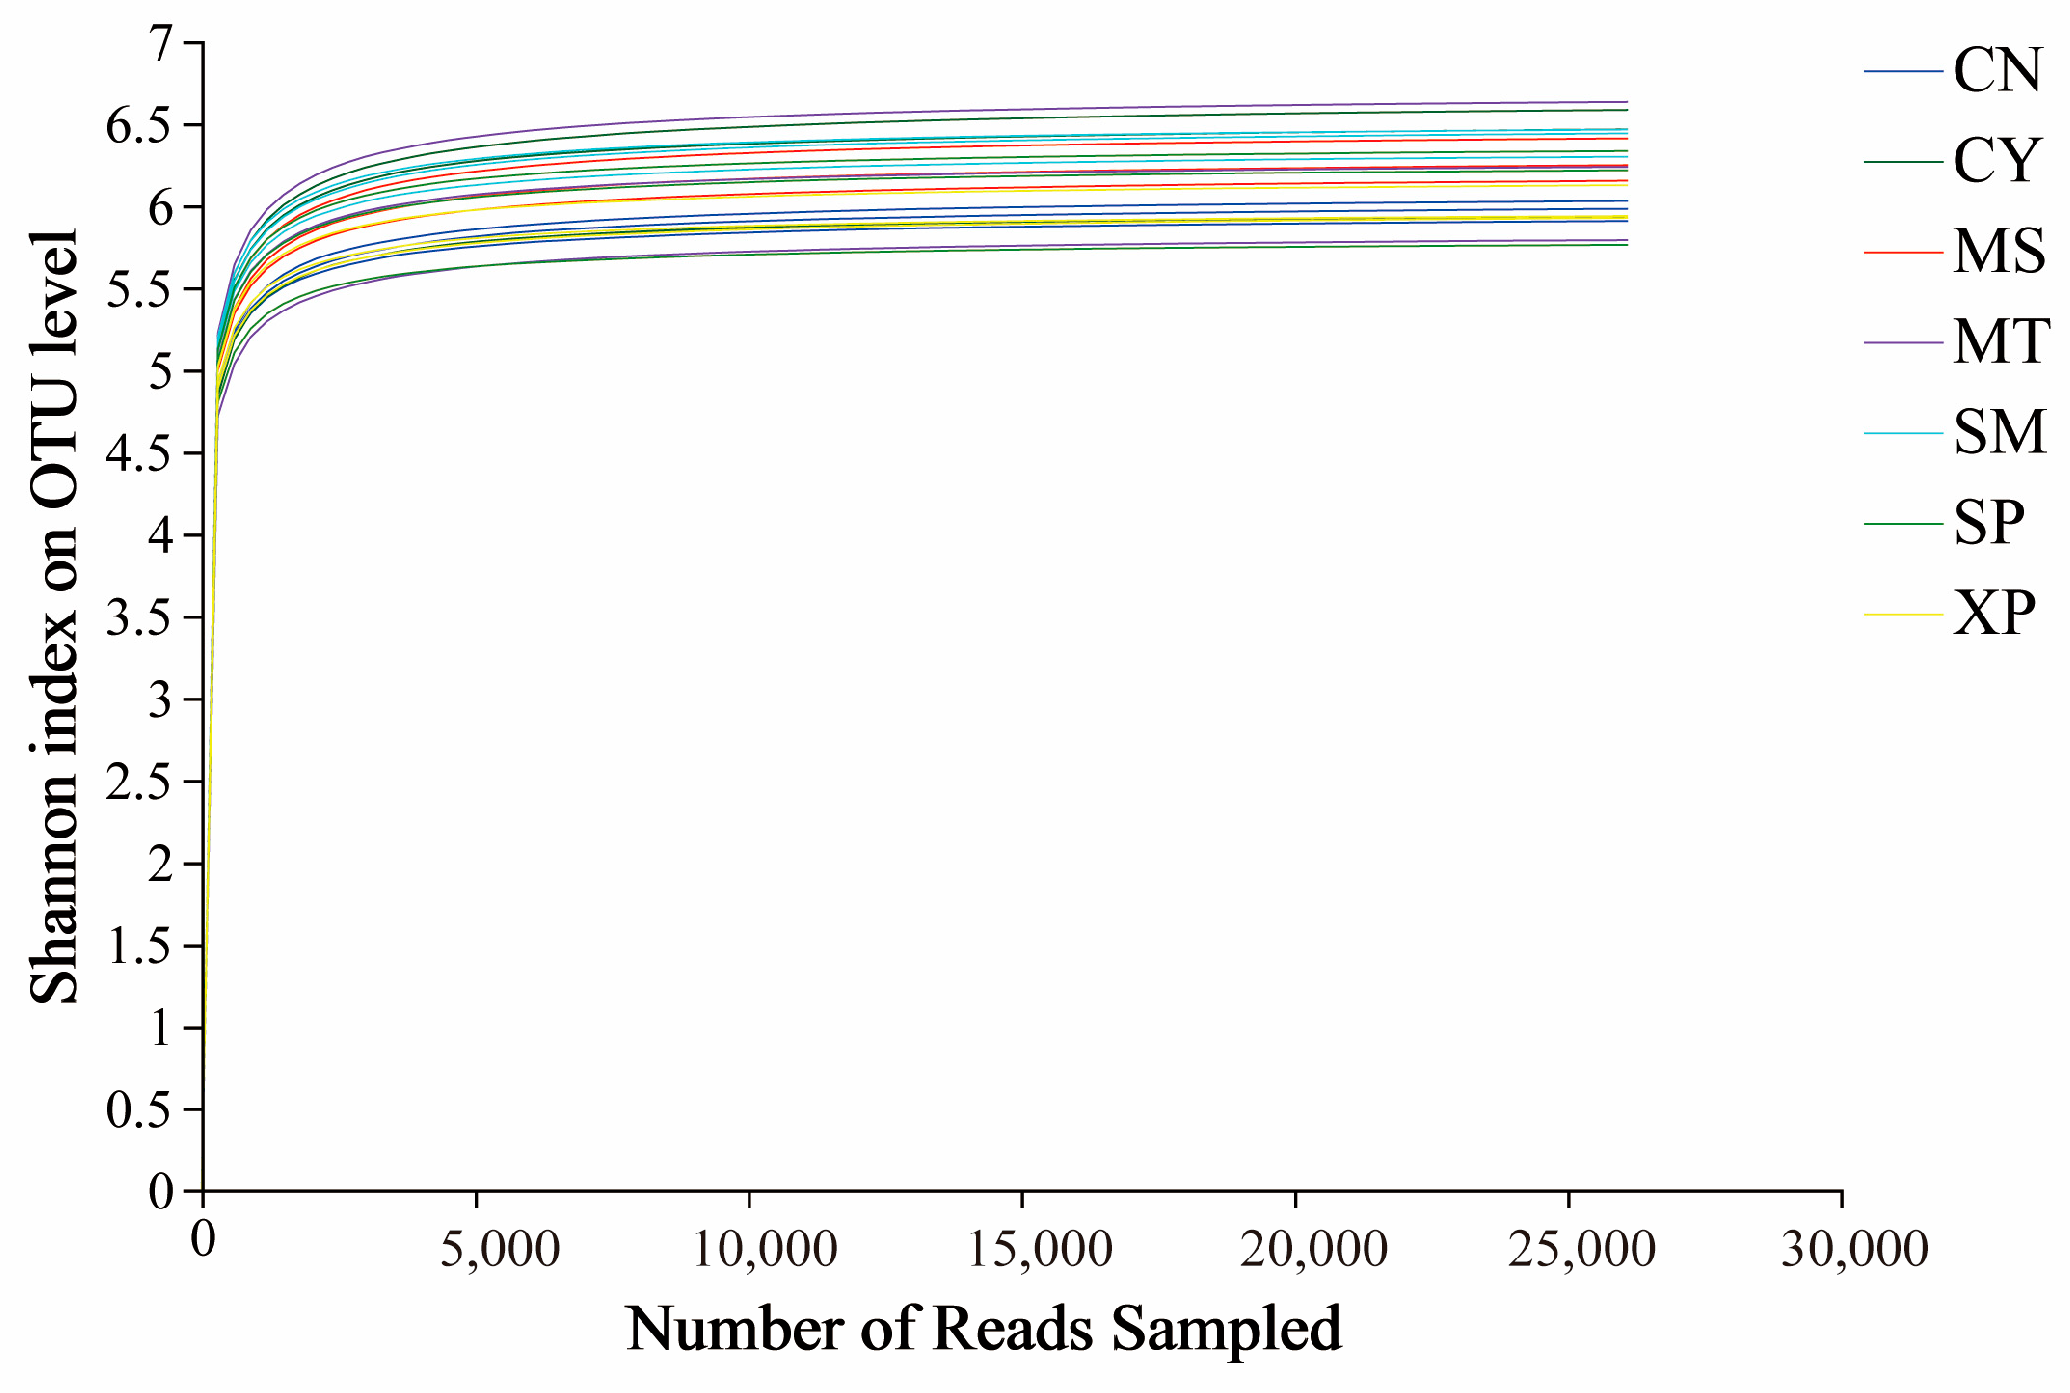
Based on a 97% similarity, sequences were classified into operational taxonomic units (OTUs) after quality filtering, and any OTUs aligned to chloroplast and mitochondrial sequences were removed. Following the normalizing of sample sequences, a total of 6827 OTUs were obtained. The bacterial dilution curve gradually flattens as the amount of sequencing data increases, indicating that the sequencing depth has covered all the species in the sample, making the sequencing data reasonable (Figure 3). The Venn diagram illustrated the unique OTUs among the seven areas: CN, CY, XP, SP, SM, MT, and MS—they had 175, 201, 102, 221, 380, 313, and 196 unique OTUs, respectively (Figure 4). Additionally, 749 OTUs were shared among all the seven areas. These findings indicated a degree of similarity in bacterial microbes among the soil samples of D. brandisii from different geographical locations, while notable differences were more pronounced.
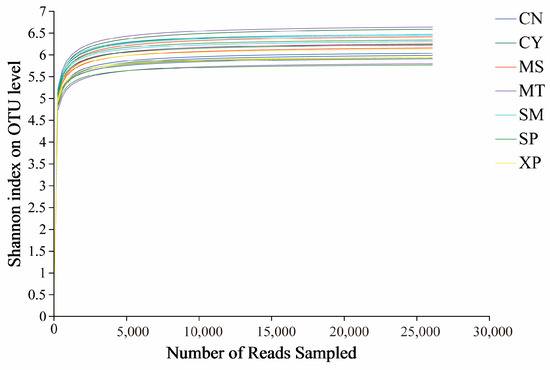
Figure 3.
Bacterial dilution curve. CN: Changning County, Baoshan City; CY: Cangyuan County, Lincang City; MS: Mang County, Dehong Prefecture; MT: Matai Township, Linxiang District, Lincang City; SM: Simao District, Pu’er City; SP: Shiping County, Honghe Prefecture; and XP: Xinping County, Yuxi City.
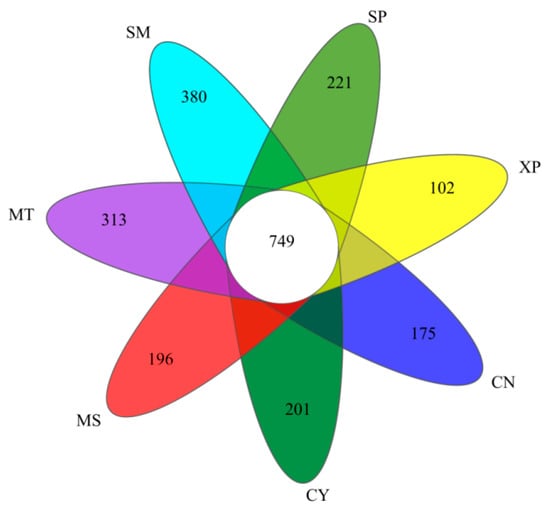
Figure 4.
Venn diagram based on OTUs. CN: Changning County, Baoshan City; CY: Cangyuan County, Lincang City; MS: Mang County, Dehong Prefecture; MT: Matai Township, Linxiang District, Lincang City; SM: Simao District, Pu’er City; SP: Shiping County, Honghe Prefecture; and XP: Xinping County, Yuxi City.
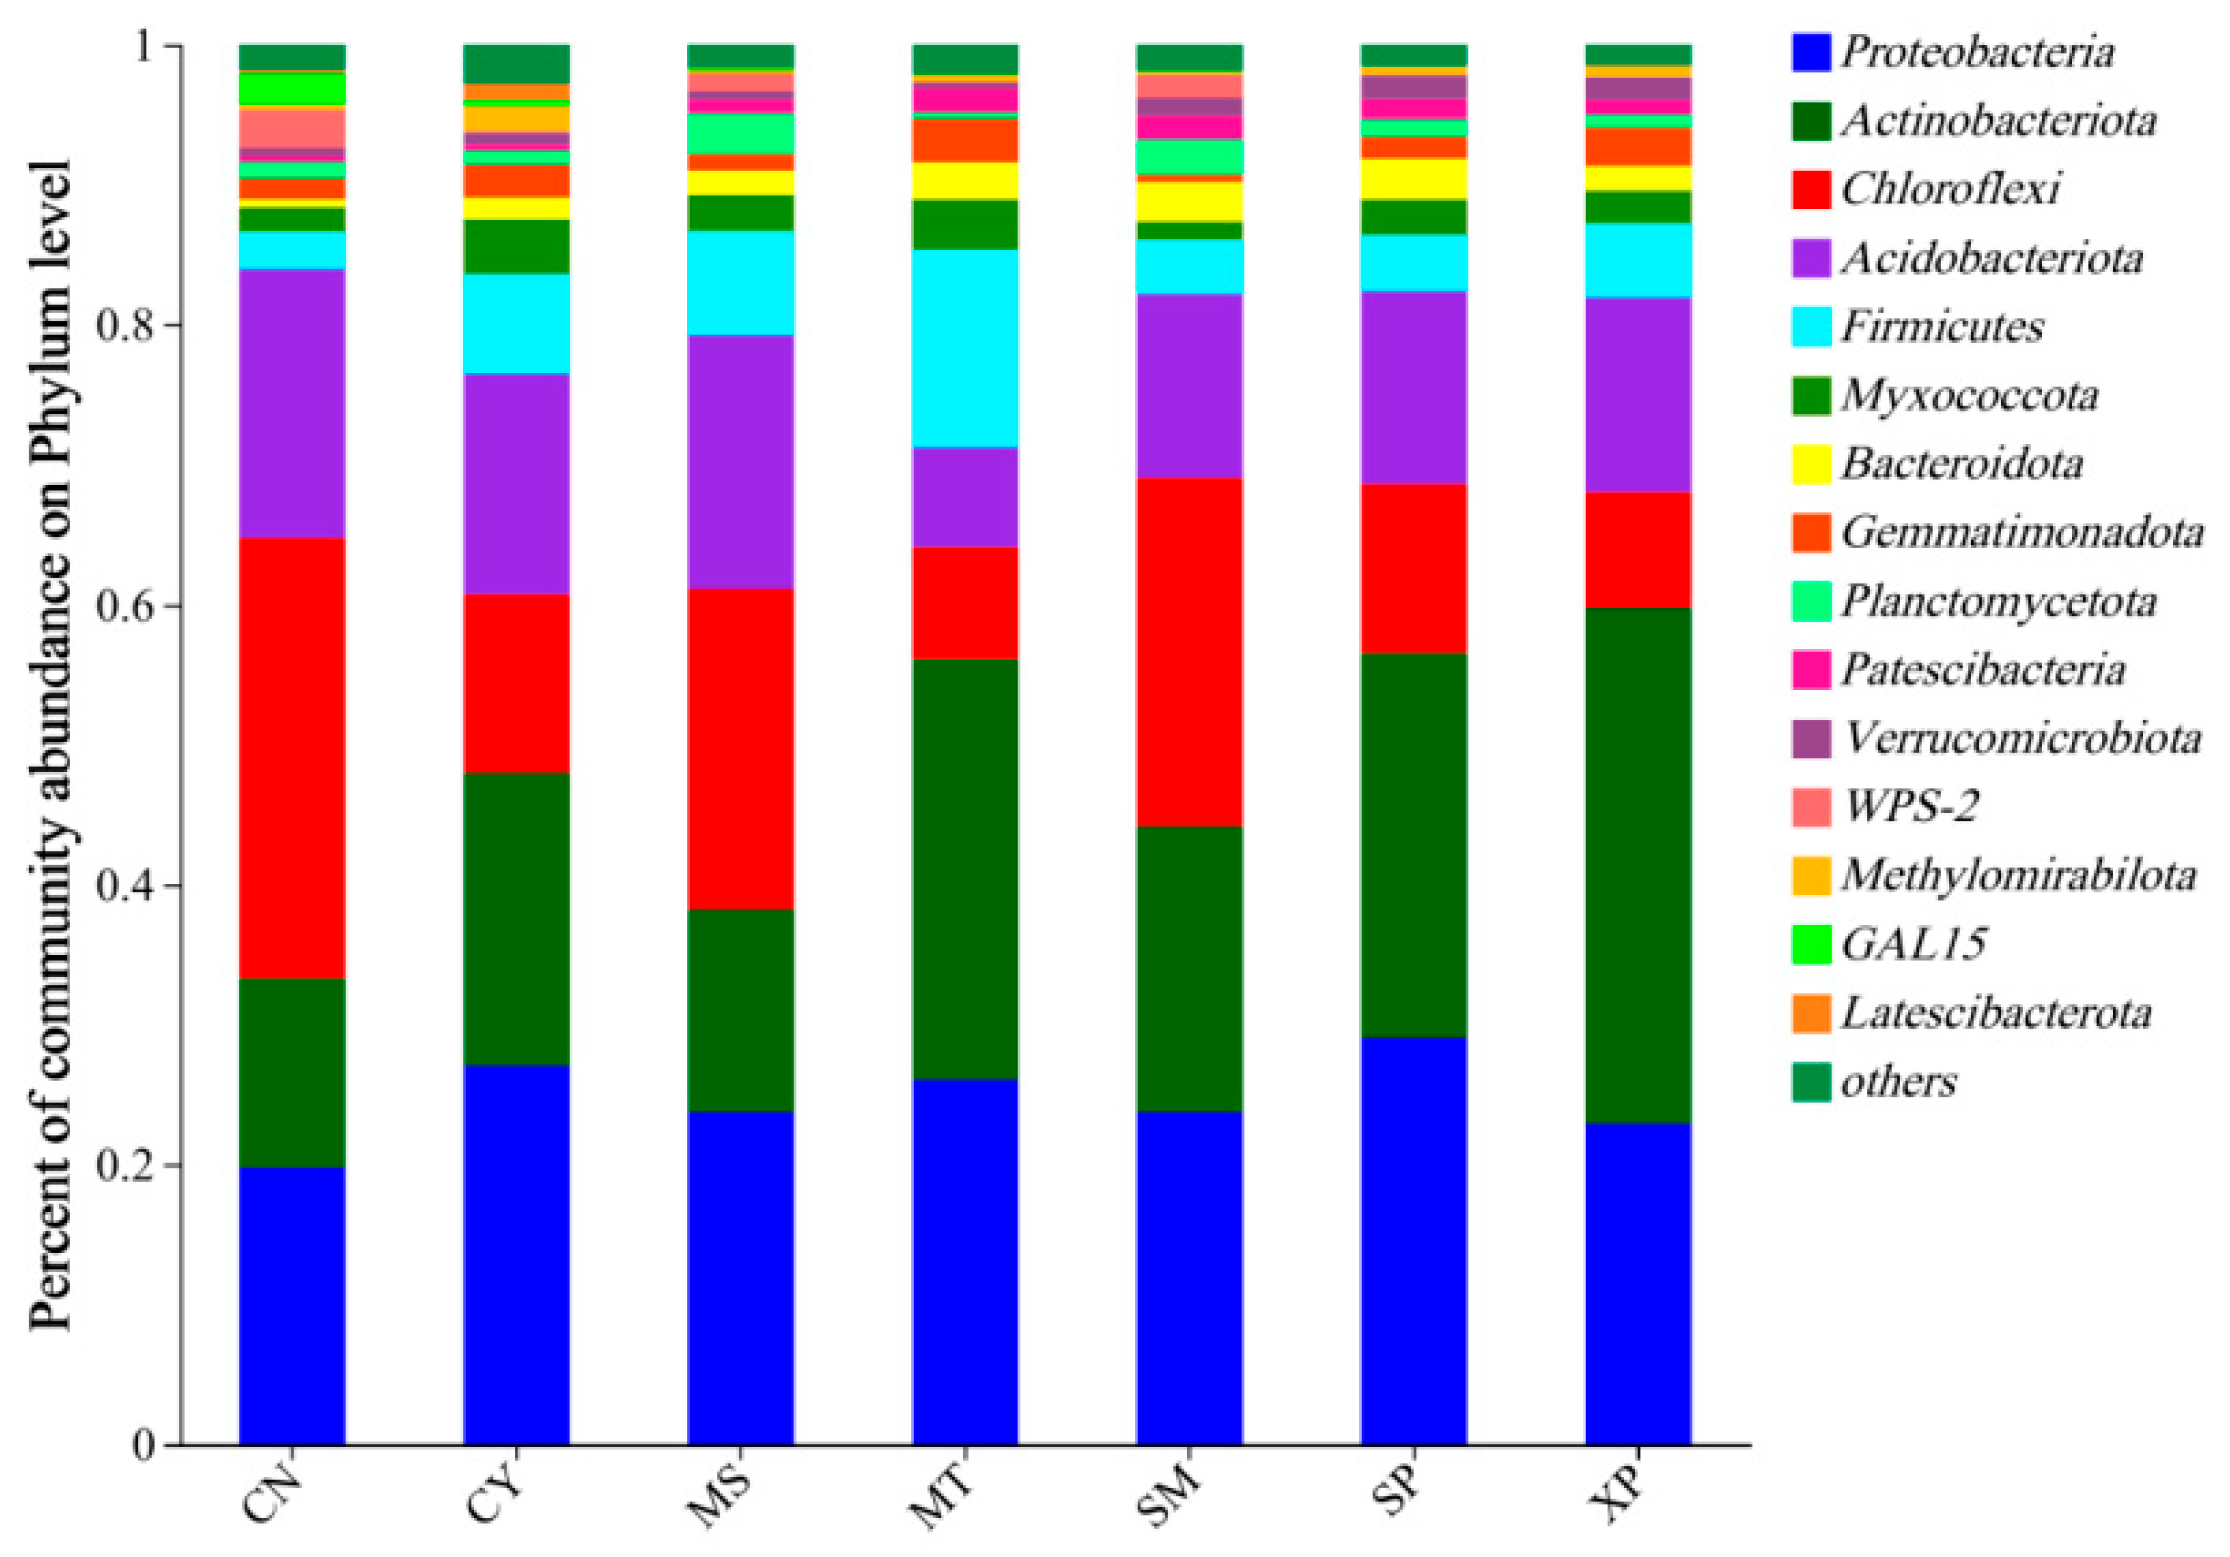
The OTU sequences obtained were annotated for classification, revealing that soil bacteria from the seven areas belonged to 40 phyla, 127 classes, 307 orders, 509 families, and 998 genera. The species composition of soil bacterial communities at the phylum level is shown in Figure 5. The main dominant bacterial groups in the seven different sources were included as Proteobacteria (19.78~29.06%), Actinobacteria (13.53~30.01%), Chloroflexi (8.03~31.47%), Acidobacteria (7.12~19.17%), and Firmicutes (2.72~14.13%). Among the seven geographical provenances, CN’s soil exhibited the highest relative abundance of Chloroflexi. XP’s soil had the highest relative abundance of Actinobacteria, SP’s soil showed the highest relative abundance of Proteobacteria, and MT’s soil had a higher relative abundance of Firmicutes compared to other areas. MS soil had a higher than relative abundance of Planctomycetota, while CY’s soil showed a higher relative abundance of Myxococcota compared to other areas. Although the dominant bacterial groups were consistent across the different source areas, their respective proportions were different.

Figure 5.
Species composition of bacteria at the phylum level. CN: Changning County, Baoshan City; CY: Cangyuan County, Lincang City; MS: Mang County, Dehong Prefecture; MT: Matai Township, Linxiang District, Lincang City; SM: Simao District, Pu’er City; SP: Shiping County, Honghe Prefecture; and XP: Xinping County, Yuxi City.
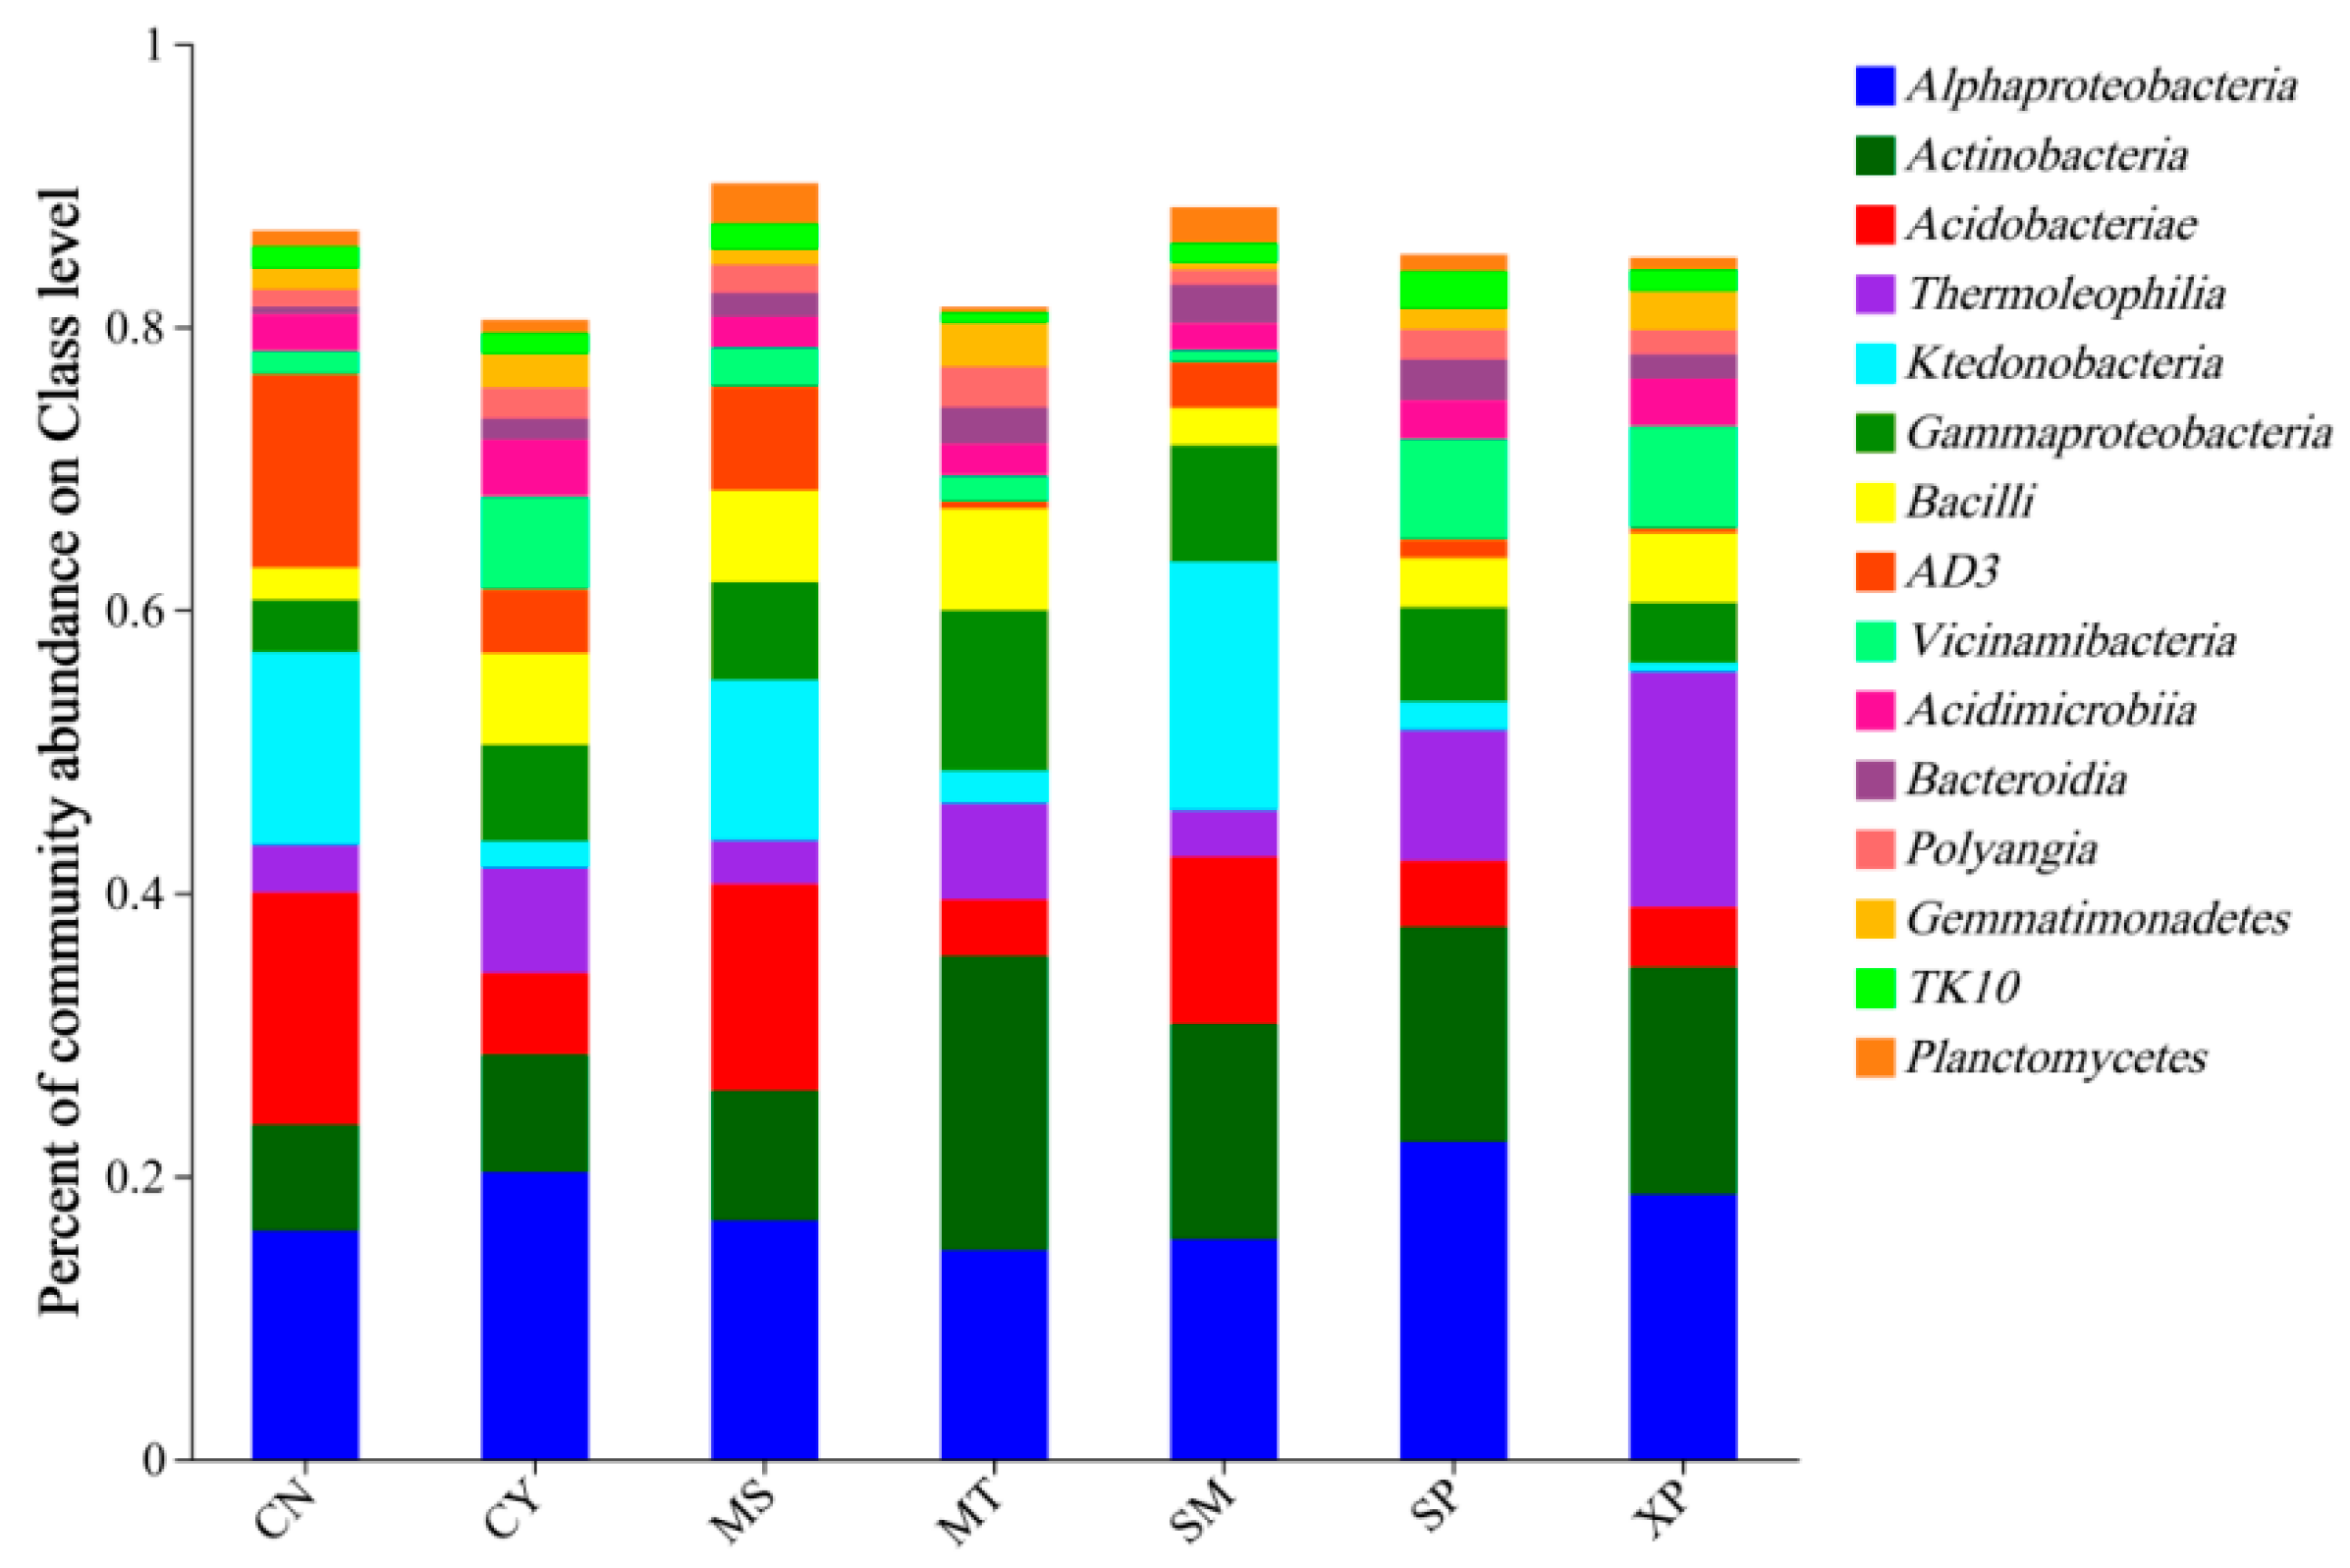
At the class level, the main dominant bacterial groups identified were Alphaproteobacteria (14.75%~22.40%), Actinobacteria (7.52%~20.80%), Acidobacteria (3.95%~16.37%), Thermoleophilia (3.09%~16.62%), and Ktedonobacteria (0.66%~17.56%) (Figure 6). Among these groups, CY’s soil showed the highest relative abundance of Acidobacteria and AD3, while SP’s soil had the highest relative abundance of Alphaproteobacteria. MT’s soil showed the highest relative abundance of Actinobacteria and Gammaproteobacteria, whereas XP’s soil had the highest relative abundance of Thermoleophilia. Lastly, SM’s soil had the highest relative abundance of Ktedonobacteria. It is worth noting that the proportions of these dominant bacterial groups varied across the different source areas.

Figure 6.
Species composition of bacteria at the class level. CN: Changning County, Baoshan City; CY: Cangyuan County, Lincang City; MS: Mang County, Dehong Prefecture; MT: Matai Township, Linxiang District, Lincang City; SM: Simao District, Pu’er City; SP: Shiping County, Honghe Prefecture; and XP: Xinping County, Yuxi City.
3.4. Bacterial Species Composition in Different Sources
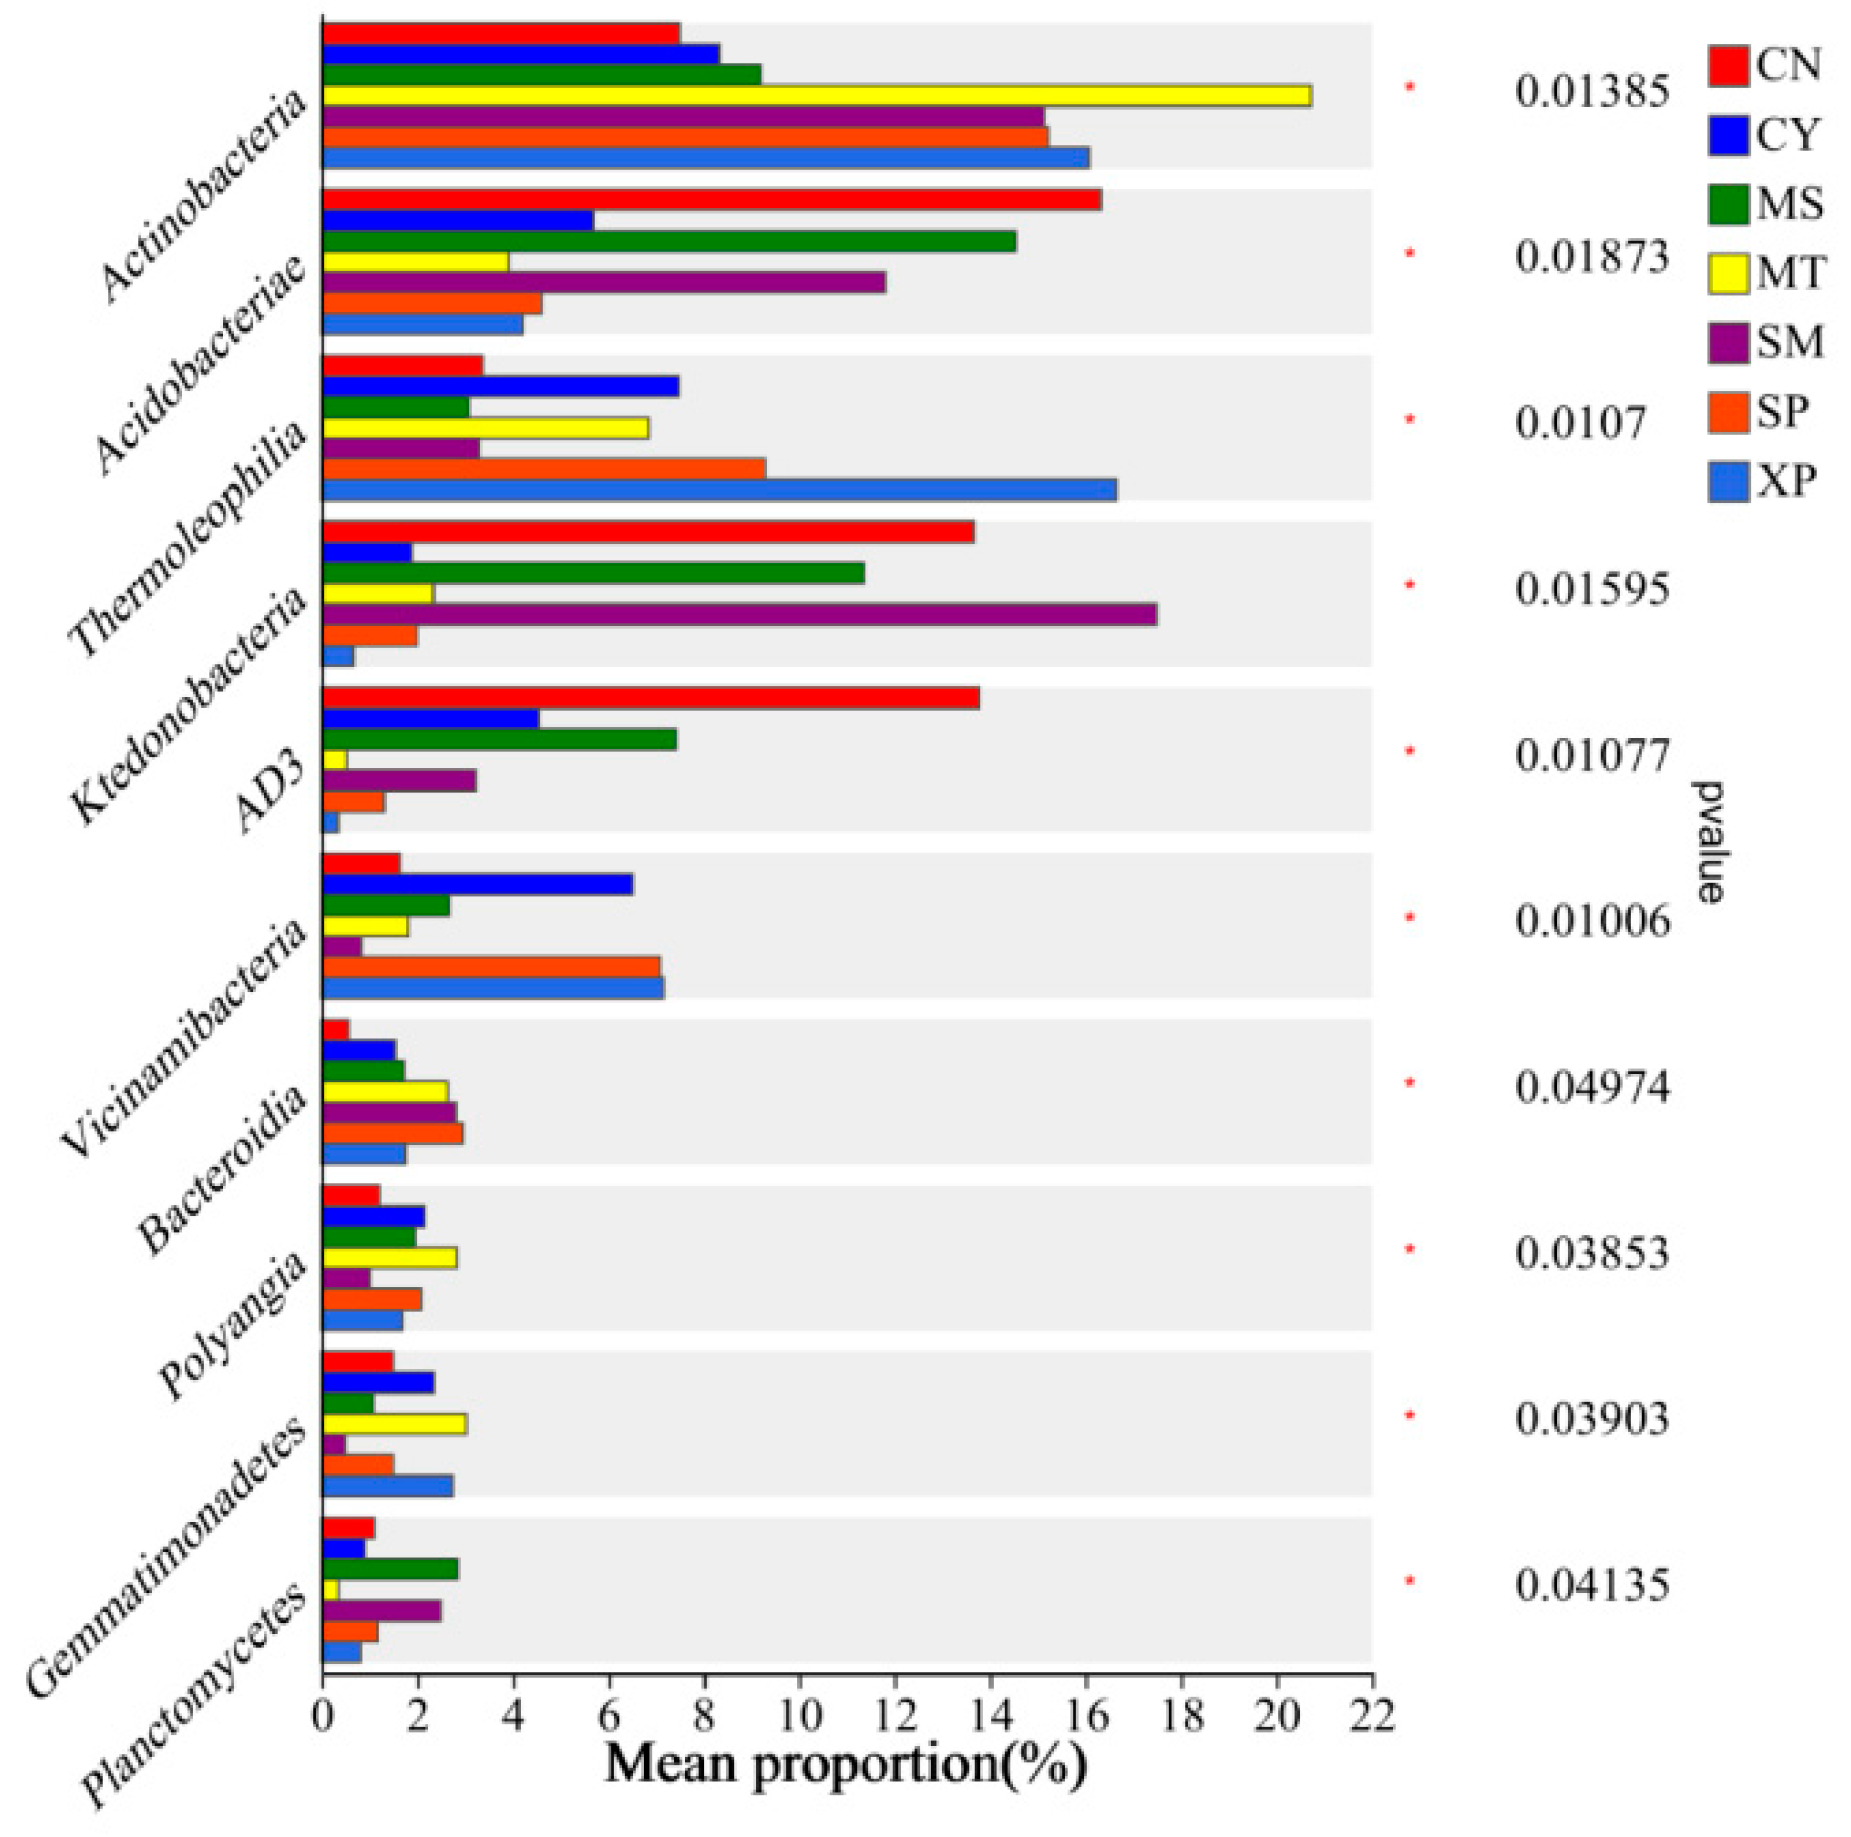
Bacterial groups with significant differences in relative abundance between groups were identified through Wilcoxon tests (Figure 7). Actinobacteria showed significant enrichment in XP soil, Chloroflexi exhibited significant enrichment in CN soil, and Firmicutes displayed significant enrichment in MT soil. At the class level, Actinobacteria showed significant enrichment in MT soil, Acidobacteria demonstrated significant enrichment in CN soil, Thermoleophilia exhibited significant enrichment in XP soil, and Ktedonobacteria showed significant enrichment in SM soil (Figure 8).
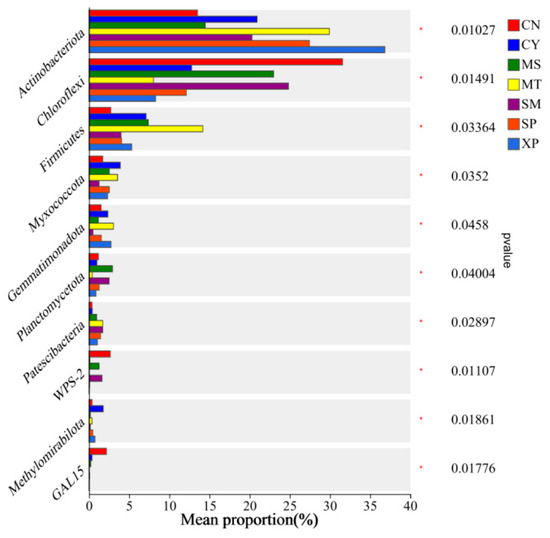
Figure 7.
Intergroup differences in species at the phylum level. CN: Changning County, Baoshan City; CY: Cangyuan County, Lincang City; MS: Mang County, Dehong Prefecture; MT: Matai Township, Linxiang District, Lincang City; SM: Simao District, Pu’er City; SP: Shiping County, Honghe Prefecture; and XP: Xinping County, Yuxi City.
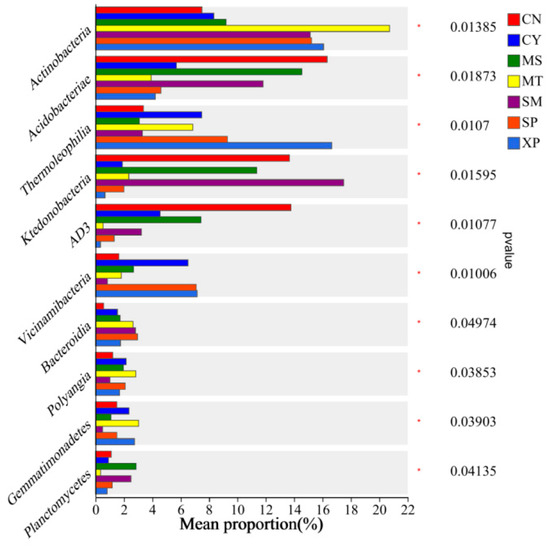
Figure 8.
Intergroup differences in species at the class level. CN: Changning County, Baoshan City; CY: Cangyuan County, Lincang City; MS: Mang County, Dehong Prefecture; MT: Matai Township, Linxiang District, Lincang City; SM: Simao District, Pu’er City; SP: Shiping County, Honghe Prefecture; and XP: Xinping County, Yuxi City.
3.5. Relationship between Soil Factors and Soil Bacterial Communities
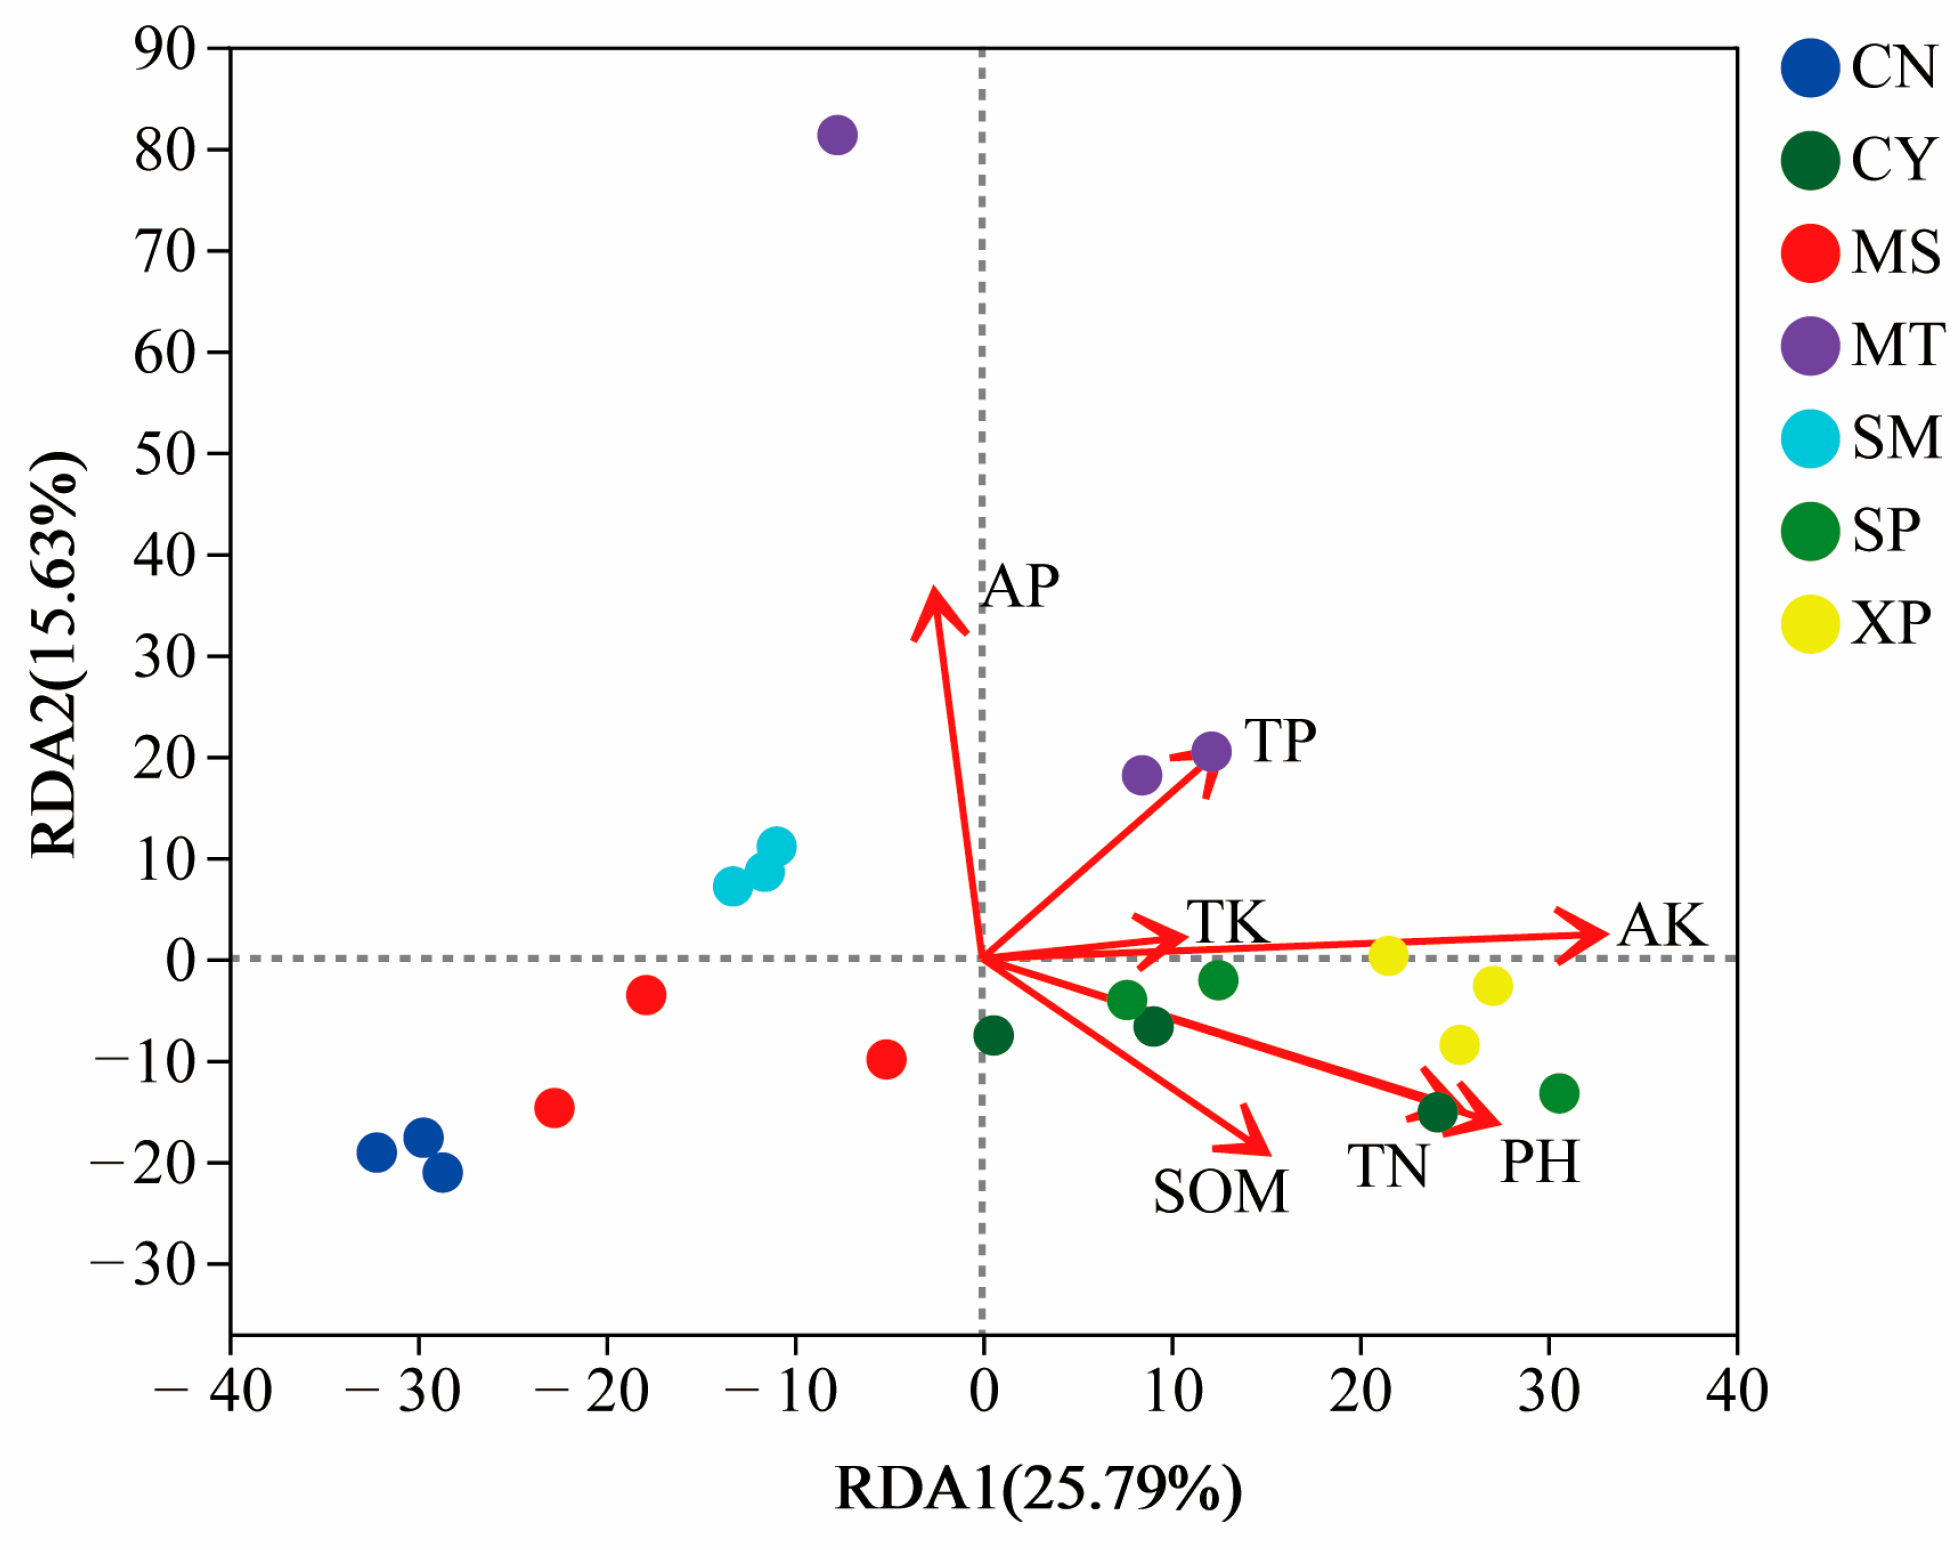
RDA analysis was performed on the bacteria present in the soil samples from the seven geographical provenances to investigate the relationship between soil factors, samples, and microbial communities. The seven chemical indicators of soil measured at the sampling sites (Table 2) were used as environmental factors to correlate with the microbial communities in the samples. The results showed that available potassium (AK), pH, and total nitrogen (TN) contribute significantly to the bacterial communities within the soil (Figure 9). The first ordination axis accounts for 25.79% of the explained variance, while the second axis accounts for 15.63% of the explained variance.

Figure 9.
Redundancy analysis of soil bacteria and soil chemical properties. SOM: soil organic matter; AP: available phosphorus; AK: available potassium; TN: total nitrogen; TP: total phosphorus; TK: total potassium. The length of the arrow connection represents the degree of correlation between the environmental factor and the sample distribution. The longer the connection, the greater the correlation. On the contrary, the shorter the connection, the smaller the correlation. The angle between the arrow connection and the sorting axis, as well as the angle between arrow connections, represents the correlation. An acute angle indicates a positive correlation, while an obtuse angle indicates a negative correlation.
On this basis, the soil environmental factors that significantly affected the bacterial community were further screened, the Pearson correlation coefficient was utilized for analysis, and the related heat map was formed (Figure 10). Methylomirabilota showed a highly significant positive correlation with TN, TP, pH, and SOM (p < 0.01); Gemmatimonadota showed a significant positive correlation with AK, SOM, and pH. (p < 0.05), and significantly positively correlated with TP (p < 0.01); Nitrospira is significantly positively correlated with TN and TP (p < 0.05) and significantly positively correlated with AK (p < 0.01); Firmicutes is significantly positively correlated with TP (p < 0.05); Actinobacteria is significantly positively correlated with AK (p < 0.01); Chloroflexi is significantly negatively correlated with pH, TN, and TP (p < 0.05), and significantly negatively correlated with AK (p < 0.01); Planctomycetota is significantly negatively correlated with pH, SOM, and AK (p < 0.05), and significantly negatively correlated with TP (p < 0.01); Myxomycota is significantly positively correlated with TP (p < 0.01).
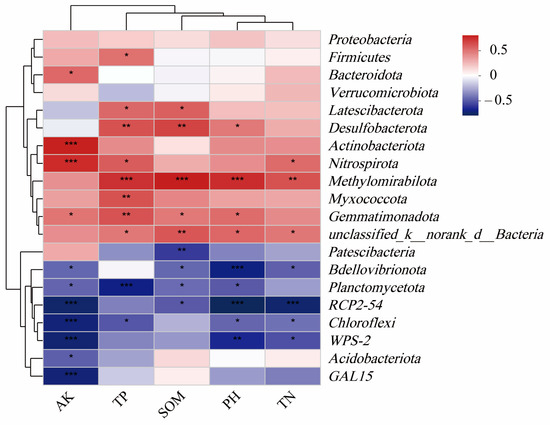
Figure 10.
Correlation heatmap. SOM: soil organic matter; AK: available potassium; TN: total nitrogen; TP: total phosphorus. *** (p < 0.001), ** (p < 0.05) and * (p < 0.01) indicate that there are significant differences between this species and soil factors.
3.6. Prediction of Soil Bacterial Community Function
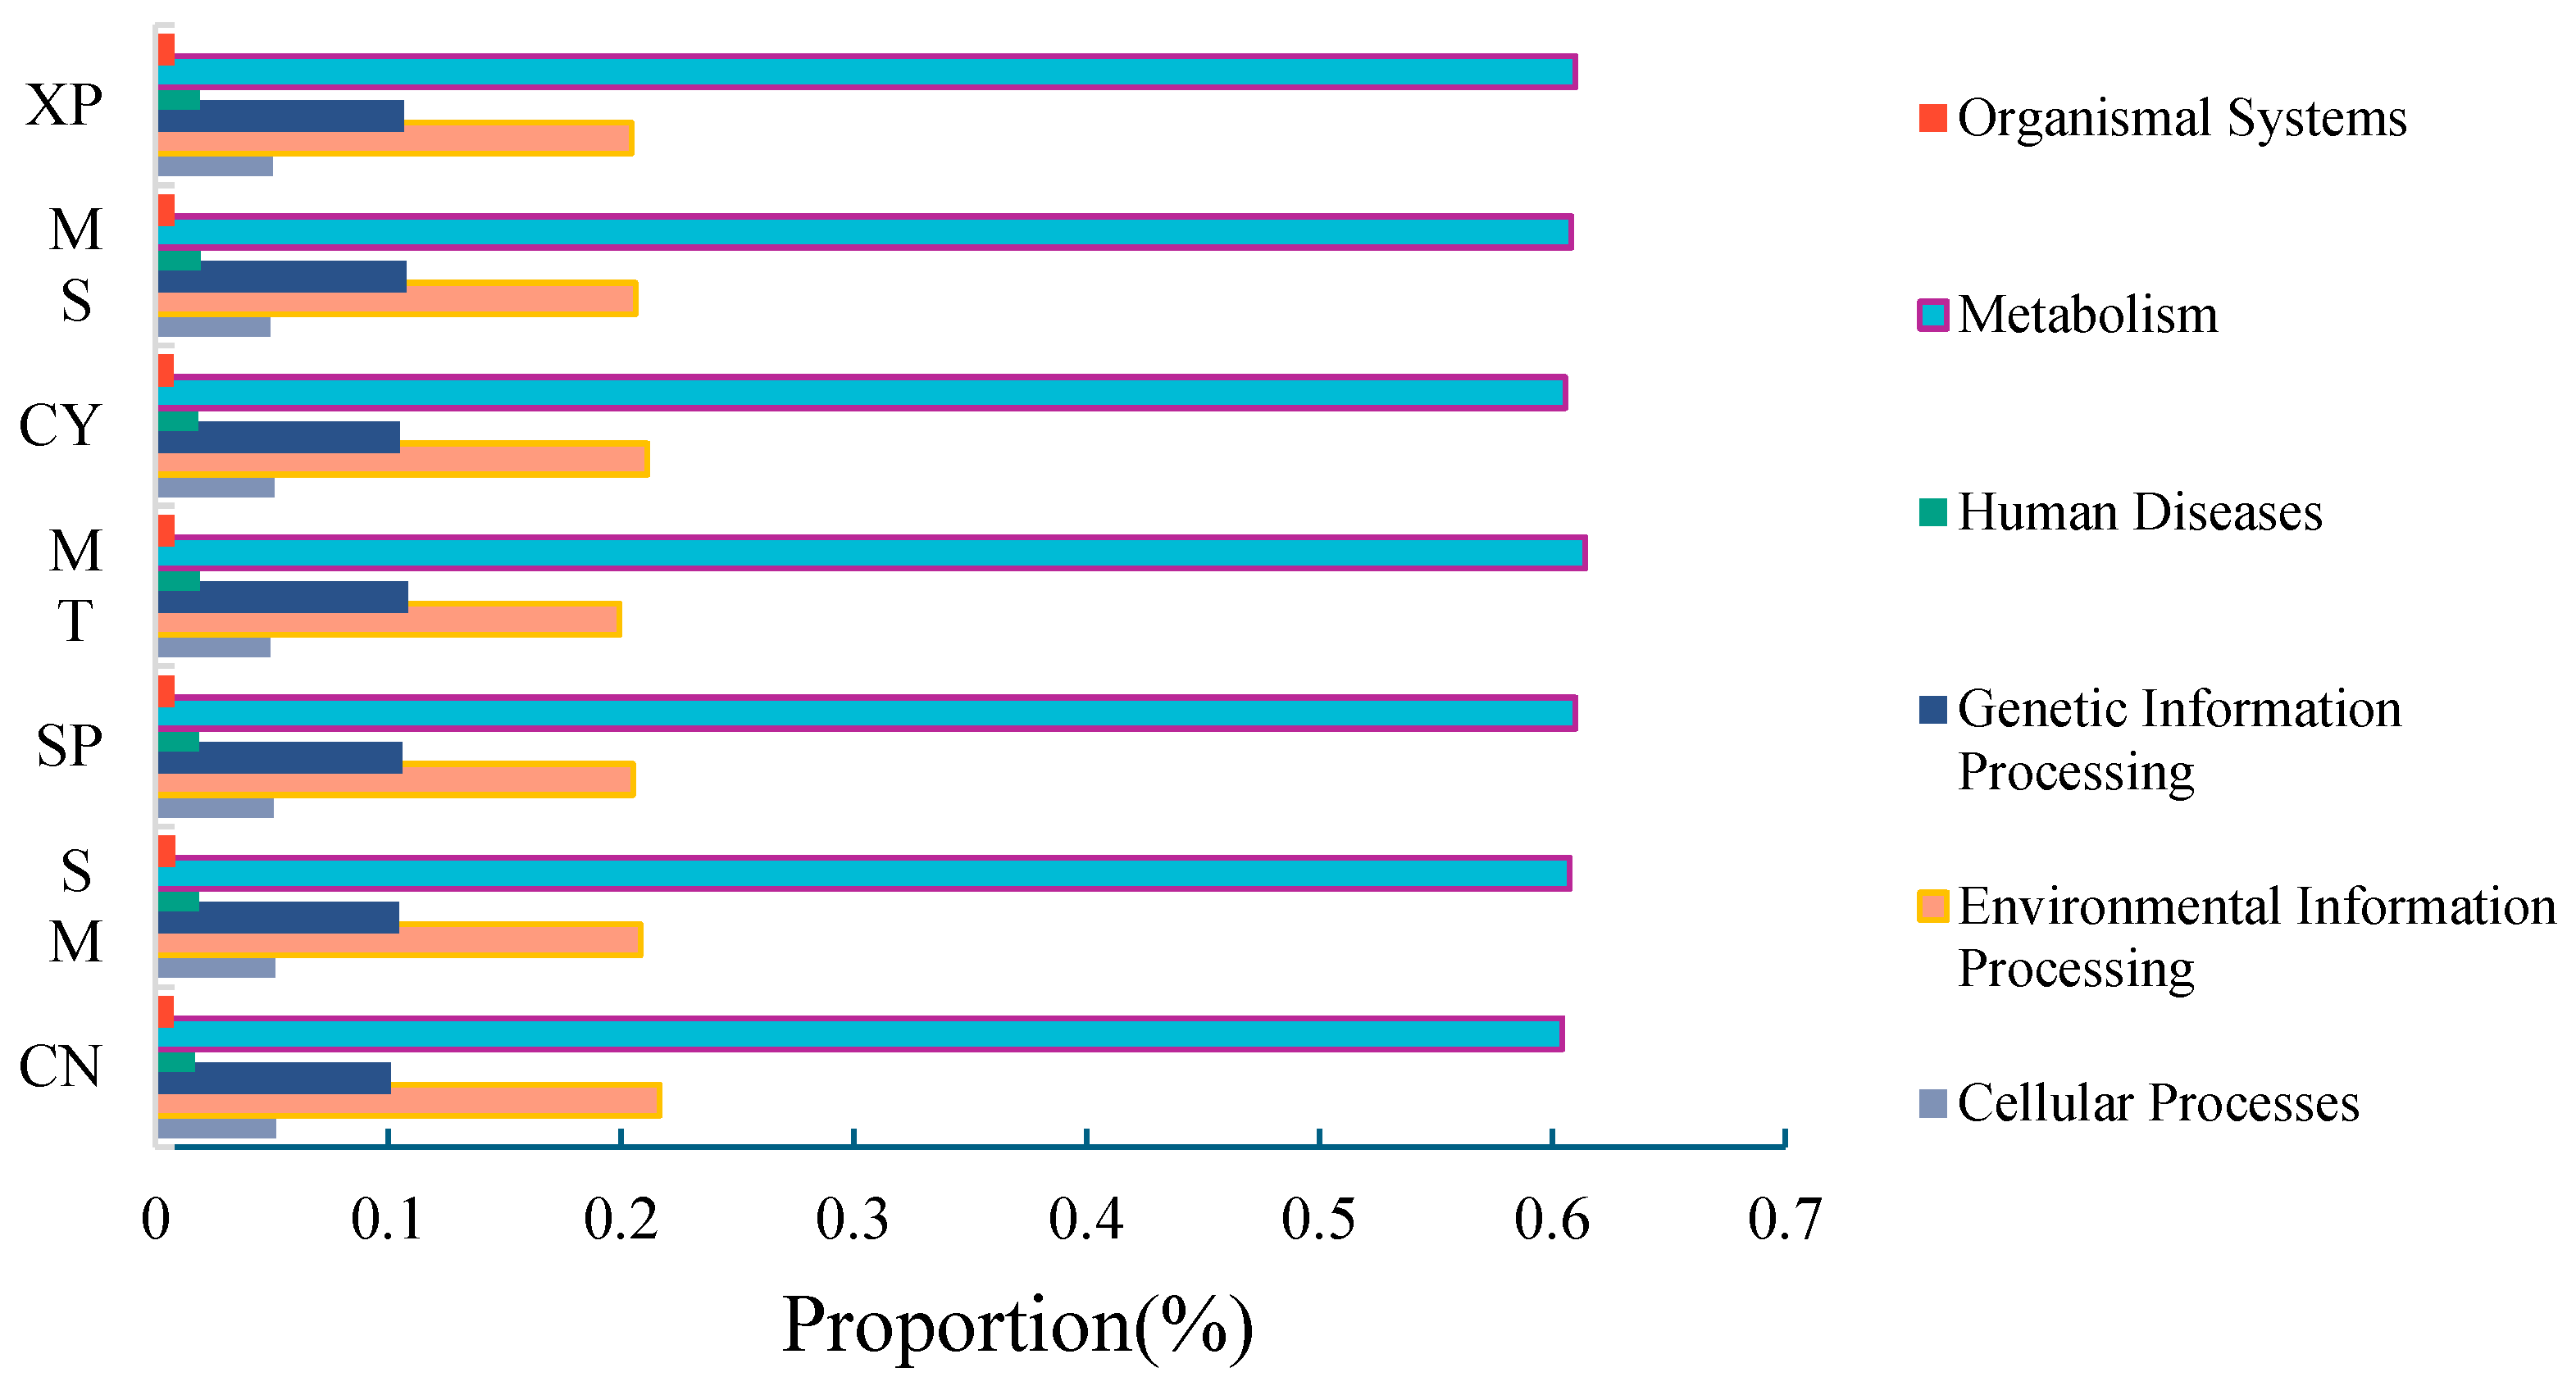
High-throughput sequencing information was compared with the KEGG database (Kyoto Encyclopedia of Genes and Genomes), and Tax4Fun was employed to predict the functions of bacterial communities in the soils of the seven D. brandisii forests. In the primary functional metabolic pathway, metabolism had a relative abundance of 60% in the seven soils (Figure 11), which was significantly higher than environmental information processing, genetic information processing, cellular processes, human diseases, and organic systems. To gain a comprehensive understanding of the functional roles of different bacterial communities, Tax4Fun functional predictions based on the KEGG second-level metabolic pathway data analysis library were used to obtain bacterial metabolic pathways. Among the secondary functional metabolic pathways, 40 subfunctions were identified, with 18 pathways exhibiting a relative abundance greater than 1.0%. The main metabolic functions included carbohydrate metabolism, lipid metabolism, metabolism of cofactors and vitamins, energy metabolism, nucleotide metabolism, and the biosynthesis of other secondary metabolites. Among them, carbohydrate metabolism demonstrated the highest metabolic abundance.
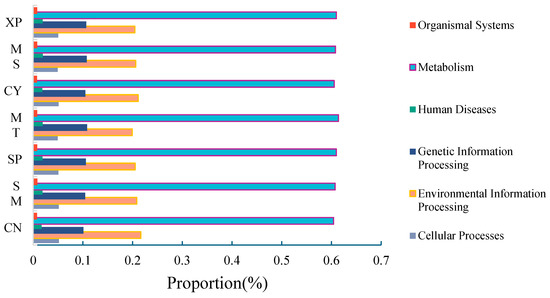
Figure 11.
Primary metabolic functions.
The BugBase tool was used to predict the phenotypes of soil, resulting in the identification of seven categories: oxygen demand (aerobic, anaerobic, and facultative anaerobic), biofilm formation, Gram-positive, Gram-negative, oxidative stress tolerance, mobile elements, and potentially pathogenicity (Table 3). Among the seven phenotypes, anaerobes accounted for the highest proportion, ranging from 63.67% to 84.33%, followed by aerobic bacteria and mobile elements. The relative abundance of aerobes and oxidative stress-tolerant bacteria showed significant differences across all seven regions (p < 0.05), while anaerobes and biofilm formation also showed significant differences in six regions, with the exception of the SM region (p < 0.05). Furthermore, the relative abundance of mobile elements in CY, MS, MT, and SM showed significant differences (p < 0.05). The relative abundance of facultative anaerobes in MS and XP was significant (p < 0.05). The relative abundance of Gram-negative bacteria in CY, MT, and XP showed significant differences (p < 0.05). The phenotypes with higher relative abundance in each region were inconsistent, and among them, aerobic and anaerobic accounted for the highest proportion in CN, potentially pathogenic accounted for the highest proportion in CY, and facultative anaerobic accounted for the highest proportion in MS. The proportion of Gram-negative was the highest in MT, the proportion of mobile elements was the highest in SM, the proportion of Gram-positive was the highest in SP, and the proportion of biofilm formation and oxidative stress tolerance was the highest in XP.
Table 3.
Bugbase phenotype of soil bacterial community.
4. Discussion
4.1. Differences in Soil Bacterial Community Structure among Different Geographical Provenances
In total, 40 phyla, 127 classes, 307 orders, 509 families, and 998 genera were detected in the soil samples from seven regions. The presence of dominant phyla, including Proteobacteria, Actinobacteria, Chloroflexi, and Acidobacteria, was consistent with findings from previous soil sample studies [37,38,39] as well as in large-scale studies of tropical [40,41], subtropical [42,43], temperate [44], and cold temperate forest ecosystems [45]. These phyla have demonstrated their dominance in bacterial communities, indicating their adaptability and regulatory functions in diverse geographical environments. Furthermore, soil bacterial phyla with high relative abundance may help maintain a balance between root nutrient uptake and the microenvironment to improve the soil environment [46].
Although the dominant bacterial communities were similar across the seven regions, there were significant variations in their composition and proportion within each region. Specifically, Proteobacteria and Actinobacteria were the most abundant in SP and XP, respectively. Chloroflexi and Acidobacteria were also the most abundant in CN. Proteobacteria is the most prevalent type of soil bacteria and has been found to include free-living nitrogen-fixing bacteria that contribute to nitrogen, carbon, and phosphorus fixation. These bacteria can participate in the soil nitrogen and phosphorus cycle, thereby improving the soil environment [47]. This suggests that the soil planted with D. brandisii in SP has a strong nitrogen-fixing ability, which may be influenced by the soil texture and parent rock material in SP. The soil has large and porous pores, which provide a conducive environment for the growth and reproduction of microorganisms, leading to increased bacterial abundance [48]. The positive correlation between the relative abundance of Proteobacteria in SP and CY and soil TN can be attributed to the nitrogen-fixing function of most Proteobacteria. However, the relative abundance of Proteobacteria in MT did not correspond proportionally to soil TN, which could be due to the higher soil nutrient levels in MT. As soil nutrients increase, the abundance of eutrophic bacteria increases while the abundance of oligotrophic bacteria decreases [49]. Proteobacteria belong to eutrophic bacteria [50], and their relative abundance increases with high soil nutrient levels. Most Actinobacteria are aerobic and require a well-ventilated environment to reproduce in large numbers. The lower density of fallen leaves in the bamboo forest of XP compared to other regions, coupled with a higher distribution of fine roots in the soil, improves soil aeration, resulting in a higher abundance of Actinobacteria in XP [51]. Chloroflexi, an oligotrophic bacteria type, prefers to inhibit nutrient-poor soils [52]. Accordingly, the content of Chloroflexi in the soils of CN, MS, and SM was lower than that in CY, XP, and SP, which is consistent with its oligotrophic characteristics according to the soil chemical properties in each region. Apart from the lower relative abundance in MT and SM regions, the abundance of Acidobacteria did not differ significantly across the other six regions. Some bacteria in Acidobacteria are sensitive to changes in soil pH [53], and the pH values in the MT and SM regions were lower than in other regions, which has affected the abundance of Acidobacteria.
4.2. Differences in the Response of Soil Bacterial Communities to Environmental Factors among Different Geographical Provenances
Any environmental factors, including vegetation type, altitude, climate, and soil physicochemical properties, have been shown to cause changes in the structure of soil microbial communities to some extent [54,55]. These factors can inhibit, promote, or have no significant effect on soil microbes, playing a crucial role in shaping the composition of soil microbial communities [56,57]. Soil factors have been proven to stimulate the microbial community composition on the regional and continental scale within the soil microenvironment [58,59]. In this study, by screening soil environmental factors that have a greater impact on soil bacterial communities and conducting correlation analysis with the bacterial community at the phylum level, it was found that soil pH, total nitrogen, and available potassium were the main factors affecting the bacterial community. The Firmicutes was significantly positively correlated with total phosphorus (p < 0.05); the Actinobacteria was highly significantly positively correlated with available potassium (p < 0.01); the Chytridiomycota was significantly negatively correlated with pH, organic matter, and available potassium (p < 0.05), and highly significantly negatively correlated with total phosphorus (p < 0.01); the Gemmatimonadetes was significantly positively correlated with available potassium and pH (p < 0.05); the Nitrospirae was significantly positively correlated with total nitrogen (p < 0.05), and highly significantly positively correlated with available potassium (p < 0.01); the Chytridiomycota was significantly negatively correlated with pH and available potassium (p < 0.05). Rousk (2009) [60] proposed that the impact of soil organic matter and physicochemical properties such as nitrogen, phosphorus, and potassium on soil microbial communities is complex, and no definitive consensus has been reached yet.
4.3. Differences in Soil Bacterial Community Function among Different Geographical Provenances
Changes in geographic location and environmental factors not only influence the structure of soil bacterial communities but also lead to variations in functional metabolic pathways and phenotype types of soil bacteria. In this study, the functions of soil bacteria from different geographic sources of D. brandisii were predicted using the KEGG metabolic pathway through PICRUSt. The soil bacteria in different regions were involved in six primary metabolic pathways, including metabolism, environmental information processing, genetic information processing, cellular processes, human diseases, and organic systems, with metabolism exhibiting the highest relative abundance. This indicates that soil bacteria use these six types of primary functional metabolic pathways to maintain the stability of the ecosystem. Metabolism is the core function of the soil bacterial community, playing a crucial role in the growth process of soil bacteria and being less affected by human activities [55,61] (Fang et al. 2017; Liu et al. 2022). It has been found that soil bacteria participate in the cycling and transformation of soil materials through their metabolic activities, thereby promoting plant growth and increasing crop yield. The enhancement in functions such as nitrogen fixation and phosphorus dissolution depends on metabolism to improve root absorption of nitrogen and phosphorus nutrients [62,63,64]. The phenotypic analysis of soil bacteria function predictions in the seven regions revealed significant differences in oxygen requirement, anaerobic, mobile elements, biofilm formation, Gram-negative, oxidative stress, and facultative anaerobic. These differences suggest significant differences in bacterial phenotype predictions in seven regions, which are likely associated with disparities in the soil and other environmental factors in each region. Considering that bacterial species may belong to multiple phenotypes, further research is needed to analyse and predict bacterial BugBase phenotypes.
5. Conclusions
Soil properties and soil bacterial community structure of seven geographic seed sources of Dendrocalamus brandisii had their own characteristics, in which quick-acting potassium (AK), pH, and total nitrogen (TN) were the important factors affecting soil bacterial community structure. The soil bacterial community structure was similar in SP and XP samples, except for the other areas where the differences were more pronounced, and the soil bacterial diversity was higher in CY samples. The dominant groups of soil bacteria in the seven different source sites were Proteobacteria, Actinobacteria, Chloroflexi, and Acidobacteria. At the class level, there were mainly Alphaproteobacteria, Actinobacteria, and Acidobacteria, but all of them differed in composition. Soil bacterial function predictions from the seven regions showed rich functionality, with metabolism showing the highest relative abundance and, in the case of BugBase phenotypes, more pronounced variability.
Author Contributions
Q.C.: Visualization, Investigation, Writing—original draft. M.Z.: Conceptualization Writing—review and editing. N.O.: Conceptualization, Writing—review and editing. Z.X.: Conceptualization, Writing—review and editing. C.H.: Supervision, Funding acquisition, Investigation, Resources, Writing—original draft, Writing—review and editing. W.L.: Funding acquisition, Investigation, Resources, Writing—original draft, Writing—review and editing. S.H.B.: Writing—review & editing, All authors have read and agreed to the published version of the manuscript.
Funding
This study was funded by the National Key Research and Development Project of China (2021YFD2200501), Basic Research Project in Yunnan Province, China (202201AT070053), Agriculture Joint Special Project of Yunnan Province (202301BD070001-123). Monitoring Project of Bamboo Forest Ecosystem Positioning Observation and Research Station in South Yunnan, China (2022–YN–15) and China Scholarship Fund for Studying Abroad (20107855018).
Data Availability Statement
The data that support the findings of this study are available from the corresponding author upon reasonable request.
Acknowledgments
We would like to thank the staff of Southwest Forestry University for providing the research platform and logistics services.
Conflicts of Interest
The authors declare no conflict of interest.
References
- Du, H.Q.; Mao, F.J.; Zhou, G.M.; Li, X.; Xu, X.; Ge, H.; Cui, L.; Liu, Y.; Zhu, D.; Li, Y. Estimating and analyzing the spatiotemporal pattern of aboveground carbon in bamboo forest by combining remote sensing data and improved BIOME-BGC model. IEEE J. Sel. Top. Appl. Earth Obs. Remote Sens. 2018, 11, 1–14. [Google Scholar] [CrossRef]
- Chen, X.G.; Zhang, Y.P.; Zhang, X.Q.; Guo, Y. Carbon stock changes in bamboo stands in China over the last 50 years. Acta Ecol. Sin. 2008, 28, 5218–5227. [Google Scholar]
- Li, X.; Du, H.; Mao, F.; Zhou, G.; Xing, L.; Liu, T.; Han, N.; Liu, E.; Ge, H.; Liu, Y.; et al. Mapping spatiotemporal decisions for sustainable productivity of bamboo forest land. Land Degrad. Dev. 2020, 31, 939–958. [Google Scholar] [CrossRef]
- Hui, C.M.; Liu, W.Y.; Zhang, G.X.; Shi, M.; Lu, D.W.; Zou, X.M. Exploitation and Breeding of Excellent Germplasm Resources of Dendrocalamus brandisii. J. Bamboo 2019, 38, 26–30. [Google Scholar]
- Hui, C.M.; He, X.H.; Liu, W.Y.; Shi, Z.J.; Sun, M.S. Promoting the Development of Dendrocalamus brandisii Industry for Rural Vitalization. World Bamboo Ratt. 2022, 20, 66–69. [Google Scholar]
- Shi, J.S. Preliminary Study on the Environmental Effect and Improvement of Phyllostachys Prominens Bamboo Shoot Quality Formation; Chinese Academy of Forestry Sciences: Beijing, China, 2019. [Google Scholar]
- Han, L. Diversity of Soil Microbial Functions in Roots of Exotic Invasive Plant Oat. Mol. Plant Breed. 2022, 20, 8347–8352. [Google Scholar]
- Xu, W.L.; Tang, G.M.; Ge, C.H.; Wang, X.H.; Liu, Y. Effects of long-term fertilization on diversities of soil microbial community structure and function in grey desert soil of Xinjiang. Ecol. Sin. 2015, 35, 468–477. [Google Scholar]
- Fu, H.; Zeng, Y.H.; Song, Z.L.; Lan, S.R.; Huang, W.C. Soil Microbial Community Structures Under Three Urban Landscape Bamboo Forests. Soils 2022, 54, 1165–1174. [Google Scholar]
- Wang, Y.; Zhang, F.; Marschner, P. Soil pH is the main factor influencing growth and rhizosphere properties of wheat following different pre-crops. Plant Soil 2012, 360, 271–286. [Google Scholar] [CrossRef]
- Rasche, F.; Musyoki, M.K.; R€ohl, C.; Muema, E.K.; Vanlauwe, B.; Cadisch, G. Lasting influence of biochemically contrasting organic inputs on abundance and community structure of total and proteolytic bacteria in tropical soils. Soil Biol. Bioch. 2014, 74, 204–213. [Google Scholar] [CrossRef]
- Schreiter, S.; Ding, G.C.; Heuer, H.; Neumann, G.; Sandmann, M.; Grosch, R.; Kropf, S.; Smalla, K. Effect ofthe soil type on the microbiome in the rhizosphere of field-grown lettuce. Front. Microbiol. 2014, 5, 144. [Google Scholar] [CrossRef]
- Castro, H.F.; Classen, A.T.; Austin, E.E.; Norby, R.J.; Schadt, C.W. Soil microbial community responses to multiple experimental climate change drivers. Appl. Environ. Microbiol. 2010, 76, 999–1007. [Google Scholar] [CrossRef]
- Zhang, Y.; Dong, S.; Gao, Q.; Liu, S.; Ganjurjav, H.; Wang, X.; Su, X.; Wu, X. Soil bacterial and fungal diversity differently correlated with soil biochemistry in alpine grassland ecosystems in response to environmental changes. Sci. Rep. 2017, 7, 43077. [Google Scholar] [CrossRef]
- Koyama, A.; Steinweg, J.M.; Haddix, M.L.; Dukes, J.S.; Wallenstein, M.D. Soil bacterial community responses to altered precipitation and temperature regimes in an old field grassland are mediated by plants. FEMS Microbiol. Ecol. 2018, 94, fix156. [Google Scholar] [CrossRef]
- Ascher, J.; Sartori, G.; Graefe, U.; Thornton, B.; Ceccherini, M.T.; Pietramellara, G.; Egli, M. Are humus forms, mesofauna and microflora in subalpine forest soils sensitiveto thermal conditions. Biol. Fertil. Soils 2012, 48, 709–725. [Google Scholar] [CrossRef]
- Carletti, P.; Vendramin, E.; Pizzeghello, D.; Concheri, G.; Zanella, A.; Nardi, S.; Squartini, A. Soil humic compounds and microbial communities in six spruce forests asfunction of parent material, slope aspect and stand age. Plant Soil 2009, 315, 47–65. [Google Scholar] [CrossRef]
- Liu, Y.; Zhang, L.; Lu, J.; Chen, W.; Wei, G.; Lin, Y. Topography affects the soil conditions and bacterial communities along a restoration gradient on loess-plateau. Appl. Soil Ecol. 2019, 150, 103471. [Google Scholar] [CrossRef]
- Chu, H.; Sun, H.; Tripathi, B.M.; Adams, J.M.; Huang, R.; Zhang, Y.; Shi, Y. Bacterial community dissimilarity between the surface and subsurface soils equals horizontal differences over several kilometers in the western Tibetan Plateau. Environ. Microbiol. 2016, 18, 1523–1533. [Google Scholar] [CrossRef]
- Shi, Y.; Li, Y.; Xiang, X.; Sun, R.; Yang, T.; He, D.; Zhang, K.; Ni, Y.; Zhu, Y.; Adams, J.M.; et al. Spatial scale affects the relative role of stochasticity versus determinism in soil bacterial communities in wheat fields across the North China Plain. Microbiome 2018, 6, 27. [Google Scholar] [CrossRef] [PubMed]
- Chai, X. Spatial variation of the soil bacterial community in major apple producing regions of China. J. Appl. Microbiol. 2020, 130, 1294–1306. [Google Scholar] [CrossRef]
- Guo, Y.; Chen, X.; Wu, Y.; Zhang, L.; Cheng, J.; Wei, G.; Lin, Y. Natural re-vegetation of a semiarid habitat alters taxonomic and functional diversity of soil microbial communities. Sci. Total Environ. 2018, 635, 598–606. [Google Scholar] [CrossRef]
- Jiao, S.; Du, N.; Zai, X.; Gao, X.; Chen, W.; Wei, G. Temporal dynamics of soil bacterial communities and multifunctionality are more sensitive to introduced plants than to microbial additions in a multicontaminated soil. Land Degrad. Dev. 2019, 30, 852–865. [Google Scholar] [CrossRef]
- Deng, Q.; McMahon, D.E.; Xiang, Y.Z.; Yu, C.; Jackson, R.B.; Hui, D. A global meta-analysis of soil phosphorus dynamics after afforestation. New Phytol. 2017, 213, 181–192. [Google Scholar] [CrossRef] [PubMed]
- Pei, J.L.; Li, P.C.; Wang, Q. Comparison of Bamboo Shoot Nutrients of Dendrocalamus brandisii among Different Provenances. J. Northwest For. Univ. 2018, 33, 156–161. [Google Scholar]
- Liu, W.Y.; Wang, F.; Sun, Y.M.; Yang, L.; Chen, H.; Liu, W.; Zhu, B.; Hui, C.; Wang, S. Influence of dragon bamboo with different planting patterns on microbial community and physicochemical property of soil on sunny and shady slopes. J. Microbiol. 2020, 58, 906–914. [Google Scholar] [CrossRef]
- Li, B.; Chen, Y.P.; Liu, Q.; Hu, S.; Chen, X. Complete genome analysis of Sulfobacillus acidophilus strain TPY, isolated from a hydrothermal vent in the Pacifc Ocean. J. Bacteriol. 2011, 193, 5555–5556. [Google Scholar] [CrossRef] [PubMed]
- Bao, S.D. Soil and Agricultural Chemistry Analysis; China Agriculture Press: Beijing, China, 2000. [Google Scholar]
- Zhang, X.P.; Zhong, Z.K.; Bian, F.Y.; Yang, C. Effects of composted bamboo residue amendments on soil microbial communities in an intensively managed bamboo (Phyllostachys praecox) plantation. Appl. Soil Ecol. 2019, 136, 178–183. [Google Scholar] [CrossRef]
- Zhang, X.P.; Gao, G.B.; Wu, Z.Z.; Wen, X.; Zhong, H.; Zhong, Z.; Yang, C.; Bian, F.; Gai, X. Responses of soil nutrients and microbial communities to intercropping medicinal plants in moso bamboo plantations in subtropical China. Environ. Sci. Pollut. Res. Int. 2020, 27, 2301–2310. [Google Scholar] [CrossRef] [PubMed]
- Wu, L.K.; Li, Z.F.; Li, J.; Khan, M.A.; Huang, W.; Zhang, Z.; Lin, W. Assessment of shifts in microbial community structure and catabolic diversity in response to Rehmannia glutinosa monoculture. Appl. Soil Ecol. 2013, 67, 1–9. [Google Scholar] [CrossRef]
- He, D.; Shen, W.; Eberwein, J.; Zhao, Q.; Ren, L.; Wu, Q.L. Diversity and co-occurrence network of soil fungi are more responsive than those of bacteria to shifts in precipitation seasonality in a subtropical forest. Soil Biol. Biochem. 2017, 115, 499–510. [Google Scholar] [CrossRef]
- Liu, S.; Li, P.; Van Zwieten, L.; Tu, J.; Gan, W.; Lu, S.; Wang, H.; Wu, L. Edaphic variables influence soil bacterial structure under successive fertilization of Paulownia plantation substituting native vegetation. J. Soils Sediments 2021, 21, 2922–2937. [Google Scholar] [CrossRef]
- Chen, S.; Zhou, Y.; Chen, Y.; Gu, J. Fastp: An ultra-fast all-in-one FASTQ preprocessor. Bioinformatics 2018, 34, i884–i890. [Google Scholar] [CrossRef] [PubMed]
- Magoč, T.; Salzberg, S.L. FLASH: Fast length adjustment of short reads to improve genome assemblies. Bioinformatics 2011, 27, 2957–2963. [Google Scholar] [CrossRef]
- Douglas, G.M.; Maffei, V.J.; Zaneveld, J.R.; Yurgel, S.N.; Brown, J.R.; Taylor, C.M.; Huttenhower, C.; Langille, M.G.I. PICRUSt2 for prediction of metagenome functions. Nat. Biotechnol. 2020, 38, 685–688. [Google Scholar] [CrossRef]
- Nan, Z.W.; Liu, Z.; Dai, H.C.; Zhang, L.; Wang, N.; Xu, J.; Liu, K.-C.; Meng, W.-W.; Wang, X.-Q. Characteristics of Bacterial Community Structure in Fluvo-aquic Soil under Different Rotation Fallow. Environ. Sci. 2021, 42, 4977–4987. [Google Scholar]
- Li, S.; Wu, F.Z. Diversity and co-occurrence patterns of soil bacterial and fungal communities in seven intercropping systems. Front. Microbiol. 2018, 9, 1521. [Google Scholar] [CrossRef]
- Gong, X.W.; Liu, C.J.; Li, J.; Luo, Y.; Yang, Q.; Zhang, W.; Yang, P.; Feng, B. Responses of rhizosphere soil properties, enzyme activities and microbial diversity to intercropping patterns on the Loess Plateau of China. Soil Tillage Res. 2019, 195, 104355. [Google Scholar] [CrossRef]
- Mcgee, K.M.; Eaton, W.D.; Shokralla, S.; Hajibabaei, M. Determinants of soil bacterial and fungal community composition toward carbon-use efficiency across primary and secondary forests in a Costa Rican conservation area. Microb. Ecol. 2018, 77, 148–167. [Google Scholar] [CrossRef]
- Cabugao, K.G.; Timm, C.M.; Carrell, A.A.; Childs, J.; Lu, T.Y.S.; Pelletier, D.A.; Weston, D.J.; Norby, R.J. Root and rhizosphere bacterial phosphatase activity varies with tree species and soil phosphorus availability in PuertRico tropical forest. Front. Plant Sci. 2017, 8, 1834. [Google Scholar] [CrossRef]
- Meng, M.J.; Lin, J.; Guo, X.P.; Liu, X.; Wu, J.; Zhao, Y.; Zhang, J. Impacts of forest conversion on soil bacterial community composition and diversity in subtropical forests. Catena 2019, 175, 167–173. [Google Scholar] [CrossRef]
- Lin, Y.T.; Whitman, W.B.; Coleman, D.C.; Chiu, C.-Y. Effects of reforestation on the structure and diversity of bacterial communities in subtropical low mountain forest soils. Front. Microbiol. 2018, 9, 1968. [Google Scholar] [CrossRef]
- Ren, C.J.; Zhang, W.; Zhong, Z.K.; Han, X.; Yang, G.; Feng, Y.; Ren, G. Differential responses of soil microbial biomass, diversity, and compositionsto altitudinal gradients depend on plant and soil characteristics. Sci. Total Environ. 2018, 610–611, 750–758. [Google Scholar] [CrossRef] [PubMed]
- Li, M.; Hao, W. Acterial community structures in the root-associated soil of four tree species in the Greater Xing’an Mountains. Chin. J. Ecol. 2021, 40, 2057–2066. [Google Scholar]
- Dai, L.X.; Xu, X.; Zhang, K.C.; Shi, X.L.; Qin, F.F.; Ding, H.; Zhang, Z.M. Response of rhizosphere bacterial community diversity to salt stress in peanut. J. Crop Sci. 2021, 47, 1581–1592. [Google Scholar]
- Gonzalez-Pimentel, J.L.; Miller, A.Z.; Jurado, V.; Laiz, L.; Pereira, M.F.C.; Saiz-Jimenez, C. Yellow coloured mats from lava tubes of La Palma (Canary Islands, Spain) are dominated by metabolically active Actinobacteria. Sci. Rep. 2018, 8, 1944. [Google Scholar] [CrossRef]
- Lin, B.S.; Fan, J.L.; Song, Z.Z.; Zhang, L.L.; Zhang, Y.L.; Lin, Z.X. Endophytic diazotrophs composition of Pennisetum sp. at different growth stages. Microbiol. Chan 2018, 45, 1479–1490. [Google Scholar]
- Fierer, N.; Bradford, M.A.; Jackson, R.B. Toward an ecological classification of soil bacteria. Ecology 2007, 88, 1354–1364. [Google Scholar] [CrossRef] [PubMed]
- Karimi, B.; Terrat, S.; Dequiedt, S.; Saby, N.P.A.; Horrigue, W.; Lelièvre, M.; Nowak, V.; Jolivet, C.; Arrouays, D.; Wincker, P.; et al. Biogeography of soil bacteria and archaea across. Fr. Sci. Adv. 2018, 4, eaat1808. [Google Scholar] [CrossRef] [PubMed]
- Wang, Y.; Ding, G.D.; Liu, M.J.; Gao, G.; Yu, M.; Li, X. Influence of Different Vegetation Types on Soil Microbial Characteristics of Typical Forest Land in Yulin Sandy Area. Chin. J. Soil Sci. 2022, 53, 907–918. [Google Scholar]
- Zhang, Y.; Cong, J.; Lu, H.; Li, G.; Qu, Y.; Su, X.; Zhou, J.; Li, D. Community structure and elevational diversity patterns of soil Acidobacteria. J. Environ. Sci. 2014, 26, 1717–1724. [Google Scholar] [CrossRef]
- Xian, W.D.; Zhang, X.T.; Li, W.J. Microbiological Technology and Microbial Ecology Theory. Acta Microbiol. Sin. 2020, 60, 1801–1820. [Google Scholar]
- Burns, R.G.; Deforest, J.L.; Marxsen, J.; Sinsabaugh, R.L.; Stromberger, M.E.; Wallenstein, M.D.; Weintraub, M.N.; Zoppini, A. Soil enzymes in a changing environment: Current knowledge and future directions. Soil Biol. Biochem. 2013, 58, 216–234. [Google Scholar] [CrossRef]
- Fang, Y.; Wang, W.; Yao, X.D.; Peng, X. Soil microbial community composition and environmental controls in northern temperate steppe of China. Acta Sci. Nat. Univ. Pekin. 2017, 53, 142–150. [Google Scholar]
- Wang, L.D.; Wu, C.R.; Song, D.C.; Wang, J.; He, H.; Guo, C.; Wang, F. Affecting factors of soil microorganisms and their research prospects. Front. Environ. Microbiol. 2021, 7, 74–79. [Google Scholar]
- Bahram, M.; Hildebrand, F.; Forslund, S.K.; Anderson, J.L.; Soudzilovskaia, N.A.; Bodegom, P.M.; Bengtsson-Palme, J.; Anslan, S.; Coelho, L.P.; Harend, H.; et al. Structure and function of the global topsoil microbiome. Nature 2018, 560, 233–237. [Google Scholar] [CrossRef]
- Yao, B.; Wei, X.W.; Liu, H.W.; Zhou, L.L.; Shang, H. Effects of Soil pH Regulators on Soil Microbial Biomass in Atrazine-contaminated Soil by Dendroremediation of Poplar. Sci. Technol. 2011, 34, 105–109. [Google Scholar]
- Peng, Y.J.; Cui, X.Y.; Shao, Y.Y. Characteristic of soil fertility, leaf mineral nutrients and bacterial community in Shatian pomelo orchards of different tree age. J. Agric. Sci. 2021, 37, 348–354. [Google Scholar]
- Rousk, J.; Brookes, P.C.; Bååth, E. Contrasting Soil pH Effects on Fungal and Bacterial Growth Suggest Functional Redundancy in Carbon Mineralization. Appl. Environ. Microbiol. 2009, 75, 1589–1596. [Google Scholar] [CrossRef]
- Liu, K.H.; Xue, Y.Q.; Zhu, L.P.; Xu, F.; Zhu, Z.-H.; Zhang, T.; Zhang, F.-B. Effect of Different Land Use Types on the Diversity of Soil Bacterial Community in the Coastal Zone of Jialing River. Environ. Sci. 2022, 43, 1620–1629. [Google Scholar]
- Ding, Y.P.; Du, Y.J.; Gao, G.L.; Zhang, Y.; Cao, H.Y.; Zhu, B.B.; Yang, S.Y.; Zhang, J.X.; Qiu, Y.; Liu, H.L. Soil bacterial community structure and functional prediction of Pinus sylvestris var mongolica plantations in the Hulun Buir Sandy land. Acta Ecol. Sin. 2021, 41, 4131–4139. [Google Scholar]
- van der Heijden, M.G.; Wagg, C. Soil microbial diversity and agroecosystem functioning. Plant Soil 2013, 363, 345–356. [Google Scholar] [CrossRef]
- He, Y.; Ding, N.; Shi, J.C.; Wu, M.; Liao, H.; Xu, J. Profiling of microbial PLFAs: Implication for interspecific interactions due to intercropping which increase phosphorus uptake in phosphorus limited acidic soils. Soil Biol. Biochem. 2013, 57, 625–634. [Google Scholar] [CrossRef]


Disclaimer/Publisher’s Note: The statements, opinions and data contained in all publications are solely those of the individual author(s) and contributor(s) and not of MDPI and/or the editor(s). MDPI and/or the editor(s) disclaim responsibility for any injury to people or property resulting from any ideas, methods, instructions or products referred to in the content. |
© 2024 by the authors. Licensee MDPI, Basel, Switzerland. This article is an open access article distributed under the terms and conditions of the Creative Commons Attribution (CC BY) license (https://creativecommons.org/licenses/by/4.0/).