Article

Evaluation of the Effects of Recent Weather Variations on Winter-Wheat Agronomic Characteristics, and Their Correlations in Jinju, Republic of Korea

1
Crop Science Division, Gyeongsangnam-do Agricultural Research and Extension Services, Jinju 52733, Republic of Korea
2
Crop Production & Physiology Division, National Institute of Crop Science, Wanju 55365, Republic of Korea
3
Department of Smart Agro-Industry, Gyeongsang National University, Jinju 52725, Republic of Korea
*
Authors to whom correspondence should be addressed.
Agronomy 2024, 14(9), 2017; https://doi.org/10.3390/agronomy14092017
Submission received: 25 July 2024 / Revised: 15 August 2024 / Accepted: 27 August 2024 / Published: 4 September 2024
(This article belongs to the Section Agroecology Innovation: Achieving System Resilience)

Abstract

:
Wheat grain productivity is different from year to year because growing environments are highly seasonally variable as a result of climate change. This study analyzed the variation in the weather conditions in the 2010–2023 growing seasons and evaluated the crop developmental phase, yield-related components, and the correlations of the variables in the southern plain of South Korea, measuring agronomic traits, including the above-ground dry weight, young-panicle length, spike number per m2, number of grains per spike, thousand-grain weight, and grain yield. The number of days in the heading and ripening phase showed less differences than the other growth phases. The thousand-grain weight showed low variations over the fourteen years observed, unlike the number of grains per spike, the marketable grain yield, and the straw yield, with comparatively high variations. The grain yield was negatively correlated with the average air temperature during the winter dormancy phase (R = −0.687, p = 0.007) and precipitation (R = −0.726, p = 0.003), but showed positive associations with the number of days in the winter dormancy phase (R = 0.597, p = 0.024) and the number of grains per spike (R = 0.809, p = 0.000). In conclusion, longer winter dormancy and a longer tillering phase delay young-panicle development but increase the number of spikes and the number of grains per spike, resulting in a higher wheat grain yield in Southern Korean weather conditions.

1. Introduction

In 2022, wheat (Triticum aestivum L.) ranked second among cereal crops globally, totaling 946 million mega grams (Mg) in 243 million hectares [1], 4.65 million Mg of which were consumed in the Republic of Korea, with 2.54 and 2.08 million Mg for human and animal consumption, respectively [2]. The annual wheat demand has averaged 4.00 million Mg since the mid-1980s. However, the country produced only 35 thousand Mg in 2022, responsible for 0.7% of the total demand. Wheat production in the country has rapidly decreased since the 1970s, mainly due to mass import as credit assistance from the United States [3]. In recent years, food self-sufficiency, sovereignty, and security have become important issues in the country. In addition, because of a decrease in rice consumption and overproduction, the government currently demands farmers to alternate other crops, such as soybean, forage crop, and wheat, to rice in paddy soil, with strategic direct payments.
Wheat or barley is typically produced in the double-cropping system, followed by rice, in the Southern Republic of Korea. Rice is transplanted from May to June and harvested in October, while winter wheat is sown from October to November and harvested in June. Farmers willingly choose early-maturing rice cultivars to plant overwintering field vegetables, such as garlic or bulb onions, but prefer late-maturing rice cultivars before planting wheat due to income differences. Thus, late-wheat-seed sowing often results in the poor establishment, especially in poor environmental conditions, such as frequent rainfall or cold temperatures in early winter. In addition, wheat breeding has focused on early maturity and high yields [4].
Climate change in South Korea and East Asia is characterized by an increase in the annual average temperature [5,6] and in the frequencies of extreme temperatures or rainfall events [7,8]. There are several climate change-related physiological disorders in winter wheat, affected by high temperatures or drought during the anthesis and ripening phases [9,10,11,12], winter or early spring warming [13,14,15], temporary frost or cold in the spring [16,17], and frequent rains during grain filling [18,19].
Heat stress and high temperatures during the reproductive or flowering phase are among the most concerning issues in temperate regions, as they can reduce wheat grain number and size, seriously influencing the yield [20,21,22,23]. Heat stress during anthesis increases floret abortion and causes pollen sterility, tissue dehydration, and lower assimilation [24]. In addition, elevated temperatures shorten assimilate translocation and grain filling duration [25,26,27].
During the last several decades, low temperatures have caused serious wheat production losses in Australia, the United States, Europe, and China [17,28,29,30]. Post-head-emergence frost frequently occurs in Australia, contributing to yield reduction [28,31], while frosts often occur before head emergence in China [17,32]. A previous study [33] hypothesized that mild winters and warm, early springs may induce premature plant development, resulting in the exposure of vulnerable plant tissues and organs to subsequent late-season frosts. In Korea, winter cereal crop cold or frost injuries in the early spring frequently occur, but are rarely reported [16].
Wheat grain productivity is different from year to year because growing environments are highly seasonally variable in terms of temperature and rainfall. Indeed, grain yield is the result of the growth and development of yield components during the growing season, influenced by environmental factors, genetic and physiological controls, and evolutionary constraints [34,35]. The role of grain number per unit area, comprising spike number per unit area and grain number per spike, and single-grain weight as the main components for determining cereal grain yield is somewhat controversial. While genetic progress in grain yield has been mainly achieved via increases in the grain number per unit area [36,37,38] and grain weight [39,40], the former is highly responsive to favorable growth conditions and dominates the latter, representing the main component determining grain yield [41]. This is attributed to the plasticity of seed number in relation to resource availability compared to seed size [42].
This study aimed to analyze the characteristics of variations in the daily average, maximum and minimum air temperatures, precipitation, and sunshine hours during the winter-wheat-crop growing seasons from 2010 to 2023, in Jinju, in the southern province of Gyeongsang. We evaluated the changes in the period of each developmental phase and yield-related components, and analyzed the between-variable correlations, providing insights into managing winter-wheat cropping in climates and cropping regions similar to the southern plain in South Korea.

2. Materials and Methods

2.1. Description of the Experimental Field Site

The experiment was conducted at Gyeongsangnam-do Agricultural Research and Extension Services, located in Chojeon-dong 874, Jinju, Gyeongsangnam-do, Republic of Korea (35°20′56″ N, 128°11′74″ E), with a warm temperate continental monsoon climate, in the 2010–2023 growing seasons. The experimental sites have been under a continuous rice–wheat rotation system for approximately forty years. The soil type was silt loam in the surface soil and silty clay loam in the subsoil. The soil was of the inceptisol order and moderately well drained, with 2021 pre-plant chemical properties of 7.0 pH, 29.0 g kg−1 organic matter, 1.57 g kg−1 nitrogen, 83.7 mg kg−1 available phosphorus, and 0.23 cmolc kg−1 exchangeable potassium.

2.2. Description of the Field Experiment

This long-term field trial was established in 2010 to analyze the effects of weather conditions on winter wheat’s agronomic traits under rainfed conditions. A randomized, complete, block experimental design was used, with two wheat cultivars and three replications. Wheat seeds cvs. Geumgang and Jokyong were sown by hand in late October to early November, followed by molding with a ridging machine, resulting in beds of 1.50 m from center to center between adjacent ones with a bed width of 1.10 m, a height of 0.20 m, and a plant density of 16.0 g per m2. The cvs. Geumgang (cv. Geuru sibling x Gwandong75) and Jokyong (Seri82 x cv. Geumgang) were registered new cultivars on 1 May 2000 and 18 April 2007, respectively, and supplied to growers as seeds certificated by the government.
The nitrogen rate adopted in the experiment was 76 kg ha−1, with 40% and 60% for basal and additional applications, respectively. Phosphate and potassium at 73 kg ha−1 P2O5 and 31 kg ha−1 K2O rates, respectively, were applied once before sowing. Butachlor was applied to control weeds one day after sowing, at 30.0 kg ha−1. Thifensulfuron-methyl was used at 70 g ha−1 (58.5 g 1000 kg−1 liquid) in early spring to control the grassy weeds that germinated in winter. Pesticides were not applied due to no serious pathogen or insect problems.

2.3. Crop Phenology and Wheat Agronomic Traits

Crop development is the progression of a plant’s lifecycle, independent of the biomass accumulation-related growth. Our measurements of growth and development referred to the methods by Feekes [43], Hay and Kirby [44], Hyles et al. [45], Wang et al. [46], and Zadoks et al. [47], recording the timing of six wheat growth stages each year: the sowing date, winter dormancy onset (the first day of an average daily air temperature of zero or under zero degrees for five consecutive days), green-up (the start of regrowth in the spring, after dormancy, when new leaves and roots measure more than 1.0 cm and 0.2 cm, respectively), maximum tillering, heading (40% heading), and maturity (physiological maturity, when the flag leaf and spikes turn yellow). The crop growth period was, therefore, divided into five phases—germination and seedling growth (sowing to winter dormancy onset), winter dormancy (winter dormancy onset to green-up), tillering (green-up to maximum tillering), stem elongation (maximum tillering or jointing to heading), and heading and ripening (heading to maturity)—referencing the classification of Choi et al. [48] and He et al. [49].
Winter wheat’s phenological date is different to that of spring wheat due to the former’s overwintering processes. Tillers can be formed at multiple nodes on the main stem, and secondary and tertiary tillers can form from nodes on the tillers themselves [50,51]. Because tillers develop from the three-leaf stage to jointing (Zadoks13–30) [50], tillers in winter wheat can form prior to winter dormancy onset, during dormancy, or after green-up, which is controlled by the environment during tiller development [52]. We defined the tillering phase as the period ranging from green-up to the maximum tiller stage, according to Choi et al. [48].
The above-ground dry weight per m2 was recorded after drying the whole plant above the surface at 70 °C for at least 72 h. The young-panicle length was measured with a magnifier, and the yield-related components were measured according to Kwon et al.’s standard method [53]. The number of spikes per 0.10 m × 1.50 m unit area was counted during the ripening phase, and the number of grains per spike was counted, using twenty representative spikes, on the same date. The wheat crop was harvested at full maturity using a sickle in 1.50 m × 2.20 m plots, put in a mesh bag, and dried in a plastic greenhouse for approximately one month. The wheat straw was removed using a thresher, while grain hull, awns, and other particles were removed with a screener. Immature grains were sorted using a 2 mm mesh sieve. The grain yield was adjusted to a 14% moisture content.

2.4. Meteorological Data

Meteorological data, such as the average, maximum, and minimum daily air temperature, rainfall, and sunshine hours during wheat production, were obtained from annual reports from regional weather stations in Jinju (35°66′42″ N, 128°04′02″ E, 29 m altitude), operated by the Korea Meteorological Administration [54]. The distance between the experimental site and the weather station was 4.75 km in a straight line. The meteorological data were processed at 10 d intervals, and the average, maximum, and minimum daily air temperatures, precipitation, and sunshine hours per day in each growth period, over five different developmental phases, were calculated from the average value for the investigated fourteen years.

2.5. Statistical Analysis

Statistical analyses were performed using XLSTAT Pro 2013.1.01 (Addinsoft, New York, NY, USA). A correlation analysis was performed to determine the relationship between each growth stage, the growth characteristics, the yield-related traits, and the yield of winter wheat. A principal component analysis (PCA) was conducted to investigate the difference in the relationships among the properties, as affected by 14 variables over 14 years.

3. Results and Discussion

3.1. Trends of Weather Conditions

The average, maximum, and minimum daily air temperatures of 10 d intervals ranging from mid-November to late May in the 2010–2014, 2015–2019, and 2020–2023 growing seasons are shown in Figure 1. The average daily temperature during the whole growth cycle was 1.2 °C, 0.4 °C higher in 2020–2023 than in 2010–2014 and 2015–2019. The average temperature rose more during the stem elongation phase (from late March to mid-April) than during the other growth phases, measuring 1.9 °C higher in 2020–2023 than in 2010–2014. The maximum daily air temperature increased more during the tillering (mid-February to mid-March) and stem elongation phases than during the other phases, while the minimum temperature increased the most during the winter dormancy phase (late December to early February).
The precipitation amount during the whole growth cycle was 450.8 mm in 2020–2023, which was 121.8 mm and 72.1 mm lower than in 2010–2014 and 2015–2019, respectively (Figure 2). There were increases in precipitation during the winter dormancy (33.8 mm) and stem elongation phases (27.6 mm) in 2020–2023 compared to 2010–2014, while it decreased during the other phases. There was a significant decrease in precipitation during the heading and grain filling phases (late April to late May), recently reaching extreme amounts of 70.0 mm and 395.9 mm in 2022 and 2023, respectively. The average sunshine hours per day increased during all growth phases, except for winter dormancy, in the 2020–2023 growing season compared to 2010–2014.

3.2. Wheat Phenological Characteristics

The number of days from the sowing date to the maximum tillering, heading, and maturity dates tended to decrease from 2010 to 2023 (Figure 3), with the tillering phase significantly shortening over the fourteen years (Figure 4) due to the higher temperatures. The rising temperatures during the seedling and winter dormancy phases accelerated tiller formation, although the onset of winter dormancy and green-up did not change. The average temperatures in early and mid-December (winter dormancy onset) and early February (start of green-up) remained similar over the fourteen years, but the average temperatures of ten-day intervals from late December to late January rose above zero degrees starting from 2015. We deduced that tillering might have occurred prior to or during winter dormancy depending on the years, although the number of tillers was not counted during our study period.
The number of days from sowing to green-up, heading, and maturity did not differ between the years compared to other growth stages, with coefficient of variations (CVs) of 0.05, 0.04, and 0.03, respectively. The number of days in the heading and ripening phase remained the most similar throughout the investigated years, possibly due to the lesser impact of the average temperature on this phase.
Another study reported that the period from green-up to anthesis and from anthesis to maturity shortened and lengthened, respectively, in most of the investigated stations in 1981–2009 [55], concluding that, although climate warming favors early anthesis and maturity, the duration of the grain filling phase is less susceptible to high temperatures. Similarly, Wang et al. [46] showed that the period from sowing to flowering or maturity shortened, in agreement with changes in the temperature, with no changes in the period from maximum tillering to flowering and from flowering to maturity. In our study, although the temperature during the period from maximum tillering to heading (stem elongation phase) increased over the years, the number of days from sowing to heading decreased less than from sowing to maximum tillering. The heading date is very close to anthesis (flowering) and corresponds to the developmental conversion point from vegetative to reproductive growth [56,57]. Photoperiod and temperature are major environmental factors determining the time to flower initiation and appearance in plants, and wheat flowering is more sensitive to the photoperiod [58,59]. Hammes and Marshall [60] previously reported that there is a tendency for the photoperiod to have a more pronounced effect on the development stage than temperature, especially for anthesis. Additionally, Lv et al. [61] reported that changes in the grain filling period are relatively stable compared to other growth periods due to fewer temperature increases in the former.

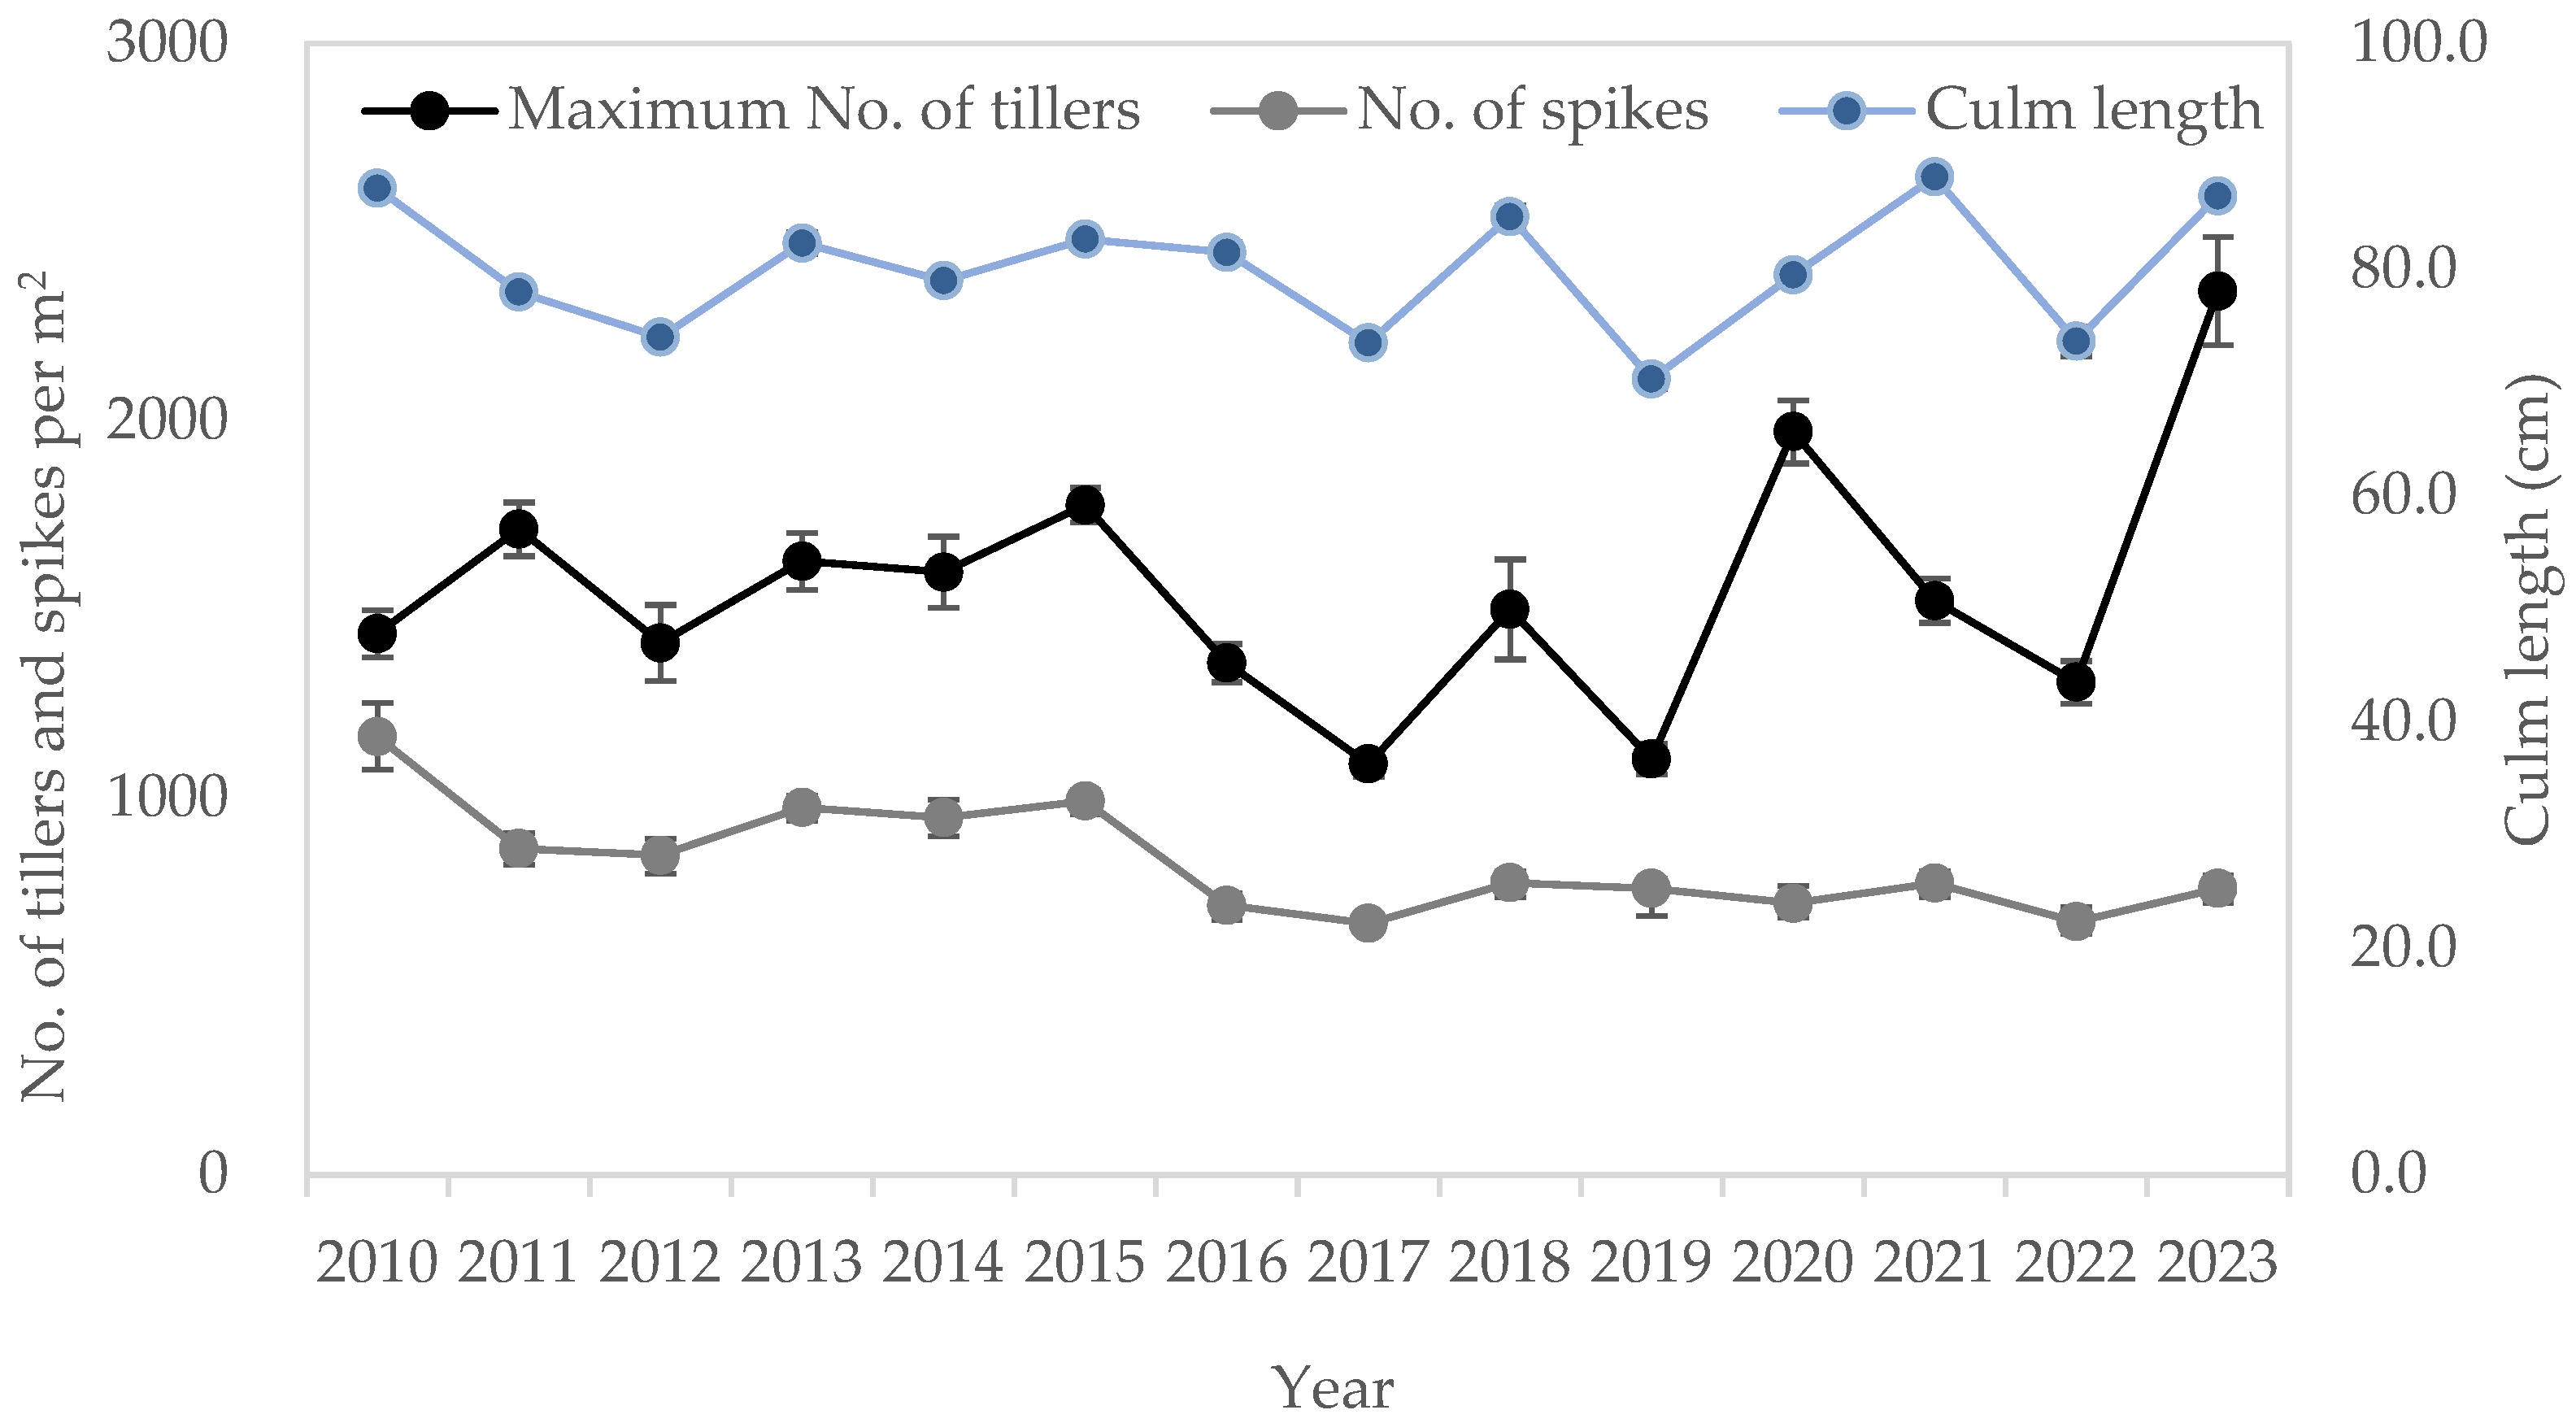
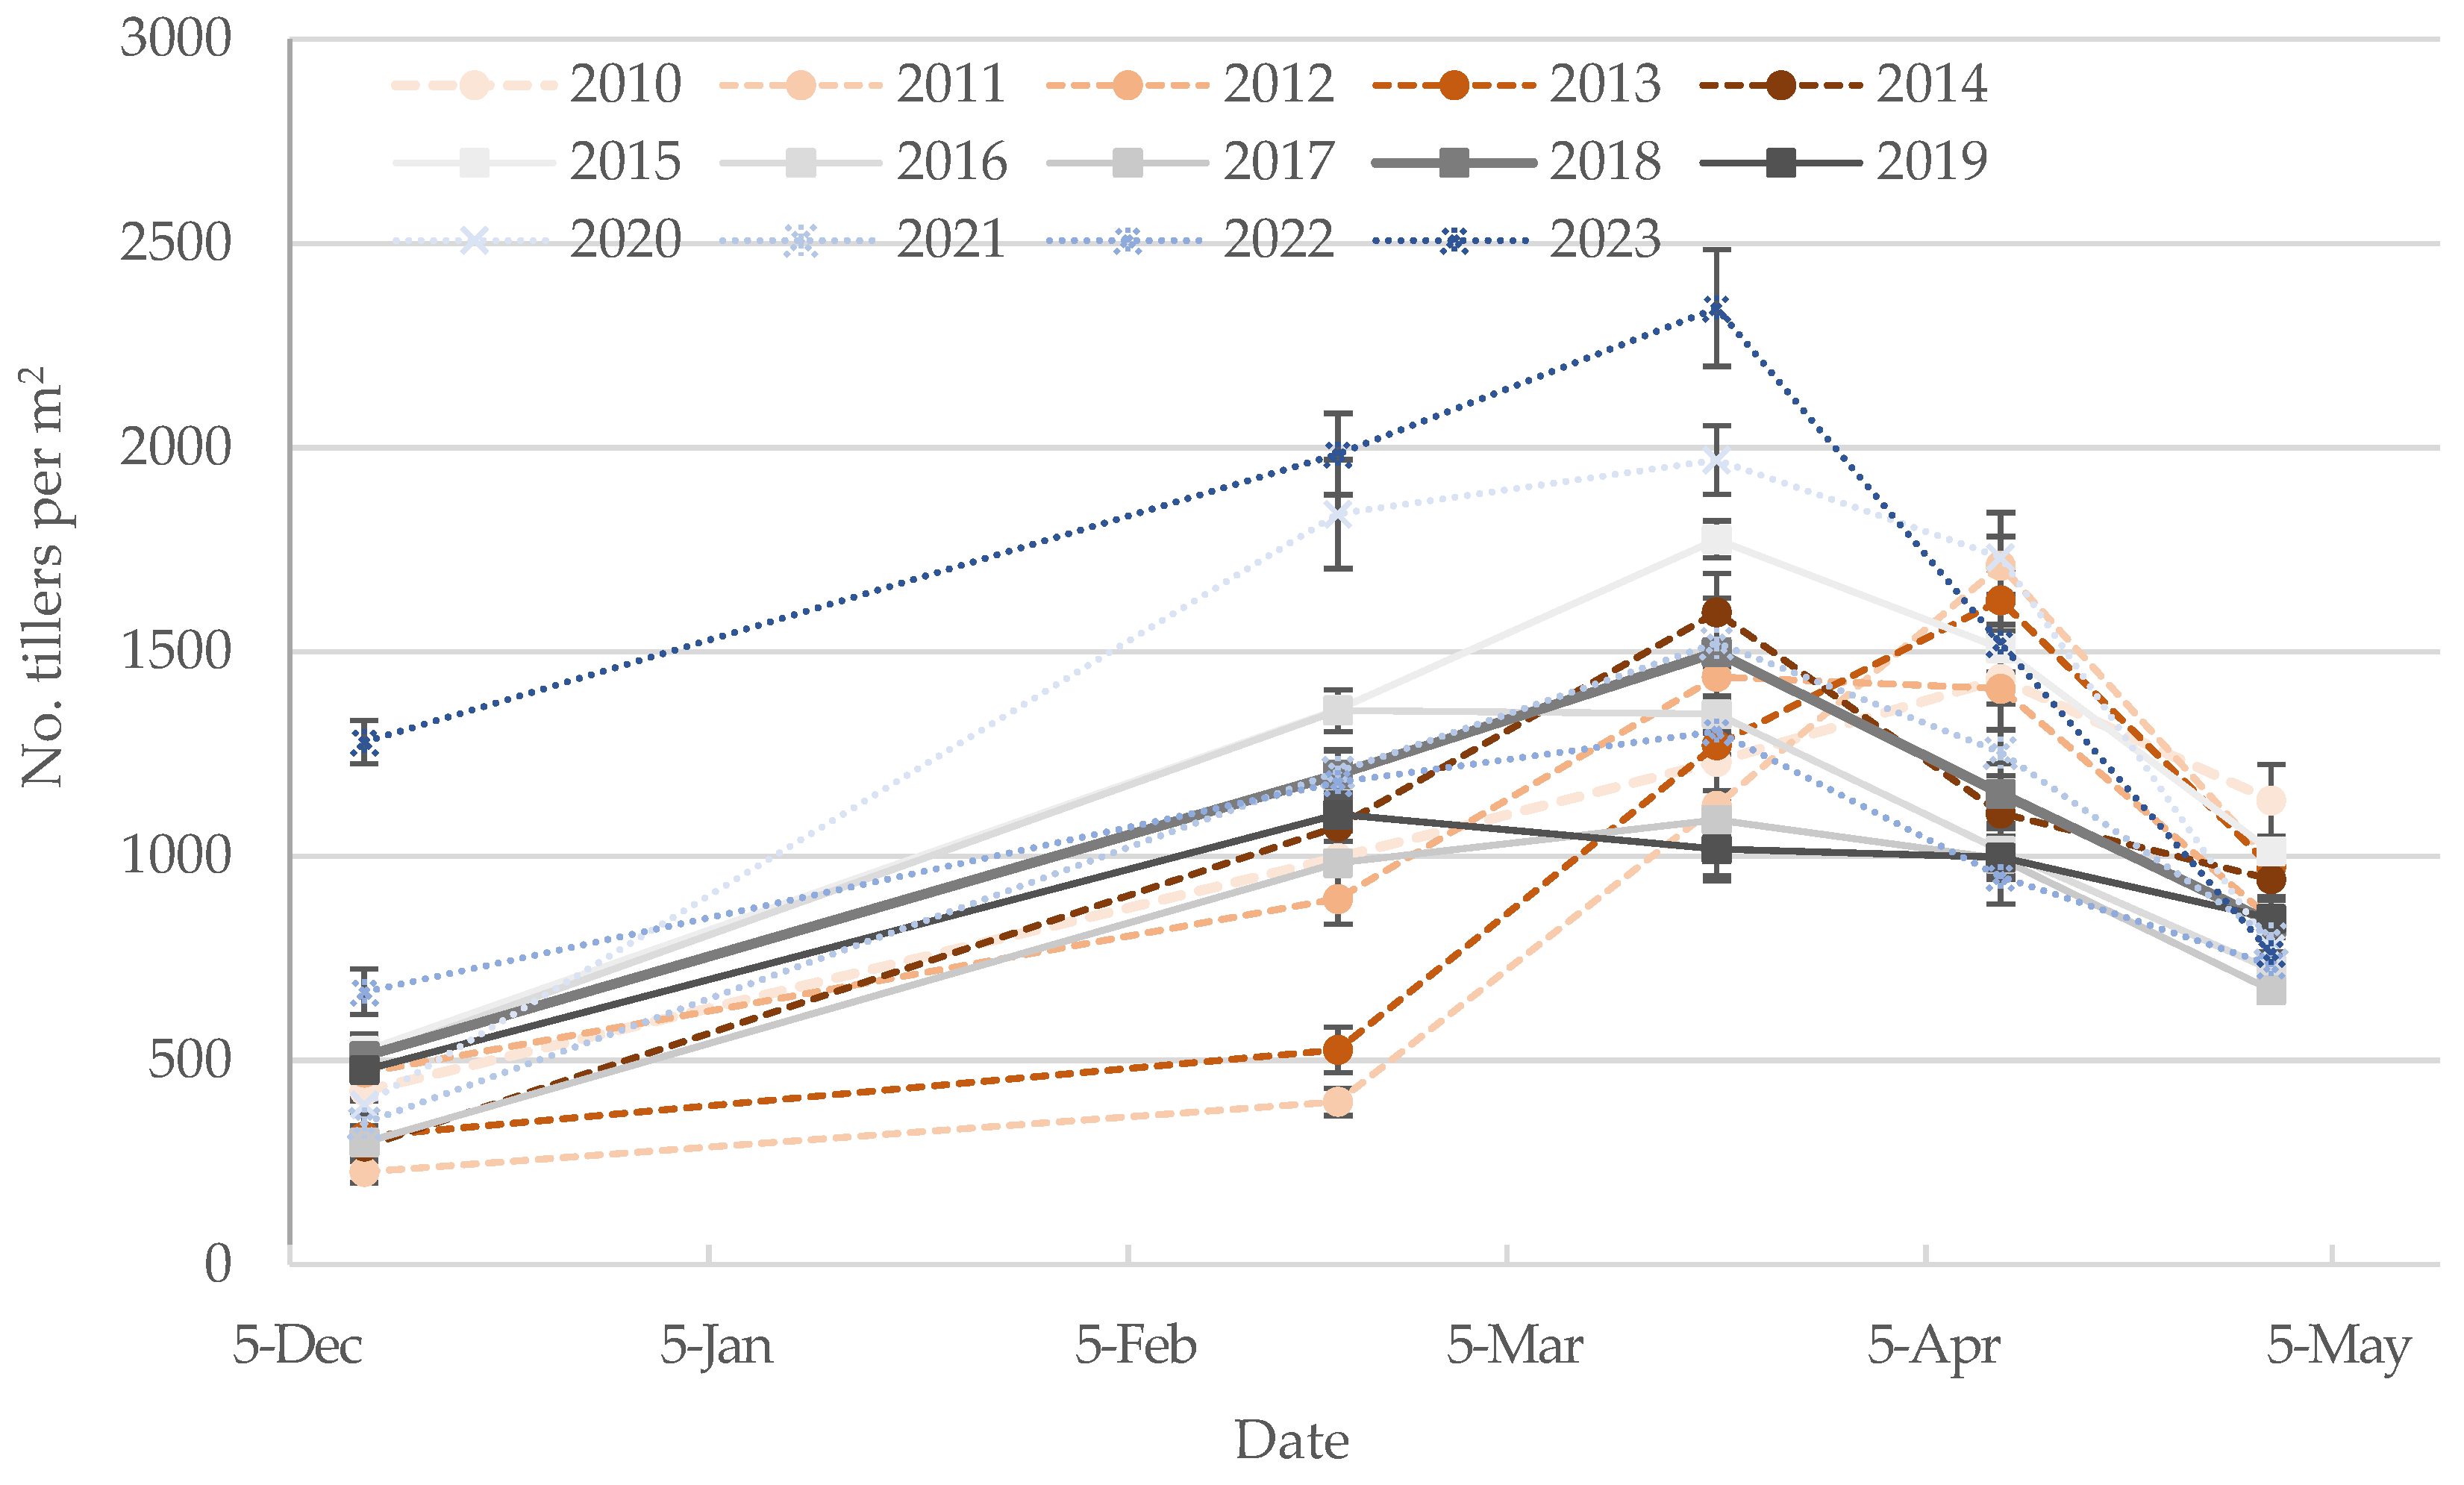
3.3. Wheat Growth Characteristics

The maximum number of tillers (CV = 0.21) showed greater variation than the number of spikes (CV= 0.17) or culm length (CV = 0.07) over the fourteen-year study period (Figure 5), with a slightly positive correlation with the average air temperature (R = 0.346, p = 0.225) during the tillering phase, precipitation (R = 0.396, p = 0.161) during winter dormancy, and sunshine hours (R = 0.439, p = 0.116) during the seedling phase, without statistical significance (Table 1). The maximum number of tillers was positively correlated with the culm length (R = 0.553, p = 0.040) and the above-ground dry weight (R = 0.450, p = 0.107), but negatively correlated with the number of grains per spike (R = 0.403, p = 0.145) (Table 2).
Over the years, the number of tillers tended to increase during winter dormancy rather than after green-up (Figure 6), measuring less than 1000 m−2 on 20 February from 2010 to 2013, increasing thereafter by more than 1000 on the same date. Although the maximum number of tillers was higher in 2020 and 2023 than in the other years, it was not significantly different right after heading between the years. In addition, the number of spikes tended to decrease over the fourteen-year period. The number of tillers produced per plant is controlled by the environment during tiller development and by tiller mortality in the period from jointing to anthesis [50,62]. The timing of tiller initiation can influence tiller mortality [63]. Tilley et al. [52] confirmed that tillers created before 1 March were responsible for the majority of plants producing spikes and contributed the most to grain yield, while those created in March contributed little to the latter. However, there were some differences in the effects of earlier tillers depending on the sowing rate, environmental conditions, and nitrogen application timing, among others. Wheat plants are more vulnerable to cold temperature during the jointing and booting growth phases, decreasing the numbers of spikes per plant and grains per spike [64]. In our study, the number of tillers in 2023 increased from 1280 m−2 on 10 December to 2342 m−2 on 20 March, then decreased to 762 m−2 on 30 April. Although tiller development can be accelerated by favorable environmental conditions, the final number of spikes per m2 was consistent, irrespective of the growing years, and more dependent on the genetic character than on the growth environmental conditions.
In most years, the above-ground dry weight started to increase drastically from 20 March, but, more recently, this has been anticipated for 20 February or even earlier (Figure 7). The variations in the young-panicle length were similar to those in the above-ground dry weight (Figure 8), with the latter’s per unit area value on 10 April highly positively correlated with the former (Table 2). Greater above-ground dry weight or young-panicle-length values were attributed to the environmental conditions in the previous phases. Both the above-ground dry weight and the young-panicle length were positively correlated with the average air temperature during winter dormancy (R = 0.549 and p = 0.042, and R = 0.600 and p = 0.023, respectively) and tillering phases (R = 0.831 and p = 0.000, and R = 0.843 and p = 0.000, respectively) (Table 1). However, the increase in both values on 10 April did not have a positive effect on the number of spikes per unit area or grains per spike and grain yield (Table 2). Brasier et al. [65] reported that, although the association between the above-ground biomass and the grain yield was least significant at anthesis, it was not significant during the booting stage. Considering the negative or lack of effects on increases in the above-ground dry weight and young-panicle length right before the heading stage on the number of grains per spike, the number of spikes, and the grain yield in our study, the vegetative growth rate should not decide winter wheat’s grain yield.

3.4. Wheat Grain Characteristics and Yield

The thousand-grain weight showed a low variation (CV = 0.07) over the fourteen years, while the number of grains per spike, the marketable grain yield, and the straw yield showed comparatively high variations, with CVs = 0.21, 0.19, and 0.32, respectively (Figure 9). The grain yield in cereals depends on three yield components—the number of spikes per unit area, the number of grains per spike, and the grain weight—with strong mutual compensation, despite the fact that one component’s limitation cannot be completely compensated by the others [66]. In our study, the thousand-grain weight was negatively correlated with the number of grains per spike (R = −0.707, p = 0.005) and the number of spikes per m2 (R = −0.428, p = 0.127), while the number of grains per spike was slightly positively correlated with the number of spikes per m2 (R = 0.499, p = 0.069) (Table 2). The wheat grain yield was positively correlated with the number of grains per spike (R = 0.809, p = 0.000), while it was negatively correlated with the thousand-grain weight (R = −0.557, p = 0.039). Mandea et al. [67] reported that most correlations between the number of spikes per unit area or the number of grains per spike and the thousand-grain weight were negative in trials involving 26 different cultivars and 10 locations, although the statistical value varied depending on the cultivars.
The thousand-grain weight was negatively correlated with the winter dormancy (R = −0.647, p = 0.012) or tillering periods (R = −0.636, p = 0.015), but positively correlated with the young-panicle length (R = 0.536, p = 0.048) or the above-ground dry weight on 10 April (R = 0.501, p = 0.068) (Table 2). Indeed, the thousand-grain weight might have increased when the above-ground dry weight and young-panicle development were promoted by the high air temperature during winter dormancy and tillering. The number of spikes per m2 showed a significantly negative correlation with the young-panicle length (R = −0.600, p = 0.023) and slightly positive correlations with the winter dormancy (R = 0.434, p = 0.121) and tillering periods (R = 0.495, p = 0.072). The correlation of the number of grains per spike was similar to that of the number of spikes per m2, with negative correlations with the above-ground weight (R = −0.640, p = 0.014) and the young-panicle length (R = −0.685, p = 0.007), but positive correlations with the winter dormancy (R = 0.655, p = 0.011) and the tillering periods (R = 0.509, p = 0.063). The number of spikes per m2 was not significantly correlated with the maximum number of tillers per m2.
The number of spikes had a significantly negative correlation with the average (R = −0.693, p = 0.006) and maximum air temperatures (R = −0.639, p = 0.014) during the stem elongation phase (Table 1), as well as during all other growth phases, either significantly or insignificantly. The number of grains per spike had a significantly negative correlation with the average (R = −0.650, p = 0.012) and maximum air temperatures (R = −0.622, p = 0.017) during the winter dormancy phase (Table 1), as well as during the tillering or stem elongation phases, with statistical insignificance. On the contrary, the thousand-grain weight was slightly positively correlated with the average or maximum air temperature during the winter dormancy or stem elongation phase. Precipitation only had a positive correlation with the number of spikes (R = 0.533, p = 0.050) during grain filling and ripening, while sunshine hour only had a negative correlation with this component (R = −0.639, p = 0.013) during the tillering phase.
Considering the negative correlation between the thousand-grain weight and the number of spikes or grains per spike, the positive effect of the latter components, and the negative effect of the thousand-grain weight on the grain yield in our study, the number of grains per spike and the number of spikes should be the most important traits for determining wheat grain yield. Wheat grain yield is more closely related to the grain number per unit area, which integrates two main components, the number of spikes per unit area and grains per spike, than grain size or weight [34,41,68,69]. The dominant role of grain number in determining yield stems from evolutionary constraints, and the environmental modulation of plant reproductive output largely depends on seed number adjustments, whereas a stable seed size is adaptive [34,42,70,71]. In addition, the grain number per unit area is more flexible than the grain weight as a yield-determining component; hence, the grain number responds to favorable growing conditions more effectively than the grain weight [41]. However, under unfavorable conditions, such as temperatures as high as 30 °C during the grain filling phase, wheat yield reduction was attributed mostly to a lower grain weight and only slightly to a lower grain number [72,73].
The grain yield was negatively correlated with the average, maximum, and minimum air temperatures during the winter dormancy phase (R = −0.687, p = 0.007; R = −0.552, p = 0.041; R = −742, p = 0.002, respectively) and precipitation (R = −0.726, p = 0.003), while it was positively correlated with the sunshine hours during the same phase (R = 0.555, p = 0.039) (Table 1). The grain yield showed positive associations with the winter dormancy length (R = 0.597, p = 0.024) and the number of grains per spike (R = 0.809, p = 0.000), while it had a negative association with the thousand-grain weight (R = −0.557, p = 0.039).
We used principal component analysis to summarize some information relating to the length of the growth phases, growth characteristics, and yield components of winter wheat (Figure 10). PC1 explained 42.44% of the total variance in the dataset, while PC2 explained 20.51%. The highly weighted variables under PC1 included GSP (squared cosines (SCs) = 0.315), WDP (SC = 0.507), TP (SC = 0.688), SEP (SC = 0.449), AGDW (SC = 0.654), YPL (SC = 0.713), NGS (SC = 0.752), TGW (SC = 0.637), and GY (SC = 0.585), while these were CL (SC = 0.712), NS (SC = 0.435), and SY (SC = 0.475) under PC2. PC1 was characterized by the number of grains per spike, the grain yield, the winter dormancy phase, the young-panicle length, and the thousand-grain weight, while PC2 was characterized by the culm length and the straw yield. Highly weighted observations under PC1 were the years of 2013, 2020, and 2023, while these corresponded to 2010 and 2017 under PC2.
Due to global warming, heat events occur more frequently during the reproductive growth period (from anthesis to maturity) of wheat crops in many global production areas, and temperatures over 25 °C or 30 °C during the ripening phase cause a critical reduction in the wheat yield [74,75,76,77,78], as the optimum temperature for wheat growth during the reproductive growth phase ranges from 12 °C to 22 °C [79,80]. Li et al. [77] concluded, in a study performed on a cropping system similar to ours, that a maximum daily air temperature of 26 °C may be the threshold for normal wheat grain filling, beyond which wheat yield losses may occur. In our study, the average or maximum air temperature during the heading and ripening phase was negatively correlated with the number of spikes but did not impact the grain yield, probably because, over the investigated years, the maximum temperature was not higher than 25.0 °C during the reproductive stage.
Frost stress during the stem elongation (jointing) or heading stage is one of the primary meteorological disasters influencing the growth and development of winter wheat [16,17,31,81]. When the growing point switches to the production of reproductive primordia, and reproductive tissue emerges from the leaf sheath, wheat becomes the most frost sensitive [31,82]. Indeed, while wheat can tolerate temperatures as low as −10 °C before stem elongation, following this stage, a −4 °C temperature may result in severe injury to wheat forets [83]. It is also known that frost severely damages plants when the air temperature falls below −5 °C for two consecutive days [84]. Koo et al. [16] reported that a low temperature around −3.1 °C at the booting or heading stages caused spike degeneration and sterility. In our study, the minimum air temperature in April was the lowest, at 3.5 °C, in both 2013 and 2020. A low temperature below zero was recorded for 5 days in both years. The grain yield was 6.07 Mg ha−1 in 2013, but 2.32 Mg ha−1 in 2020, a reduction that was attributed to the decreased number of spikes per unit area and grains per spike. Because the young panicle elongated later in 2013 than in 2020, with the heading date in the former (3 May) being 12 days later than the latter’s (21 April), the wheat plants might have been less affected by frost stress in 2013 compared to 2020. In recent years, heading dates have been established earlier than usual because of global warming, meaning that frost stress in the spring might occur more frequently, consistent with the findings of Gu et al. [33].

4. Conclusions

Longer winter dormancy and tillering phases following lower air temperatures during the winter and early spring, respectively, delay the above-ground plant growth rate and young-panicle development, but increase the number of spikes and grains per spike, resulting in higher wheat grain yields in Southern Korea’s weather conditions. Global warming expedites plants’ growth rates and frequently causes heat or frost stress, resulting in an inconsistent wheat grain yield.

Author Contributions

Conceptualization, J.L., Y.-H.H., Y.-G.K. and D.-W.K.; methodology, J.L., J.M., J.K. and D.-W.K.; writing—original draft, J.L.; writing—review and editing, D.-W.K. and S.-W.C.; data curation, M.Y., S.K., B.K. and E.R.; validation, M.Y., S.K., B.K. and E.R.; visualization, J.L. and M.Y.; software, J.L.; formal analysis, J.L. and S.-W.C.; supervision, Y.-H.H. and Y.-G.K.; project administration, J.L., J.M., J.K. and D.-W.K.; funding acquisition, J.L., J.M., J.K. and D.-W.K.; resources, J.L., J.M., J.K. and D.-W.K.; and investigation, M.Y., S.K., B.K. and E.R. All authors have read and agreed to the published version of the manuscript.

Funding

This research was carried out with the support of the “Research Program for Agriculture Science & Technology Development (Project title: A study on year to year variation analysis of growth and yield for winter cereal crop, Project No. RS-2021-RD010126)”, from the Korean Rural Development Administration, Republic of Korea.

Data Availability Statement

The raw data supporting the conclusions of this article will be made available by the authors upon request.

Conflicts of Interest

The authors declare no conflicts of interest.

References

  1. FAO (Food and Agriculture Organization of the United Nations). Crops and Livestock Products. Available online: http://www.fao.org/faostat/en/#data/QCL (accessed on 4 June 2024).
  2. MAFRA. Annual Report of Food Grain Demand and Supply; Ministry of Agriculture, Food and Rural Affairs: Sejong, Republic of Korea, 2023.
  3. Jeong, O.J.; Kim, R.J.; Kim, Y.G.; Noh, M.H.; NoH, J.G.; Lee, Y.J.; Lee, H.J.; Jeong, G.B.; Cho, G. What Did Rice Mean to Us? Doosan Dong-A Publishing Co., Ltd.: Seoul, Republic of Korea, 2009; pp. 281–294. [Google Scholar]
  4. Son, J.H.; Yang, J.; Kang, C.S.; Kim, K.H.; Kim, K.M.; Jeong, H.Y.; Park, J.; Son, J.Y.; Park, T.I.; Choi, C. Annual analysis of the agronomic traits of global wheat germplasms in the Korean environment. Korean J. Crop Sci. 2021, 66, 120–129. [Google Scholar] [CrossRef]
  5. Lee, J.; Min, B.; Yoon, S.; Lee, M.; Kim, H.; Hong, K. A multiple-regression model of bulb onion yield in response to meteorological conditions in Gyeongsangnam province, Republic of Korea. Acta Hortic. 2019, 1251, 81–90. [Google Scholar] [CrossRef]
  6. Min, S.K.; Son, S.W.; Seo, K.H.; Kug, J.S.; An, S.I.; Choi, Y.S.; Jeong, J.H.; Kim, B.M.; Kim, J.W.; Kim, Y.H.; et al. Changes in weather and climate extremes over Korea and possible causes: A review. Asia-Pac. J. Atmos. Sci. 2015, 51, 103–112. [Google Scholar] [CrossRef]
  7. Kim, Y.; Jun, M.; Min, S.-K.; Suh, M.-S.; Kang, H.-S. Spatial analysis of future East Asian seasonal temperature using two regional climate model simulations. Asia-Pac. J. Atmos. Sci. 2016, 52, 237–249. [Google Scholar] [CrossRef]
  8. Lee, H.; Moon, B.-K.; Wie, J. Future extreme temperature and precipitation mechanisms over the Korean Peninsula using a regional climate model simulation. J. Korean Earth Sci. Soc. 2018, 39, 327–341. [Google Scholar] [CrossRef]
  9. Cho, C.; Jeong, H.; Kim, Y.; Park, J.; Kim, K.-H.; Kim, K.-M.; Kang, C.-S.; Ko, J.-M.; Shon, J. Growth and quality characteristics of Korean bread wheat in response to elevated temperature during their growing season. Korean J. Crop Sci. 2022, 67, 234–241. [Google Scholar] [CrossRef]
  10. Fan, Y.; Tian, M.; Jin, G.Q.; Tian, Z.; Han, H.; Jiang, D.; Cao, W.; Dai, T. Winter night warming improves pre-anthesis crop growth and post-anthesis photosynthesis involved in grain yield of winter wheat (Triticum aestivum L.). Field Crops Res. 2015, 178, 100–108. [Google Scholar] [CrossRef]
  11. Jeong, H.-Y.; Choi, I.-B.; Ahn, S.-H.; Hwang, W.-H.; Jeong, J.-H.; Lee, H.-S.; Yun, J.-T.; Kim, K.-J. Evaluation of wheat growth and yield change in high temperature conditions of greenhouse. J. Korean Soc. Int. Agric. 2018, 30, 134–144. [Google Scholar] [CrossRef]
  12. Liu, B.; Liu, F.; Tian, L.; Cao, W.; Zhu, Y.; Asseng, S. Post-heading heat stress and yield impact in winter wheat of China. Glob. Chang. Biol. 2013, 20, 372–381. [Google Scholar] [CrossRef]
  13. Du, X.; Gao, Z.; Sun, X.; Bain, D.; Ren, J.; Yan, P.; Cui, Y. Increasing temperature during early spring increases winter wheat grain yield by advancing phenology and mitigating leaf senescence. Sci. Total Environ. 2021, 812, 152557. [Google Scholar] [CrossRef]
  14. He, D.; Fang, S.; Liang, H.; Wang, E.; Wu, D. Contrasting yield responses of winter and spring wheat to temperature rise in China. Environ. Res. Lett. 2020, 15, 124038. [Google Scholar] [CrossRef]
  15. Piao, S.; Ciais, P.; Huang, Y.; Shen, Z.; Peng, S.; Li, J.; Zhou, L.; Liu, H.; Ma, Y.; Ding, Y.; et al. The impacts of climate change on water resources and agriculture in China. Nature 2010, 467, 43–51. [Google Scholar] [CrossRef] [PubMed]
  16. Koo, B.C.; Park, M.W.; Lee, C.W.; Yoon, E.B.; Kim, K.J.; An, J.G. Classification for types of damages caused by cold stress at different young spike development stages of barley and wheat. J. Crop Sci. 2003, 48, 252–261. [Google Scholar]
  17. Zhong, X.; Mei, X.; Li, Y.; Yoshida, H.; Zhao, P.; Wang, X.; Han, L.; Hu, X.; Huang, S.; Huang, J.; et al. Changes in frost resistance of wheat young ears with development during jointing stage. J. Agron. Crop Sci. 2008, 194, 343–349. [Google Scholar] [CrossRef]
  18. Jiang, G.-L.; Xiao, S. Factorial cross analysis of pre-harvest sprouting resistance in white wheat. Field Crops Res. 2005, 91, 63–69. [Google Scholar] [CrossRef]
  19. Park, H.; Cha, J.-K.; Lee, S.-M.; Kwon, Y.; Choi, J.; Lee, J.-H. Artificial rainfall on grain quality and baking characteristics of winter wheat cultivars in Korea. Foods 2024, 13, 1679. [Google Scholar] [CrossRef]
  20. Liu, B.; Zhang, D.; Zhang, H.; Asseng, S.; Yin, T.; Qiu, X.; Ye, Z.; Liu, L.; Tang, L.; Cao, W. Separating the impacts of heat stress events from rising mean temperatures on winter wheat yield of china. Environ. Res. Lett. 2021, 16, 124035. [Google Scholar] [CrossRef]
  21. Senapati, N.; Stratonovitch, P.; Paul, M.J.; Semenov, M.A. Drought tolerance during reproductive development is important for increasing wheat yield potential under climate change in Europe. J. Exp. Bot. 2019, 70, 2549–2560. [Google Scholar] [CrossRef]
  22. Stone, P.J.; Nicolas, M.E. A survey of the effects of high temperature during grain filling on yield and quality of 75 wheat cultivars. Aust. J. Agric. Res. 1995, 46, 475–492. [Google Scholar] [CrossRef]
  23. Zenda, T.; Wang, N.; Dong, A.; Zhou, Y.; Duan, H. Reproductive-stage heat stress in cereals: Impact, plant responses and strategies for tolerance improvement. Int. J. Mol. Sci. 2022, 23, 6929. [Google Scholar] [CrossRef]
  24. Wardlaw, I.F.; Wrigley, C.W. Heat tolerance in temperate cereals: An overview. Aust. J. Plant Physiol. 1994, 21, 695–703. [Google Scholar] [CrossRef]
  25. Altenbach, S.B. New insights into the effects of high temperature, drought and post-anthesis fertilizer on wheat grain development. J. Cereal Sci. 2012, 56, 39–50. [Google Scholar] [CrossRef]
  26. Dias, A.S.; Lidon, F.C. Evaluation of grain filling rate and duration in bread and durum wheat, under heat stress after anthesis. J. Agron. Crop Sci. 2009, 195, 137–147. [Google Scholar] [CrossRef]
  27. Tiwari, C.; Wallwork, H.; Dhari, R.; Arun, B.; Mishra, V.K.; Joshi, A.K. Exploring the possibility of obtaining terminal heat tolerance in a doubled haploid population of spring wheat (Triticum aestivum L.) in the eastern gangetic plains of India. Field Crops Res. 2012, 135, 1–9. [Google Scholar] [CrossRef]
  28. Crimp, S.J.; Zheng, B.; Khimashia, N.; Gobbett, D.L.; Chapman, S.; Howden, M.; Nicholls, N. Recent changes in southern Australian frost occurrence: Implications for wheat production risk. Crop Pasture Sci. 2016, 67, 801–811. [Google Scholar] [CrossRef]
  29. Shroye, J.P.; Mikesell, M.E.; Paulsen, G.M. Spring Freeze Injury to Kansas Wheat. In Kansas State University Agricultural Experiment Station and Cooperative Extension Service C-646; Kansas State University: Manhattan, KS, USA, 1995. [Google Scholar]
  30. Trnka, M.; Rotter, R.P.; Ruiz-Ramos, M.; Kersbaum, K.C.; Olesen, J.E.; Zalud, Z. Adverse weather conditions for European wheat production will become more frequent with climate change. Nat. Clim. Chang. 2014, 4, 637–643. [Google Scholar] [CrossRef]
  31. Single, W.V.; Marcellos, H. Studies on frost injury to wheat. IV. Freezing of ears after emergence from the leaf sheath. Aust. J. Agric. Res. 1974, 25, 679–686. [Google Scholar] [CrossRef]
  32. Xiao, L.; Liu, B.; Zhang, H.; Gu, J.; Fu, T.; Asseng, S.; Liu, L.; Tang, L.; Gao, W.; Zhu, Y. Modeling the response of winter wheat phenology to low temperature stress at elongation and booting stages. Agric. For. Meteorol. 2021, 303, 108376. [Google Scholar] [CrossRef]
  33. Gu, L.; Hanson, P.J.; Post, W.M.; Kaiser, D.P.; Yang, B.; Nemani, R. The 2007 eastern US spring freeze: Increased cold damage in a warming world? Bioscience 2008, 58, 253–262. [Google Scholar] [CrossRef]
  34. Sadras, V.O.; Slafer, G.A. Environmental modulation of yield components in cereals: Heritabilities reveal a hierarchy of phenotypic plasticities. Field Crops Res. 2012, 127, 215–224. [Google Scholar] [CrossRef]
  35. Slafer, G.; Kantolic, A.; Appendino, M.; Miralles, D.; Savin, R. Crop development: Genetic control, environmental modulation and relevance for genetic improvement of crop yield. In Crop Physiology: Applications for Genetic Improvement and Agronomy; Sadras, V.O., Calderini, D.F., Eds.; Academic Press: San Diego, CA, USA, 2009; pp. 277–308. [Google Scholar]
  36. Beche, E.; Benin, G.; Silva, C.L.D.; Munaro, L.B.; Marchese, J.A. Genetic gain in yield and changes associated with physiological traits in Brazilian wheat during the 20th century. Eur. J. Agron. 2014, 61, 49–59. [Google Scholar] [CrossRef]
  37. Xiao, Y.G.; Qian, Z.G.; Wu, K.; Liu, J.J.; Xia, X.C.; Ji, W.Q.; He, Z.H. Genetic gains in grain yield and physiological traits of winter wheat in Shandong Province, China, from 1969 to 2006. Crop Sci. 2012, 52, 44–56. [Google Scholar] [CrossRef]
  38. Yao, Y.; Lv, L.; Zhang, L.; Yao, H.; Dong, Z.; Zhang, J.; Ji, J.; Jia, X.; Wang, H. Genetic gains in grain yield and physiological traits of winter wheat in Hebei Province of China, from 1964 to 2007. Field Crops Res. 2019, 239, 114–123. [Google Scholar] [CrossRef]
  39. Aisawi, K.A.B.; Reynolds, M.P.; Singh, R.P.; Foulkes, M.J. The physiological basis of the genetic progress in yield potential of CIMMYT spring wheat cultivars from 1966 to 2009. Crop Sci. 2015, 55, 1749–1764. [Google Scholar] [CrossRef]
  40. Sun, Y.; Wang, X.; Wang, N.; Chen, Y.; Zhang, S. Changes in the yield and associated photosynthetic traits of dry-land winter wheat (Triticum aestivum L.) from the 1940s to the 2010s in Shanxi province of China. Field Crops Res. 2014, 167, 1–10. [Google Scholar] [CrossRef]
  41. Peltonen-Sainio, P.; Kangas, A.; Salo, Y.; Jauhiainen, L. Grain number dominates grain weight in temperate cereal yield determination: Evidence based on 30 years of multi-location trials. Field Crops Res. 2007, 100, 179–188. [Google Scholar] [CrossRef]
  42. Sadras, V.O. Evolutionary aspects of the trade-off between seed size and number in crops. Field Crops Res. 2007, 100, 125–138. [Google Scholar] [CrossRef]
  43. Feekes, W. De tarwe en haar milieu [Wheat and its environment]. Versl. Tech. Tarwe Comm. 1941, 17, 523–888. [Google Scholar]
  44. Hay, R.K.M.; Kirby, E.J.M. Convergence and synchrony-–a review of the coordination of development in wheat. Aust. J. Agric. Res. 1991, 42, 661–700. [Google Scholar] [CrossRef]
  45. Hyles, J.; Bloomfield, M.T.; Hunt, J.R.; Trethowan, R.M.; Trevaskis, B. Phenology and related traits for wheat adaptation. Heredity 2020, 125, 417–430. [Google Scholar] [CrossRef]
  46. Wang, J.; Wang, E.; Feng, L.; Yin, H.; Yu, W. Phenological trends of winter wheat in response to varietal and temperature changes in the North China Plain. Field Crops Res. 2023, 144, 135–144. [Google Scholar] [CrossRef]
  47. Zadoks, J.C.; Chang, T.T.; Konzak, C.F. Decimal code for growth stages of cereals. Weed Res. 1974, 14, 415–421. [Google Scholar] [CrossRef]
  48. Choi, I.; Kim, H.; Hwang, J.; Gu, H.; Bae, H.; Park, T.; Park, H.; Lee, G. Yearly variation in growth and yield of winter hulless barley at Iksan. Korean J. Crop Sci. 2016, 61, 171–183. [Google Scholar] [CrossRef]
  49. He, L.; Asseng, S.; Zhao, G.; Wu, D.; Yang, X.; Zhuang, W.; Jin, N.; Yu, Q. Impacts of recent climate warming, cultivar changes, and crop management on winter wheat phenology across the Loess Plateau of China. Agric. For. Meteorol. 2015, 200, 135–143. [Google Scholar] [CrossRef]
  50. Klepper, B.; Rickman, R.W.; Peterson, C.M. Quantitative characterization of vegetative development in small cereal grains. Agron. J. 1982, 74, 789–792. [Google Scholar] [CrossRef]
  51. Evers, J.B.; Vos, J. Modeling branching in cereals. Front. Plant Sci. 2013, 4, 399. [Google Scholar] [CrossRef] [PubMed]
  52. Tilley, M.S.; Heiniger, R.W.; Crozier, C.R. Tiller initiation and its effects on yield and yield components in winter wheat. Agron. J. 2019, 3, 1323–1332. [Google Scholar] [CrossRef]
  53. Kwon, Y.; Hwang, J.; Han, O.; Park, T.; Hyeun, J.; Kim, Y. Wheat, Chapter 6. Cereal crop. In A Standard Method for Agricultural Research, Investigation and Analysis; Rural Development Administration: Jeonju, Republic of Korea, 2012; pp. 357–358. [Google Scholar]
  54. Weather Information; Korea Meteorological Administration: Daejeon, Republic of Korea, 2024. Available online: https://data.kma.go.kr/resources/html/en/aowdp.html (accessed on 4 June 2024).
  55. Xiao, D.; Tao, F.; Liu, Y.; Shi, W.; Wang, M.; Liu, F.; Zhang, S.; Zhu, Z. Observed changes in winter wheat phenology in the North China Plain for 1981–2009. Int. J. Biometeorol. 2013, 57, 275–285. [Google Scholar] [CrossRef]
  56. Cleland, E.E.; Chuine, I.; Menzel, A.; Mooney, H.A.; Schwartz, M.D. Shifting plant phenology in response to global change. Trend Ecol. Evol. 2007, 22, 357–365. [Google Scholar] [CrossRef]
  57. Sheehan, H.; Bentley, A. Changing times: Opportunities for altering winter wheat phenology. Plants People Planet 2021, 3, 113–123. [Google Scholar] [CrossRef]
  58. Daba, K.; Tar’an, B.; Bueckert, R.; Warkentin, T.D. Effect of temperature and photoperiod on time to fowering in Chickpea. Crop Sci. 2016, 56, 200–208. [Google Scholar] [CrossRef]
  59. Aslam, M.A.; Ahmed, M.; Stockle, C.O.; Higgins, S.S.; Hassan, F.; Hayat, R. Can growing degree days and photoperiod predict spring wheat phenology? Front. Environ. Sci. 2017, 5, 57. [Google Scholar] [CrossRef]
  60. Hammes, P.S.; Marshall, R.J. Effect of photoperiod and temperature on the developmental rate of three cultivars of wheat (Triticum aestivum L.). Field Crops Res. 1980, 3, 121–128. [Google Scholar] [CrossRef]
  61. Lv, Z.; Liu, X.; Cao, W.; Zhu, Y. Climate change impacts on regional winter wheat production in main wheat production regions of China. Agric. For. Meteorol. 2013, 171–172, 234–248. [Google Scholar] [CrossRef]
  62. Jewiss, O.R. Tillering in grasses- Its significance and control. J. Br. Grassl. Soc. 1972, 27, 65–82. [Google Scholar] [CrossRef]
  63. Xu, H.; Cai, T.; Wang, Z.; He, M. Physiological basis for the differences of productive capacity among tillers in winter wheat. J. Integr. Agric. 2015, 14, 1958–1970. [Google Scholar] [CrossRef]
  64. Lin, F.; Li, C.; Xu, B.; Chen, J.; Chen, A.; Hassan, M.A.; Liu, B.; Xu, H.; Chen, X.; Sun, J.; et al. Late spring cold reduces grain number at various spike positions by regulating spike growth and assimilate distribution in winter wheat. Crop J. 2023, 11, 1272–1278. [Google Scholar] [CrossRef]
  65. Brasier, K.; Oakes, J.; Balota, M.; Thomason, W.; Griifey, C. Greater biomass accumulation at anthesis increases nitrogen use efficiency in winter wheat. Agron. J. 2019, 111, 2163–2173. [Google Scholar] [CrossRef]
  66. Darwinkel, A. Patterns of tillering and grain production of winter wheat at a wide range of plant densities. Neth. J. Agric. Sci. 1978, 26, 383–398. [Google Scholar] [CrossRef]
  67. Mandea, V.; Mustatea, P.; Marinciu, M.M.; Serban, G.; Meluca, C.; Paunescu, G.; Isticioaia, S.; Dragomir, C.; Bunta, G.; Filiche, E.; et al. Yield components compensation in winter wheat (Triticum aestivum L.) is cultivar dependent. Rom. Agric. Res. 2019, 36, 27–33. [Google Scholar] [CrossRef]
  68. Lopez Pereira, M.; Sadras, V.O.; Trapani, N. Genetic improvement of sunflower in Argentina between 1930 and 1995. I. Yield and its components. Field Crops Res. 1999, 65, 157–166. [Google Scholar] [CrossRef]
  69. Okuyama, L.A.; Federizzi, L.C.; Barbosa Neto, J.F. Correlation and path analysis of yield and its components and plant traits in wheat. Cienc. Rural 2004, 34, 1701–1708. [Google Scholar] [CrossRef]
  70. Smith, C.C.; Fretwell, S.D. The optimal balance between size and number of offspring. Am. Nat. 1974, 108, 499–506. [Google Scholar] [CrossRef]
  71. Sadras, V.O.; Denison, R.F. Do plant parts compete for resources? An evolutionary perspective. New Phytol. 2009, 183, 565–574. [Google Scholar] [CrossRef] [PubMed]
  72. Sofield, I.; Evans, L.T.; Cook, M.G.; Wardlaw, I.F. Factors influencing the rate and duration of grain filling in wheat. Aust. J. Plant Physiol. 1977, 4, 785–797. [Google Scholar] [CrossRef]
  73. Wardlaw, I.F.; Dawson, I.A.; Munibi, P.; Fewster, R. The tolerance of wheat to high temperatures during reproductive growth. I. Survey procedures and general response patterns. Aust. J. Agric. Res. 1989, 40, 1–13. [Google Scholar] [CrossRef]
  74. Alghabari, F.; Shah, Z.H.; Elfeel, A.A.; Alyami, J.H. Biochemical and physiological responses of thermostable wheat genotypes for agronomic yield under heat stress during reproductive stages. Agronomy 2021, 11, 2080. [Google Scholar] [CrossRef]
  75. Bohara, S.; Acharya, B.; Bohara, S.; Upadhyaya, J. Assessment of late sown wheat (Triticum aestivum L.) genotypes under high temperature stress conditions. J. Agric. Environ. 2023, 24, 39–49. [Google Scholar] [CrossRef]
  76. Gilson, L.R.; Paulsen, G.M. Yield components of wheat grown under high temperature stress during reproductive growth. Crop Sci. 1999, 39, 1841–1846. [Google Scholar]
  77. Li, M.; Wu, X.; Zhu, Y.; Ullah, N.; Song, Y. Assessment of heat risk of winter wheat cropping based on long-term meteorological data. Agronomy 2023, 13, 2149. [Google Scholar] [CrossRef]
  78. Ullah, S.; Bramley, H.; Mahmood, T.; Trethowan, R. A strategy of ideotype development for heat-tolerant wheat. J. Agron. Crop Sci. 2020, 206, 229–241. [Google Scholar] [CrossRef]
  79. Farooq, M.; Bramley, H.; Palta, J.A.; Siddique, K.H.M. Heat stress in wheat during reproductive and grain-filling phases. Crit. Rev. Plant Sci. 2011, 30, 491–507. [Google Scholar] [CrossRef]
  80. Shewry, P.R. Wheat. J. Exp. Bot. 2009, 60, 1537–1553. [Google Scholar] [CrossRef] [PubMed]
  81. Zhang, F.; Jiang, N.; Zhang, H.; Huo, Z.; Yang, Z. Effect of low temperature on photosynthetic characteristics, senescence Characteristics, and endogenous hormones of winter Wheat “Ji Mai 22” during the jointing stage. Agronomy 2023, 13, 2650. [Google Scholar] [CrossRef]
  82. Single, W.V. Frost injury and the physiology of the wheat plant. J. Aust. Ins. Agric. Sci. 1984, 17, 128–134. [Google Scholar]
  83. Fowler, D.B.; Breton, G.; Limin, A.E.; Mahfoozi, S.; Sarhan, F. Photoperiod and temperature interactions regulate low-temperature-induced gene expression in barley. Plant Physiol. 2001, 127, 1676–1681. [Google Scholar] [CrossRef]
  84. Spink, J.; Kirby, E.; Frost, D.; Sylvester-Bradley, R.; Scott, R.; Foulkes, M.; Clare, R.; Evans, E.J. Agronomic implications of variation in wheat development due to variety, sowing date, site and season. Plant Var. Seeds 2000, 13, 91–108. [Google Scholar]
Figure 1. Average, maximum, and minimum daily air temperatures of ten-day intervals during winter wheat’s growing seasons in Jinju, South Korea, in 2010–2014, 2015–2019, and 2020–2023.
Agronomy 14 02017 g001
Figure 2. Precipitation and average sunshine hours of ten-day intervals during winter wheat’s growing seasons in Jinju, South Korea, in 2010–2014, 2015–2019, and 2020–2023.
Agronomy 14 02017 g002
Figure 3. Days from sowing to specific dates in winter-wheat’s growth stages in Jinju, South Korea, from 2010 to 2023. The error bars represent the standard error.
Agronomy 14 02017 g003
Figure 4. Number of days in each growth phase of winter wheat in Jinju, South Korea, from 2010 to 2023. The error bars represent the standard error.
Agronomy 14 02017 g004
Figure 5. Maximum number of tillers, number of spikes, and culm length of winter wheat in Jinju, South Korea, from 2010 to 2023. The error bars represent the standard errors.
Agronomy 14 02017 g005
Figure 6. Changes in the number of tillers of winter wheat in Jinju, South Korea, from 2010 to 2023. The error bars represent the standard error.
Agronomy 14 02017 g006
Figure 7. Changes in the above-ground dry weight of winter wheat in Jinju, South Korea, from 2010 to 2023. The error bars represent the standard error.
Agronomy 14 02017 g007
Figure 8. Changes in the young-panicle length of winter wheat in Jinju, South Korea, from 2010 to 2023. The error bars represent the standard error.
Agronomy 14 02017 g008
Figure 9. Number of grains per spike, the thousand-grain weight, and the grain and straw yield of winter wheat in Jinju, South Korea, from 2010 to 2023. The error bars represent the standard errors.
Agronomy 14 02017 g009
Figure 10. Factor loading plots in the principal component analysis of all periods of growth phases, growth characteristics, yield-related traits, and yield of winter wheat in Jinju, South Korea, from 2010 to 2023. GSP = germination and seedling phase (days); WDP = winter dormancy phase (days); TP = tillering phase (days); SEP = stem elongation phase (days); HRP = heading and ripening phase (days); AGDW = above-ground dry weight per m2 on 10 April (g m−2); YPL = young-panicle length on 10 April (mm); CL = culm length (mm); MNT = maximum number of tillers per m2; NS = number of spikes per m2; NGS = number of grains per spike; TGW = thousand-grain weight (g); GY = grain yield (Mg ha−1); and SY = straw yield (Mg ha−1).
Agronomy 14 02017 g010
Table 1. Correlation coefficients of linear regression between the weather conditions during each growth phase and the growth characteristics or yield-related traits of winter wheat in Jinju, South Korea, from 2010 to 2023.
VariablesWeatherGSPWDPTPSEPHRP
MNTAverage temp.−0.110−0.0720.346--
Maximum temp.0.192−0.0770.319--
Minimum temp.−0.125−0.0270.270--
Precipitation−0.0400.396−0.194--
Sunshine hours0.439−0.014−0.048--
AGDWAverage temp.0.1650.549 *0.831 **0.373-
Maximum temp.0.3480.601 *0.619 *0.332-
Minimum temp.0.1170.5290.820 **0.240-
Precipitation−0.1390.4090.0060.132-
Sunshine hours0.232−0.278−0.239−0.060-
YPLAverage temp.0.2390.600 *0.843 **0.670 **-
Maximum temp.0.4870.603 *0.810 **0.661 **-
Minimum temp.0.0800.595 *0.627 *0.422-
Precipitation−0.2680.366−0.1750.258-
Sunshine hours0.268−0.2460.1760.236-
CLAverage temp.−0.227−0.1790.4730.015−0.504
Maximum temp.−0.239−0.2270.2690.000−0.593 *
Minimum temp.−0.134−0.1030.587 *0.093−0.184
Precipitation−0.1430.1970.4580.3630.538 *
Sunshine hours0.211−0.2390.515−0.350−0.550
NSAverage temp.−0.376−0.448−0.242−0.693 **−0.693 **
Maximum temp.−0.504−0.396−0.444−0.639 *−0.598 *
Minimum temp.−0.159−0.4740.119−0.447−0.430
Precipitation0.033−0.2760.416−0.1170.533 *
Sunshine hours−0.0430.045−0.640 *−0.433−0.349
NGSAverage temp.−0.201−0.650 *−0.516−0.467−0.061
Maximum temp.−0.579 *−0.622 *−0.474−0.4540.034
Minimum temp.0.013−0.642 *−0.363−0.356−0.132
Precipitation0.355−0.607 *0.050−0.1150.148
Sunshine hours−0.3020.423−0.147−0.012−0.009
TGWAverage temp.0.3810.4920.2650.4060.157
Maximum temp.0.591*0.4380.1790.3750.024
Minimum temp.0.1860.5190.2000.2690.304
Precipitation−0.0530.451−0.2550.126−0.298
Sunshine hours0.374−0.3220.1320.1080.069
GYAverage temp.−0.455−0.687 **−0.386−0.1660.064
Maximum temp.−0.641 *−0.552 *−0.308−0.0660.127
Minimum temp.−0.319−0.742 **−0.318−0.1870.038
Precipitation0.036−0.726 **0.113−0.0990.049
Sunshine hours0.0350.555 *−0.1240.088−0.013
SYAverage temp.0.227−0.0880.124−0.128−0.362
Maximum temp.−0.006−0.009−0.253−0.242−0.419
Minimum temp.0.328−0.1130.566 *0.0750.052
Precipitation0.203−0.2490.5280.4420.436
Sunshine hours−0.209−0.029−0.793 **−0.452−0.435
** and * indicate significant values at 1% and 5% levels of significance, respectively. GSP = germination and seedling phase; WDP = winter dormancy phase; TP = tillering phase; SEP = stem elongation phase; HRP = heading and ripening phase; AGDW = above-ground dry weight per m2 on 10 April (g m−2); YPL = young-panicle length on 10 April (mm); CL = culm length (mm); MNT = maximum number of tillers per m2; NS = number of spikes per m2; NGS = number of grains per spike; TGW = thousand-grain weight (g); GY = grain yield (Mg ha−1); and SY = straw yield (Mg ha−1).
Table 2. Pearson’s correlation coefficient between each growth period, growth characteristics, yield-related traits, and winter wheat yield in Jinju, South Korea, from 2010 to 2023.
VariablesGSPWDPTPSEPHRPMNTAGDWYPLCLNSNGSTGWGY
WDP−0.883 **
TP−0.2560.388
SEP0.094−0.317−0.681 *
HRP−0.039−0.153−0.4900.363
MNT−0.045−0.037−0.3130.478−0.136
AGDW0.137−0.341−0.756 **0.704 **0.5210.45
YPL0.233−0.451−0.837 **0.4660.567 *0.2450.796 **
CL−0.3210.196−0.1870.228−0.0700.553 *0.4510.261
NS−0.4620.4340.4950.047−0.2590.143−0.123−0.600 *0.411
NGS−0.596 *0.655 *0.509−0.373−0.261−0.403−0.640 *−0.685 **−0.0850.499
TGW0.633 *−0.647 *−0.636 *0.522−0.1150.40.5010.536 *0.042−0.428−0.707 **
GY−0.4780.597 *0.419−0.495−0.328−0.285−0.522−0.4730.1110.4190.809 **−0.557 *
SY0.048−0.094−0.2120.4−0.1200.1120.3490.0140.575 *0.545 *0.1280.1270.22
** and * indicate significant values at the 1% and 5% levels of significance, respectively. GSP = germination and seedling phase (days); WDP = winter dormancy phase (days); TP = tillering phase (days); SEP = stem elongation phase (days); HRP = heading and ripening phase (days); AGDW = above-ground dry weight per m2 on 10 April (g m−2); YPL = young-panicle length on 10 April (mm); CL = culm length (mm); MNT = maximum number of tillers per m2; NS = number of spikes per m2; NGS = number of grains per spike; TGW = thousand-grain weight (g); GY = grain yield (Mg ha−1); and SY = straw yield (Mg ha−1).
Disclaimer/Publisher’s Note: The statements, opinions and data contained in all publications are solely those of the individual author(s) and contributor(s) and not of MDPI and/or the editor(s). MDPI and/or the editor(s) disclaim responsibility for any injury to people or property resulting from any ideas, methods, instructions or products referred to in the content.

