Article

Optimization of Application Parameters for UAV-Based Liquid Pollination in Pear Orchards: A Yield and Cost Perspective

by
Pei Wang
1,2,*,†,
Moxin He
1,†,
Mingqi Li
1,
Yuheng Yang
1,3,
Hui Li
2,
Wanpeng Xi
4 and
Tong Zhang
1,*
1
College of Resources and Environment, Interdisciplinary Research Center for Agriculture Green Development in Yangtze River Basin, Southwest University, Chongqing 400715, China
2
College of Engineering and Technology, Key Laboratory of Agricultural Equipment for Hilly and Mountain Areas, Southwest University, Chongqing 400715, China
3
College of Plant Protection, Southwest University, Chongqing 400715, China
4
College of Horticulture and Landscape Architecture, Southwest University, Chongqing 400715, China
*
Authors to whom correspondence should be addressed.
These authors contributed equally to this work.
Agronomy 2024, 14(9), 2033; https://doi.org/10.3390/agronomy14092033
Submission received: 2 August 2024 / Revised: 29 August 2024 / Accepted: 3 September 2024 / Published: 6 September 2024

Abstract

:
Unmanned aerial vehicle (UAV) liquid pollination emerges as a promising substitute for hand pollination methods. In this study, the relationship between UAV liquid pollination and fruit thinning operations was explored from the perspective of practical application. By testing droplet deposition under various flight parameters, the flight parameters for a specific pear orchard were optimized to ensure the uniform and effective distribution of the pollination solution. Results indicated that optimal droplet density (number·cm−2), area coverage (%), and deposition rate (μL·cm−2) were achieved at a flight height (FH) of 1.5 m and a flight speed (FS) of 2 m·s−1. Considering the nuanced physiological attributes of pear tree flowers during their pollination phase, the research scrutinizes the impact of application parameters such as floral stage and spraying frequency on pollination efficiency. A two-way ANOVA analysis demonstrated significant impacts of floral stage, spraying frequency, and their interaction on the fruit set rate (p < 0.01). Controlling pollination parameters can effectively regulate the fruit set rate, thereby influencing the cost and efficiency of fruit thinning. These findings contribute a theoretical framework for formulating customized pollination management strategies tailored to the specific needs of pear orchards.

1. Introduction

The pear tree, a quintessential gametophyte self-incompatible fruit tree within the Rosaceae family [1], holds the esteemed position of being the third most significant fruit tree worldwide [2]. Its fruit-bearing success predominantly hinges on pollination among compatible varieties, underscoring the pivotal role of this process in ensuring both the quantity and quality of pear yields. Given the imperative of optimizing orchard management objectives, pollination services emerge as a linchpin in addressing the dual demands of cost-effectiveness and yield assurance. While artificial supplementary pollination reigns as the predominant method in pear orchards, its efficacy remains susceptible to climatic variations, flowering period, labor constraints, and other contingent factors. In contrast to dry pollination techniques, liquid pollination methods exhibit superior mechanical adaptability and cost efficiency [3], thereby garnering increased attention in recent years [4]. The effectiveness of liquid pollination is profoundly intertwined with the constitution of the pollination medium, prevailing ambient factors, and the dynamics governing its application methodology. Factors such as pollen concentration, sugar content, pH levels, and ions within the pollen suspension exert significant impact on pollen activity [5]. Notably, liquid pollination has demonstrated high environmental suitability under elevated temperatures and low humidity levels compared to dry pollination methods [6]. Optimal pollen viability and activity uniformity within the solution are typically achieved at a temperature of 25 °C [7]. Furthermore, the continual evolution of liquid pollination technology has witnessed the development of various spraying apparatuses [8], marking a trajectory towards enhanced operational efficacy and widespread adoption within the agricultural landscape.
In the process of delivering pollinators to the stigmas through spraying equipment, aerosol parameters such as spraying pressure, liquid flow, and spraying distance wield significant influence over pollen deposition and activity, thereby shaping the fruit yield and quality [9,10]. With the burgeoning advancements in agricultural machinery, unmanned aerial vehicles (UAVs) have emerged as a novel and increasingly indispensable tool, owing to their enhanced intelligence and practical applicability. Notably, UAVs have demonstrated remarkable success in pollinating various fruit trees, including kiwifruit, apple, pear, and date palm [11,12], with UAV liquid pollination standing out for its close resemblance to natural pollination methods. Leveraging robust airflow fields, UAVs effectively disrupt canopy structures and facilitate pollen dispersal while preserving pollen viability [13]. Previous studies on UAV-based liquid pollination have scrutinized a gamut of factors such as flight altitude, velocity gradient, nozzle atomization particle size, spray volume, and flight trajectory, elucidating their impact on pear fruit set rates [14]. Of particular significance, flight altitude and speed emerge as pivotal determinants, profoundly influencing pollination efficacy through their modulation of droplet density and area coverage [15]. Nevertheless, ascertaining the optimal flight parameters tailored to specific orchard conditions represents just the preliminary phase in establishing a viable liquid pollination system. In the realm of UAV liquid pollination, scant attention has been devoted to unraveling the intricate interplay between pear tree physiology and pollination parameters during the critical pollination period [16], as well as the impact of such UAV-based pollination on the efficiency and costs of subsequent fruit thinning operations, warranting further exploration and empirical inquiry. Reducing tree load is a necessary management measure to maximize fruit quality and economic benefits [17]. Adverse weather conditions during the pear blooming period can lead to low yields, making the reduction in young fruit a common thinning practice [18]. Fruit thinning typically occurs during the early stages of fruit growth and involves complex operations that require significant labor costs [19]. Therefore, we cannot evaluate pollination effectiveness based solely on fruit set rates; instead, it should be assessed from the perspective of comprehensive management costs.
This study aims to optimize the parameters of UAV liquid pollination technology in a specific orchard setting, thereby enhancing its management efficacy. Focusing on the deposition efficiency and uniformity of droplet distribution, thereby providing data support for the selection and optimization of the application parameters for pear trees using UAVs. It elucidates the impact of UAV liquid pollination on the biological characteristics of pear trees and fruit yield, assessing the inherent correlations between pollination parameters, the effectiveness of UAV liquid pollination, the efficiency of subsequent fruit thinning operations, and the overall management costs in pear orchards. Finally, these results could be used to establish a robust theoretical framework for devising precise management strategies for UAV-assisted liquid pollination in pear orchards.

2. Materials and Methods

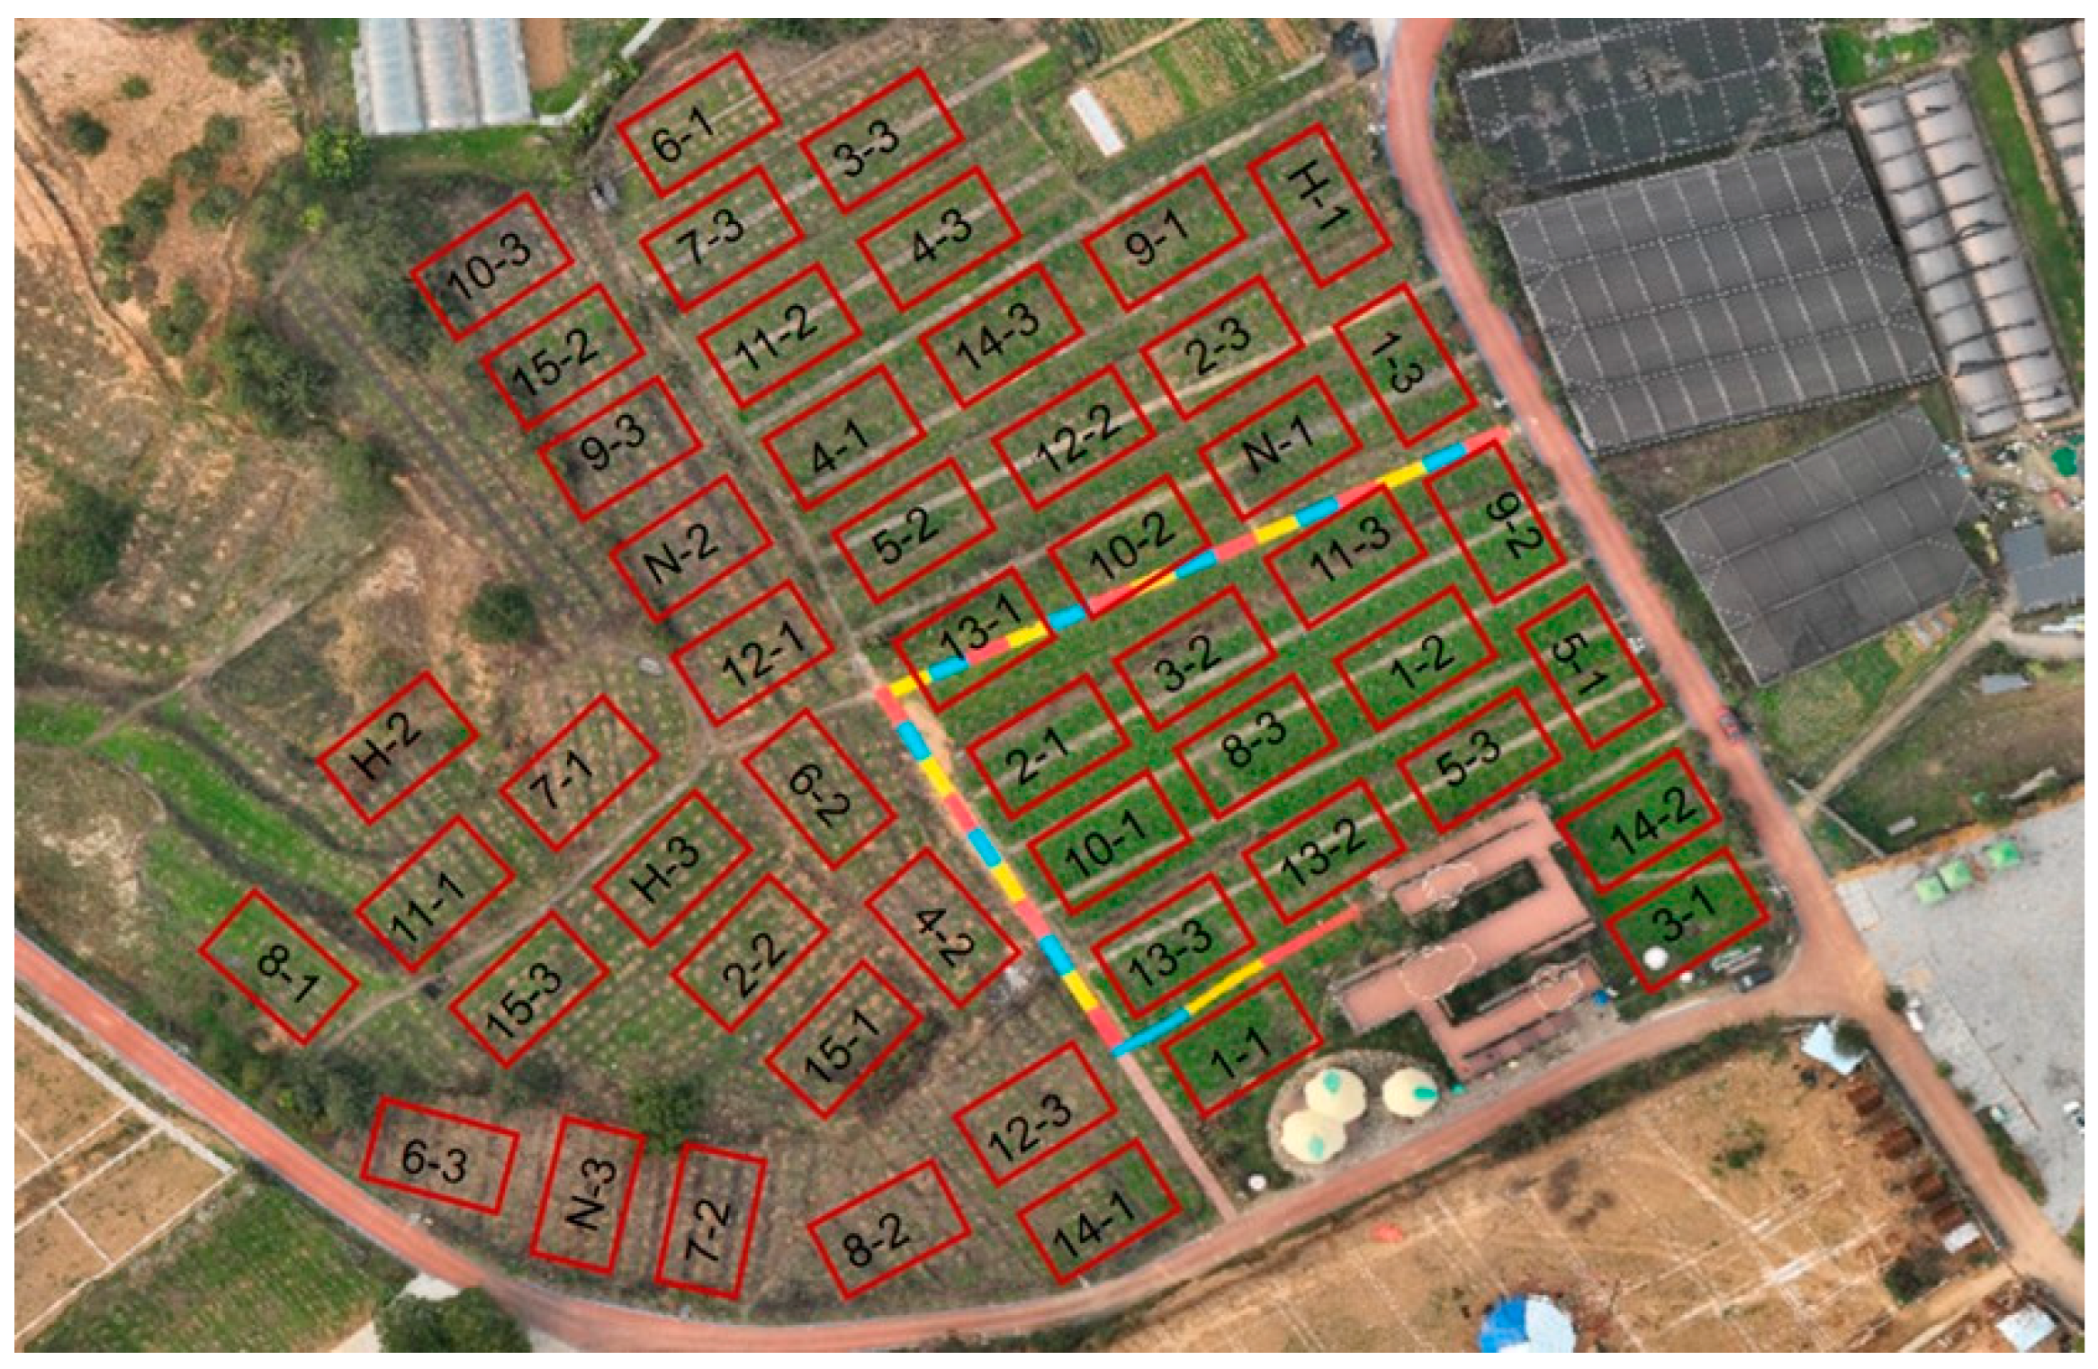
2.1. Experimental Site

The test of droplet deposition in the canopy was completed during the 2022–2023 growing season of pear trees and the test of liquid pollination was conducted in the following season of 2023–2024, within a 30-year-old “Huangguan” pear orchard situated in the renowned pear-producing region of Mountain Cucumber (Chongqing, China) (105°25′ N; 29°25′ E). The orchard, nestled at an altitude of 600 m above sea level, spans an expanse of 6.67 hectares (Figure 1). Characterized by an average annual temperature of 17.3 °C and an annual precipitation of 898 mm, the local climate significantly influences the crop’s growth dynamics. A comprehensive overview of the pertinent crop parameters is shown in Table 1.

2.2. Equipment

The tested UAV T25 (Shenzhen DJI Technology Co., Ltd., Shenzhen, China) was employed for the present tests. Characterized by a compact, folding configuration, the DJI T25 agricultural UAV offers versatility in its payload capacity, accommodating either a duo of centrifugal sprayers or a quartet thereof. Furthermore, it is furnished with a state-of-the-art active phased array radar system, dual sets of binocular vision sensors, and a posterior phased array radar module. Collectively, these advanced features empower the UAV to continuously surveil and promptly respond to its operational surroundings, ensuring comprehensive 360-degree omnidirectional obstacle detection and intelligent circumnavigation functionalities. The principal technical specifications of the T25 UAV are tabulated in Table 2 for reference. During UAV spraying operations, to mitigate the adverse effects of weather on spraying performance, wind velocity is recorded using a portable anemometer (Deli Tools Co., Ltd., Hangzhou, China), while air temperature and field humidity are measured with a RC-5 Temperature Recorder (Shanghai Yongshi Electronics Co., Ltd., Shanghai, China).

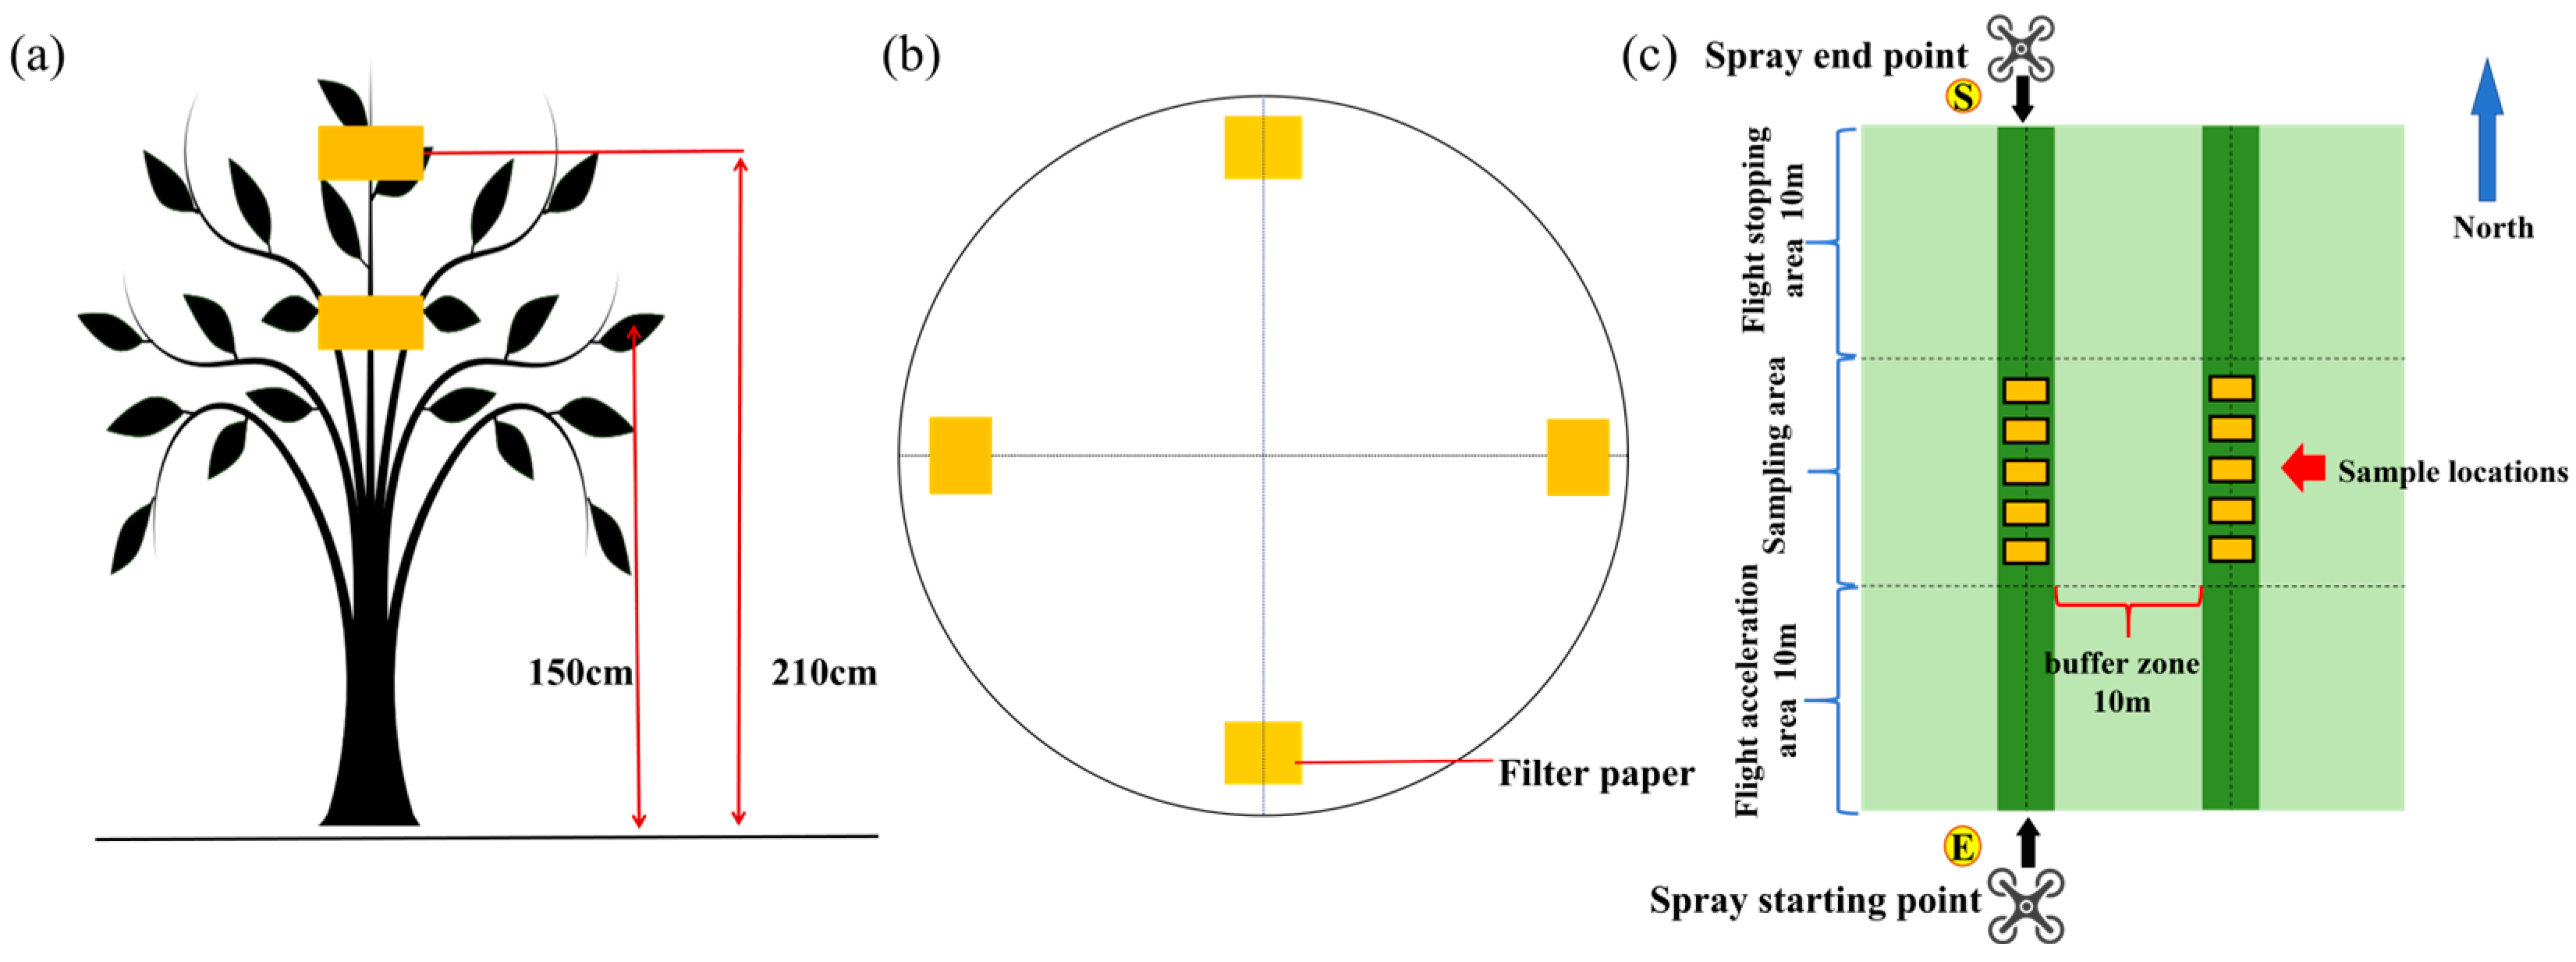
2.3. Test of Droplet Deposition in Canopy under Different Flight Parameters

An evaluation of the influence exerted by droplet deposition under diverse operational parameters of the unmanned aerial vehicle (UAV) was conducted on 14 October 2022, under meteorological conditions characterized by a field temperature of 20.0 °C, wind velocity of 0.5 m s−1, and an average relative humidity of 70%. Moreover, 50 × 90 mm filter papers were employed as collection media to quantify the droplets deposition on leaf surfaces at two distinct locations. Table 3 presents the relevant parameters for the test of droplet deposition within the tree canopy. At each sampling point, the filter papers were affixed to the leaves utilizing double-ended clips, positioned at two disparate plant heights: 150 cm and 210 cm above ground level (Figure 2a). The spatial disposition and localization of the filter papers on pear foliage are illustrated in Figure 2b, and the whole experimental area was divided into a flight acceleration area, sampling zones, and a flight stopping area, with 10-meter-wide buffer zones maintained between different treatment plots (Figure 2c). In adherence to the five-point sampling methodology, five trees were meticulously chosen for investigative scrutiny within the confines of the treatment subplots.
The spray solution was an aqueous solution with a mass fraction of 0.5% prepared with edible sunset red pigment (Gangdong Food Co., Ltd., Guangzhou, China). After spraying, the filter paper was collected according to different treatment categories and scanned in the laboratory with a ScanShell 800N handheld scanner (CSSN, Inc., Los Angeles, CA, USA) with a resolution of 600 dpi, and the scan results were analyzed with ImageJ software for droplet size DV0.1, DV0.5, and DV0.9 (μm), droplet density (amount·cm−2), and area coverage (%) and deposition rate (μL·cm−2) and coefficient of variation (CV) were also calculated. The smaller the CV value, the more uniform the droplet deposition. DV0.1, DV0.5, and DV0.9 indicate that the accumulation of all droplets from small to large is equal to 10%, 50%, and 90% of the total volume of droplets; especially, DV0.5 is an important indicator of droplet size. The image processing process used in this study was similar to that described in [20]. To guarantee the accuracy of the collected data, each processing was repeated three times.

2.4. Test on the Effect of Different Floral Stages and Spraying Frequency on Fruit Set Rate

A test was carried out during 14–17 March 2023, which is within the local pear pollination season. The liquid pollination parameters of the UAV, alongside the corresponding date, air temperature, wind velocity, and humidity under different parameter configurations, are systematically detailed in Table 4. Commencing on 13 March 2023, the progression of floral development within the orchard was meticulously monitored. Every two hours, we surveyed the flowering grades by employing the five-point sampling method to select 5 trees, and on each tree, we examined 100 or more flowers distributed across 4 branches extending in different directions, recording the proportion of fully open flowers. The temperature and humidity were the averages collected near the pear orchard. Then, we categorized the distinct floral stages of the pear orchard into varying flowering grades and matched them with spraying frequency as part of the UAV liquid pollination treatment. Two dedicated treatments were earmarked as controls for natural pollination (N-P) and manual hand pollination (H-P), respectively. The field layout diagram for all experimental treatment plots is illustrated in Figure 3. In the case of N-P, no human intervention was exercised, allowing for spontaneous pollination processes to occur naturally. The pollen source utilized for both UAV liquid pollination and hand pollination was sourced from a commercial supplier (Wu’an Fruit Planting Professional Cooperative, Chongqing, China) and was preserved at a refrigerated temperature of −18 °C. For the execution of hand pollination, the duration of the procedure was aligned with the customary practices of local farmers. The dry pollination technique entailed preparing a homogeneous blend of pollen and glucose in a 1:6 ratio, which was then meticulously applied using a brush.
When preparing the pollen solution, first, 10 g of xanthan gum (HEOWNS Biochem Technologies LLC., Tianjin, China) was gradually added to 5 L boiling water and stirred continuously. Similarly, 6.5 kg of granulated sugar were dissolved in 5 L of hot water. These two prepared solutions were then combined in a 50 L fixed-volume tank. Separately, 25.0 g of calcium nitrate (Chongqing Yuexiang Chemical Co., Ltd., Chongqing, China) and 5.0 g boric acid (Chongqing Yuexiang Chemical Co., Ltd., Chongqing, China) were put into a smaller container, thoroughly mixed and dissolved, before being added to the combined solution. Finally, water was added to the fixed-volume tank to bring the total volume of the mixture up to 50 L. As an illustration, Table 5 shows the content of various components for the 50 L pollen solution. The UAV flight parameters were set based on the results of the droplet deposition tests. A comprehensive field assessment of the fruit set rate ensued on 30 March 2023. To ensure the utmost precision in the gathered data, every treatment underwent replication in triplicate. The calculation of the fruit set rate adheres to the following formula:
F r u i t   s e t   r a t e % = F R / F L × 100
where FR is the total number of final fruit sets on the investigated shoots; FL is the total number of flowers on the investigated shoots.

2.5. Investigation of the Efficiency and Cost of Fruit Thinning Operations

Thinning work commenced on 20 April 2023, with fruit set rate in various treatments categorized into three levels: 40~50%, 50~60%, and 60~70%. The work was carried out by teams of five individuals, all of whom were locally experienced fruit thinning workers. The efficiency of thinning was assessed across the different fruit set rate categories, expressed in hectares per hour (ha·h−1), with the reported results representing the average values for three distinct survey groups. Additionally, labor costs associated with thinning operations were investigated through site visits to 10 representative pear orchards. The average cost derived from these visits served as the benchmark for calculating the cost savings realized under varying fruit set rates.

2.6. Data Statistics and Processing

Data were statistically analyzed using the SPSS version 26 (SPSS Inc., Chicago, IL, USA). The impacts of floral stage and spraying frequency on the fruit set rate were analyzed with two-way analysis of variance (ANOVA). All treatments were compared using the LDS test (p < 0.05). The images and experiment plots were drawn using Origin2022.

3. Results

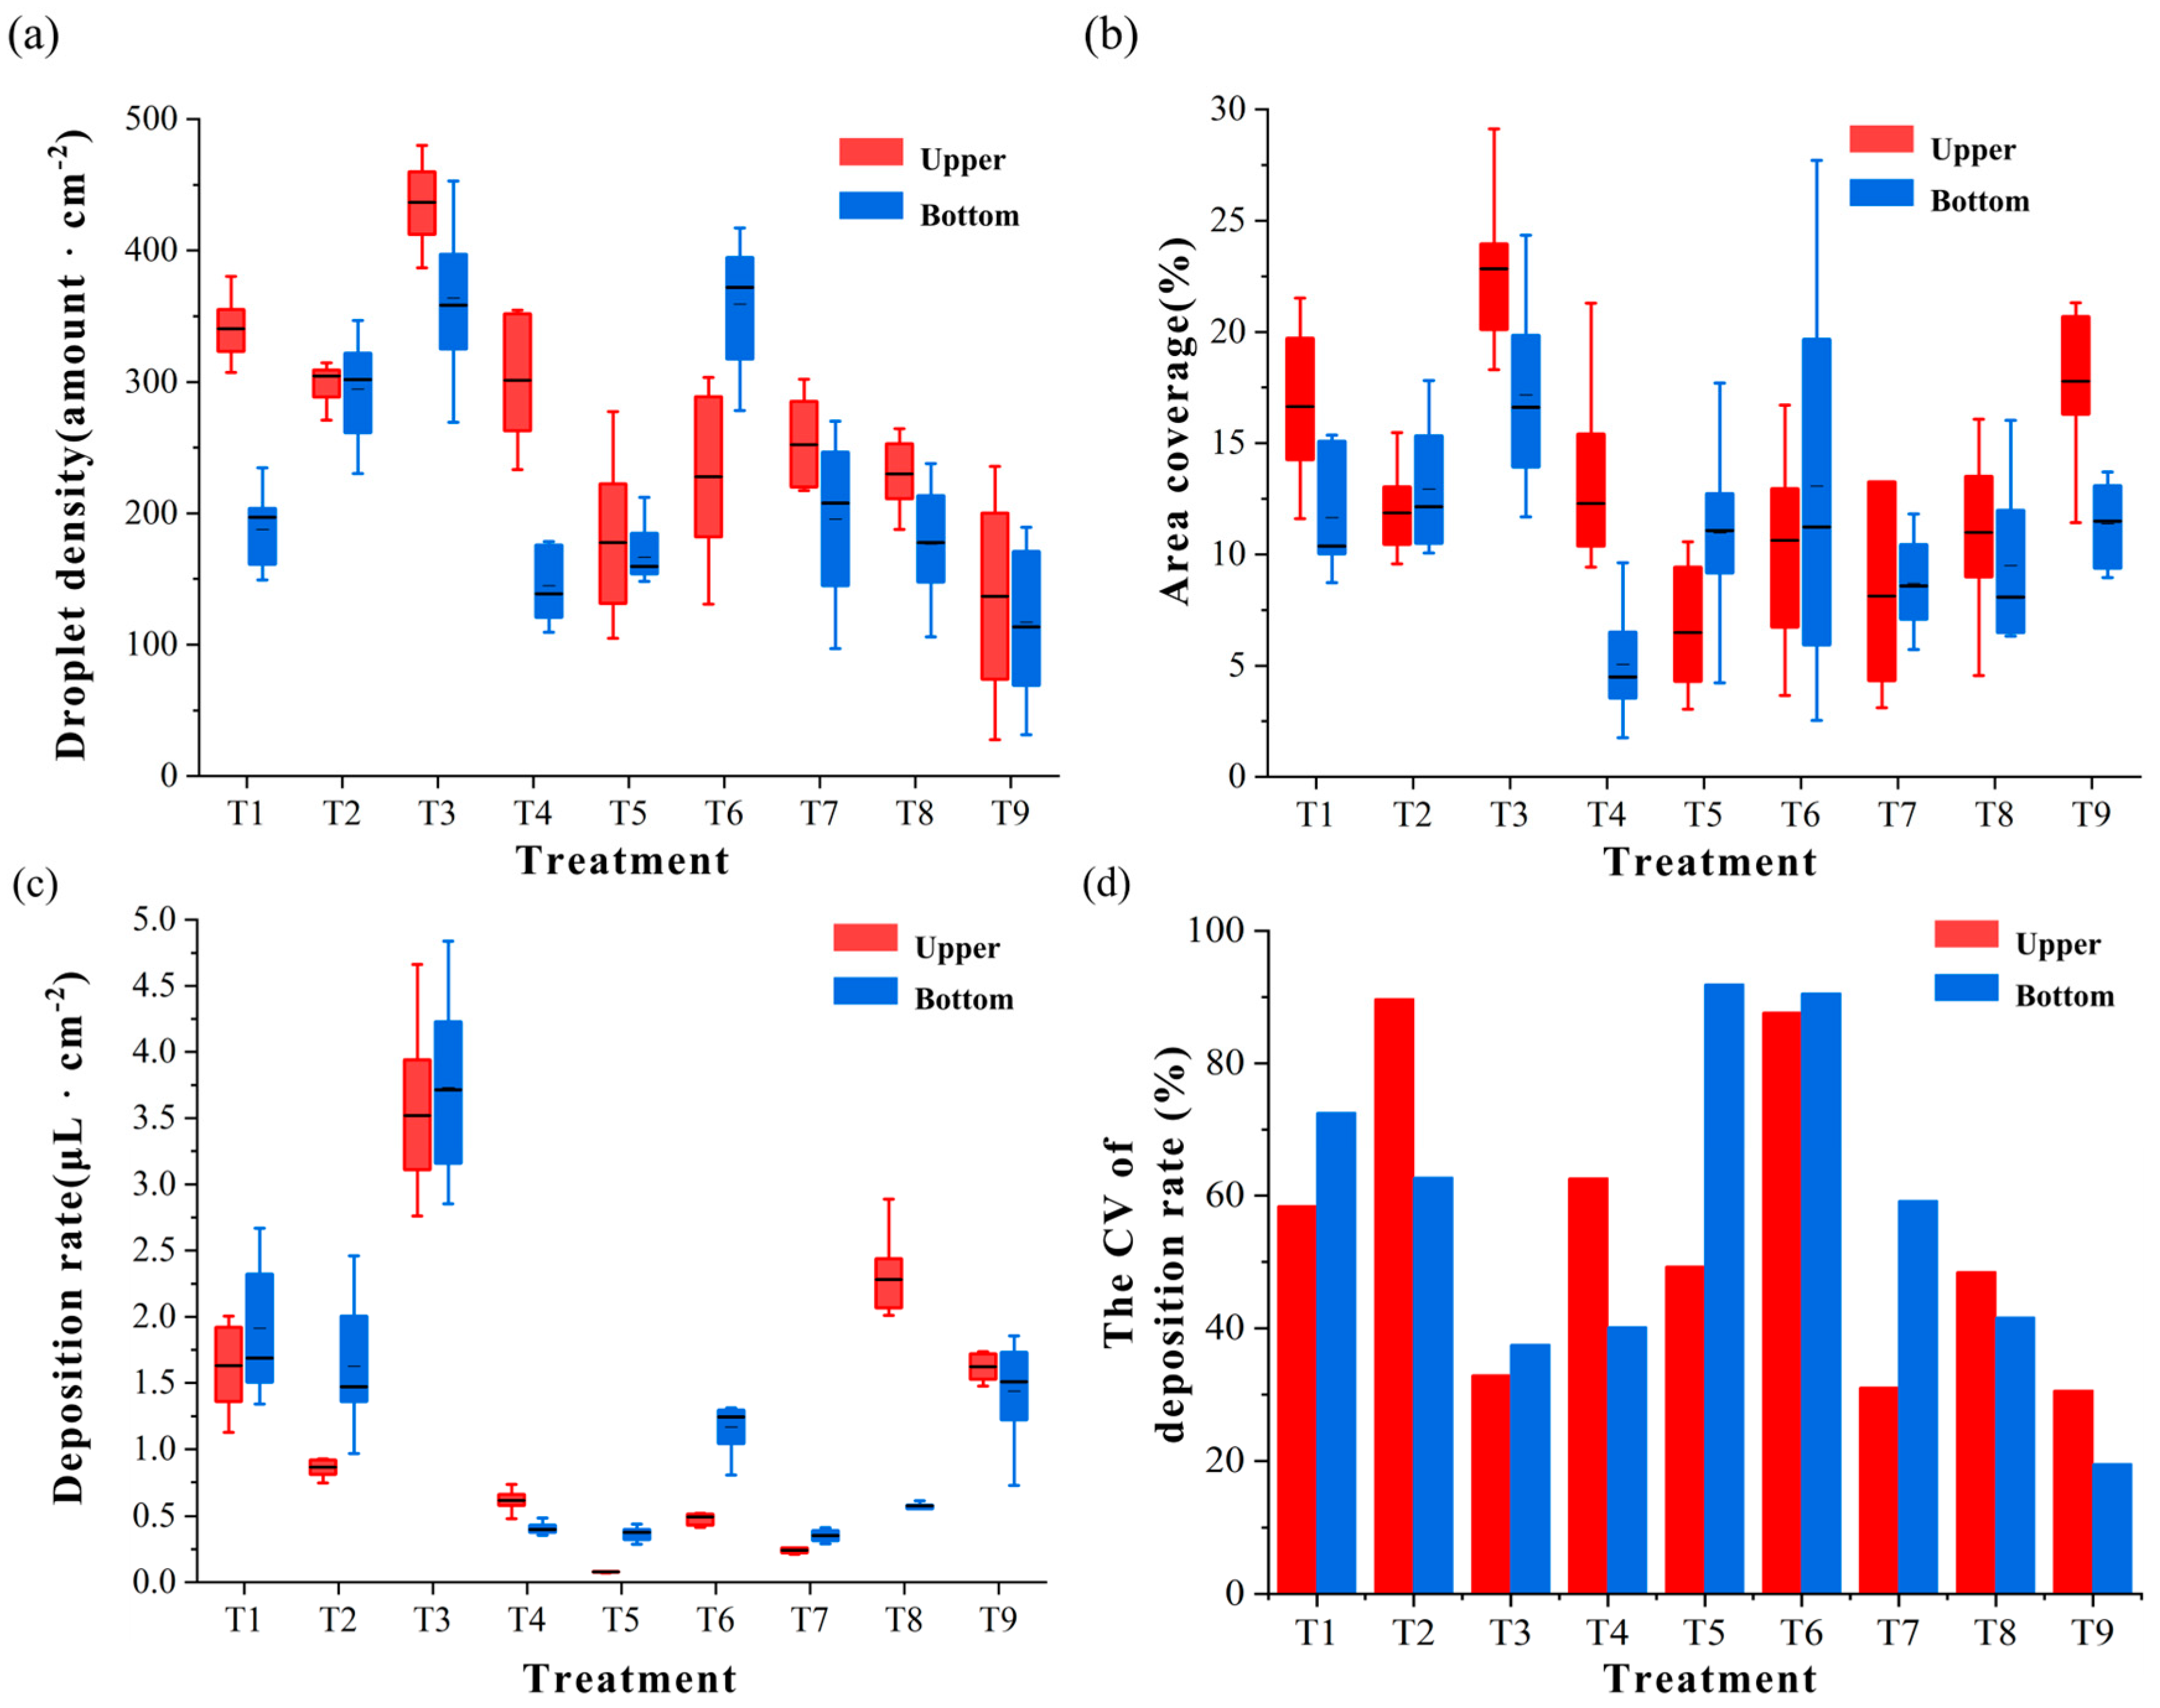
3.1. Analysis of Spray Droplet Deposition Characteristics and Selection of Optimal Operating Parameter Combinations

Filter paper was placed on the leaf at 210 cm and 150 cm above the ground level. The sampling locations were divided into upper and bottom layers. Each sample was scanned using DepositScan software to obtain droplet deposition information. The droplet density, area coverage, deposition rate, and CV values of the deposition rate of the upper and lower layers of different treatments are shown in Figure 4. The droplet size of each sample is presented in Table 6. Among them, the highest droplet deposition density was observed when the FH was set at 1.5 m and the FS was 2 m s−1 (436.61 ± 8.54 amount·cm−2, 336.45 ± 10.40 amount·cm−2), and under these conditions, it can be seen that the highest area coverage and deposition rate were 27.33 ± 1.24% and 3.51 ± 0.46 μL·cm−2 in the upper layers and 17.83 ± 8.87% and 2.80 ± 0.33 μL·cm−2 in the lower layers. With a smaller coefficient of variation (CV), the distribution of spray droplets is more uniform. The optimal droplet penetration was assessed based on the coefficient of variation, with the upper layer exhibiting the best droplet penetration performance, achieving a CV for the deposition rate of 30.59%, compared to 19.54% in the lower layer (Figure 4d). To achieve a uniform and effective distribution of droplets across the tree canopy, based on a comprehensive evaluation of various metrics, the UAV liquid pollination flight parameters can be set an FH of 1.5 m and an FS of 2 m·s⁻1.

3.2. Results of Floral Stage and Spraying Frequency on Fruit Set Rate

Our study found that when the spray frequency was set to two times, the fruit set rate was lower compared to hand pollination. During stages II (15% ≤ flowering rate ≤ 30%) and III (30% ≤ flowering rate ≤ 50%), a spray frequency exceeding two times resulted in a fruit set rate significantly higher than the 61.44% achieved through hand pollination. All liquid pollination treatments resulted in fruit set rates significantly higher than the 28.67% achieved through natural pollination. Additionally, liquid pollination using UAV was found to meet production needs, with fruit set rates ranging from 47.32% to 70.36% as shown in Figure 5. The fruit set rate was observed to increase with the number of sprayings when the flowering grade was II (15% ≤ flowering rate ≤ 30%) and III (30% ≤ flowering rate ≤ 50%). However, once the flowering grade exceeded IV (50% ≤ flowering rate ≤ 70%), the relationship between spraying frequency and fruit set rate changed. Despite increasing the spraying frequency, the fruit set rate did not continue to increase. It was also noted that at different floral stages, there was no evidence of the spray amount surpassing the optimal level and causing a reduction in the fruit set rate.
A two-way analysis of variance was used to verify the significant effects of different floral grades and spraying times on the fruit set rate of UAV liquid pollination. As shown in Table 7, Different floral stages and spraying frequency had a significant effect on fruit set rate (p < 0.01), and the interaction between floral stage and spraying frequency also had a significant effect on fruit set rate (p < 0.01).

3.3. Efficiency and Cost Inputs of Fruit Thinning under Different Fruit Set Rates

Variations in pollination parameters result in differing proportions of fruit clusters containing different numbers of fruits (Figure 6), consequently impacting the efficiency of thinning operations. In accordance with local fruit thinning practices, approximately 40 to 50 fruit clusters were retained per tree, with each cluster ultimately nurturing only one fruit, to ensure both optimal fruit yield and the highest quality. Apart from natural pollination, all pollination treatments were able to achieve the fruit set necessary to meet production requirements. When fruit set was maintained within the range of 40% to 50%, fruit thinning costs can be reduced by 35.29% (Table 8).

4. Discussion

The level of droplet deposition is intimately related to the adequacy of liquid pollination, which in turn affects the fruit set and the incidence of fruit malformation, thereby impacting the overall yield and quality of the orchard [21]. Thus, optimizing unmanned aerial vehicle (UAV) operational parameters in accordance with the distinct canopy architecture of fruit trees is pivotal for achieving efficacious applications [12,22]. Within the context of our study, conducted in a horizontally trellised pear orchard, the spatial distribution of droplet deposition varied notably at diverse heights within the canopy when subjected to different horizontal FS and FH. Specifically, at an FH of 1.5 m, the recorded droplet densities in both the superior and inferior canopy strata surpassed those observed at 2 and 3 m, reinforcing prior observations [23]. This phenomenon was attributed to the complex interplay between horizontal and vertical airflows induced by rotor activity at lower altitudes, leading to droplet fragmentation and redistribution [24]. Notably, an anomaly was detected exclusively at an FS of 3 m, where the upper canopy’s area coverage augmented with escalating FS (Figure 4b), contradicting the trend of diminished coverage with enhanced FS [25]. This inconsistency may be ascribed to design disparities between single-rotor and multi-rotor UAV platforms. While conventional wisdom suggests a predominance of deposit accumulation in the upper canopy over the lower, Figure 3 depicts a deviation from this across various conditions. This discrepancy potentially arises from the unique, flattened canopy morphology of the studied orchard, where the intensified downwash effect from the UAV engenders more substantial canopy disturbance, thereby positively influencing the pollination process [26].
Pollination is a crucial process in the sexual reproduction of crops; the developmental and physiological characteristics of floral structures vary at different stages and play a key role in defining the parameters for various pollination systems [27,28]. The developmental and physiological attributes of floral structures play a pivotal role in defining pollination parameters [29]. Fertilization success is augmented post-adherence of pollen grains to the stigma, a process triggered by the enzymatic activity and exudates present on the stigma surface [30]. Investigative work on the Rosaceae genus has illuminated that, within 2–4 days post-anthesis, there is a surge in stigma-bound oxidase activities and mucilage secretion [31]. Receptivity of the stigma fluctuates in concert with the flowering progression, witnessing reduced receptivity at initial blooming stages and heightened degradation at advanced bloom, which explicates the diminished fruit set rate observed in stages I (flowering rate ≤ 15%), IV (50% ≤ flowering rate ≤ 70%), and V (flowering rate ≥ 70%). By contrast, stages II (15% ≤ flowering rate ≤ 30%) and III (30% ≤ flowering rate ≤ 50%) manifested peak fruit set under equivalent environmental conditions, underscoring the optimized pollen reception ability in flowers with intermediate flowering percentages [29]. To guarantee crop yield, in conjunction with pollinating during optimal flowering periods to amplify fruit set, augmenting pollen deposition on pear trees via repetitive liquid pollination represents a central strategy. Despite advances in understanding the threshold levels for stigma pollen deposition through studies on bee management practices and alternative orchard pollination methodologies [12,32,33], the specific impacts of spray frequency of liquid pollination on pear orchard productivity have yet to be systematically investigated. Elevating the spray frequency can moderately enhance fruit set [34] by stimulating an elevation in endogenous gibberellic acid concentrations within plants, thereby facilitating an enhancement in the endogenous levels of gibberellic acid within plants, which in turn promotes the growth of pollen tubes and fosters subsequent fruit development stages [35]. Conversely, overapplication of liquid sprays can precipitate an accumulation of residual fluid, hindering pollen adhesion to the stigma and ultimately depreciating fruit set percentages, concurrently incurring economic inefficiencies [6]. The present study disclosed that an increase in spray frequency significantly bolsters fruit set only when the flowering stages are at Level II (15% ≤ flowering rate ≤ 30%) and Level III (30% ≤ flowering rate ≤ 50%). This outcome is potentially augmented by concurrent thermal influences and insect-mediated pollination activities [36,37], thereby amplifying the beneficial effects of increased spraying frequency on fruit set. Notably, during flowering stages II (15% ≤ flowering rate ≤ 30%) and III (30% ≤ flowering rate ≤ 50%), field temperatures are maintained at 25 °C, aligning with the recommendation for spraying pollination that the temperature of the pollen suspension or ambient environment should ideally be 25 °C [38]. In summary, pollination parameters, including the timing and frequency of pollination, can effectively control the fruit set rate.
Thinning can prevent biennial bearing and improves fruit quality, which constitutes an indispensable horticultural practice in pear orchard management. Currently, fruit thinning in pear orchards heavily relies on manual labor [39], and in commercial settings, it is conducted in the later fruiting stages, constituting a highly labor-intensive and intricate operation with substantial costs [19]. Therefore, fruit set rate is closely related to the cost and efficiency of fruit thinning. Generally, to ensure a good commercial yield, only about 7–10% of the initial flowers need to develop into fruit [40]. Previous research on UAV liquid pollination has primarily focused on enhancing fruit set to guarantee production. In contrast, our statistical survey revealed that, using hand pollination with a fruit set rate of 61.44% as a control, over 80% of the fruits were removed during thinning. However, when the fruit set rate was controlled at 40% to 50%, production requirements were sufficiently met while effectively reducing the cost of thinning by 35.29%. Consequently, controlling pollination parameters holds practical significance for enhancing the overall cost-effectiveness and efficiency of orchard management.

5. Conclusions

UAV liquid pollination technology is a pivotal innovation in modern agricultural orchard management. In the context of industrialized pear cultivation, rising labor costs and intensifying climate change are increasing management efficiency and costs. Therefore, it is necessary to integrate each management step to meet the dual demands of yield and cost. This study explores the connection between UAV liquid pollination technology and fruit thinning operations in a specific orchard setting, aiming to achieve efficient orchard management and cost reduction. The structure of the trees and environmental conditions in the orchard influence the setting of operational parameters, which in turn affect the final outcome of the operations. Through droplet deposition testing, UAV flight parameters are set to ensure effective distribution of the pollination solution across the tree canopy, thus guaranteeing uniform and effective pollination. Our research indicates that subtle physiological changes during pear tree pollination are linked to the setting of pollination parameters, which in turn impact the final yield and costs. This empirical evidence, from the perspective of practical production, established a theoretical foundation for developing a systematic unmanned aerial vehicle (UAV) liquid pollination strategy and an integrated management system for orchards.

Author Contributions

Conceptualization, M.H., T.Z., Y.Y., H.L. and P.W.; methodology, P.W. and H.L.; validation, T.Z. and Y.Y.; formal analysis, M.H., M.L., T.Z., Y.Y., H.L. and W.X.; investigation, M.H. and M.L.; data curation, M.H. and M.L.; writing—original draft preparation, M.H. and M.L.; writing—review and editing, P.W., Y.Y., T.Z., H.L. and W.X; visualization, M.H.; supervision, P.W. and T.Z.; project administration, P.W.; funding acquisition, P.W. All authors have read and agreed to the published version of the manuscript.

Funding

This research was funded by the National Natural Science Foundation of China, grant number 32001425 and 32201651; the Fundamental Research Funds for the Central Universities (SWU-KT22024); the Natural Science Foundation of Chongqing, China, grant numbers cstc2020jcyj-msxmX0414 and cstc2020jcyj-msxmX0459; and the project of pear production chain green development granted by the Agricultural and Rural Affairs Committee of Yongchuan, Chongqing, China.

Data Availability Statement

All data are provided within the manuscript.

Acknowledgments

The authors would like to express their appreciation for Ming Zeng, Yajia Liu, Shilin Wang, Jincheng Jiang, Pingyuan Wu, Chunhua Zhang and Xiubo Xu for technical support.

Conflicts of Interest

The authors declare that they have no known competing financial interests or personal relationships that could have appeared to influence the work reported in this paper.

References

  1. Wang, G.-M.; Gu, C.; Qiao, X.; Zhao, B.-Y.; Ke, Y.-Q.; Guo, B.-B.; Hao, P.-P.; Qi, K.-J.; Zhang, S.-L. Characteristic of pollen tube that grew into self style in pear cultivar and parent assignment for cross-pollination. Sci. Hortic. 2017, 216, 226–233. [Google Scholar] [CrossRef]
  2. Dinis, A.M.; Mesquita, J.F. Uptake of heavy metal salt solutions by pollen grains of Magnolia × soulangeana (Magnoliaceae). Can. J. Bot. 2004, 82, 1758–1767. [Google Scholar] [CrossRef]
  3. Sakamoto, D.; Hayama, H.; Ito, A.; Kashimura, Y.; Moriguchi, T.; Nakamura, Y. Spray pollination as a labor-saving pollination system in Japanese pear (Pyrus pyrifolia (Burm. f.) Nakai): Development of the suspension medium. Sci. Hortic. 2009, 119, 280–285. [Google Scholar] [CrossRef]
  4. Kumawat, P.; Rathore, R.S.; Singh, R.P.; Kumar, S. Study the effect of different pollination techniques on date palm production. Sugar Tech 2022, 24, 1887–1893. [Google Scholar] [CrossRef]
  5. Karimi, H.R.; Mohammadi, N.; Estaji, A.; Esmaeilizadeh, M. Effect of supplementary pollination using enriched pollen suspension with Zn on fruit set and fruit quality of pistachio. Sci. Hortic. 2017, 216, 272–277. [Google Scholar] [CrossRef]
  6. Tacconi, G.; Michelotti, V.; Cacioppo, O.; Vittone, G. Kiwifruit pollination: The interaction between pollen quality, pollination systems and flowering stage. J. Berry Res. 2016, 6, 417–426. [Google Scholar] [CrossRef]
  7. Liu, L.; Liu, Z.; Han, H.; Jiang, Y.; He, X.; Liu, Y.; Wang, D.; Guo, X.; Liang, Z. Influence of Different Liquid Spray Pollination Parameters on Pollen Activity of Fruit Trees—Pear Liquid Spray Pollination as an Example. Horticulturae 2023, 9, 350. [Google Scholar] [CrossRef]
  8. Jin, Y.; Liu, J.; Xu, Z.; Yuan, S.; Li, P.; Wang, J. Development status and trend of agricultural robot technology. Int. J. Agric. Biol. Eng. 2021, 14, 1–19. [Google Scholar] [CrossRef]
  9. Guo, S.; Li, J.; Yao, W.; Zhan, Y.; Li, Y.; Shi, Y. Distribution characteristics on droplet deposition of wind field vortex formed by multi-rotor UAV. PLoS ONE 2019, 14, e0220024. [Google Scholar] [CrossRef]
  10. Broussard, M.A.; Coates, M.; Martinsen, P. Artificial pollination technologies: A review. Agronomy 2023, 13, 1351. [Google Scholar] [CrossRef]
  11. Wang, Y.; Bai, R.; Lu, X.; Quan, S.; Liu, Y.; Lin, C.; Wei, J.; Su, Y.; Yao, R. Pollination parameter optimization and field verification of UAV-based pollination of ‘Kuerle Xiangli’. Agronomy 2022, 12, 2561. [Google Scholar] [CrossRef]
  12. Mahmud, M.S.; He, L.; Heinemann, P.; Choi, D.; Zhu, H. Unmanned aerial vehicle based tree canopy characteristics measurement for precision spray applications. Smart Agric. Technol. 2023, 4, 100153. [Google Scholar] [CrossRef]
  13. Xiongkui, H.; Bonds, J.; Herbst, A.; Langenakens, J. Recent development of unmanned aerial vehicle for plant protection in East Asia. Int. J. Agric. Biol. Eng. 2017, 10, 18–30. [Google Scholar] [CrossRef]
  14. Huang, X.; Dong, X.; Ma, J.; Liu, K.; Ahmed, S.; Lin, J.; Ahmad, F.; Qiu, B. Evaluation and experiment of flight parameter quality of the plant protection UAV based on laser tracker. Agriculture 2021, 11, 628. [Google Scholar] [CrossRef]
  15. Zhang, S.; Qiu, B.; Xue, X.; Sun, T.; Gu, W.; Zhou, F.; Sun, X. Effects of crop protection unmanned aerial system flight speed, height on effective spraying width, droplet deposition and penetration rate, and control effect analysis on wheat aphids, powdery mildew, and head blight. Appl. Sci. 2021, 11, 712. [Google Scholar] [CrossRef]
  16. Wu, S.; Liu, J.; Lei, X.; Zhao, S.; Lu, J.; Jiang, Y.; Xie, B.; Wang, M. Research progress on efficient pollination technology of crops. Agronomy 2022, 12, 2872. [Google Scholar] [CrossRef]
  17. Guerra, M.; Álvarez-Taboada, F.; Marabel, V.; Felices, A.M.; Rodríguez-González, Á.; Casquero, P.A. Organic Agricultural Practice: Crop Load Management Enhancing Quality and Storability of High-Russet Pears. Horticulturae 2024, 10, 686. [Google Scholar] [CrossRef]
  18. Wójcik, P. Quality and ‘Conference’pear storability as influenced by preharvest sprays of calcium chloride. J. Plant Nutr. 2012, 35, 1970–1983. [Google Scholar] [CrossRef]
  19. Sidhu, R.S.; Bound, S.A.; Hunt, I. Crop load and thinning methods impact yield, nutrient content, fruit quality, and physiological disorders in ‘Scilate’ apples. Agronomy 2022, 12, 1989. [Google Scholar] [CrossRef]
  20. Dengeru, Y.; Ramasamy, K.; Allimuthu, S.; Balakrishnan, S.; Kumar, A.P.M.; Kannan, B.; Karuppasami, K.M. Study on spray deposition and drift characteristics of UAV agricultural sprayer for application of insecticide in redgram crop (Cajanus cajan L. Millsp.). Agronomy 2022, 12, 3196. [Google Scholar] [CrossRef]
  21. Matsumoto, S.; Soejima, J.; Maejima, T. Influence of repeated pollination on seed number and fruit shape of ‘Fuji’ apples. Sci. Hortic. 2012, 137, 131–137. [Google Scholar] [CrossRef]
  22. Awais, M.; Li, W.; Cheema, M.J.M.; Hussain, S.; AlGarni, T.S.; Liu, C.; Ali, A. Remotely sensed identification of canopy characteristics using UAV-based imagery under unstable environmental conditions. Environ. Technol. Innov. 2021, 22, 101465. [Google Scholar] [CrossRef]
  23. Qin, W.-C.; Qiu, B.-J.; Xue, X.-Y.; Chen, C.; Xu, Z.-F.; Zhou, Q.-Q. Droplet deposition and control effect of insecticides sprayed with an unmanned aerial vehicle against plant hoppers. Crop Prot. 2016, 85, 79–88. [Google Scholar] [CrossRef]
  24. Chen, S.D.; Lan, Y.; Li, J.Y.; Zhou, Z.Y.; Liu, A.M.; Mao, Y.D. Effect of wind field below unmanned helicopter on droplet deposition distribution of aerial spraying. Int. J. Agric. Biol. Eng. 2017, 10, 67–77. [Google Scholar] [CrossRef]
  25. Ahmad, F.; Qiu, B.; Dong, X.; Ma, J.; Huang, X.; Ahmed, S.; Chandio, F.A. Effect of operational parameters of UAV sprayer on spray deposition pattern in target and off-target zones during outer field weed control application. Comput. Electron. Agric. 2020, 172, 105350. [Google Scholar] [CrossRef]
  26. Wang, C.; He, X.; Bonds, J.; Qi, P.; Yang, Y.; Guo, W. Effect of downwash airflow field of octocopter plant protection UAV on droplet deposition distribution characteristics under different flight parameters. Smart Agric. 2020, 2, 124–136. [Google Scholar] [CrossRef]
  27. Garibaldi, L.A.; Carvalheiro, L.G.; Leonhardt, S.D.; Aizen, M.A.; Blaauw, B.R.; Isaacs, R.; Kuhlmann, M.; Kleijn, D.; Klein, A.M.; Kremen, C. From research to action: Enhancing crop yield through wild pollinators. Front. Ecol. Environ. 2014, 12, 439–447. [Google Scholar] [CrossRef]
  28. Fotirić Akšić, M.; Cerović, R.; Hjeltnes, S.H.; Meland, M. The effective pollination period of European plum (Prunus domestica L.) cultivars in western Norway. Horticulturae 2022, 8, 55. [Google Scholar] [CrossRef]
  29. Tominaga, A.; Ito, A.; Sugiura, T.; Yamane, H. How is global warming affecting fruit tree blooming? “Flowering (dormancy) disorder” in Japanese pear (Pyrus pyrifolia) as a case study. Front. Plant Sci. 2022, 12, 787638. [Google Scholar] [CrossRef]
  30. Losada, J.M.; Herrero, M. Arabinogalactan-protein secretion is associated with the acquisition of stigmatic receptivity in the apple flower. Ann. Bot. 2012, 110, 573–584. [Google Scholar] [CrossRef]
  31. Roeder, S.; Serra, S.; Musacchi, S. Effective pollination period and parentage effect on pollen tube growth in apple. Plants 2021, 10, 1618. [Google Scholar] [CrossRef]
  32. Page, M.L.; Williams, N.M. Honey bee introductions displace native bees and decrease pollination of a native wildflower. Ecology 2023, 104, e3939. [Google Scholar] [CrossRef]
  33. Ramírez-Mejía, A.F.; Chacoff, N.P.; Lomáscolo, S.B.; Woodcock, B.A.; Schmucki, R.; Blendinger, P.G. Optimal pollination thresholds to maximize blueberry production. Agric. Ecosyst. Environ. 2024, 365, 108903. [Google Scholar] [CrossRef]
  34. Harder, L.D.; Aizen, M.A.; Richards, S.A. The population ecology of male gametophytes: The link between pollination and seed production. Ecol. Lett. 2016, 19, 497–509. [Google Scholar] [CrossRef] [PubMed]
  35. Zhang, C.; Tateishi, N.; Tanabe, K. Pollen density on the stigma affects endogenous gibberellin metabolism, seed and fruit set, and fruit quality in Pyrus pyrifolia. J. Exp. Bot. 2010, 61, 4291–4302. [Google Scholar] [CrossRef] [PubMed]
  36. Sanzol, J.; Rallo, P.; Herrero, M. Stigmatic receptivity limits the effective pollination period in ‘Agua de Aranjuez’ pear. J. Am. Soc. Hortic. Sci. 2003, 128, 458–462. [Google Scholar] [CrossRef]
  37. Dötterl, S.; Gershenzon, J. Chemistry, biosynthesis and biology of floral volatiles: Roles in pollination and other functions. Nat. Prod. Rep. 2023, 40, 1901–1937. [Google Scholar] [CrossRef] [PubMed]
  38. Liu, L.; Liu, Z.; Han, H.; Qiao, B.; Li, Y.; He, X.; Liu, Y. Effect of Pre-Germination Temperature Regime on Pollen Germination and Fruit Set in Pear, Pyrus bretschneiderilia. Horticulturae 2023, 9, 1151. [Google Scholar] [CrossRef]
  39. Lei, X.; Yuan, Q.; Xyu, T.; Qi, Y.; Zeng, J.; Huang, K.; Sun, Y.; Herbst, A.; Lyu, X. Technologies and Equipment of Mechanized Blossom Thinning in Orchards: A Review. Agronomy 2023, 13, 2753. [Google Scholar] [CrossRef]
  40. Hussain, M.; He, L.; Schupp, J.; Lyons, D.; Heinemann, P. Green fruit segmentation and orientation estimation for robotic green fruit thinning of apples. Comput. Electron. Agric. 2023, 207, 107734. [Google Scholar] [CrossRef]
Figure 1. The geographical location of the trial site and the field operation map for UAV activities during the pear tree growing season.
Agronomy 14 02033 g001
Figure 2. Schematic diagram of the sampling point arrangements. (a) The samples were laid out at a height of 210 cm and 150 cm above the ground at the top and bottom, respectively; (b) the position of the droplet collection sample on the pear canopy; (c) the flight path of the unmanned aerial vehicle (UAV) and the layout positions of sampling points within the treatment plot.
Agronomy 14 02033 g002
Figure 3. The experimental plot layouts for the different pollination treatments illustrated in Table 4. Plots of the field test, including 15 liquid pollination treatments at different flowering stages and spraying frequency, one natural pollination (N-P) treatment, and one hand pollination (H-P) treatment; each treatment is arranged in a randomized fashion with three replicate plots.
Agronomy 14 02033 g003
Figure 4. Deposition effect of droplets under combinations of flight parameters for each treatment group as shown in Table 5 (n = 15). (a) Droplet density (amount·cm−2), (b) area coverage (%), (c) deposition rate (μL·cm−2), and (d) the CV value of the deposition rate (%). The box represents the interquartile range (IQR), with the median (black long line) indicating the second quartile (Q2) and the mean (black short line) denoted by the median line. The top and bottom of the box correspond to the third quartile (Q3) and first quartile (Q1), respectively. Straight lines extend to the maximum and minimum data values.
Agronomy 14 02033 g004
Figure 5. Fruit set rate for natural pollination, hand pollination, and different liquid pollination treatments as shown Table 4. All data were obtained from 5 randomly selected trees in 3 replicates in each treatment area, and the error bars represented the SD of fruit set rate of 15 trees, and the letters indicated that the difference between treatments was statistically significant (p < 0.05).
Agronomy 14 02033 g005
Figure 6. The fruit clusters on branches exhibit the following states: clusters bearing 2, 3, 4, 5, and 6 fruits each.
Agronomy 14 02033 g006
Table 1. Details of crop parameters.
Crop ParametersMessages
CropPear
VarietyHuangguan
Canopy featuresHorizontal trellis type
Height of crop (m)2~2.3
Row-to-row spacing (m)2.1
Plant-to-plant spacing (m)1.5
Table 2. Messages about the main performance parameters of the UAV.
ParametersValues
UAV typeDJT25
Main rotor diameter (mm−1)1270
Unfold fuselage size
(L × W × H mm−1)
2585 × 2675 × 780
Maximum wheelbase (mm−1)1925
Payload capacity (Kg−1)20
Self-weight (Kg−1)25.4
Maximum take-off weight (Kg−1)52
Power sourceBAX702-15500mAh-52.22V lithium-ion batteries
Type of nozzleLX8060SZ
Number of nozzles2
Nozzle spacing (mm−1)1368
Fogging particle size (μm−1)50–330
Effective spray range (m−1)4–7
Table 3. The test treatment designs. T1~T9 represents combinations of three different levels of FS and three distinct levels of FH.
TreatmentFH (m)FS (m·s−1)
T11.51
T21.51.5
T31.52
T421
T521.5
T622
T731
T831.5
T932
Table 4. The liquid pollination treatments via UAV and the corresponding date, air temperature, wind velocity, and humidity under different parameters in field. Treatment 1–15 represents combinations of pollination parameters involving five levels of floral stages and three levels of spraying frequencies.
TreatmentFlowering GradeSpraying TimesDateWind VelocityAir TemperatureField
Humidity
1Ⅰ (≤15%)2March 14th0.8 m·s−120 °C71%
2Ⅰ (≤15%)4March 14th0.8 m·s−120 °C71%
3Ⅰ (≤15%)6March 14th0.7 m·s−120 °C71%
4Ⅱ (15~30%)2March 15th0.6 m·s−123 °C70%
5Ⅱ (15~30%)4March 15th0.6 m·s−123 °C70%
6Ⅱ (15~30%)6March 15th0.6 m·s−123 °C70%
7Ⅲ (30~50%)2March 15th0.5 m·s−125 °C70%
8Ⅲ (30~50%)4March 15th0.5 m·s−125 °C70%
9Ⅲ (30~50%)6March 15th0.6 m·s−125 °C70%
10Ⅳ (50~70%)2March 16th0.8 m·s−120 °C74%
11Ⅳ (50~70%)4March 16th0.8 m·s−120 °C74%
12Ⅳ (50~70%)6March 16th0.8 m·s−120 °C74%
13Ⅴ (≥70%)2March 17th0.9 m·s−118 °C80%
14Ⅴ (≥70%)4March 17th0.8 m·s−118 °C80%
15Ⅴ (≥70%)6March 17th0.8 m·s−118 °C80%
Table 5. Liquid pollinator formulation and ratio (50 L).
IngredientContent (%)Volume or Mass
Water Fixed volume to 50 L
Sucrose136.5 kg
Xanthan gum0.0210 g
Calcium nitrate0.0525 g
Boric acid0.015 g
Fine pollen0.04~0.0820~40 g
Table 6. The droplet size at sampling points for each treatment as shown in Table 3. DV0.1, DV0.5, and DV0.9 indicate that the accumulation of all droplets from small to large is equal to 10%, 50%, and 90% of the total volume of droplets. “Upper” and “Bottom” represent the average droplet deposition sizes in the upper and lower layers of the canopy at each sampling point.
TreatmentPositionSpray Droplet Size (μm)
DV0.1DV0.5DV0.9
T1Upper103.56 ± 4.47169.67 ± 5.97234.22 ± 4.38
Bottom76.17 ± 6.63135.00 ± 12.08213.33 ± 9.90
T2Upper109.83 ± 2.04190.75 ± 3.16292.42 ± 4.31
Bottom95.00 ± 7.96195.11 ± 5.69286.00 ± 5.12
T3Upper92.44 ± 2.88168.00 ± 4.53262.44 ± 11.78
Bottom89.45 ± 3.97160.55 ± 13.48271.27 ± 4.53
T4Upper119.11 ± 7.86223.11 ± 15.22388.4 ± 7.78
Bottom98.57 ± 9.21194.00 ± 8.20335.71 ± 5.59
T5Upper71.33 ± 6.67113.00 ± 10.57170.00 ± 6.86
Bottom82.92 ± 7.39127.08 ± 8.84247.67 ± 7.48
T6Upper90.44 ± 7.99209.33 ± 8.89349.67 ± 12.62
Bottom92.10 ± 3.66174.50 ± 15.40319.50 ± 15.03
T7Upper106.00 ± 9.02213.00 ± 15.39288.33 ± 17.85
Bottom97.17 ± 6.73183.00 ± 5.04328.50 ± 7.28
T8Upper84.25 ± 2.25134.00 ± 8.50207.75 ± 18.65
Bottom91.33 ± 12.39125.33 ± 3.18221.33 ± 26.77
T9Upper130.50 ± 7.96291.00 ± 11.05478.50 ± 11.11
Bottom108.60 ± 5.70342.40 ± 13.41462.80 ± 21.87
Table 7. ANOVA analysis results of fruit set rate under various flowering stages and spray frequency treatments displayed in Table 4. The data in the table were obtained from SPSS.
Effect and InteractiondfF Ratiop ValueSignificance
Spray times251.9200.000**
Flower grade428.1350.000**
Spray times × Flower grade817.3010.000**
Note: Statistical significance level: No significant value p > 0.05; * 0.05 < p < 0.01; ** p < 0.01.
Table 8. Analysis of efficiency and cost of thinning operations under varying fruit set rates.
Fruit Thinning
Fruit Set RateEfficiency (ha·h−1)Cost (CNY·ha−1)
40~50%0.017776.47
50~60%0.0131015.38
60~70%0.0111200.00
Disclaimer/Publisher’s Note: The statements, opinions and data contained in all publications are solely those of the individual author(s) and contributor(s) and not of MDPI and/or the editor(s). MDPI and/or the editor(s) disclaim responsibility for any injury to people or property resulting from any ideas, methods, instructions or products referred to in the content.

