Article

Lightweight Wheat Spike Detection Method Based on Activation and Loss Function Enhancements for YOLOv5s

1
Institute of Space Integrated Ground Network Anhui Co., Ltd., Hefei 230088, China
2
National Engineering Research Center for Agro-Ecological Big Data Analysis & Application, Anhui University, Hefei 230601, China
*
Author to whom correspondence should be addressed.
Agronomy 2024, 14(9), 2036; https://doi.org/10.3390/agronomy14092036
Submission received: 6 August 2024 / Revised: 28 August 2024 / Accepted: 5 September 2024 / Published: 6 September 2024
(This article belongs to the Section Precision and Digital Agriculture)

Abstract

:
Wheat spike count is one of the critical indicators for assessing the growth and yield of wheat. However, illumination variations, mutual occlusion, and background interference have greatly affected wheat spike detection. A lightweight detection method was proposed based on the YOLOv5s. Initially, the original YOLOv5s was improved by combing the additional small-scale detection layer and integrating the ECA (Efficient Channel Attention) attention mechanism into all C3 modules (YOLOv5s + 4 + ECAC3). After comparing GhostNet, ShuffleNetV2, and MobileNetV3, the GhostNet architecture was finally selected as the optimal lightweight model framework based on its superior performance in various evaluations. Subsequently, the incorporation of five different activation functions into the network led to the identification of the RReLU (Randomized Leaky ReLU) activation function as the most effective in augmenting the network’s performance. Ultimately, the network’s loss function of CIoU (Complete Intersection over Union) was optimized using the EIoU (Efficient Intersection over Union) loss function. Despite a minor reduction of 2.17% in accuracy for the refined YOLOv5s + 4 + ECAC3 + G + RR + E network when compared to the YOLOv5s + 4 + ECAC3, there was a marginal improvement of 0.77% over the original YOLOv5s. Furthermore, the parameter count was diminished by 32% and 28.2% relative to the YOLOv5s + 4 + ECAC3 and YOLOv5s, respectively. The model size was reduced by 28.0% and 20%, and the Giga Floating-point Operations Per Second (GFLOPs) were lowered by 33.2% and 9.5%, respectively, signifying a substantial improvement in the network’s efficiency without significantly compromising accuracy. This study offers a methodological reference for the rapid and accurate detection of agricultural objects through the enhancement of a deep learning network.

1. Introduction

Wheat (Triticum aestivum L.) is one of the primary cereal crops in China and all over the world and plays a significant role in ensuring food security [1,2]. The number of wheat spikes serves as an important indicator for measuring the growth condition and yield of wheat, thus necessitating efficient detection and accurate counting. Common challenges include the complexity of environmental factors, the density and scale variability of the wheat spikes, as well as issues related to tracking stability. Traditional methods of counting wheat spikes mainly rely on manual statistics or image-based machine learning techniques, which suffer from issues such as high labor costs, low efficiency, and uncertain accuracy. With the advancement of deep learning technology, detection accuracy for wheat spikes has been greatly improved [3,4]. However, the complexity of the models, the multitude of parameters, and the long run times have limited their application in field environments and portable terminals. The pursuit of a high-precision and lightweight detection model remains a focal point and challenge in current research [5]. Therefore, to enable deep learning algorithms to better suit the practical application of wheat spike detection, it is necessary to make improvements to the relevant algorithms.
In the context of wheat spike detection, one-stage and two-stage deep learning methods are commonly utilized. Each method has its advantages and trade-offs between speed and accuracy. One-stage methods are preferred for their speed and are well-suited for applications requiring real-time performance, while two-stage methods are chosen for their accuracy in scenarios where precision is critical. One-stage methods, such as You Only Look Once (YOLO) and Single Shot MultiBox Detector (SSD), are also known as single-shot detectors and perform the task of object detection in a single pass through the network. These methods are characterized by their efficiency and speed, making them suitable for real-time applications. They typically predict bounding boxes and class labels directly from the feature map in a single forward pass. Two-stage methods, such as Region-based Convolutional Neural Networks (R-CNN) and Region-based Fully Convolutional Networks (R-FCN), involve a two-step process for object detection. Initially, a Region Proposal Network (RPN) or a similar mechanism generates region proposals that might contain objects. Subsequently, a classifier is applied to these proposals to refine the bounding box locations and classify the objects. These methods tend to be more accurate but are generally slower than one-stage methods.
As the compact model within the YOLOv5 series, YOLOv5s achieves a balance between performance and efficiency, making it particularly suitable for devices with limited resources, such as mobile devices and embedded systems. Furthermore, compared to other models in the YOLO series, it also boasts advantages such as end-to-end training, multi-scale detection, high performance, and a lightweight model structure. These attributes render YOLOv5s the preferred solution for edge computing applications, especially in scenarios that demand rapid and efficient object detection. In this study, YOLOv5s is adopted as the baseline network and some innovative improvements are performed to address the challenge of small wheat spikes being prone to missed detections. The primary contributions are as follows:
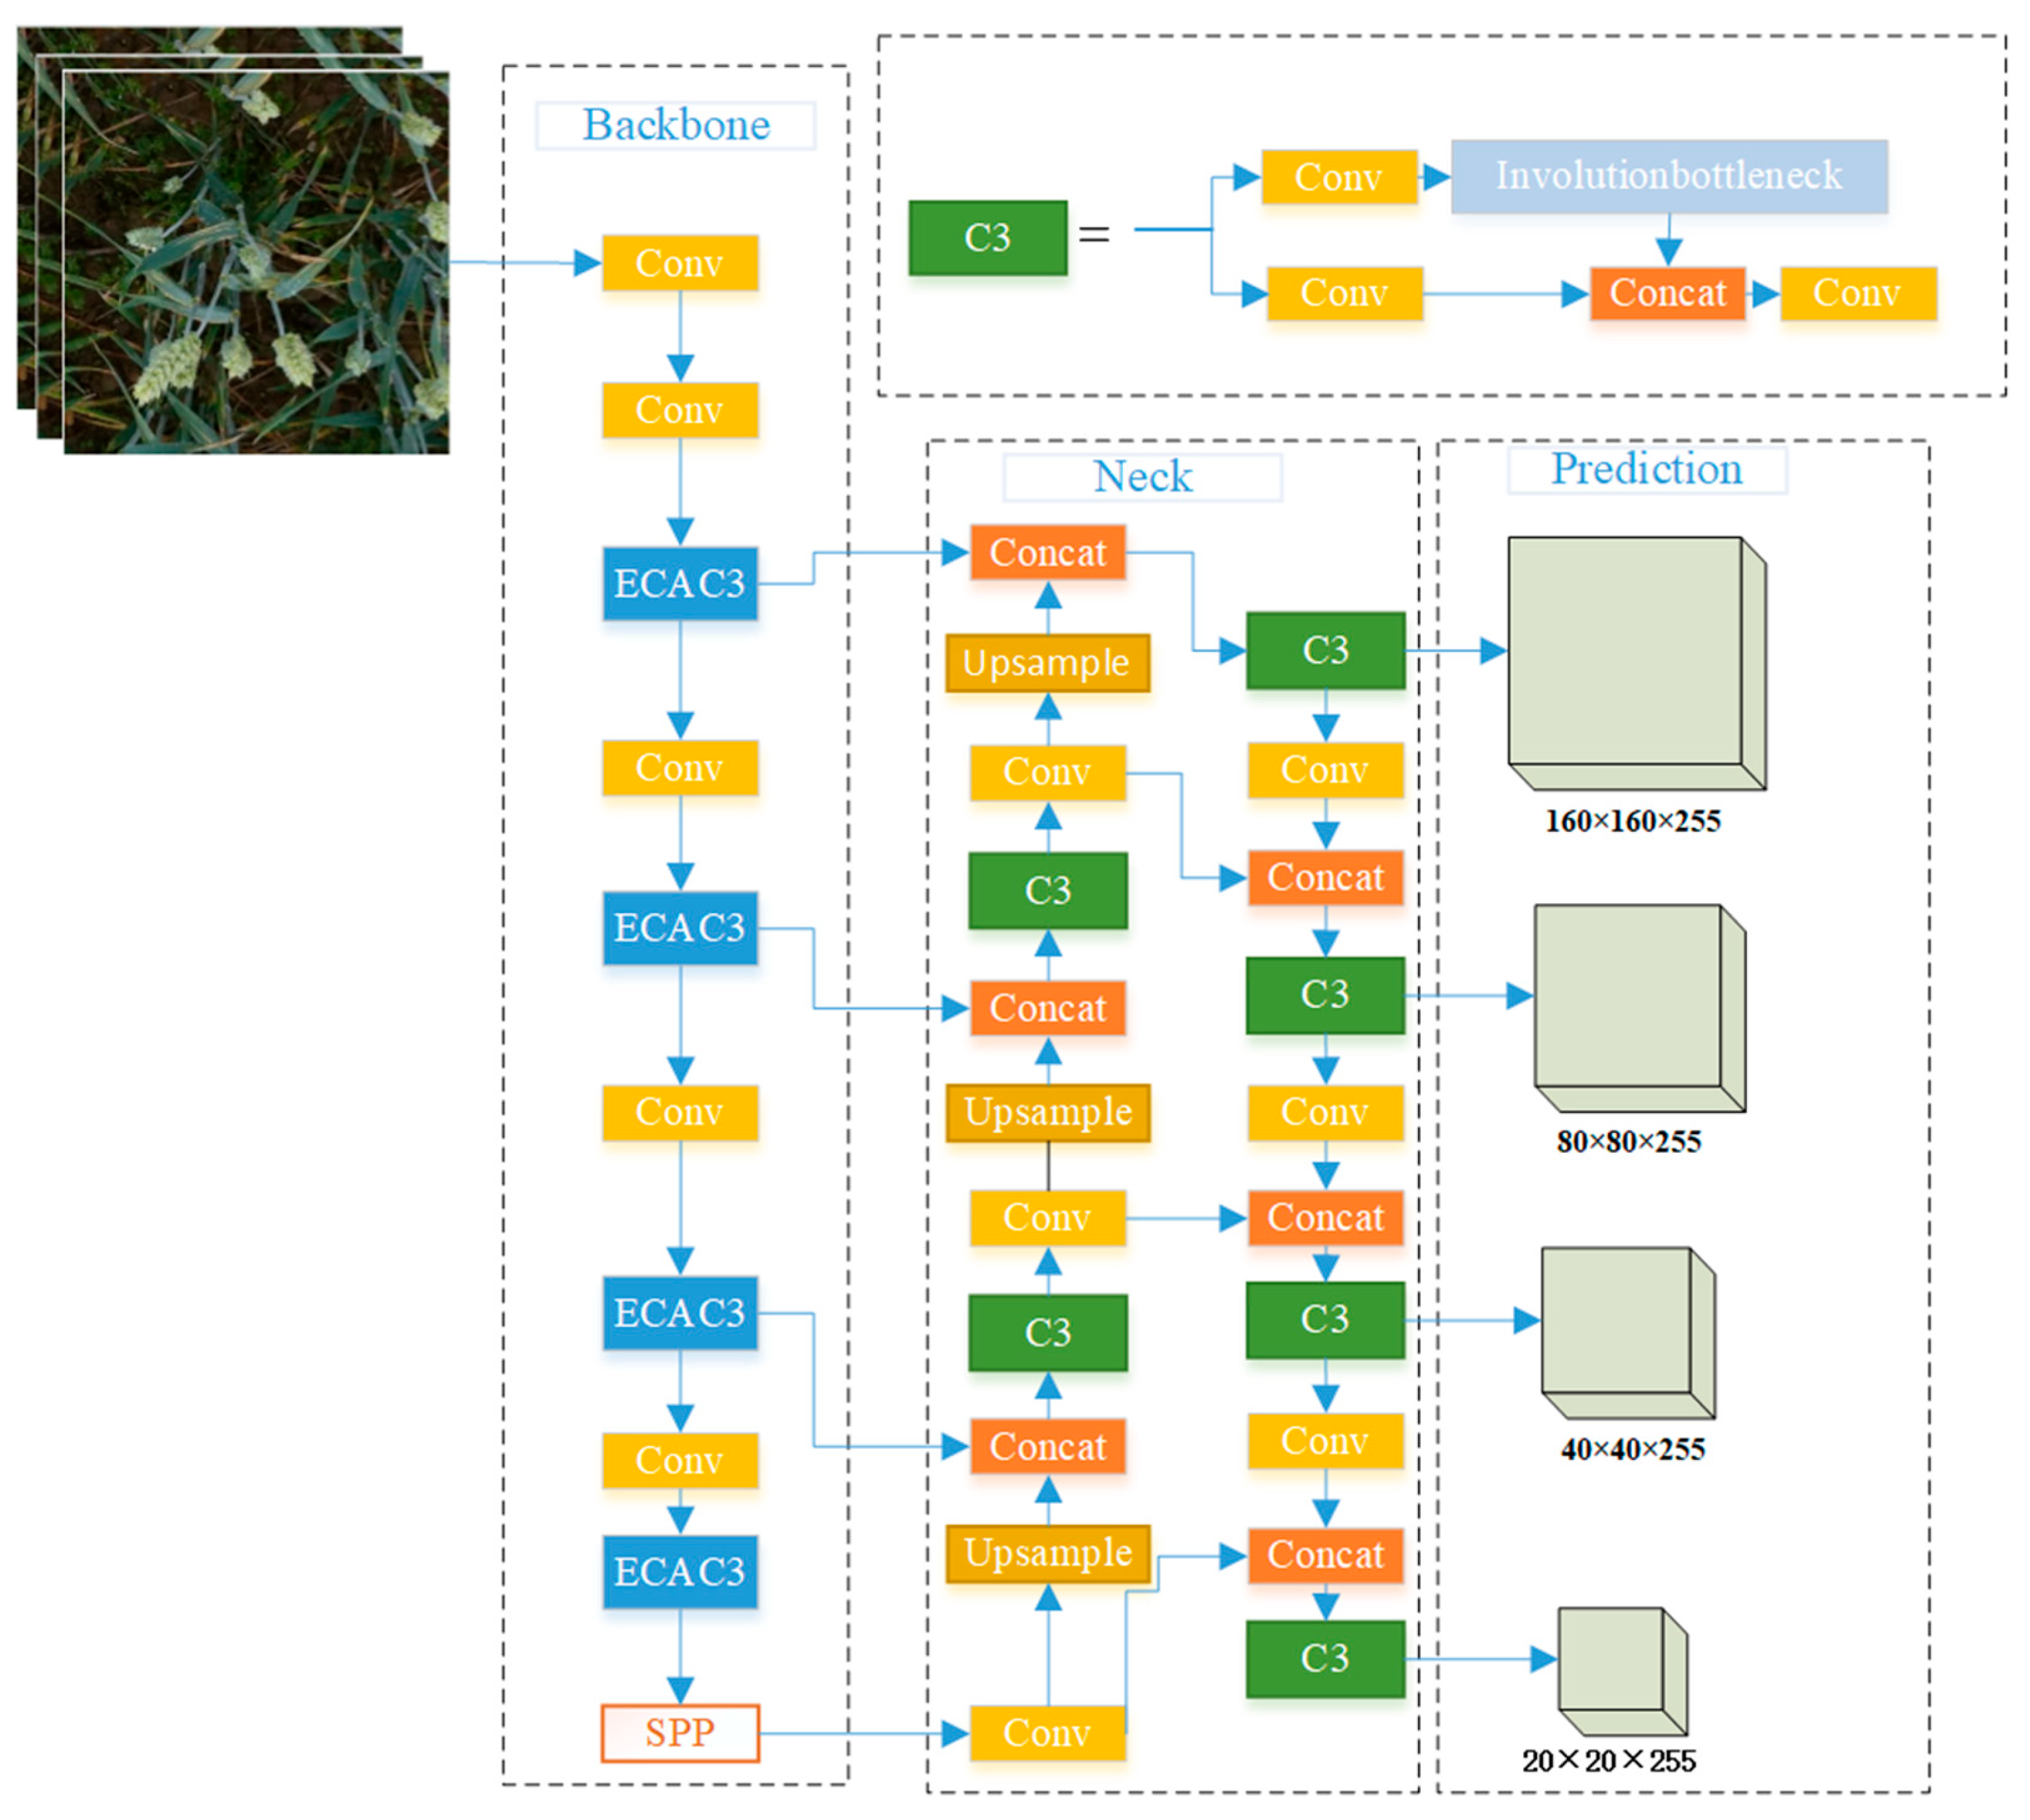
  • The present study refines the original three-tiered detection scheme to a four-tiered one by incorporating an additional small-scale detection layer. This modification enables the YOLOv5s algorithm to more effectively leverage superficial information, thereby enhancing its detection capabilities for diminutive wheat spikes.
  • Furthermore, improvements have been made to the backbone of the YOLOv5s algorithm by integrating the Efficient Channel Attention (ECA) attention mechanism into all CSP Bottleneck with three convolutions (C3) modules, which significantly boosts the network’s ability to extract features.
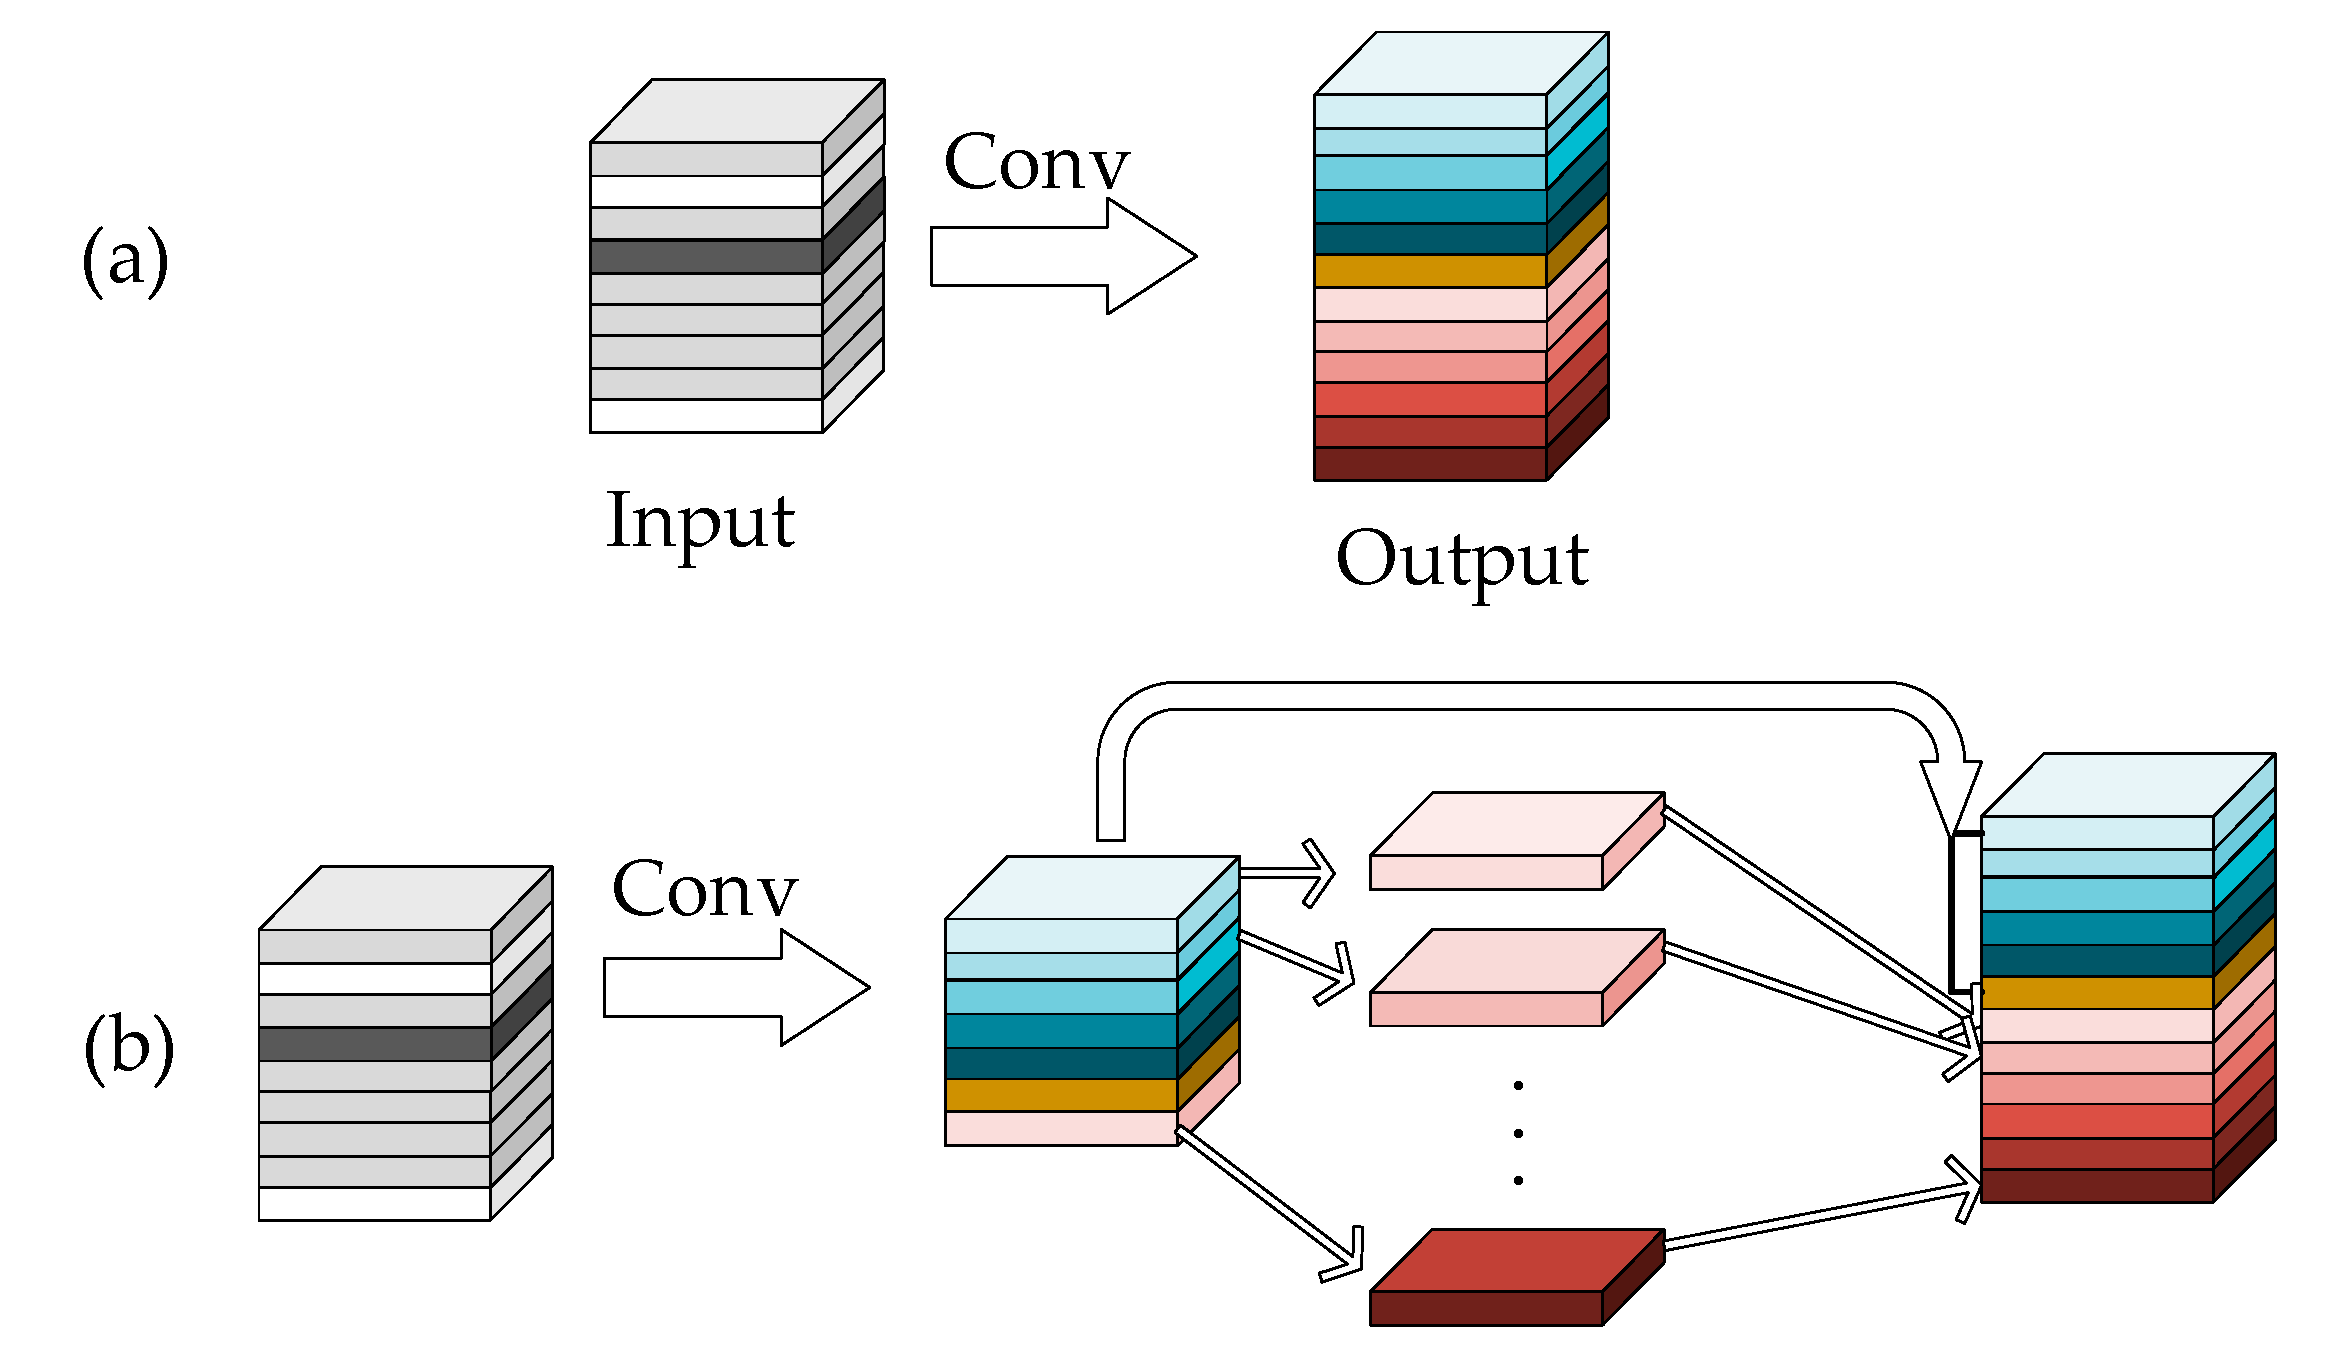
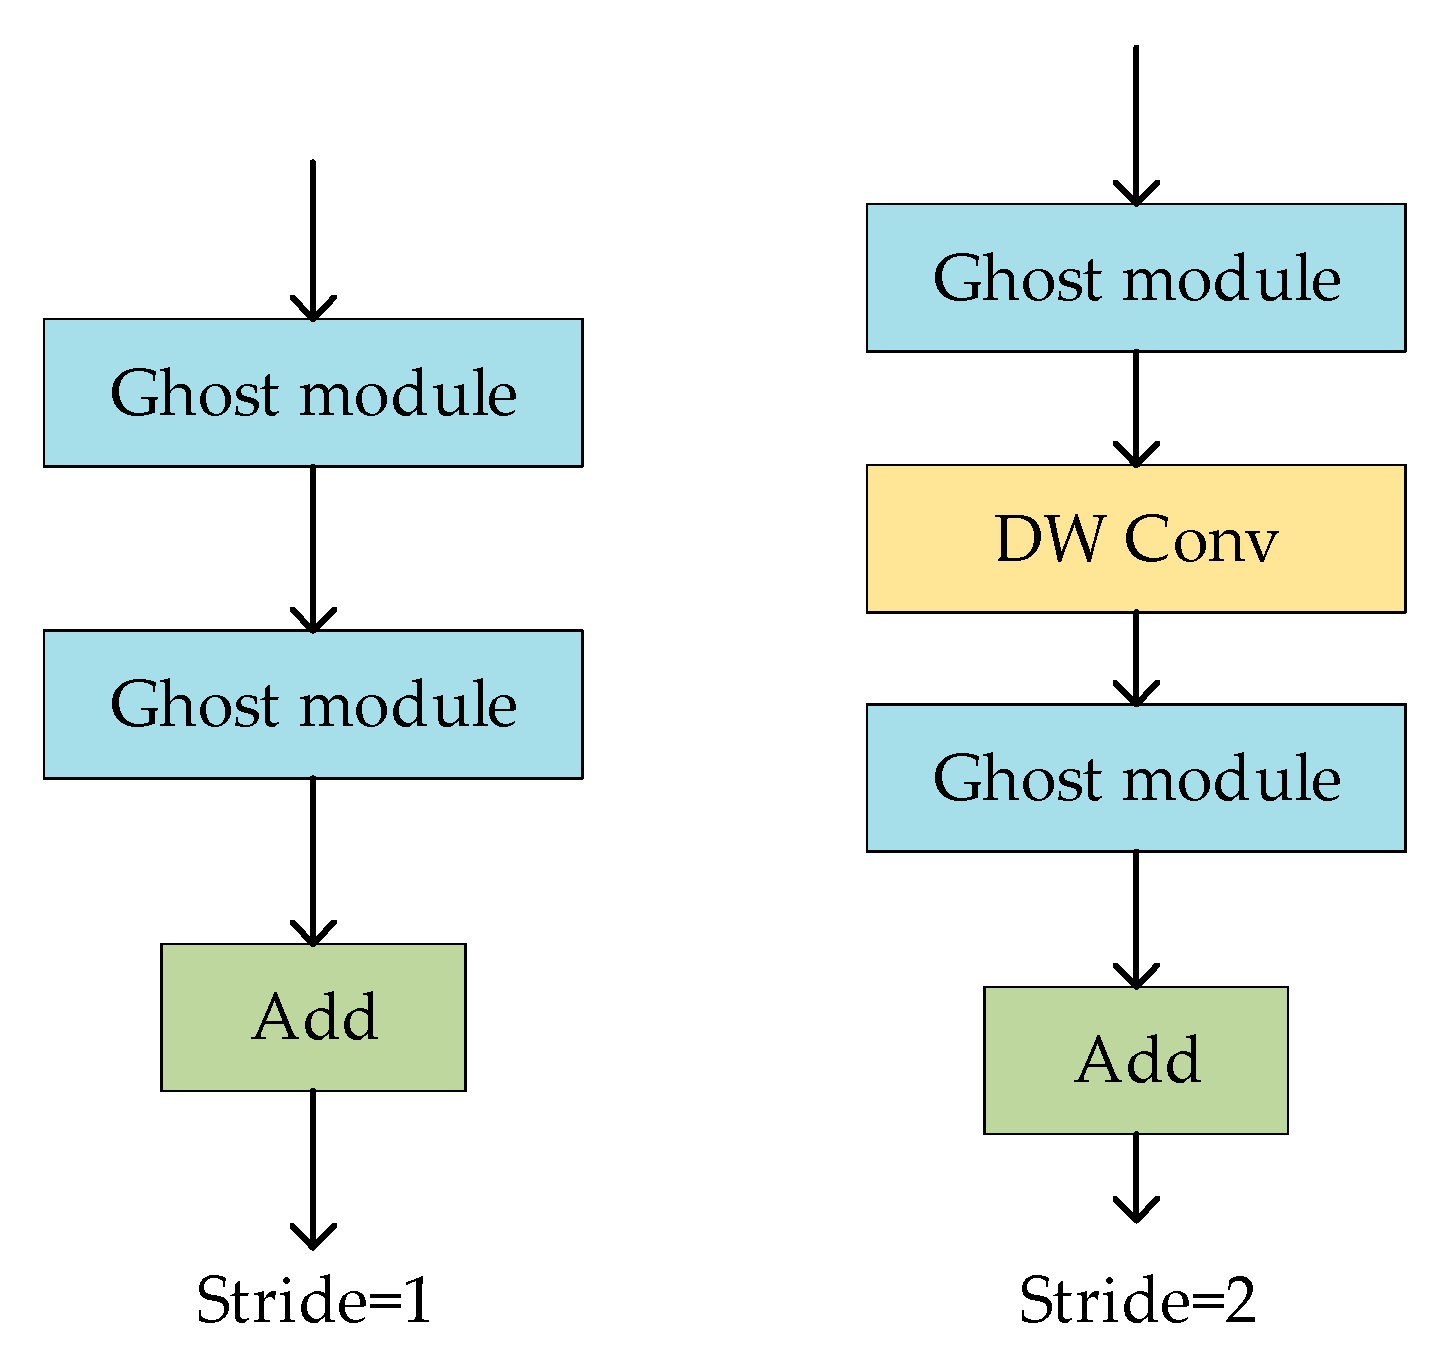
  • To tackle the issue of current wheat spike detection algorithms being too cumbersome and having an excessive number of parameters, this study conducts a lightweight optimization of the enhanced YOLOv5s + 4 + ECAC3 algorithm. The GhostNet network architecture is initially utilized to perform lightweight modifications due to its innovative approach to feature map generation and efficient use of computational resources, effectively reducing its size and computational requirements.
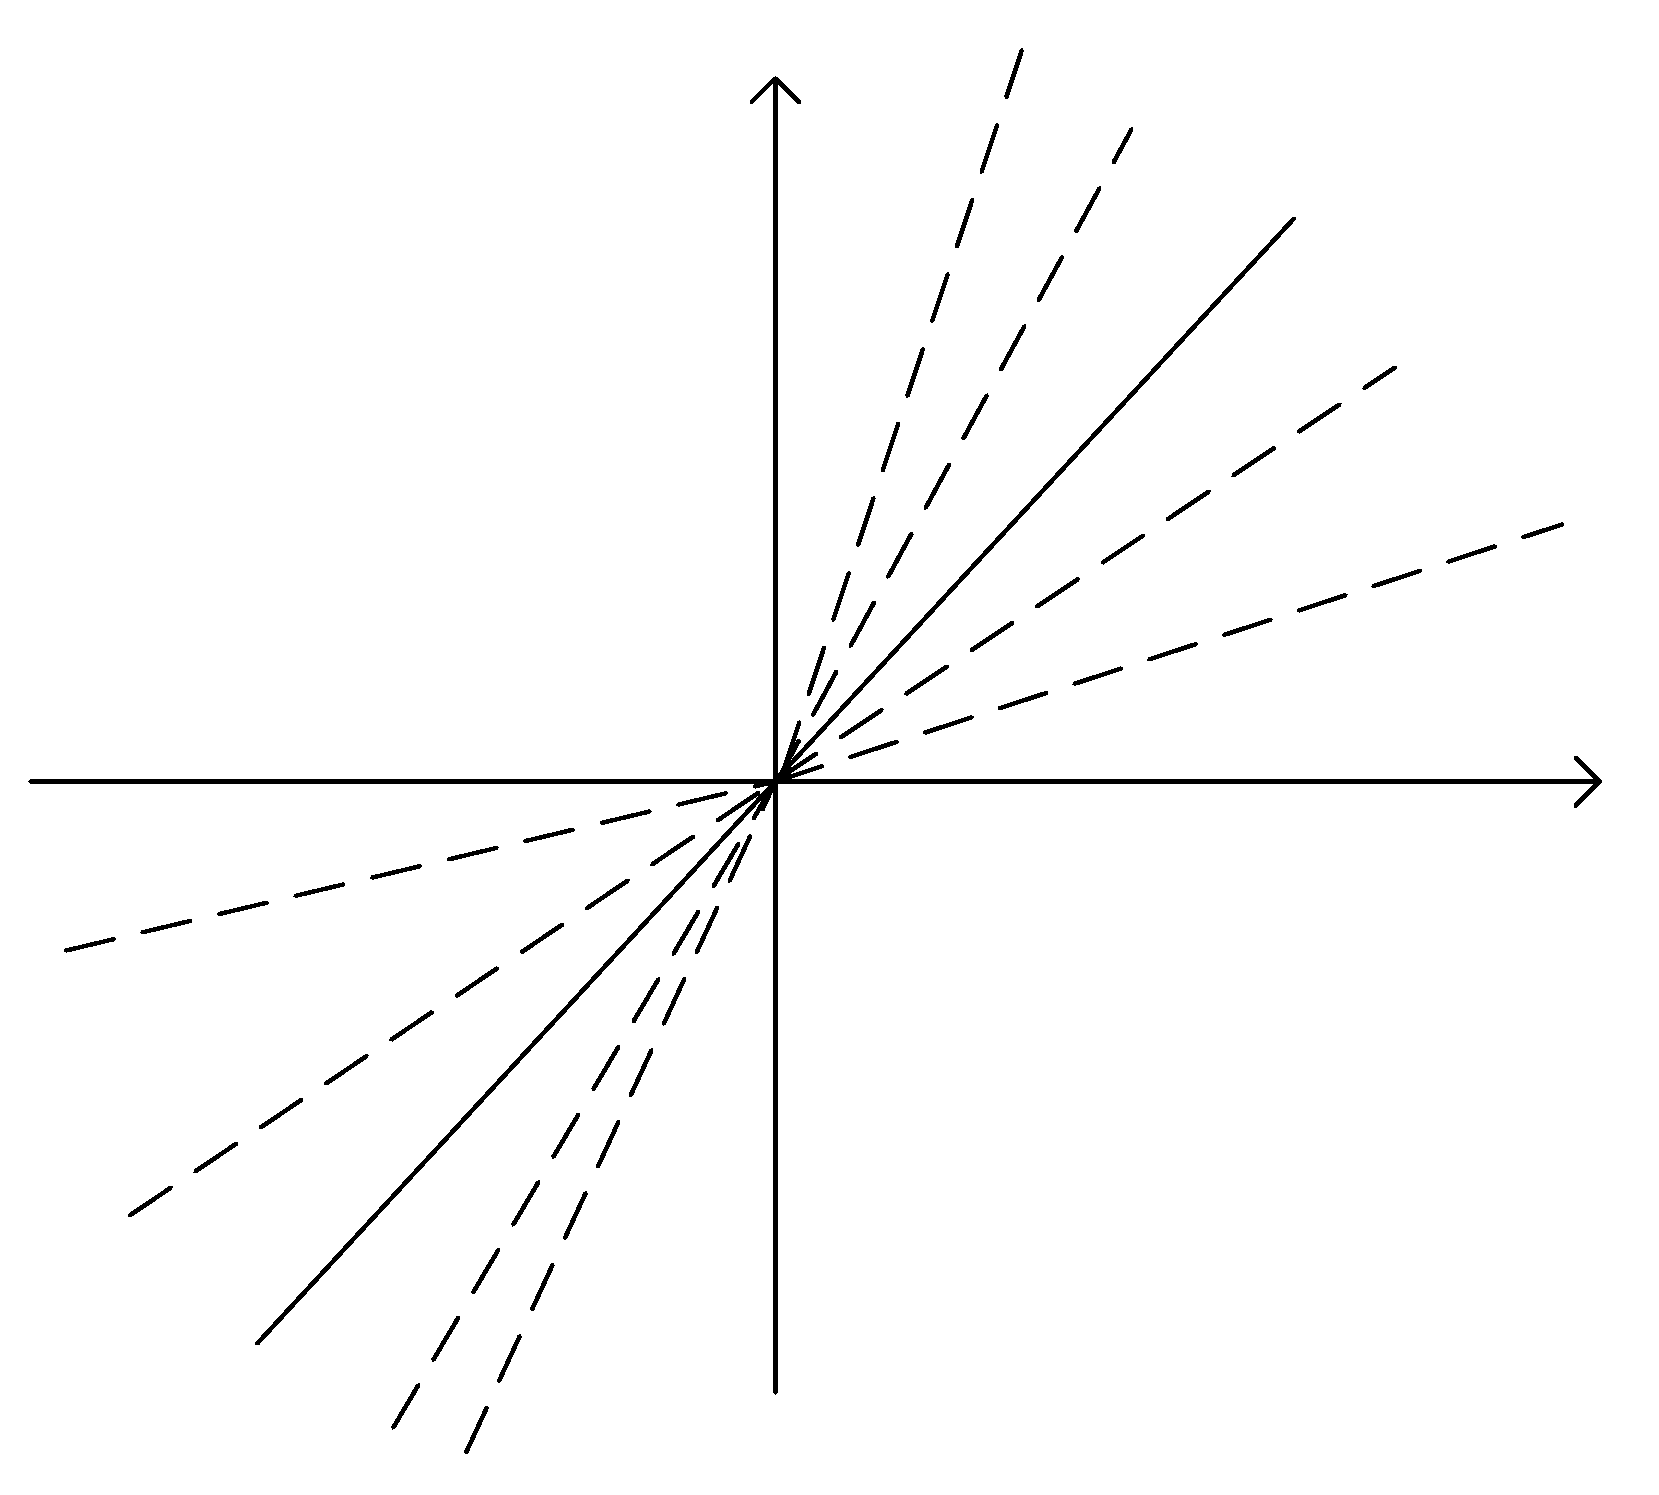
  • Thereafter, the network is further optimized with the Randomized Rectified Linear Unit (RReLU) activation function and the Efficient Intersection over Union (EIoU) loss function to elevate its detection efficacy for wheat spikes.

2. Related Works

Current research on wheat spike detection encompasses two primary research trajectories. The first is the conventional approach to wheat spike detection, which predominantly utilizes the characteristics of color, shape, and texture to identify wheat spikes [6]. Pourreza et al. [7] compiled 1080 grayscale images of nine prevalent wheat seed varieties and extracted a total of 131 textural features utilizing matrices such as grayscale, Gray Level Co-occurrence Matrix (GLCM), Gray Level Run Length Matrix (GLRM), Local Binary Pattern (LBP), Local Shape Pattern (LSP), and Local Structure Number (LSN). A stepwise discriminant approach was applied to select and rank the most pertinent textures from each matrix. Subsequently, Linear Discriminant Analysis (LDA) was employed and resulted in an average classification accuracy of 98.15% when leveraging the first 50 features. Alharbi et al. [8] transformed the wheat spike image dataset using an extracted color index. This was followed by the application of Gabor filters and the K-means clustering algorithm to detect wheat spikes, achieving a detection precision of 90.7%. Madec et al. [9] deployed the Faster Region-based Convolutional Neural Network (R-CNN) algorithm and counted wheat spikes within the images with a regression line fit of 0.91, demonstrating a robust counting efficacy for wheat spikes. The second, and more widely applied method, is the deep learning-based detection of wheat spikes [10]. This includes two main methodologies: two-stage target detection algorithms that are centered on feature extraction, and single-stage detection algorithms that are based on regression. These methodologies are characterized by high precision and are more aligned with practical applications.
Prior to 2021, the deployment of deep learning algorithms for wheat spike detection was chiefly centered around the two-stage R-CNN series algorithms. Post-2021, there has been a notable shift towards the adoption of the YOLO series algorithms by an expanding cadre of academics and professionals. Yang et al. [11] introduced enhancements to the YOLOv4 architecture by integrating the Convolutional Block Attention Module (CBAM) module to augment the feature extraction capabilities. To bolster the model’s generalizability, they employed not only the Wheat Detection (WD) dataset but also expanded the training, validation, and test datasets with the Wheat Ear Detection Dataset (WEDD) and Grain Wheat Head Detection Dataset (GWHDD) datasets. The resultant average accuracies across these three datasets were 94%, 96.04%, and 93.11%, respectively. Hong et al. [12] made refinements to the YOLOv5 model by substituting the original CSPDarknet53 backbone with a MobileNet module. They implemented Complete Intersection over Union (CIoU) and Non-Maximum Suppression (NMS) for loss function regression and leveraged transfer learning to improve the model’s generalization. These enhancements led to a 1.6% increase in accuracy and a significant reduction in model size to one-fifth of its original. Shen et al. [13] proposed an advanced YOLOv5 algorithm that incorporates separable convolutions and attention mechanisms. They reduced the Cross Stage Partial Networks (CSP) module count in YOLOv5, substituted the conventional convolutions within CSP with separable convolutions, and introduced these into the fusion pathways to curtail redundant information in the feature maps. The modified algorithm demonstrated a 4.2% improvement in mean Average Precision (mAP) and a 1.3% improvement in Frames Per Second (FPS) over the original YOLOv5 algorithm. Over the past three years, there has been an escalating interest in the research and development of lightweight networks for the detection of wheat spikes, with a significant emphasis on the optimization of the YOLO series algorithms for enhanced efficiency. The lightweight neural network architectures that have been predominantly employed in these optimizations encompass MobileNetV2, EfficientNet, and GhostNet, among other contemporary efficient models.
From the literature review presented above, it is evident that deep learning-based methods offer significant advantages in wheat spike detection and counting, such as data augmentation, small object detection, multi-scale feature learning, high accuracy, and real-time detection. Utilizing data augmentation techniques enhances the model’s generalization capability, adapting it to different field environments and lighting conditions. The introduction of techniques such as attention mechanisms allows models to better recognize and count dense or small-sized wheat spikes. With structures like Feature Pyramid Networks (FPN), deep learning models can learn features at different scales simultaneously, aiding in the detection of wheat spikes of varying sizes. Deep learning models, particularly Convolutional Neural Networks (CNNs), excel in feature extraction from images, enabling the precise identification and localization of wheat spikes.
Certain models, like the YOLO series, have improved detection speed through network structure optimization, meeting the demands of real-time detection. Although the development of artificial intelligence has greatly facilitated the detection and counting of wheat spikes, there are also challenges, such as complex environment adaptability, occlusion and overlap issues, model generalization ability, computational resource limitations, and model complexity and training costs. Under natural field conditions, the color and shape of wheat spikes may be similar to the background, complicating detection. Wheat spikes may occlude each other, affecting the accuracy of the model’s detection. Models may perform well on specific datasets but experience a decline in performance when applied to new environments or different wheat varieties. Some deep learning models might require substantial computational resources, limiting their application in environments with constrained resources. Building and training deep learning models may necessitate a large amount of data and computational resources, increasing the barriers to research and application. A high-efficiency, lightweight model is generally required for the real-time detection of wheat spikes in practical agricultural scenarios.

3. Materials and Methods

3.1. Data Source and Preprocessing

This study employs the publicly annotated dataset furnished by the Global Wheat Challenge 2021 (https://zenodo.org/records/5092309 (accessed on 2 July 2024)), which has been recognized for its diversity and representativeness with wheat spike images sourced from multiple countries. This dataset has become a benchmark for the validation of diverse wheat detection methodologies. Initially compiled in 2021, the dataset was a collaborative effort from nine research institutions across seven nations, including prestigious entities such as the University of Tokyo and ETH Zurich [14]. It predominantly features wheat spikes across three critical growth phases: the flowering, milking, and maturity stages. Comprising a training dataset of roughly 4000 images and a validation set of approximately 2000 images, the dataset is extensive and varied.
The dataset annotation was conducted utilizing a web-based annotation platform with the Common Objects in Context (COCO) annotation tool, where wheat spikes were interactively labeled by delineating bounding boxes that included all pixels of the wheat spikes. Creators abstained from annotating wheat spikes with indistinct heads or those obscured by other objects. In certain national subsets of the wheat spike imagery, due to photographic perspectives, there was substantial overlap of wheat spikes. When the bounding box became excessively large and impractical for annotation, only the heads of the wheat spikes were labeled by the creators. Furthermore, wheat spikes that were depicted in less than 30% of the image frame were not subjected to annotation. This study has excluded images devoid of wheat spikes from the dataset, culminating in a total of 3403 images. Ultimately, the dataset was partitioned into a training set with 2873 images, a validation set with 500 images, and a test set with 30 images.

3.2. Experimental Environment and Parameter Setting

The operating system utilized in the experiments is Windows 10, with hardware configurations including an Intel Xeon Gold 6248R CPU (Intel Corporation, Santa Clara, CA, USA) and an NVIDIA Quadro P4000 GPU (Nvidia Corporation, Santa Clara, CA, USA) with 8.0 GB of dedicated VRAM. The experiments were conducted using the PyTorch framework version 1.9.0, with CUDA version 11.1, and programming was performed in the Python 3.11.8 language. The model training parameters are as depicted in Table 1.

3.3. Improvement of YOLOv5s

In accordance with the standard approach in deep learning, augmenting the depth of a model’s architecture is typically expected to elevate its capacity for feature extraction. Nevertheless, wheat spike imagery often exhibits substantial overlap and occlusion. With the deepening of the model, these complex environmental factors may cause the model to neglect the wheat spikes. Moreover, an increase in depth also correlates with a significant escalation in computational demand. Consequently, this study proposes augmenting the YOLOv5s model with additional scale layers and the integration of attention mechanisms to bolster its ability to detect wheat spikes (Figure 1).

3.3.1. Addition of Additional Scale Layer

The original YOLOv5s model is equipped with three tiers of detection layers, producing feature maps of dimensions 20 × 20, 40 × 40, and 80 × 80, respectively, which are utilized to detect large, medium, and small targets. With the wheat spike images input into the model being 640 × 640 in size, the receptive field in the 80 × 80 scale layer is determined by the ratio of the image size to the feature map size, which is 640 × 640 divided by 80 × 80, resulting in an 8 × 8 receptive field. This indicates that the model may fail to detect wheat spike targets whose height or width falls below 8 pixels, as these targets would not be captured within the model’s receptive field.
To mitigate the loss of shallow-layer information and to bolster the network’s capacity for multi-scale detection, this study introduces an enhancement from the initial three-tiered detection scheme of 20 × 20, 40 × 40, and 80 × 80 to a four-tiered one, adding a 160 × 160 scale to the existing model. This additional scale enables the detection of small wheat spike targets with dimensions exceeding 4 pixels (calculated as 640 × 640 divided by 160 × 160). Furthermore, the model incorporates additional feature extraction layers, with C3 modules and convolutional layers appended subsequent to the 16th layer, followed by upsampling at the 19th layer. The 160 × 160 feature map obtained from this process is then concatenated with the feature map from the second layer, ensuring the comprehensive utilization of shallow-layer information. The modified network is designated as YOLOv5s + 4, with the ‘4’ signifying the implementation of a four-scale detection approach.

3.3.2. Addition of Attention Mechanism

In the context of wheat spike detection, the intricate background and substantial overlap of wheat spikes can result in substantial omissions and misidentifications. The integration of attention mechanisms aids the network model in more precisely focusing on the characteristics of wheat spikes, thereby mitigating the influence of extraneous information and improving the model’s detection efficacy. Prevalent attention mechanisms include the ECA [15], Coordinate Attention (CA) [16], and CBAM [17]. The ECA attention mechanism, in comparison to CA and CBAM, is an exceedingly lightweight and efficient channel attention module that circumvents dimensionality reduction and employs swift one-dimensional convolutions to apprehend cross-channel interactions, rather than utilizing an entire fully connected layer. Enhancements to the C3 modules within the backbone network of the YOLOv5s model were executed by integrating the ECA module with feature maps of corresponding dimensions from the backbone network along the channel axis, maintaining the concatenated dimensions as unchanged. The C3 modules at the 2nd, 4th, 6th, and 8th layers of the network were all modified to include the ECA concatenation. The modified C3 module is designated as ECAC3, and the resultant network model is termed YOLOv5s + ECAC3.

3.4. Model Lightweighting for YOLOv5s + 4 + ECAC3

With technological advancements, the focus on model lightweighting has expanded beyond traditional techniques like pruning and knowledge distillation. An increasing number of researchers are now designing lightweight network architectures that can be integrated into their models, facilitating better deployment on resource-constrained devices. Prominent examples of these lightweight networks include MobileNet series [18,19], ShuffleNet series [20,21,22], and GhostNet [23].

3.4.1. Improvement of the YOLOv5s + 4 + ECAC3 Model Using GhostNet

GhostNet, introduced by Huawei’s team in 2020, is a novel network architecture that addresses two key issues: (1) the additional computational load incurred using 1 × 1 convolutions; (2) feature redundancy resulting from multiple convolution operations. The network’s core concept involves employing linear transformations to reduce the computational load during training. In GhostNet, the traditional Conv layer is replaced with the Ghost module. The traditional convolution operation and the Ghost convolution operation are depicted in Figure 2.
During the Ghost convolution process, the convolutional kernel size is halved, resulting in a reduction of computational load and the generation of half the number of feature maps. A subsequent convolution operation then applies depth-wise separable convolution to the output of the initial convolution, producing the remaining half of the feature maps, which are then combined.
For an input feature map with channel number, height, and width denoted as c, h, and w respectively, and input feature f R c × k × k × n , with a convolution kernel size of k, a number of convolution kernels n, bias b, and the output feature Y R h × w × n , the ordinary convolution calculation formula is shown in Equation (1).
Y = X f + b
For ordinary convolution, the FLOP (Floating Point Operations) calculation is h × w × n × c × k × k . In the GhostNet operation process, after determining the size and number of output feature maps l, the number of groups n l in the operation can be calculated. Initially, a smaller convolutional kernel operation yields the first group with a computational load of n l × h × w × c × k × k . Then, through linear transformation, the second, third, and subsequent groups are obtained with a computational load of ( l 1 ) × n l × h × w × c × d × d , where d × d is the average size of the convolutional kernel in the linear transformation. Finally, the previously output feature maps are combined. The comparison of computational loads between ordinary convolution and GhostNet is shown in Equation (2).
r s = h × w × n × c × k × k n l × h × w × c × k × k + ( s 1 ) n l × h × w × d × d = c × l l + c 1 l
It is evident that GhostNet requires a significantly less computational load compared to ordinary convolution. In the Ghost module, there is also a component known as the Ghost bottleneck layer, primarily composed of multiple stacked Ghost modules. There are two main types of Ghost bottleneck layers: One with a stride of 1, where all 3 × 3 convolutions are replaced with Ghost modules, and another with a stride of 2, which incorporates a depth-wise separable convolution with a stride of 2 into the Ghost module. Their structures are presented in Figure 3. The primary steps of the Ghost operation are as follows: (1) convolution calculation; (2) channel number adjustment; (3) utilization of global average pooling and standard convolution to alter the feature map dimensions, resulting in a 1 × 1 × 1280 feature layer.
Given the superior performance of the GhostNet network, this study incorporates it into the YOLOv5s + 4 + ECAC3 network to create a new network referred to as YOLOv5s + 4 + ECAC3 + Ghost. The specific integration approach is as follows: (1) replace all C3 modules in the YOLOv5s + 4 + ECAC3 network with C3Ghost modules; (2) replace all Conv modules in the YOLOv5s + 4 + ECAC3 network, except for the first Conv module, with GhostConv modules. This integration aims to optimize the model’s computational load, size, and detection speed. The YOLOv5s + 4 + ECAC3 + G structure is illustrated in Figure 4.

3.4.2. Improvement of Activation Function

This research substitutes the original Sigmoid Linear Unit (SiLU) activation function with the RReLU activation function, as illustrated in Equation (3). The RReLU, which is based on the ReLU [24], incorporates two parameters, a1 and a2, enhancing the conventional linear rectification unit to an adaptively extendible linear unit. Throughout the neural network training, the RReLU is capable of adaptively learning the parameters, which in turn improves the accuracy of identification. Despite the introduction of two parameters in the RReLU activation function, which aligns with the quantity of convolutional kernels and effectively adds a minimal number of parameters to the original network, the increase is negligible and does not adversely affect the model’s complexity.
RReLU ( x ) = a 1 x , x < 0 a 2 x , x 0
The graphical representation of the RReLU activation function is presented in Figure 5. The parameters a1 and a2 are variable and can be assigned freely; the right half of the function’s graph shifts within the first and third quadrants as a2 varies. When a2 > 0, the right half resides in the first quadrant, whereas it occupies the fourth quadrant when a2 < 0. Correspondingly, the left half of the function’s graph moves within the second and third quadrants as a1 changes. With a1 > 0, the left portion of the graph is situated in the third quadrant, and it shifts to the second quadrant when a1 < 0. In terms of parameter updates, the RReLU parameters a1 and a2 are updated through two principal phases during the training process: the forward pass and the backward pass. During the forward pass, all parameters participate in the calculations but are not updated. It is in the backward pass that the parameters are updated. Prior to the parameter updates, the cross-entropy loss function is established, followed by a sequence of computations during the forward propagation phase, as depicted in Equation (4).
a L = σ ( z L ) = σ ( W L a L 1 + b L )
In the aforementioned context, a L denotes the output that is computed during the forward propagation through layer L. Thereafter, the gradient descent iterative approach is employed to ascertain the parameters a1 and a2 for each layer.
With respect to the activation function f( ), its gradient is expressed as f ( y i ) , and the gradients for the parameters a1 and a2 are delineated in Equation (5).
f ( y i ) k i = x
Consequently, the gradients for the parameters a1 and a2 of the i-th layer can be formulated as presented in Equations (6) and (7), respectively:
ε k 1 , i = ε f ( y i ) f ( y i ) k 1 , i
ε k 2 , i = ε f ( y i ) f ( y i ) k 2 , i
Within these formulations, ε f ( y i ) symbolizes the gradient that is retroactively conveyed from subsequent layers within the network.
Subsequently, the parameters are refined through the application of momentum μ, as articulated in Equation (8).
Δ k i = μ Δ k i + η ε k i

3.4.3. Improvement of Loss Function

Bounding box regression is an integral process within the domain of object detection, facilitating the precise localization of targets. This process prognosticates the position of targets within an image using rectangular bounding boxes and then refines the position of these predicted boxes through the application of a loss function, thereby achieving a progressive refinement of the bounding box’s location. In the context of wheat spike detection, the complex field environment poses significant challenges to the accuracy of detection. This study aims to elevate the precision of wheat spike detection primarily through the enhancement of the loss function.
The loss function serves the critical function of quantifying the divergence between the predicted and actual values, thereby optimizing the network via the backpropagation algorithm and the computed loss value. It is composed of three principal elements: (1) localization loss; (2) classification loss; (3) confidence loss. The formula for its computation is delineated in Equation (9).
L o s s = λ 1 L ds + λ 2 L obj + λ 3 L loc
Within this framework, L ds signifies the classification loss, L obj denotes the confidence loss, and L l oc indicates the localization loss.
YOLOv5 employs the CIoU loss function, which facilitates regression by leveraging the two central points after quantifying the discrepancy between the predicted and actual bounding boxes. The methodological approach to its computation is articulated in Equations (10)–(13).
CIoU ( b , b g t ) = I o U ( b , b g t ) ρ 2 ( b , b g t ) c 2 α v
v = 4 π 2 ( arctan w g t h g t arctan w h ) 2
α = v 1 I o U ( b , b g t ) + v
L CIoU ( b , b g t ) = 1 I o U + ρ 2 ( b , b g t ) c 2 + α v
Herein, v is employed to establish the consistency in size between the predicted and actual bounding boxes. a is the balance factor to measure the equilibrium between the bounding box’s aspect ratio and its Intersection over Union (IoU) loss. c represents the diagonal distance of the smallest enclosing box. b defines the centroid of the predicted bounding box. bgt specifies the centroid of the ground truth bounding box.
In an effort to augment the accuracy of wheat spike detection within intricate field conditions, this study advocates for the substitution of the traditional CIoU loss function with the EIoU loss function, which is calculated as depicted in Equation (14).
L EIoU ( b , b g t ) = 1 I o U + ρ 2 ( b , b g t ) c 2 + ρ 2 ( w , w g t ) c w 2 + ρ 2 ( h , h g t ) c h 2
Herein, c w and c h respectively denote the width and the height of the smallest enclosing box that encompasses the predicted bounding box.

3.5. Evaluation Metrics

Precision (P), Recall (R), and mAP serve as the metrics for evaluation as shown in Equations (15)–(17):
P = T P T P + F P
R = T P T P + F N
where True Positives (TP) denote the quantity of test instances correctly identified as the positive class, where both the central coordinates and the dimensions of the bounding box for the targets are within an acceptable range. Within the scope of this study, TP signifies the count of wheat spikes accurately predicted by the model. False Positives (FP) indicate the number of instances that are misclassified or where the bounding box dimensions are outside the prescribed limits, incorrectly categorized as the positive class when they are negative. In this context, FP represents the count of instances where areas that are not wheat spikes are erroneously identified as such. False Negatives (FN) are the instances where the network has failed to detect the presence of targets, incorrectly classifying them as the negative class despite them being positive. In this study, FN denotes the count of instances where wheat spikes are misidentified as background or non-wheat spike areas.
m A P = 1 M 1 0 P ( R ) d R
The integral from 0 to 1 of the Precision-Recall (P-R) curve, mathematically expressed as 1 0 P ( R ) d R , corresponds to the area beneath the curve that plots R on the horizontal axis and P on the vertical axis.
In the test set, this study selects the accuracy (ACC) provided by the official Global Wheat Challenge 2021 as the evaluation metric for the YOLOv5s test set count. The performance of the model is assessed using the number of parameters, computational load (GFLOPs, Giga Floating-point Operations Per Second), and inference speed. The formula for calculating accuracy is shown in Equation (18):
A CC = T P T P + F N + F P

4. Results and Discussion

4.1. Evaluation of YOLOv5s + 4 + ECAC3

In assessing the efficacy of the YOLOv5s + 4 + ECAC3 network, a comparative experimental analysis was undertaken against six alternative algorithms, namely YOLOv5s, YOLOv5m, YOLOv5x, YOLOv5l, YOLOv7, and Single Shot Detector (SSD) [25]. As illustrated in Table 2, upon evaluation on the validation set, the SSD algorithm was found to be the least performant, with a mAP of merely 69.9%. Conversely, the YOLOv5s + 4 + ECAC3 network achieved the highest mAP, attaining 94.6%. This represents a marginal yet significant enhancement over the YOLOv5s, YOLOv5m, YOLOv5x, and YOLOv5l algorithms by 0.4 percentage points each, a slightly more modest improvement of 0.2 percentage points over the YOLOv5l, and a notable increase of 1 percentage point over the YOLOv7. Despite these improvements, the performance gains were not markedly distinct. Furthermore, the YOLOv5s + 4 + ECAC3 model, while marginally reducing its performance on the two metrics to bolster the precision of recognition, still surpassed the YOLOv5m, YOLOv5x, YOLOv5l, YOLOv7, and SSD in both aspects. The YOLOv5s + 4 + ECAC3 model has demonstrated superior detection efficacy for wheat spikes.
The SSD algorithm exhibits suboptimal performance in detecting small-sized objects, as the feature information of these targets may be lost with the deepening of network layers. Additionally, it may generate false positives in the background, particularly when there is a high degree of similarity between the target and the background. YOLOv5 is a series of object detection models developed by Ultralytics, each designed to cater to different needs in terms of speed and accuracy [26]. YOLOv5s is the smallest model in the series and designed to balance performance and efficiency. In addition, it is the fastest model and suitable for real-time applications and environments with limited computational resources. As shown in Table 2, YOLOv5s still has the same mAP compared to larger-sized model of YOLOv5m, YOLOv5x, and YOLOv5l, but has the fastest inference speed. YOLOv7 represents a significant leap forward in the YOLO series, focusing on optimizing the training process and introducing innovative features to enhance performance without increasing inference costs [27]. It has the highest values of P and R but a little lower mAP value than YOLOv5.

4.2. Lightweighting the YOLOv5s + 4 + ECAC3

A comparative experimental analysis on the Global Wheat dataset for five distinct models—YOLOv5s, YOLOv5s + 4 + ECAC3, YOLOv5s + 4 + ECAC3 + G, YOLOv5s + 4 + ECAC3 + S (ShuffleNet), and YOLOv5s + 4 + ECAC3 + M (MobileNet)—is delineated in Table 3. It indicates that the lightweight modifications to the YOLOv5s + 4 + ECAC3 network have led to pronounced reductions in parameter count, model size, and floating-point operations. The most significant reductions were noted in the YOLOv5s + 4 + ECAC3 + S network, with a parameter count reduced to 3.50 million, a decrease of 53.3% relative to the YOLOv5s + 4 + ECAC3, a model size of 7.40 MB, a reduction of 54.0%, and floating-point operations at 2.60 GFLOPs, which is an 87.9% decrease. The YOLOv5s + 4 + ECAC3 + M network followed, with an identical parameter count reduction of 53.3%, a model size of 7.50 MB, a 53.4% reduction, and floating-point operations at 6.20 GFLOPS, which is a 71.0% decrease. The YOLOv5s + 4 + ECAC3 + G network exhibited a parameter count reduction of 32%, a model size reduction of 30%, and a decrease in floating-point operations of 33.2%. Regarding detection speed, the YOLOv5s + 4 + ECAC3 + M network was the swiftest, achieving a rate of 80.60 FPS, succeeded by the YOLOv5s + 4 + ECAC3 + S network at 71.40 FPS, whereas the YOLOv5s + 4 + ECAC3 + G network was the least at 51.80 FPS, yet still outperforming the YOLOv5s + 4 + ECAC3 network.
In terms of accuracy, the YOLOv5s + 4 + ECAC3 + G network led with a score of 89.84%, followed by the YOLOv5s + 4 + ECAC3 + M at 86.8%, while the YOLOv5s + 4 + ECAC3 + S demonstrated the poorest performance at 78.52%. Upon comparative analysis, it is apparent that the YOLOv5s + 4 + ECAC3 + S and YOLOv5s + 4 + ECAC3 + M networks, despite their substantial reductions in parameter count, model size, and floating-point operations, suffer from inadequate accuracy rates of 78.52% and 86.8%, respectively, which are 15.45 and 7.17 percentage points lower than that of the YOLOv5s + 4 + ECAC3 network, rendering them impractical for real-world applications. Although the YOLOv5s + 4 + ECAC3 + G does not lead in all evaluated aspects, it maintains a commendable accuracy rate while concurrently reducing model size and enhancing detection speed, with an accuracy rate only 0.19 percentage points below the original YOLOv5s network and 4.13 percentage points below the YOLOv5s + 4 + ECAC3 network. Consequently, the GhostNet-augmented lightweight adaptation of the YOLOv5s + 4 + ECAC3 model, specifically the YOLOv5s + 4 + ECAC3 + G network, is deemed the optimal choice for a lightweight wheat spike detection model.
ShuffleNet, MobileNet, and GhostNet are all efficient convolutional neural network architectures designed to balance accuracy and computational efficiency, making them suitable for deployment on mobile and embedded devices. ShuffleNet focuses on reducing computation through group convolutions and channel shuffling [28]. MobileNet achieves efficiency using depth-wise separable convolutions and has evolved to include architecture search and hard-swish activations in its later versions [29]. GhostNet’s innovative approach to feature map generation through its Ghost modules, combined with its high accuracy and efficiency, positions it as a strong contender among lightweight CNNs for mobile and embedded applications [23]. Its plug-and-play nature, scalability, and inference speed further enhance its appeal in the realm of efficient neural network design. Table 3 also shows that the lightweight method using GhostNet has the best comprehensive performance.
Table 3. Performance comparison of different lightweight algorithms.
MethodPara (M)Size (MB)GFlOPsFPSAcc (%)
YOLOv5s7.0114.5015.8074.6091.03
YOLOv5s + 4 + ECAC37.5016.1021.4049.5093.97
YOLOv5s + 4 + ECAC3 + G [23]5.1011.6014.3051.8089.84
YOLOv5s + 4 + ECAC3 + S [28]3.507.402.6071.4078.52
YOLOv5s + 4 + ECAC3 + M [29]3.507.506.2080.6086.80

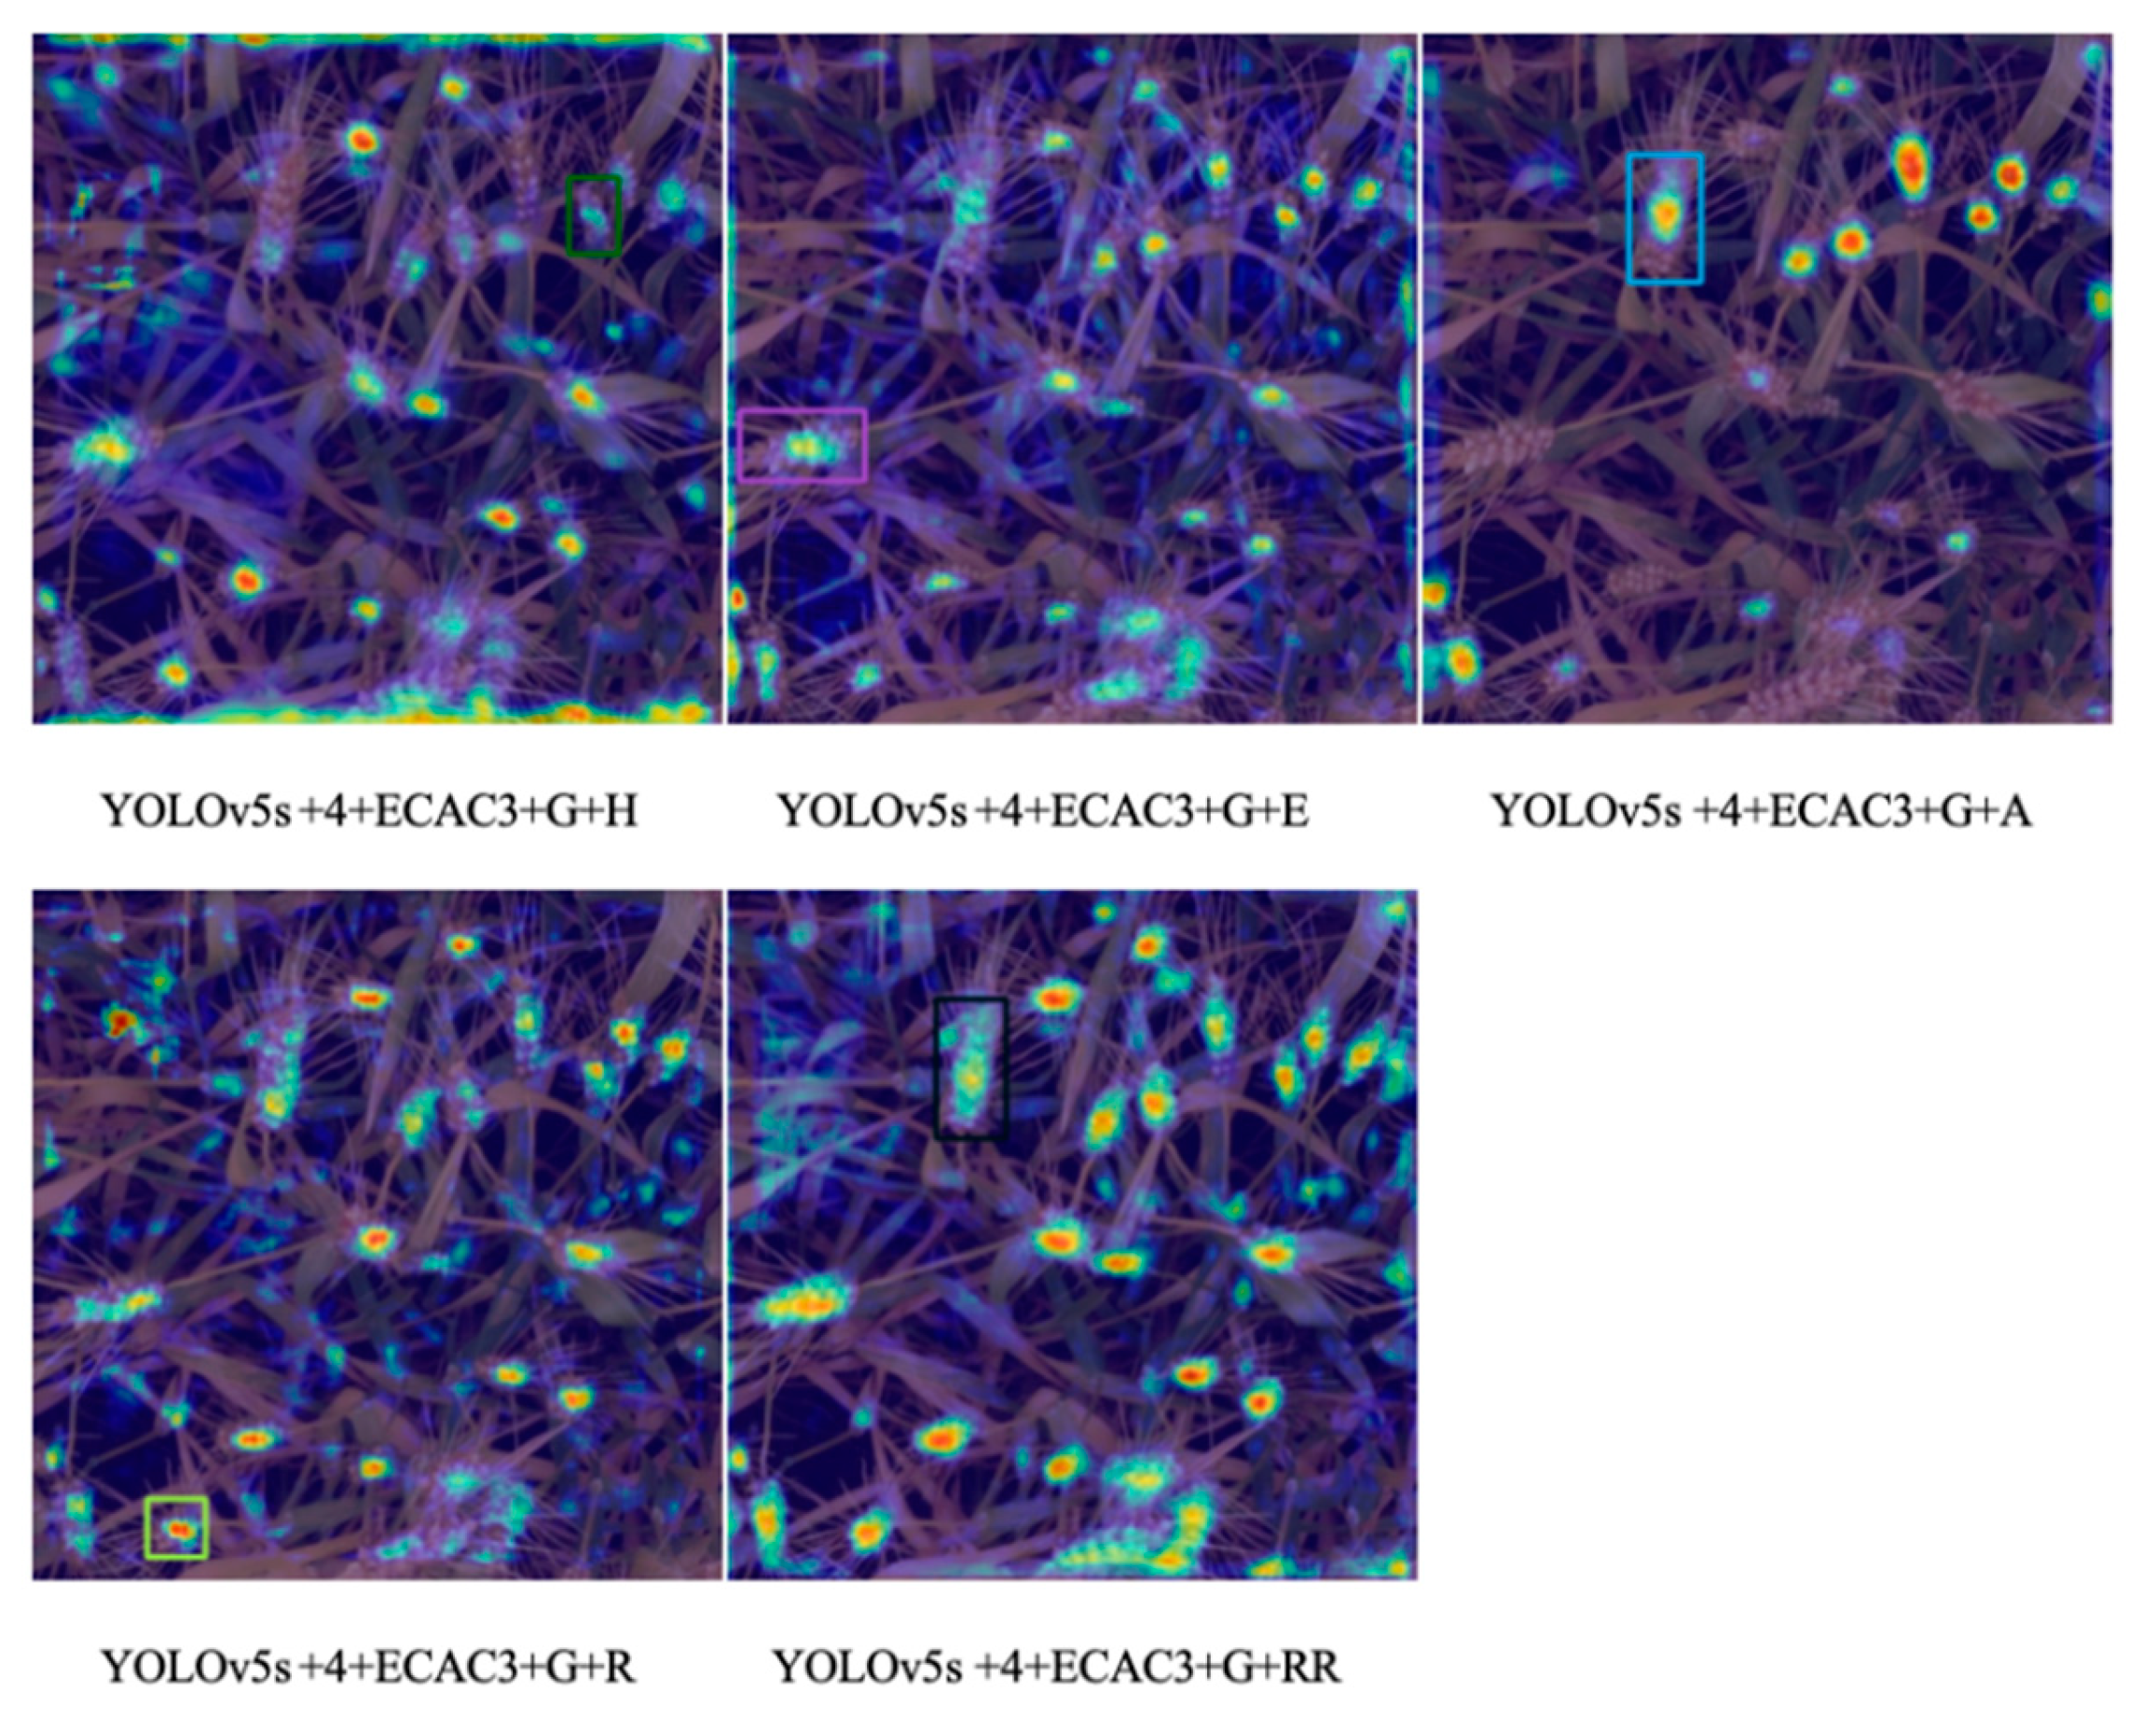
4.3. Comparison of Activation Functions

YOLOv5 utilizes the SiLU activation function. This study explores the impact of substituting the SiLU activation function with Hard-swish [30], ELU [31], Adaptive Composite Neuron (ACON) [32], ReLU, and RReLU in the YOLOv5s + 4 + ECAC3 + G architecture. The modified models are designated as YOLOv5s + 4 + ECAC3 + G + H, YOLOv5s + 4 + ECAC3 + G + E, YOLOv5s + 4 + ECAC3 + G + A, YOLOv5s + 4 + ECAC3 + G + R, and YOLOv5s + 4 + ECAC3 + G + RR, respectively. Comparative analysis (Table 3) indicates that altering the activation function has an inconsequential effect on the model’s parameter count, size, and computational complexity, which are measured in floating-point operations. However, it exerts a substantial influence on the accuracy of wheat spike detection. Notably, the YOLOv5s + 4 + ECAC3 + G + RR model, integrated with the RReLU activation function, demonstrated the highest accuracy rate at 90.94%, surpassing the accuracy of YOLOv5s + 4 + ECAC3 + G, YOLOv5s + 4 + ECAC3 + G + H, YOLOv5s + 4 + ECAC3 + G + E, YOLOv5s + 4 + ECAC3 + G + A, and YOLOv5s + 4 + ECAC3 + G + R by 1.1, 1.04, 4.24, 2.42, and 1.71 percentage points, respectively. Conversely, the YOLOv5s + 4 + ECAC3 + G + E model recorded the lowest accuracy at 86.7%. Consequently, this study elected to substitute the original SiLU activation function with the RReLU activation function for its superior performance in wheat spike detection accuracy. In addition, the YOLOv5s + 4 + ECAC3 + G + RR model exhibits heightened sensitivity and precision in the identification of wheat spikes (Figure 6). Consequently, this study elected to substitute the original SiLU activation function with the RReLU activation function to enhance the model’s performance in wheat spike detection tasks.
Activation functions play a pivotal role in artificial neural networks, including deep learning models [33]. Each activation function has its own strengths and is suited to different types of problems and network architectures. Appropriate activation functions can significantly impact the network’s performance, training dynamics, and its ability to generalize from training data to unseen data. In addition to the original SiLU, five activation functions are used and compared to find the best detection performance. SiLU and ACON introduce more complex non-linearities due to their self-gating mechanisms. ELU and RReLU are designed to handle negative values better than ReLU, which can be beneficial for deeper networks. ReLU and its variants (RReLU, Hard-swish) are generally more computationally efficient due to their simplicity and the absence of exponential operations [34]. In addition, RReLU introduces randomness, which can act as a form of regularization. The results have also shown that RReLU has the best performance compared to other activation functions (Table 4 and Figure 6).

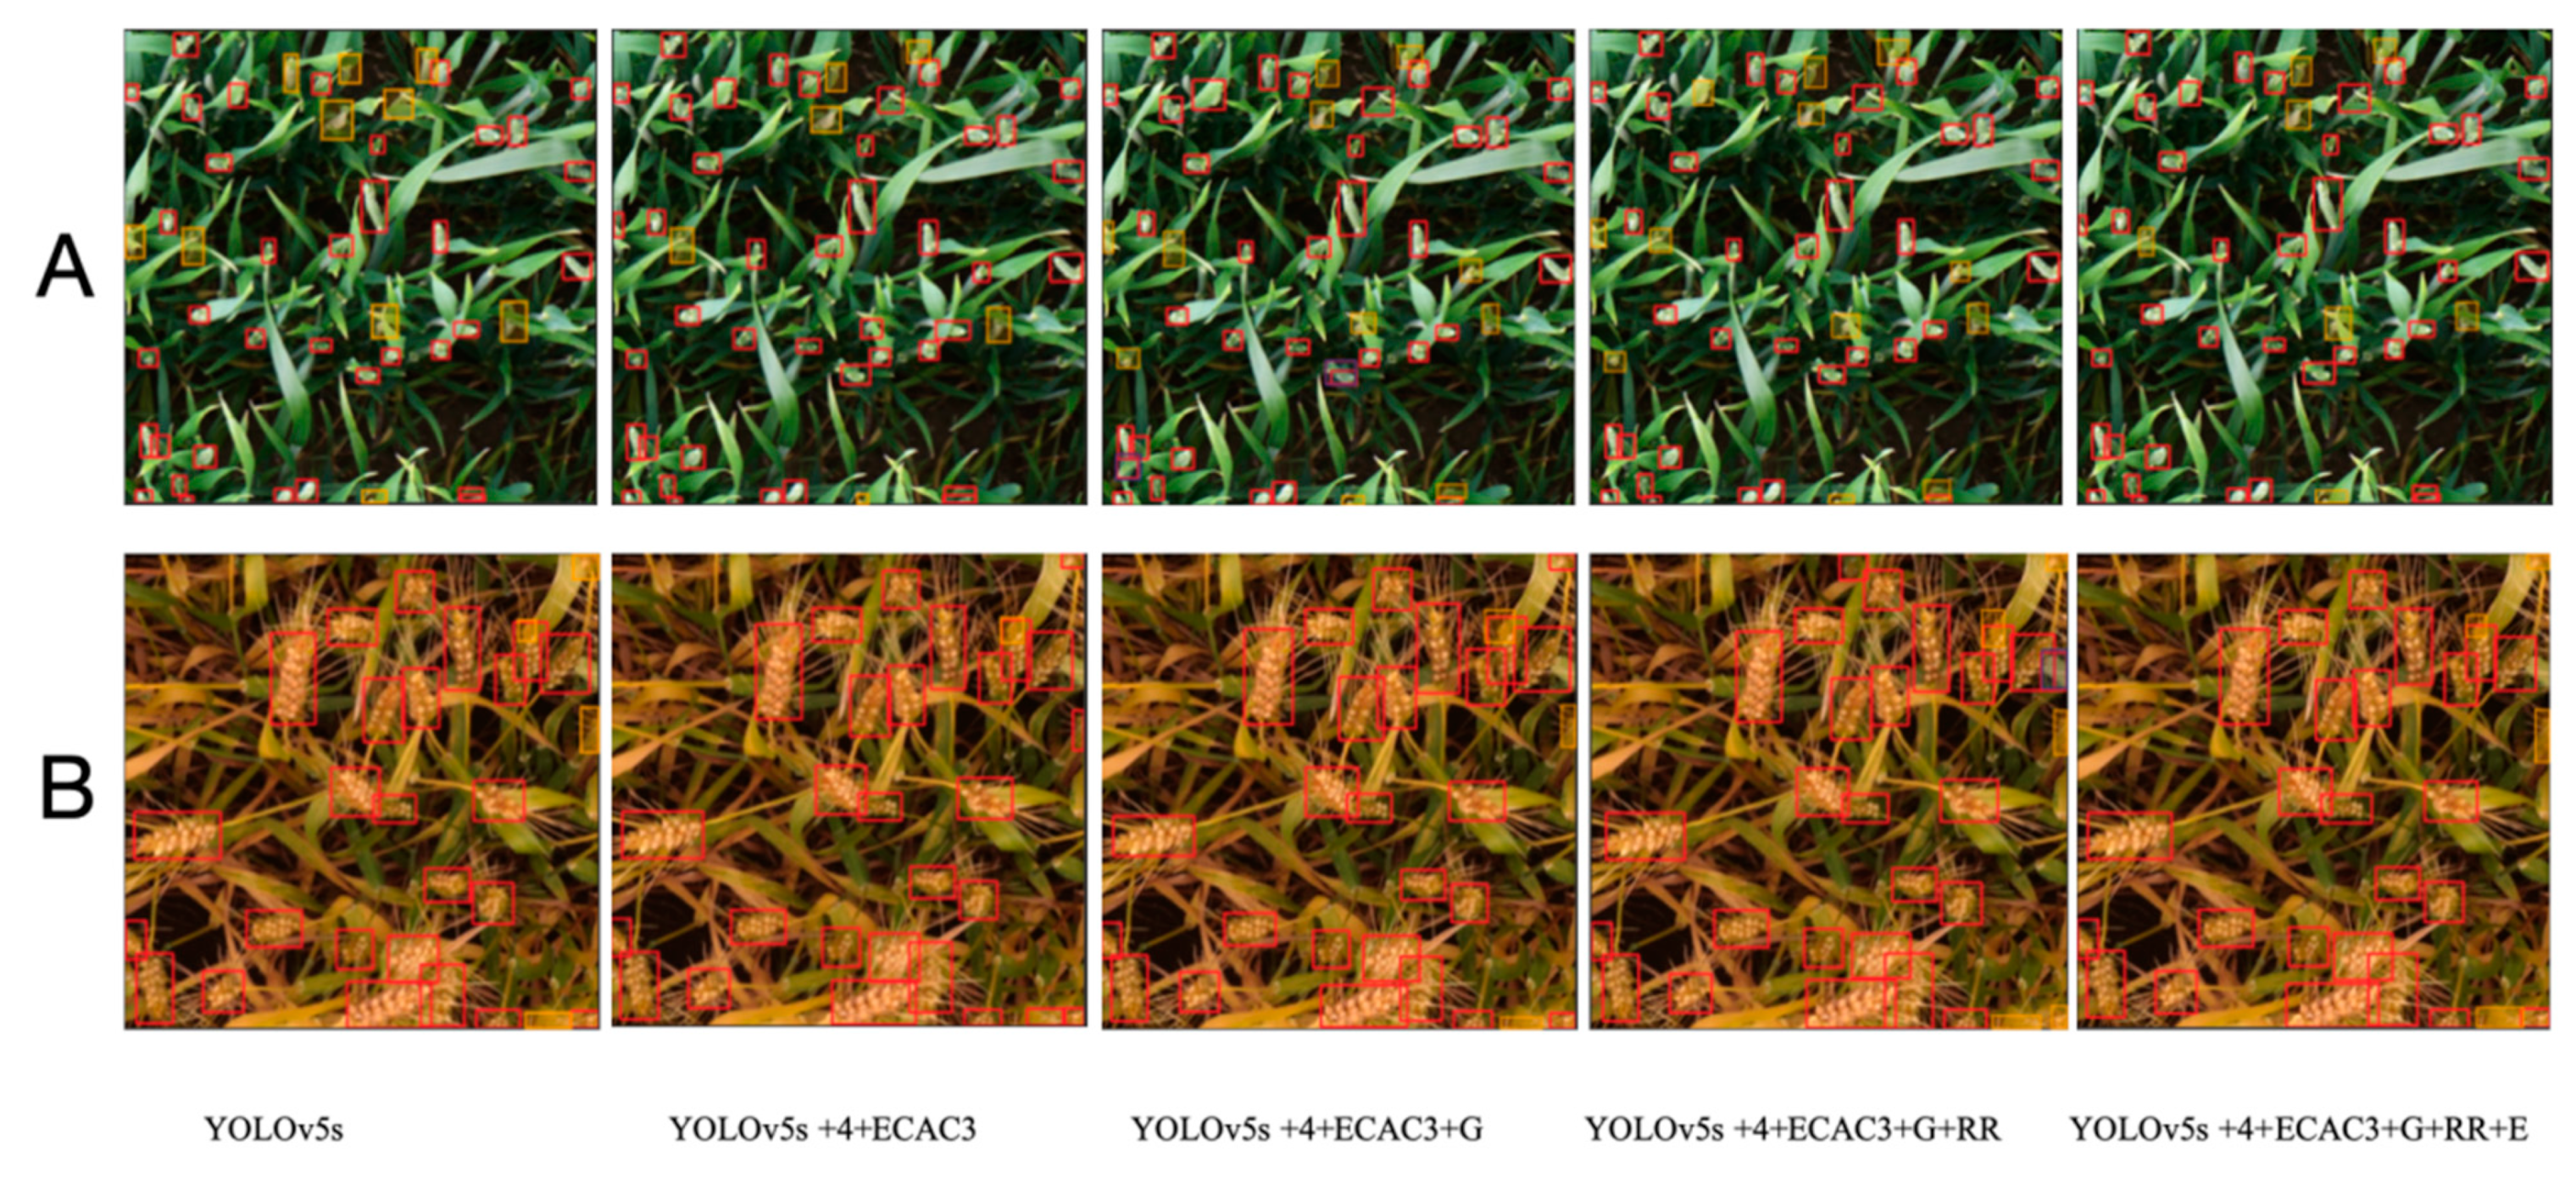
4.4. Comparison of Identification of Wheat Spikes for Different Methods

The YOLOv5s + 4 + ECAC3 + G network model, which has had its CIoU loss function superseded by the EIoU loss function, is designated as YOLOv5s + 4 + ECAC3 + G + RR + E, with the comparative outcomes detailed in Table 5. It demonstrates that the YOLOv5s + 4 + ECAC3 + G network experienced a 32% reduction in parameter volume, a 30% decrease in model dimensions, and a 33.2% reduction in floating-point operations, while its accuracy marginally declined by 0.19 percentage points from the original YOLOv5s network and by 4.13 percentage points from the YOLOv5s + 4 + ECAC3 network. The integration of the RReLU activation function and the EIoU loss function resulted in negligible alterations to the model’s parameters, size, computational load, and detection velocity. The YOLOv5s + 4 + ECAC3 + G + RR model realized a 1.1 percentage point increase in accuracy over the YOLOv5s + 4 + ECAC3 + G upon the introduction of the RReLU activation function, and an additional 0.86 percentage point enhancement subsequent to the incorporation of the EIoU loss function. Despite a minor 2.17 percentage point decrease in accuracy compared to the YOLOv5s + 4 + ECAC3, the YOLOv5s + 4 + ECAC3 + G + RR + E model still achieved a 0.77 percentage point improvement over the YOLOv5s. Furthermore, the parameter count was diminished by 32% and 28.2% relative to the YOLOv5s + 4 + ECAC3 and YOLOv5s, respectively, the model size was curtailed by 28.0% and 20%, and the floating-point operations were reduced by 33.2% and 9.5%, respectively. These refinements render the model highly suitable for practical application in wheat spike detection. In comparison with the references [35,36,37], our proposed method still achieves satisfactory performance despite undergoing a lightweighting process.
To provide a visual representation of the recognition efficacy of the enhanced method, the detection outcomes for wheat spikes during the heading stage (A) and the mature stage (B) were graphically depicted for five models before and after modification (Figure 7). Within these figures, the red bounding boxes denote correctly identified wheat spike targets, the yellow boxes indicate they were not detected, and the dark blue boxes signify they were incorrectly identified. Observations from Figure 7A reveal that the wheat spike omissions for the YOLOv5s, YOLOv5s + 4 + ECAC3, YOLOv5s + 4 + ECAC3 + G, YOLOv5s + 4 + ECAC3 + G + RR, and YOLOv5s + 4 + ECAC3 + G + RR + E models are 4, 1, 3, 4, and 4, respectively, with the YOLOv5s + 4 + ECAC3 + G + RR model exhibiting a single false detection. Figure 7B depicts the number of undetected wheat spikes as 10, 6, 11, 12, and 7, respectively, with the YOLOv5s + 4 + ECAC3 + G model having one incorrect detection. It is evident that the YOLOv5s + 4 + ECAC3 + G + RR + E model, while not outperforming the YOLOv5s + 4 + ECAC3 in detection accuracy, surpasses the original YOLOv5s algorithm in terms of detection effectiveness. EIoU, building upon the foundation of CIoU, calculates the difference in width and height instead of using the aspect ratio, while also incorporating Focal Loss to address the issue of imbalance between easy and difficult samples [32]. EIoU’s refined approach to aspect ratio handling, along with the incorporation of Focal Loss, positions it as an efficient and robust metric for bounding box regression, especially in applications where computational resources and training time are critical considerations. It can be found that the substitution of CIoU with the EIoU loss function has improved the detection accuracy and reduced the rate of missed detections for wheat spikes.

5. Conclusions

The application of deep learning algorithms within the research domain of wheat spike counting has been profound, contributing substantially to the evolution of agricultural development. Nonetheless, the challenge of improving the accuracy and velocity of wheat spike detection against complex backdrops continues to be a critical problem that demands an immediate solution. To achieve a balance between efficiency and accuracy, the smallest and fastest model of YOLOv5s was improved to perform the real-time detection of wheat spikes in field environments, especially for edge devices—mobile applications. A lightweight model was designed by integrating the GhostNet lightweight architecture with the improved YOLOv5s + 4 + ECAC3 model, significantly reducing the model’s computational load. The original SiLU activation function and CIoU loss function were then improved to the RReLU activation function and EIoU loss function, enhancing detection accuracy. The parameter count was reduced by 28.2%, the model size by 20%, and the GFLOPs by 9.5%, respectively, compared to YOLOv5s. This approach not only decreases the model’s computational load but also improves the precision of wheat detection, making it suitable for wheat spike detection tasks. Our study can also provide a methodological reference for detecting and counting other agricultural objects by enhancing object detection models. The thought can continue to be refined for better accuracy and speed, with applications in real-time detection systems for precision agriculture.

Author Contributions

J.Z. and H.Q. conceived and designed the experiments; J.L. and F.D. performed the experiments; J.L., F.D. and L.H. analyzed the data; J.Z. wrote and proofread the paper. All authors have read and agreed to the published version of the manuscript.

Funding

This research was funded by the Key Generic Technology Research and Development Project ‘Announce and Be in Command’ of Hefei City of China (GJ2022QN06), Natural Science Research Project of Anhui Provincial Education Department (2023AH040009), National Natural Science Foundation of China (31971789, 62273001), and Excellent Scientific Research and Innovation Team (2022AH010005).

Data Availability Statement

The original data presented in this study are openly available in Global Wheat Dataset Consortium at https://zenodo.org/records/5092309 (accessed on 2 July 2024).

Conflicts of Interest

Authors Jingsong Li and Haiming Qian were employed by the company Institute of Space Integrated Ground Network Anhui Co., Ltd. The remaining authors declare that the research was conducted in the absence of any commercial or financial relationships that could be construed as a potential conflict of interest.

References

  1. Lv, Z.; Liu, X.; Cao, W.; Zhu, Y. Climate change impacts on regional winter wheat production in main wheat production regions of China. Agric. Forest Meteorol. 2013, 171, 234–248. [Google Scholar] [CrossRef]
  2. Zhao, J.; Du, S.; Huang, L. Monitoring wheat powdery mildew (Blumeria graminis f. sp. tritici) using multisource and multitemporal satellite images and support vector machine classifier. Smart Agric. 2022, 4, 17–28. [Google Scholar]
  3. Qiu, R.; He, Y.; Zhang, M. Automatic detection and counting of wheat spikelet using semi-automatic labeling and deep learning. Front. Plant Sci. 2022, 13, 872555. [Google Scholar] [CrossRef] [PubMed]
  4. Zhao, J.; Yan, J.; Xue, T.; Wang, S.; Qiu, X.; Yao, X.; Tian, Y.; Zhu, Y.; Cao, W.; Zhang, X. A deep learning method for oriented and small wheat spike detection (OSWSDet) in UAV images. Comput. Electron. Agric. 2022, 198, 107087. [Google Scholar] [CrossRef]
  5. Khaki, S.; Safaei, N.; Pham, H.; Wang, L. WheatNet: A lightweight convolutional neural network for high-throughput image-based wheat head detection and counting. Neurocomputing 2022, 489, 78–89. [Google Scholar] [CrossRef]
  6. Wiwart, M.; Suchowilska, E.; Lajszner, W.; Graban, Ł. Identification of hybrids of spelt and wheat and their parental forms using shape and color descriptors. Comput. Electron. Agric. 2012, 83, 68–76. [Google Scholar] [CrossRef]
  7. Pourreza, A.; Pourreza, H.; Abbaspour-Fard, M.H.; Sadrnia, H. Identification of nine Iranian wheat seed varieties by textural analysis with image processing. Comput. Electron. Agric. 2012, 83, 102–108. [Google Scholar] [CrossRef]
  8. Alharbi, N.; Zhou, J.; Wang, W. Automatic counting of wheat spikes from wheat growth images. In Proceedings of the 7th International Conference on Pattern Recognition Applications and Methods, Madeira, Portugal, 16–18 January 2018; SciTePress—Science and Technology Publications: Setúbal, Portugal, 2018; pp. 346–355. [Google Scholar]
  9. Madec, S.; Jin, X.; Lu, H.; De Solan, B.; Liu, S.; Duyme, F.; Heritier, E.; Baret, F. Ear density estimation from high resolution RGB imagery using deep learning technique. Agric. Forest Meteorol. 2019, 264, 225–234. [Google Scholar] [CrossRef]
  10. Artemenko, N.V.; Genaev, M.A.; Epifanov, R.U.; Komyshev, E.G.; Kruchinina, Y.V.; Koval, V.S.; Goncharov, N.P.; Afonnikov, D.A. Image-based classification of wheat spikes by glume pubescence using convolutional neural networks. Front. Plant Sci. 2024, 14, 1336192. [Google Scholar] [CrossRef]
  11. Yang, B.; Gao, Z.; Gao, Y.; Zhu, Y. Rapid detection and counting of wheat ears in the field using YOLOv4 with attention module. Agronomy 2021, 11, 1202. [Google Scholar] [CrossRef]
  12. Hong, Q.; Jiang, L.; Zhang, Z.; Ji, S.; Gu, C.; Mao, W.; Li, W.; Liu, T.; Li, B.; Tan, C. A lightweight model for wheat ear fusarium head blight detection based on RGB images. Remote Sens. 2022, 14, 3481. [Google Scholar] [CrossRef]
  13. Shen, R.; Zhen, T.; Li, Z. YOLOv5-based model integrating separable convolutions for detection of wheat head images. IEEE Access 2023, 11, 12059–12074. [Google Scholar] [CrossRef]
  14. David, E.; Serouart, M.; Smith, D.; Madec, S.; Velumani, K.; Liu, S.; Wang, X.; Pinto, F.; Shafiee, S.; Tahir, I.S.; et al. Global wheat head detection 2021: An improved dataset for benchmarking wheat head detection methods. Plant Phenomics 2021, 2021, 9846158. [Google Scholar] [CrossRef] [PubMed]
  15. Wang, Q.; Wu, B.; Zhu, P.; Li, P.; Zuo, W.; Hu, Q. ECA-Net: Efficient channel attention for deep convolutional neural networks. In Proceedings of the IEEE/CVF Conference on Computer Vision and Pattern Recognition, Seattle, WA, USA, 14–19 June 2020; pp. 11534–11542. [Google Scholar]
  16. Hou, Q.; Zhou, D.; Feng, J. Coordinate attention for efficient mobile network design. In Proceedings of the IEEE/CVF Conference on Computer Vision and Pattern Recognition, Virtual Event, 20–25 June 2021; pp. 13713–13722. [Google Scholar]
  17. Woo, S.; Park, J.; Lee, J.Y.; Kweon, I.S. Cbam: Convolutional block attention module. In Proceedings of the European Conference on Computer Vision (ECCV), Munich, Germany, 8–14 September 2018; pp. 3–19. [Google Scholar]
  18. Wang, H.; Lu, F.; Tong, X.; Gao, X.; Wang, L.; Liao, Z. A model for detecting safety hazards in key electrical sites based on hybrid attention mechanisms and lightweight Mobilenet. Energy Rep. 2021, 7, 716–724. [Google Scholar] [CrossRef]
  19. Zhao, L.; Wang, L. A new lightweight network based on MobileNetV3. KSII Trans. Internet Inform. Syst. 2022, 16, 1–15. [Google Scholar]
  20. Han, J.; Yang, Y. L-Net: Lightweight and fast object detector-based ShuffleNetV2. J. Real-Time Image Process. 2021, 18, 2527–2538. [Google Scholar] [CrossRef]
  21. Yin, J.; Guo, L.; Jiang, W.; Hong, S.; Yang, J. ShuffleNet-inspired lightweight neural network design for automatic modulation classification methods in ubiquitous IoT cyber–physical systems. Comput. Commun. 2021, 176, 249–257. [Google Scholar] [CrossRef]
  22. Li, H.; Qiu, W.; Zhang, L. Improved ShuffleNet V2 for lightweight crop disease identification. J. Comput. Eng. Appl. 2022, 58, 260. [Google Scholar]
  23. Han, K.; Wang, Y.; Tian, Q.; Guo, J.; Xu, C.; Xu, C. Ghostnet: More features from cheap operations. In Proceedings of the IEEE/CVF Conference on Computer Vision and Pattern Recognition, Seattle, WA, USA, 14–19 June 2020; pp. 1580–1589. [Google Scholar]
  24. Agarap, A.F. Deep learning using rectified linear units (relu). arXiv 2018, arXiv:1803.08375. [Google Scholar]
  25. Liu, W.; Anguelov, D.; Erhan, D.; Szegedy, C.; Reed, S.; Fu, C.Y.; Berg, A.C. Ssd: Single shot multibox detector. In Proceedings of the Computer Vision–ECCV 2016: 14th European Conference, Amsterdam, The Netherlands, 11–14 October 2016; pp. 21–37. [Google Scholar]
  26. Olorunshola, O.E.; Irhebhude, M.E.; Evwiekpaefe, A.E. A comparative study of YOLOv5 and YOLOv7 object detection algorithms. J. Comput. Soc. Inform. 2023, 2, 1–12. [Google Scholar] [CrossRef]
  27. Wang, C.Y.; Bochkovskiy, A.; Liao, H.Y.M. YOLOv7: Trainable bag-of-freebies sets new state-of-the-art for real-time object detectors. In Proceedings of the IEEE/CVF Conference on Computer Vision and Pattern Recognition, Vancouver, BC, Canada, 18–22 June 2023; pp. 7464–7475. [Google Scholar]
  28. Zhang, X.; Zhou, X.; Lin, M.; Sun, J. Shufflenet: An extremely efficient convolutional neural network for mobile devices. In Proceedings of the IEEE Conference on Computer Vision and Pattern Recognition, Salt Lake City, UT, USA, 18–22 June 2018; pp. 6848–6856. [Google Scholar]
  29. Howard, A.; Sandler, M.; Chu, G.; Chen, L.C.; Chen, B.; Tan, M.; Wang, W.; Zhu, Y.; Pang, R.; Vasudevan, V.; et al. Searching for mobilenetv3. In Proceedings of the IEEE/CVF International Conference on Computer Vision, Seoul, Republic of Korea, 27 October–3 November 2019; pp. 1314–1324. [Google Scholar]
  30. Zheng, Z.; Wang, P.; Liu, W.; Li, J.; Ye, R.; Ren, D. Distance-IoU loss: Faster and better learning for bounding box regression. In Proceedings of the AAAI Conference on Artificial Intelligence, New York, NY, USA, 7–12 February 2020; pp. 12993–13000. [Google Scholar]
  31. Xu, B.; Wang, N.; Chen, T.; Li, M. Empirical evaluation of rectified activations in convolutional network. arXiv 2015, arXiv:1505.00853. [Google Scholar]
  32. Zhang, Y.F.; Ren, W.; Zhang, Z.; Jia, Z.; Wang, L.; Tan, T. Focal and efficient IOU loss for accurate bounding box regression. Neurocomputing 2022, 506, 146–157. [Google Scholar] [CrossRef]
  33. Dubey, S.R.; Singh, S.K.; Chaudhuri, B.B. Activation functions in deep learning: A comprehensive survey and benchmark. Neurocomputing 2022, 503, 92–108. [Google Scholar] [CrossRef]
  34. Xia, Y.; Zhang, J.; Gong, Z.; Jiang, T.; Yao, W. RBUE: A ReLU-based uncertainty estimation method for convolutional neural networks. Complex Intell. Syst. 2023, 9, 4735–4749. [Google Scholar] [CrossRef]
  35. Bhagat, S.; Kokare, M.; Haswani, V.; Hambarde, P.; Kamble, R. WheatNet-Lite: A novel light weight network for wheat head detection. In Proceedings of the 2021 IEEE CVF International Conference Computer Vision Workshop, ICCVW 2021, Montreal, BC, Canada, 11–17 October 2021; pp. 1332–1341. [Google Scholar]
  36. Wen, C.; Wu, J.; Chen, H.; Su, H.; Chen, X.; Li, Z.; Yang, C. Wheat spike detection and counting in the field based on SpikeRetinaNet. Front. Plant Sci. 2022, 13, 821717. [Google Scholar] [CrossRef]
  37. Zhang, G.; Wang, Z.; Liu, B.; Gu, L.; Zhen, W.; Yao, W. A density map-based method for counting wheat ears. Front. Plant Sci 2024, 15, 1354428. [Google Scholar] [CrossRef]
Figure 1. Network structure of YOLOv5s + 4 + ECAC3.
Agronomy 14 02036 g001
Figure 2. Comparison of traditional (a) and Ghost (b) convolutions.
Agronomy 14 02036 g002
Figure 3. Ghost bottleneck structure.
Agronomy 14 02036 g003
Figure 4. Network structure of YOLOv5s + 4 + ECAC3 + G.
Agronomy 14 02036 g004
Figure 5. The function of RReLU.
Agronomy 14 02036 g005
Figure 6. Comparison of heat maps of five methods with different activation functions.
Agronomy 14 02036 g006
Figure 7. Visual inspection results of different methods: (A) heading stage; (B) mature stage. Red boxes indicate the identified wheat spikes, while yellow boxes denote the non-detected objects.
Agronomy 14 02036 g007
Table 1. Training parameters for the model.
ParameterValue
Learning rate0.01
Momentum coefficient0.937
Weight decay0.005
Batchsize16
Epoch150
Table 2. Recognition performance comparison of seven methods.
MethodP/%R/%mAP@0.5/%GFLOPsInference Speed (ms)
YOLOv5s92.689.794.215.813.4
YOLOv5m93.489.194.247.921.4
YOLOv5x93.189.894.2203.827.4
YOLOv5l92.290.394.447.920.8
YOLOv794.096.093.6105.145.1
SSD [25]90.445.969.961.599.2
YOLOv5s + 4 + ECAC392.889.894.621.420.2
Table 4. Performance comparison of activation functions.
MethodPara (M)Size (MB)GFlOPsFPS
YOLOv5s + 4 + ECAC3 + G5.1011.6014.3089.84
YOLOv5s + 4 + ECAC3 + G + H [30]5.1011.6014.3089.90
YOLOv5s + 4 + ECAC3 + G + E [31]5.1011.6014.3086.70
YOLOv5s + 4 + ECAC3 + G + A [32]5.1011.6014.3088.52
YOLOv5s + 4 + ECAC3 + G + R [24]5.1011.6014.3089.23
YOLOv5s + 4 + ECAC3 + G + RR5.1011.6014.3090.94
Table 5. Performance comparison of wheat spike identification using different algorithms.
MethodPara (M)Size (MB)GFlOPsFPSAcc (%)
YOLOv5s7.0114.5015.8074.6091.03
YOLOv5s + 4 + ECAC37.5016.1021.4049.5093.97
YOLOv5s + 4 + ECAC3 + G5.1011.6014.3051.8089.84
YOLOv5s + 4 + ECAC3 + G + RR5.1011.6014.3051.8090.94
YOLOv5s + 4 + ECAC3 + G + RR + E5.1011.6014.3051.3091.80
[35]----91.30
[36] 92.62
[37]----90.45
Disclaimer/Publisher’s Note: The statements, opinions and data contained in all publications are solely those of the individual author(s) and contributor(s) and not of MDPI and/or the editor(s). MDPI and/or the editor(s) disclaim responsibility for any injury to people or property resulting from any ideas, methods, instructions or products referred to in the content.

