Article

Occurrence of Polycyclic Aromatic Hydrocarbons (PAHs) in Pyrochar and Hydrochar during Thermal and Hydrothermal Processes

1
Red River Research Station, Louisiana State University Agricultural Center, 262 Research Station Dr., Bossier City, LA 71112, USA
2
Department of Integrative Biology, Kyungpook National University, Daegu 41566, Republic of Korea
3
Leibniz Institute for Agricultural Engineering and Bio-Economy e.V. (ATB), Max-Eyth-Allee 100, 14469 Potsdam, Germany
4
Postgraduate Program in Bioprocess Engineering and Biotechnology, Federal Technological University of Paraná—UTFPR, Campus Toledo, Cristo Rei 19, Vila Becker, Toledo 85902-490, PR, Brazil
5
Coastal Plains Soil, Water & Plant Research Center, United States Department of Agriculture (USDA) Agricultural Research Service (ARS), 2611 W. Lucas St., Florence, SC 29501, USA
6
Department of Environmental Engineering and Earth Sciences, Clemson University, Clemson, SC 29634, USA
*
Author to whom correspondence should be addressed.
Agronomy 2024, 14(9), 2040; https://doi.org/10.3390/agronomy14092040
Submission received: 17 July 2024 / Revised: 22 August 2024 / Accepted: 3 September 2024 / Published: 6 September 2024

Abstract

:
Pyrochar (Biochar) produced from the thermochemical conversion of biomass has been widely used as a soil amendment to improve agricultural soil quality. Since polycyclic aromatic hydrocarbons (PAHs) can be produced in such processes, the occurrence of PAHs in pyrochars has been extensively studied, and standards such as the European Biochar Certificate (EBC) and International Biochar Initiative (IBI) contain limit values for biochars applied to soils. However, studies on PAH levels in hydrochars from hydrothermal processes, which can be an alternative to wet biomass are scarce. This study focuses on comparing the occurrence of 16 PAHs regulated by the US EPA in 22 char samples (including pyrochars from pyrolysis, hydrochars from hydrothermal carbonization, and, for the first time, hydrothermal humification) using an ultrasonic extraction method. Results showed that the sum of the 16 EPA PAHs in all samples was well below the requirements of the two standards, except for pyrochar produced at the farm scale. They ranged from 131 to 9358 µg·kg−1 in the seven pyrochars and from not detected to 333 µg·kg−1 for the fourteen hydrochars. Our findings indicate that hydrochar produced via hydrothermal methods exhibits much lower concentrations and is a safe option for soil amendment and environmental applications.

1. Introduction

Pyrochar (Biochar) has been used in agriculture to improve soil physio-chemical properties like fertility, cation exchange capacity (CEC), and water holding capacity [1]. Due to the increased focus on pyrochar as a method for carbon sequestration in soil and its applications in soil and environmental enhancement, it is crucial to assess potential toxic and harmful byproducts, such as polycyclic aromatic hydrocarbons (PAHs), that may form during the carbonization process. PAHs are compounds with more than two fused benzene rings [2] and are classified into low molecular weight PAHs (2–3 rings) and high molecular weight PAHs (more than four rings) [3]. Generally, the primary source of PAH emissions is the incomplete combustion of fossil fuels, biomass, and even foods [2]. These compounds are of concern because of their possible carcinogenic and toxic environmental effects [4]. Regulators and researchers must continuously improve methods to determine and predict the level of PAH in various matrices, including air, food, and soil [5,6]. Sixteen PAH congeners have been listed by the US Environmental Protection Agency (EPA) as priority PAHs due to their potential toxicity and environmental occurrence. In addition, PAHs are persistent in the natural environment, which means once these chemicals enter the environment, they remain and can affect various organisms [7,8]. Moreover, previous studies have reported that residual PAHs in the soil may be taken up through the root systems and translocated to other tissues of the plant [8], potentially threatening human health through the food chain [7,8]. Their toxicity is often evaluated using a quantitative risk assessment methodology with toxicity equivalency factors (TEF) [7].
Various regulations exist in most countries to limit PAHs in specific products and environments [9]. Often, the sum of the 16 EPA PAHS (ΣPAH16) or specific PAHs is used as an indicator of PAH occurrence and regulation. For example, the European Food Safety Authority (EFSA) selected the sum of eight PAHs classified as carcinogenic (ΣPAH8) or a subgroup of four (ΣPAH4) as the most suitable markers for food [10]. Guidelines for the amount of PAHs allowed in biochar for soil applications as well as for multiple other purposes have been developed by various groups to protect human health [5]. The European Biochar Certificate (EBC) established the thresholds of PAH as 1 mg kg−1 (ΣPAH8) for premium grade biochar and 4 mg kg−1 (ΣPAH8) for basic grade [11]. Similarly, the International Biochar Initiative (IBI) has also set 20 mg kg−1 as the maximum allowable level of PAH in biochar application in soil [12].
The most common carbonization process is thermal pyrolysis under an oxygen-limited atmosphere with relatively high temperatures ranging from 300 °C to 800 °C, depending on the specific process and desired outcomes [13]. The drying process of feedstocks is an essential step in processing pyrochar [13,14,15]. In contrast, hydrothermal carbonization (HTC) transforms feedstocks into carbon-rich solids in the presence of moisture at relatively low temperatures (around 180 °C to 250 °C). In addition, process water (PW) is a byproduct that contains soluble organic compounds such as sugars, organic acids, aromatics, nutrients, and a small amount of gas, mainly CO2 [16]. During the HTC process, the feedstock undergoes multiple chemical reactions, including cyclization, dealkylation, dehydration, repolymerization, and catalyzation [14,17]. In this carbonization process, water acts as a reactant and a catalyst [18]. Recently, a hydrothermal humification (HTH) process was developed to produce humic-like substances while minimizing aromatic compound production [19]. The process of HTH can be operated with a similar HTC process condition except under alkaline conditions [20]. Compared with thermal carbonization, processing hydrothermal carbonization can eliminate the need for a pre-drying step [18,21], making these processes more economically viable for a large number of wet feedstocks [18,22].
In general, the thermal conversion of biomass can potentially generate PAHs that can be found in solid, liquid, or gaseous products. Studies on the generation and occurrence of PAHs during thermal and hydrothermal processes have shown that the type and composition of feedstock, equipment configuration, and/or process conditions, such as temperature, holding time, heating rate, and gas flow rate, can have mutual synergistic or antagonistic effects. However, these factors remain unclear [6,23,24]. For instance, studies on the effect of reaction temperature on the composition of PAHs [25,26] reported that pyrochars produced at higher temperatures contained higher levels of high molecular weight PAHs [25,27]. However, based on their evaluation of 50 pyrochars, Hale et al. (2012) concluded that PAH concentrations generally decreased with increasing pyrolysis time and temperature. The feedstock type and composition also impact the formation of PAHs during the conversion process [5]. In previous reports, cellulose, hemicellulose, and lignin have all been found to be precursors of PAH, but the conversion efficiency to PAH can differ [5]. Pyrochars derived from lignin-rich feedstocks showed lower PAH levels than those derived from lower lignin contents [5,28,29]. However, other studies have reported that no clear trends in PAH content can be associated with a particular feedstock [24].
Important sources for the inconsistent or divergent results on pyrochar found in the literature may be engineering aspects, such as the design aspects and control of the equipment operation, given the difficulties of achieving homogenous reaction conditions with heterogeneous feedstock, particularly in large-scale reactors [24,28,30], not to mention the different extraction and analytical methods used to identify the PAHs [31]. Wang et al. (2018) found the total concentration of PAH in the commercially available pyrochars from China was significantly higher than PAH levels from the pyrochars produced in the laboratory under well-controlled conditions. Other studies also found a higher level of PAH contamination in large-scale or commercially available pyrochar than at the lab scale, probably due to nonuniform temperature conditions [24].
In contrast, studies on the occurrence of PAHs in hydrochars are considerably fewer than those on pyrochars. Only a few papers report PAHs formation and distribution in hydrothermal carbonization process products (hydrochar and process water) [32,33,34,35]. Therefore, due to the lack of data, knowledge about the formation mechanisms is still incipient, and the effect of operational variables of HTC processes on the occurrence of PAHs is not completely understood.
In order to fill this gap, this study investigates the PAH concentrations and BaP toxic equivalents in a range of pyrochars produced from thermal carbonization and two types of hydrochars (HTC and HTH). By comparing the results of PAH content between literature values and current standards, we aim to understand the potential safety and environmental risks associated with using these pyrochars, hydrochars, and humic-like solids, particularly in agriculture and environmental applications.

2. Materials and Methods

2.1. Chemicals

The standard chemicals, PAHs mix (acenaphthene (Acp), acenaphthylene (Ace), anthracene (Ant), benzo(a)anthracene (BaA), benzo(a)pyrene (BaP), benzo(b)fluoranthene (BbF), benzo(g,h,i) perylene (BghiP), benzo(k)fluoranthene (BkF), chrysene (Chr), dibenzo(a,h) anthracene (DbA), fluoranthene (Flu), fluorene (Fl), indeno(1,2,3-cd)pyrene (InP), naphthalene (Nap), phenanthrene (Phe), and pyrene (Py), and surrogate (Naphthalene-d8, acenaphthene-d10, phenanthrene-d10, chrysene-d10, perylene-d12) were purchased from Sigma-Aldrich (St. Louis, MO, USA). The standard solution was diluted in an organic solvent (dichloromethane: benzene, 50:50) to prepare a series of standard solutions. The grade of all other chemicals was higher than the analytical grade.

2.2. Char Samples

The seven pyrochar (PYR) and fourteen hydrochar (HYD) samples were made from eight feedstocks according to the methods previously reported [36]. In addition, one natural sample (NAT), the topsoil after the forest fire, was included in the study. The two charring processes, thermal and hydrothermal pyrolysis, were carried out at two scales. At the lab scale, four different reactors were used (Table S1), including two hydrothermal carbonization reactors (Parr Instrument Company, Moline, IL, USA), a top-lit up-draft (TLUD) reactor, and a nitrogen-flushed pyrolysis oven. For farm-scale pyrolysis, a batch-fed autothermal Carbontwister (Prodana GmbH, DE, Neumarkt, Germany), batch-fed allothermal VarioL (SPSC GmbH, DE, Ottobrunn, Germany), and continuous allothermal C63-F (Biomacon GmbH, DE, Rehburg, Germany) were used. Detailed information about the charring conditions, feedstocks, reactor type, pH in the inputs and outputs, and solid yield of char is given in Table 1. Eight feedstock materials were charred, alone or in combination: late-harvest grass, sugar beet pellets, biogas digestate (separated, unseparated), byproducts of processed coffee (fresh skin from fresh-picked coffee berries, dry husks from dried coffee berries), a brown macroalgae (Fucus vesicolusos), and a halophyte (Salicornia). Table 2 presents the nine materials, their types, moisture content, and source information.

2.3. Extraction of PAHs from Chars

The preparation of samples was performed using the ultrasonic extraction method according to a method previously reported with slight modifications [37]. Many studies have adopted the Soxhlet method for extracting PAH from char, but this method takes too much time and has comparatively significant human errors. For this reason, we attempted to establish an easy and quick method for extracting PAHs from PYR and HYD for analysis using GC-MS. Briefly, 1 g of the sample was weighed, placed in a 250 mL flat-bottom evaporating flask, and spiked with 10 µL of 10 µg·mL−1 surrogate solution. After spiking the surrogate, 40 mL of toluene was added to the flask, followed by sonication of the samples in an ultrasonic bath for 30 min for extraction. To separate the solution, the extractant was filtered with a 90 mm diameter GF/C glass microfiber filter (Whatman Grade GF/C Glass Microfiber Filter, Whatman, Maidstone, UK). The separated solution was condensed with a nitrogen evaporator, and finally, 1 mL of the sample was used to determine the level of PAHs in the various biochars. For the recovery test, 200 and 500 ng of the standard mix were spiked into the blank biochar sample and air-dried to evaporate the solvent. The spiked samples underwent all the steps for the preparation of the samples stated above.

2.4. Instrumental Analysis

The levels of PAHs in the biochars were determined in the extractants using gas chromatography-mass spectrometry (GC-MS, Agilent 7890 with Agilent 5975C MSD, Agilent Technologies, Santa Clara, CA, USA) according to the method reported in [38] with slight modifications. A DB-5MS capillary column (30 m × 0.25 mm × 0.25 µm, Agilent) was installed in the oven of the GC to separate the analytes in the samples. The inlet temperature was 300 °C, and 1 µL of the sample was injected using an Agilent 7683 Automatic liquid sampler in splitless mode. The oven temperature was held at 65 °C for 2 min, elevated to 140 °C at a rate of 10 °C/min (held for 10 min), increased to 200 °C at a rate of 10 °C/min (held for 5 min), and finally increased to 290 °C at a rate of 8 °C/min (held for 15 min). The temperatures of the MS source and MS quad were set to 230 and 180 °C, respectively. Determination of the PAHs in the samples was performed using the selective ion monitoring mode and acquisition GC-MS software (MassHunter acquisition software B.07.02 for GC-SQ, Agilent Technologies, Santa Clara, CA, USA). Ions used for analyzing PAHs in the chars are shown in Table S2. Qualitative and quantitative analyses were conducted using MassHunter Qualitative analysis B.10.00 (Agilent) and MassHunter Quantitative analysis for MS B.10.00 (Agilent), respectively.

2.5. Statistical Analysis

All statistical analyses were performed using GraphPad Prism 10 (GraphPad Software, San Diego, CA, USA), with multiple comparisons by one-way ANOVA. Significant differences were calculated using Tukey’s test. All data are presented as the mean ± standard deviation. The value of p < 0.05 was considered statistically significant.

3. Results

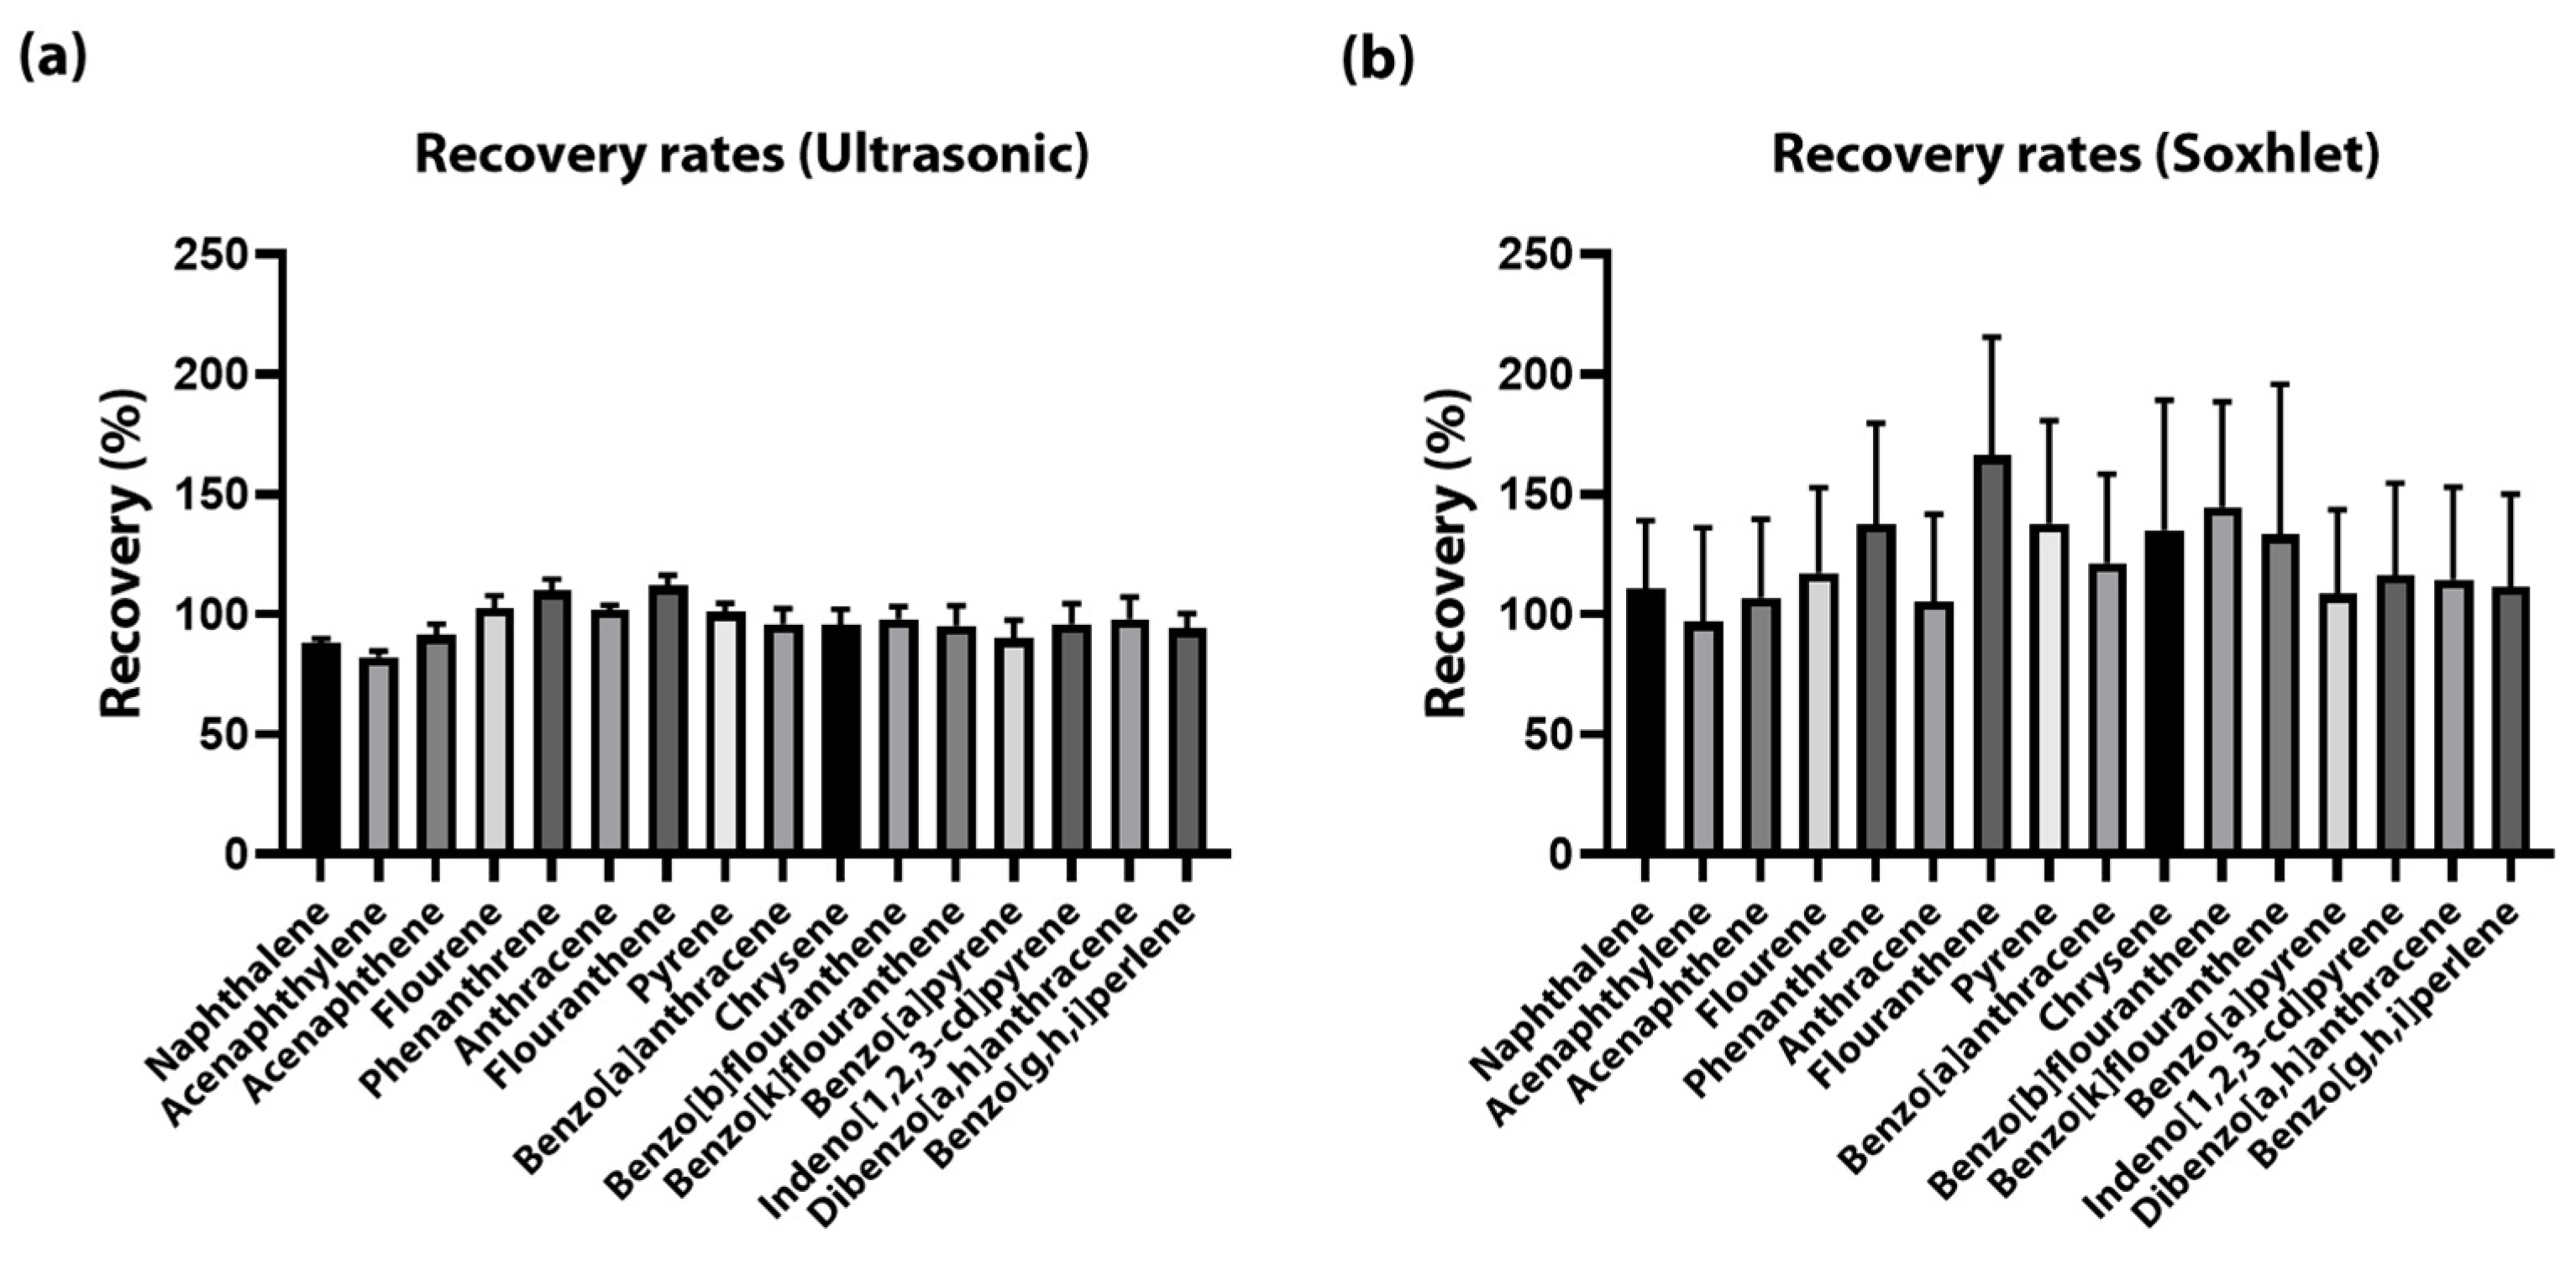
3.1. Validation of the Methods

The chromatogram of the standard solution using the selective ion monitoring mode is shown in Figure S1. The recovery rates of 16 US EPA primary PAHs were 82.19 to 111.89% of the level of the spiked compounds (200 µg∙kg−1). Acenaphthylene has the lowest recovery rate, 82.19%, and fluoranthene has the highest recovery rate after sample preparation, 111.89%. A calibration curve was created using the acquired data of the seven concentrations of the serially diluted standard solutions (10, 25, 50, 100, 250, 500, and 1000 µg∙kg−1). The linearities of the targeted compounds were higher than 0.998, and all curves are shown in Figure S2.

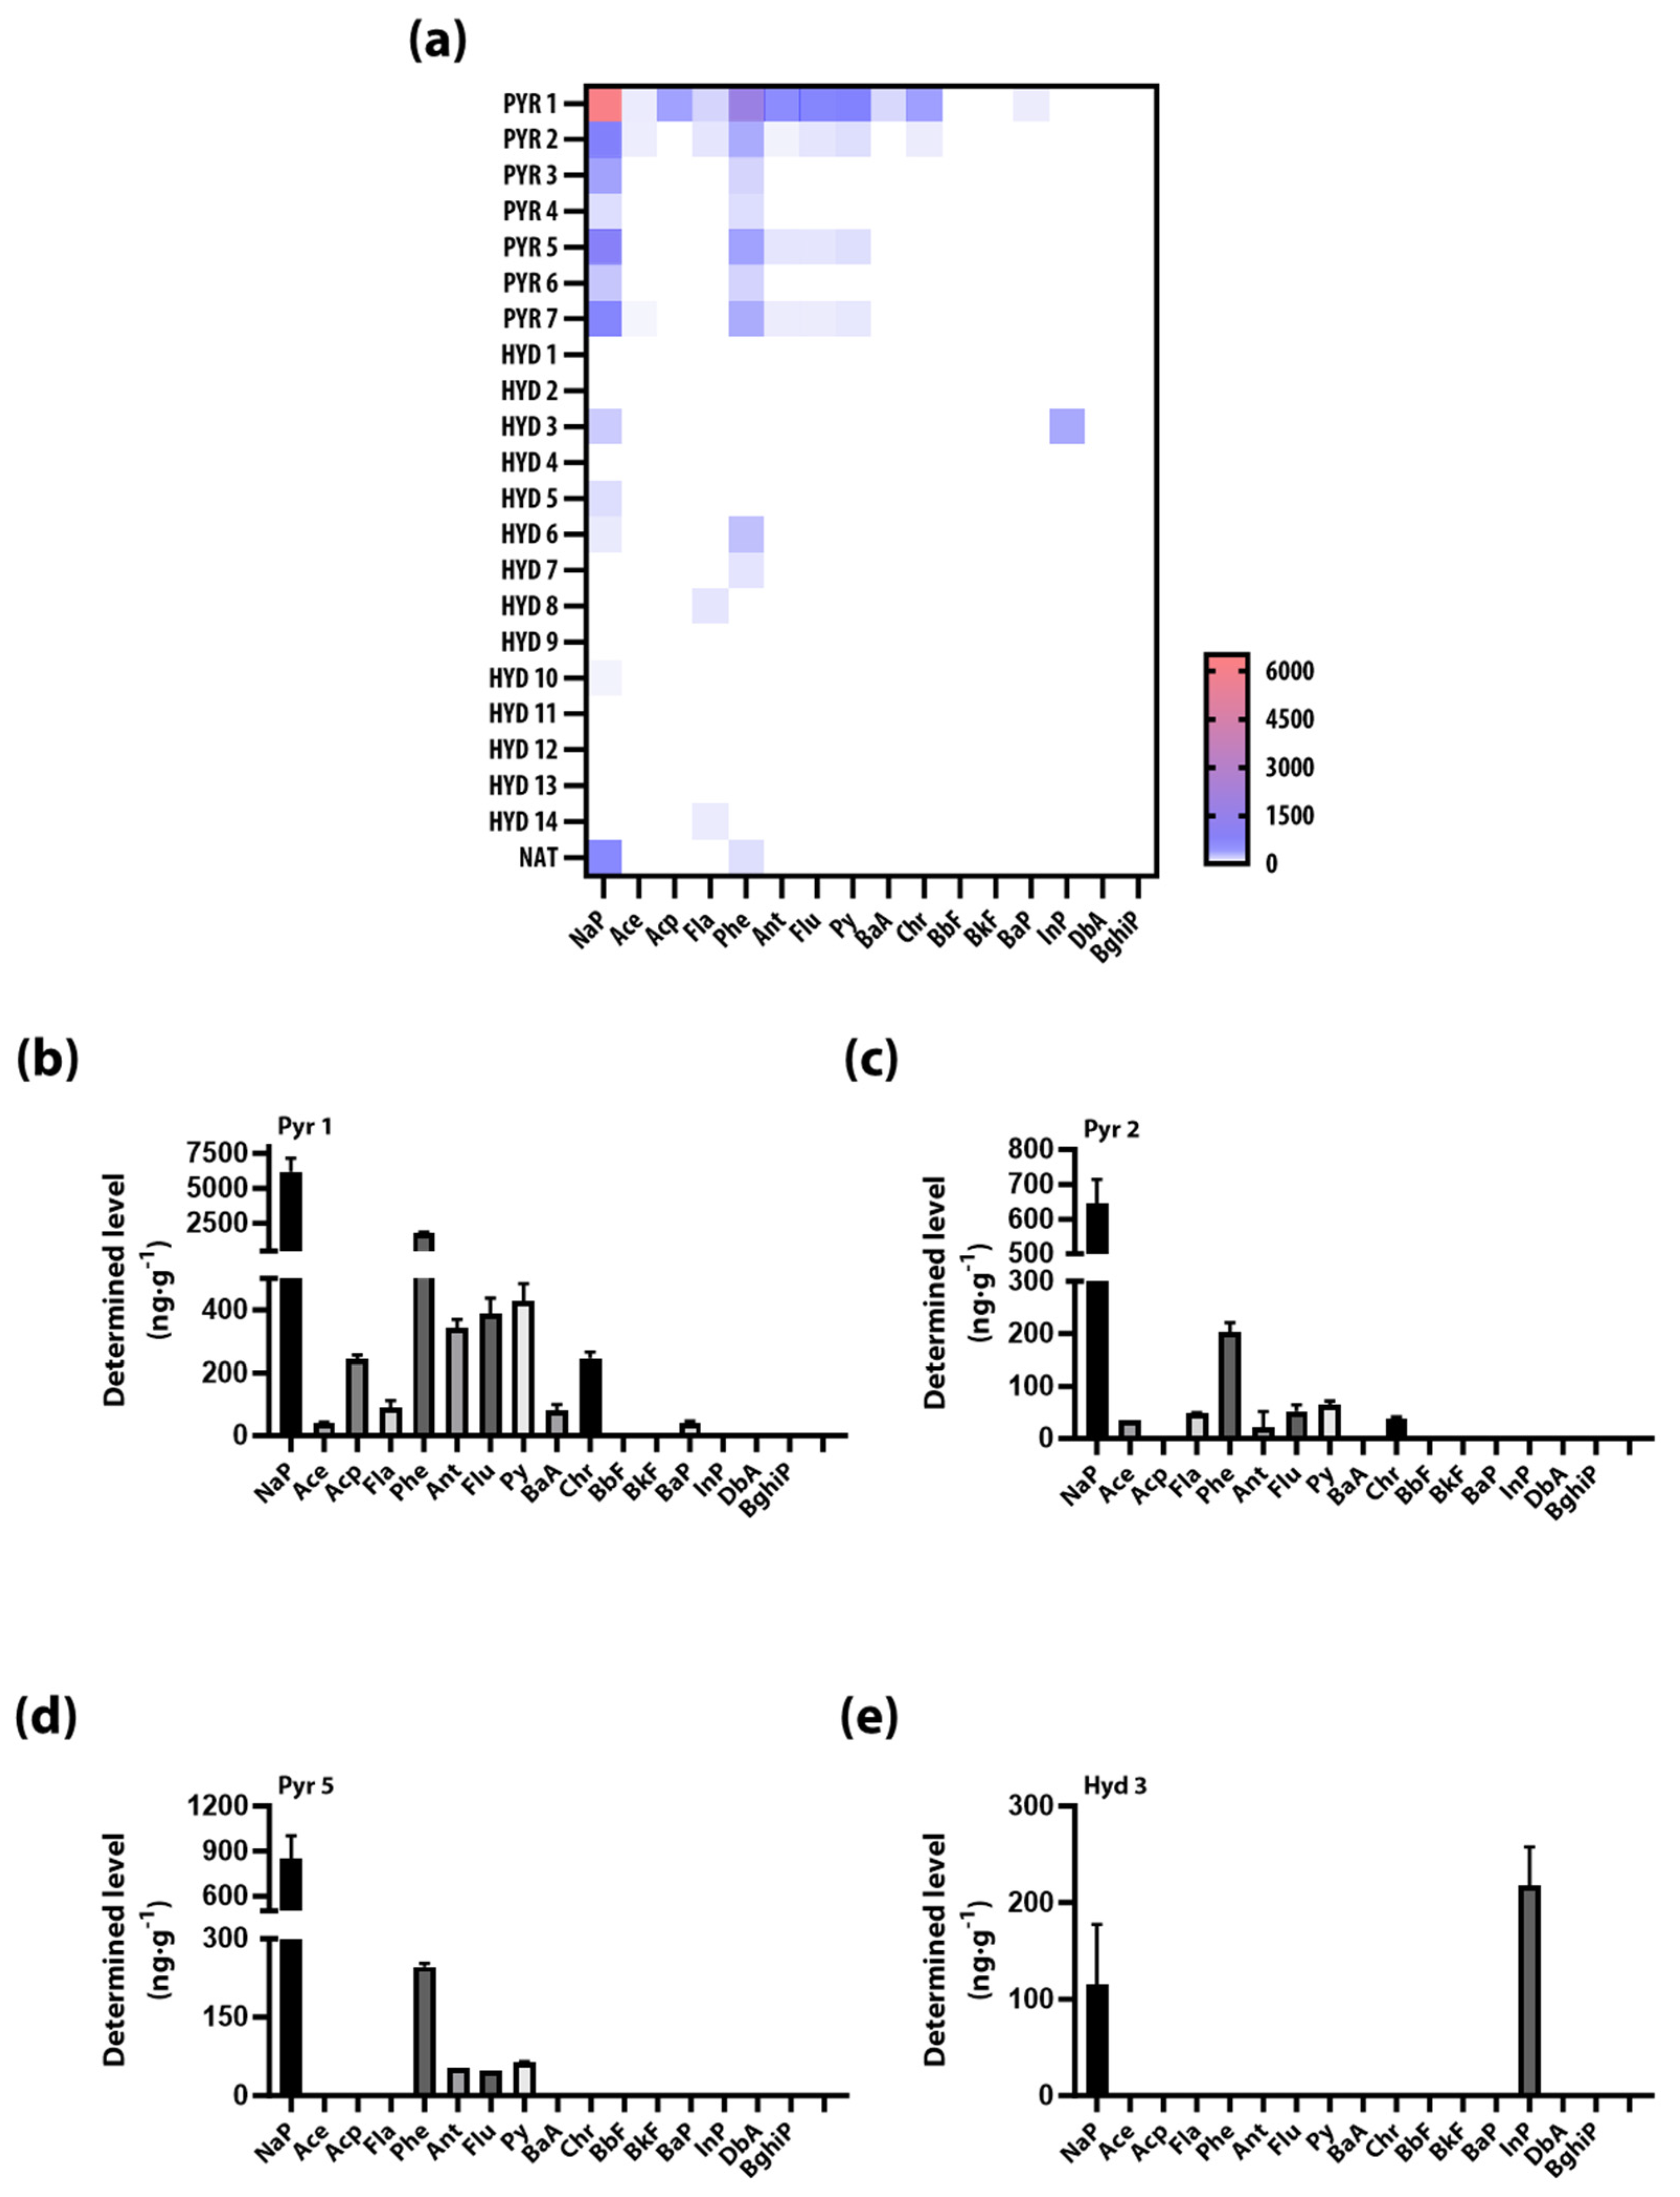
3.2. Determined Level of PAHs in Pyrochars and Hydrochars

The level of the EPA priority 16 PAHs determined in the 22 samples are visualized in a heatmap (Figure 1a) for pyrochars and hydrochars, and the specified values are given in Table 3. The worst-case was observed for PYR 1, with the highest level of the 16 EPA PAHs (Figure 2b), followed by PYR 5 and 2 (Figure 2c,d). Although the samples were prepared using different feedstocks, reactor types, and conditions, Nap was the most commonly observed congener among the 16 PAHs in PYR and HYD (Figure 2a, Table 3). This congener is found in thirteen out of twenty-two samples, and the determined levels ranged from 18.00 µg∙kg−1 to 6191.06 µg∙kg−1(Table 3).
In the seven pyrochar samples, naphthalene and phenanthrene were found in every sample, with levels of Nap from 64.80 to 6191.06 µg∙kg−1 and Phe from 65.94 to 1769.75 µg∙kg−1 (Table 3). Ant, Flu, and Py were also found in 4 PYR samples, and the level of these congeners was almost identical (21.48 to 342.92 µg∙kg−1 for Ant, 37.80 to 389.37 µg∙kg−1 for Flu, and 43.39 to 427.46 µg∙kg−1 for Py). At lower levels and/or frequency, Ace (15.43 to 40.16 µg∙kg−1, in three samples out of 7 (3/7)), Acp (243.27 µg∙kg−1, (1/7)), Fl (47.61 to 90.63 µg∙kg−1, (2/7)), BaA (79.38 µg∙kg−1, (1/7)), Chr (37.84 and 245.80 µg∙kg−1, (2/7)), and BaP (38.44 µg∙kg−1, (1/7)) were also found in the PYR samples (see Table 3).
In contrast, for the fourteen hydrochars samples, only four congeners (Nap, Fl, Phe, and InP) of the 16 EPA PAHs were detected and at much lower levels, i.e., Nap (41.86 to 115.22 µg∙kg−1, (3/14)), Fl (40.59 and 51.10 µg∙kg−1, (2/14)), Phe (55.39 and 144.29 µg∙kg−1, (2/14)), InP (217.53 µg∙kg−1, (1/14)) (Table 3). Three of the HYD samples were treated with KOH, and one was treated with Mg(OH)2 before the HTC process to induce the formation of humic acids during the HTC process, which is beneficial to apply to the soil for soil amendment. The highest level of the 16 PAHs was detected in the HYD 3 sample, which was treated with KOH. In the samples with similar feedstock and HTC conditions (HYD 2 and 4), no PAHs were detected, but the temperature during the process of HYD 3 and its final pH were higher than those of HYD 2 and 4 (Table 3).

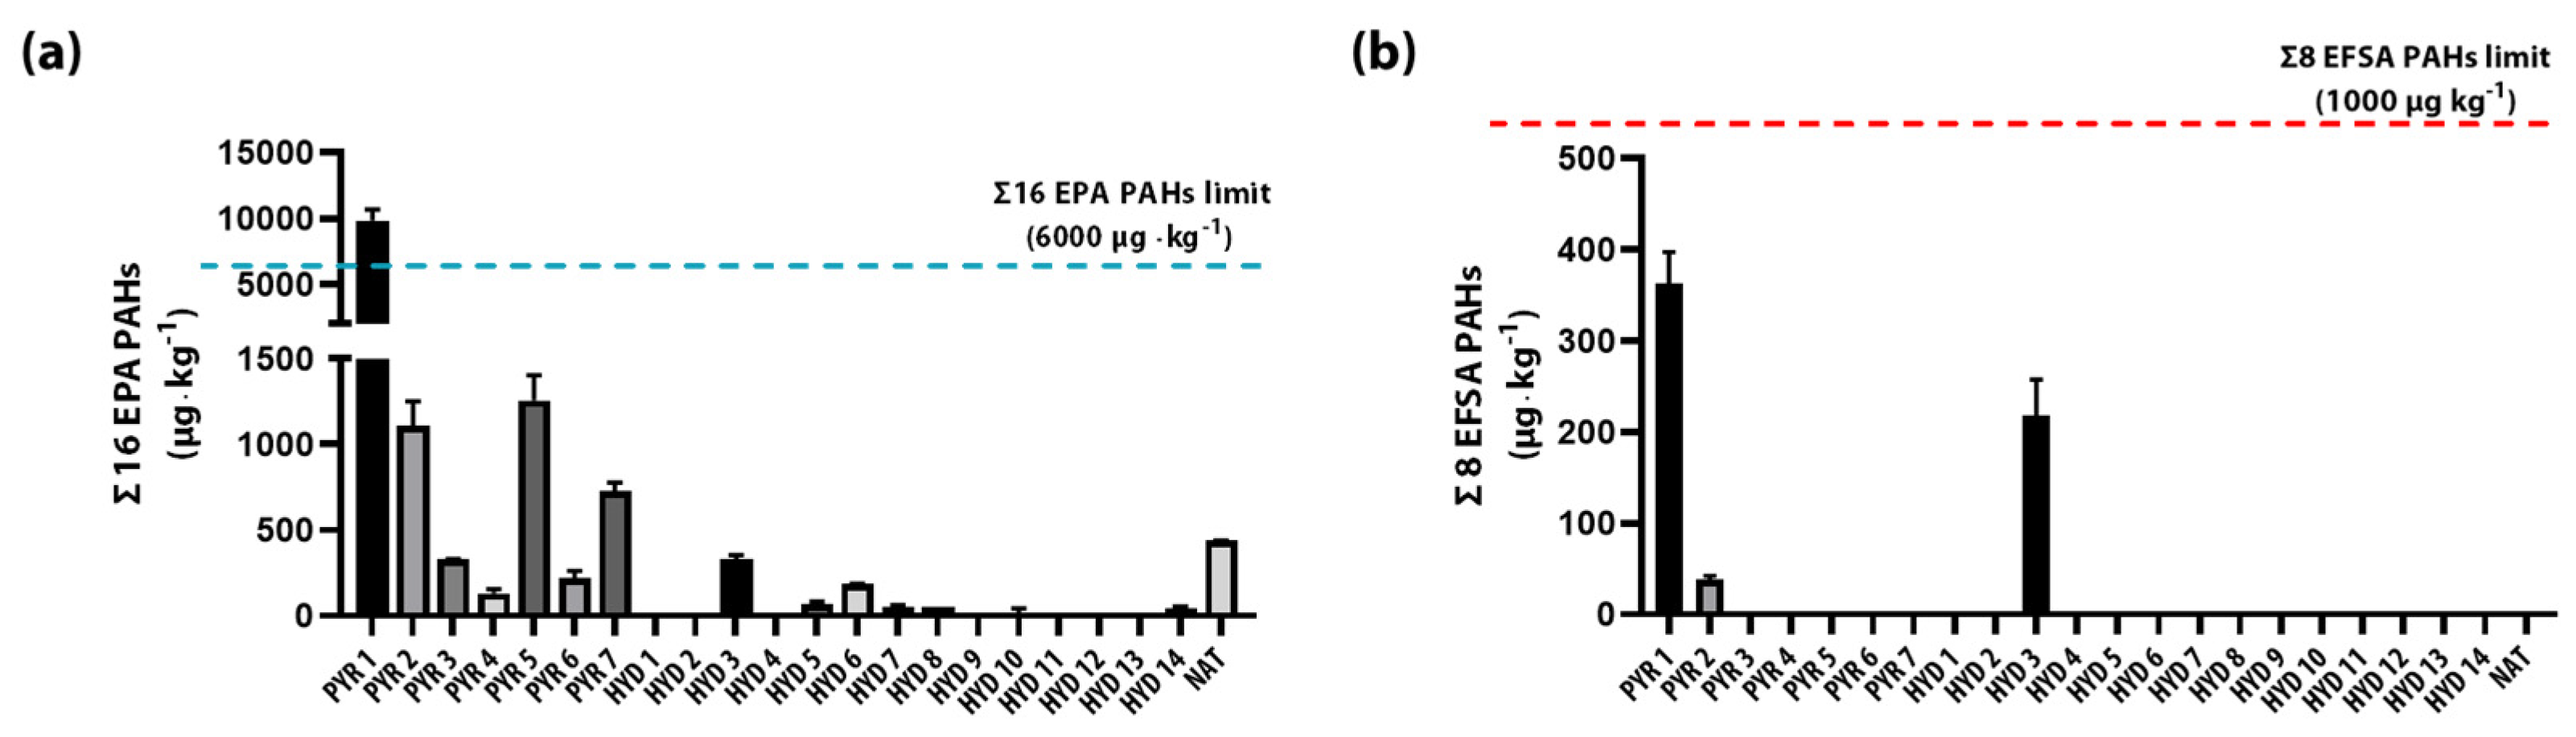
3.3. Evaluation of 16 EPA PAHs in Pyrochar and Hydrochar

The sums of the 16 EPA priority PAHs in PYRs and HYDs were calculated, along with the sums of the subgroup of eight high molecular weight PAHs chosen by the European Food Safety Authority (EFSA), as these are the categories with limit values in standards. Except for PYR 1, the sum of the 16 PAHs in all the other 21 samples was well below the limit values in the EBC Standard for Agro and AgroOrganic applications (6000 µg·kg−1) (Figure 3a). The values of the Σ16 EPA PAHs ranged between 130.74 and 9858.24 µg∙kg−1 for pyrochars, whereas for hydrochars between 0 and 332.75 µg∙kg−1, while the sample from the forest fire NAT contained 437.89 µg∙kg−1. The highest level of Σ16 EPA PAHs was observed for PYR 1 (9858.24 µg∙kg−1), followed by PYR 5 (1256.96 µg∙kg−1), and PYR 2 (1107.28 µg∙kg−1) (Figure 3a). As mentioned in Section 3.2, the majority of PAH levels came from Nap and Phe. In contrast, PAHs were not detected in eight of the fourteen hydrochars (HYD 1, 2, 4, 9, 10, 11, 12, and 13), and the highest level of Σ16 EPA PAHs in hydrochars was observed for HYD 3 (332.75 µg∙kg−1) and an order of magnitude lower than in the PYR (Figure 3a). Of the 22 analyzed samples, EFSA PAHs were found in only three samples (PYR 1, PYR 2, and HYD 3), and all were well below the EBC limit value of 1000 µg∙kg−1 (Figure 3b). The level of Σ8 EFSA PAHs ranged from 37.84 µg∙kg−1 in PYR 2 to 363.62 µg∙kg−1 in PYR 1, whereas the HYD 3 was the only sample of hydrochars, in which one of the 8 EFSA PAHs (InP) was detected with a value of 217.53 µg∙kg−1(Figure 3b).

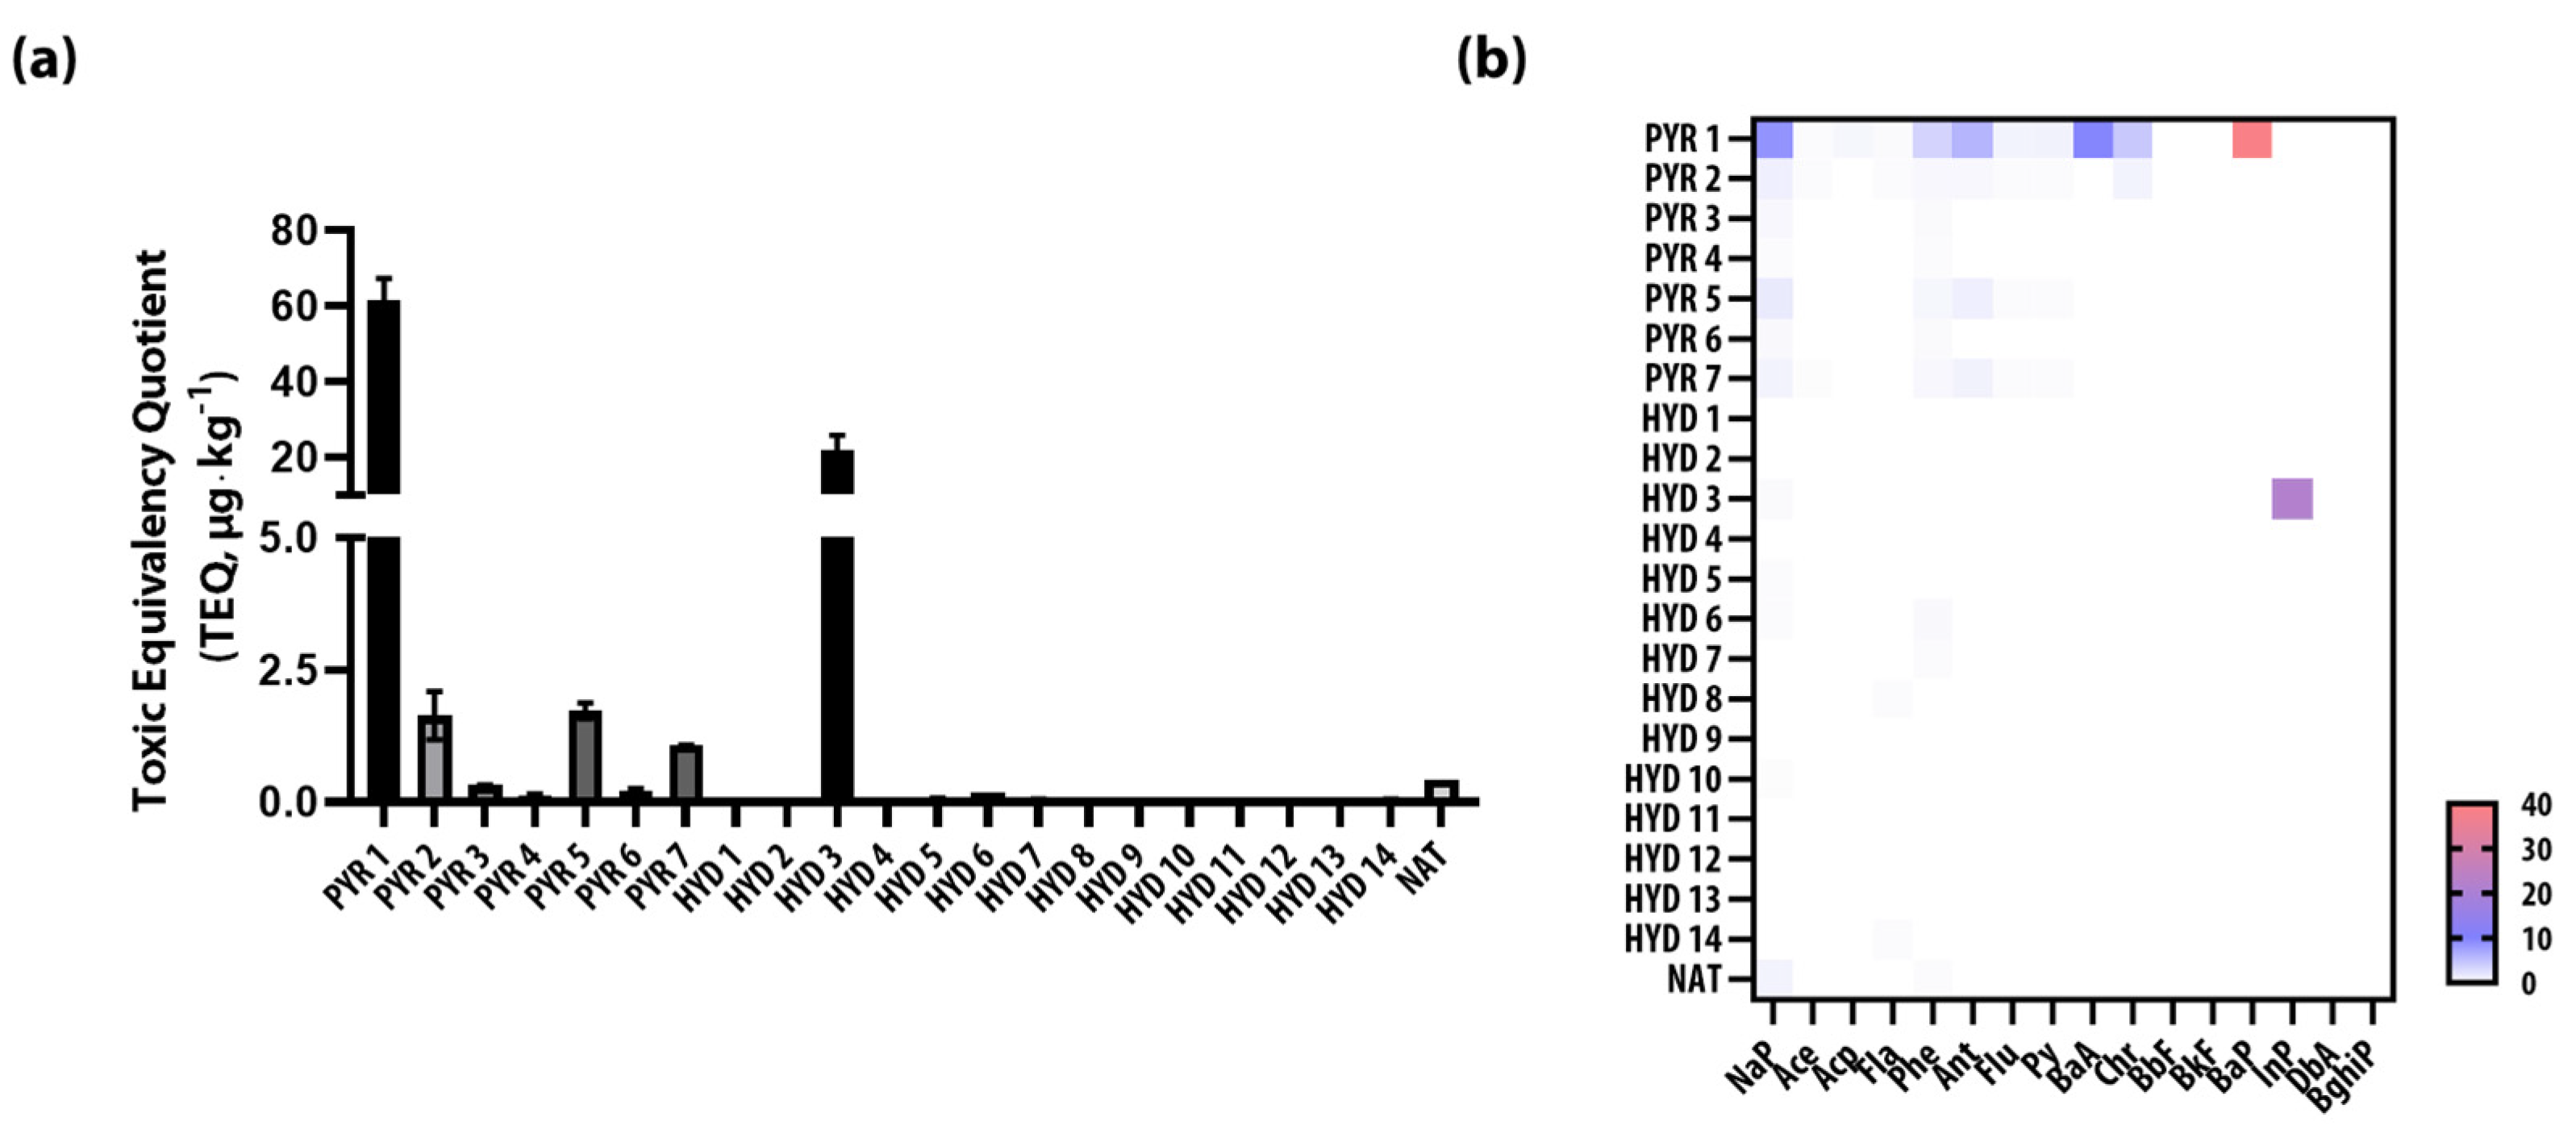
3.4. Toxic Equivalency of PAHs in Pyrochar and Hydrochar

Based on the determined levels of PAHs in the various chars, the toxic equivalents (TEQ) for the 16 EPA PAHs were calculated using the BaP toxic equivalency factors (TEF), as shown in Figure 4a for the 22 samples. Except for two of the 22 samples, all TEQ values were below 2. However, the values for the two exceptions are very high, with 61.42 for PYR 1 and 21.87 for HYD 3. A comparison between the hydrochar and pyrochar shows that the hydrochar TEQ values are remarkably lower than those for pyrochars, and this tendency is also very similar to that seen in the PAH concentrations. For pyrochars, the TEQ ranged between 0.13 to 61.24 (all samples presented non-negligible TEQ), while for hydrochars, the TEQ range was 0.00 to 21.87, with eight of the fourteen samples with TEQ equal to zero. The contribution of each congener to the TEQ is expressed as a heatmap in Figure 4b. The majority of the detected compounds have low molecular weights with low TEFs (0.001), so a pattern similar to that in the concentration heatmap (Figure 2a) is seen for most samples. However, in the case of PYR 1, over 75% of the high TEQ value (61.42) is due to the presence of two congeners (BaP, BaA). In contrast, for HYD 3, over 99% of the TEQ value (21.87) comes from one congener, InP (Figure 4b).

4. Discussion

The occurrence of PAHs in pyrochars and hydrochars derived from pyrolysis and hydrothermal carbonization processes has been a continuous concern when applying these carbon-rich materials as a soil amendment. Our analyses showed that PAHs were detected in only 14 of the 22 samples. As a general rule, the occurrence of PAHs in the hydrochars was lower than that in the pyrochars.

4.1. PAH Levels in Pyrochars

By comparing the worst-case PAHs in pyrochars samples analyzed in this work (9858.24 µg∙kg−1, PYR 1) with the literature, one may notice that this value is of the same magnitude as the ones reported in the literature. For instance, Wang et al. (2018) found that the total concentration of PAHs in commercially available pyrochars (1576 to 9343 µg∙kg−1) from China was significantly higher than the PAHs levels from pyrochars produced in the laboratory (639 to 1851 µg∙kg−1), under well-controlled conditions. A similar range was found in this study for lab-produced pyrochars (130.74–1256.96 µg∙kg−1). Other studies have also reported higher levels of PAH contamination in large-scale and commercially available biochars [8,28,31]. A similar behavior was observed for the pyrolysis of grass feedstock in this study, wherein the highest PAHs were observed for the two batch large-scale pyrolysis reactors (PYR 1, PYR 2). In contrast, the pyrochar produced in the continuous farm-scale reactor (PYR 3) and the batch lab-scale pyrochars (PYR 4, PYR 6, and PYR 7) contained much fewer PAHs, and none of the eight EFSA PAHs were identified for these samples (see Table 3). The process configuration and control play a significant role in the presence of PAHs [36]. Generally, controlling pyrolysis conditions in large-scale production can be more challenging than in small-scale production, such as laboratory-scale pyrolysis equipment that can achieve uniform reaction conditions [5]. Considering the mechanism of the generation of PAH during pyrolysis, controlling the pyrolysis conditions is regarded as more important. Several possible mechanisms have been suggested [5]. At temperatures below 500 °C, organic chemicals in the feedstock are converted to PAH via carbonization and aromatization [5]. During pyrolysis, cellulose and lignin can be converted to PAHs via unimolecular cyclization, dehydrogenation, dealkylation, and aromatization [39]. Based on these, pyrolysis temperature and the contents of cellulose and lignin are key factors that can influence the formation of PAHs during the pyrolysis process. In the case of PYR 5, the temperature of pyrolysis was below 500 °C (450 °C), and the determined level of PAHs was relatively higher than that in other samples. Based on the mechanism of generating PAH, low-temperature combustion may cause a higher level of PAH in PYR 5.
Regarding TEQ, the 73 biochars ranged from 0 to 25,000 µg∙kg−1 BaP-TEQ [24]. The values in this study were very low, ranging from 0 to 61.42 µg∙kg−1 BaP-TEQ, since the most frequently detected individual congener of the PAH was naphthalene (Nap) with one of the lowest TEF (Figure 2a). The dominance of Nap, the simplest compound of the PAHs, in pyrochars has already been reported [24,40]. The proportion range of Nap in our study was 22.48–100%, similar to the results (11–100%) previously reported [24]. Kloss et al. (2012) also found that the proportion of Nap exceeded 80% of total PAHs in pyrochar produced at 525 °C. The next most frequently detected PAH after Nap in this study was phenanthrene (Phe), which exhibited a similar pattern to that of previous reports [24,41]. In contrast, high molecular weight PAHs containing more than four rings were barely detected in one sample (PYR 1). The TEQ value indicates possible carcinogenicity by PAH in the chars. Canadian soil quality guidelines for the protection of environmental and human health suggested a safe level of TEQ of the sum of seven highly carcinogenic PAHs (BaA, Chr, BbF, BaP, DbA, and InP), 600 µg/kg in the soil [42]. Compared to this, our results are much lower than their suggestion. In the case of the highest level of determined PAHs in PYR, Sum of TEQ of 16 PAHs was 61.42 µg/kg. In addition, when PYR is amended in the soil, the portion of PYR usually does not exceed 10%, which can cause more dilution of PAHs in the amended soil [42,43].
PAH formation in pyrochars is highly feedstock-dependent, and the operational conditions, such as temperature [31,39,44], are high. For instance, in a comprehensive review including 59 biochars produced from 23 different feedstocks, Hale et al. (2012) observed total PAH levels from 70 µg∙kg−1 to 3270 µg∙kg−1 for slow pyrolysis biochars, which were dependent on the feedstock, pyrolysis temperature, and processing time. In general, by increasing the pyrolysis time and temperature, the PAH concentrations decreased.

4.2. PAH Levels in Hydrochars

In contrast to PYR, the levels and frequency of detected PAHs in the hydrochars were remarkably lower (see Figure 2a and Table 3). The 14 hydrochar samples were produced in two scales (1 L and 18.75 L) of batch reactors from five different feedstocks (grass pellets, sugar beet pellets + digestate, dry coffee husks, macroalgae, and halophyte) with solid contents from 15 to 35% wt (d.b.), stirring speeds from 100 to 200 rpm, temperatures ranging between 190 and 240 °C, and times from 1 to 6 h. The initial pH was near-neutral condition (from 5.9 to 7.0) for the HTC processes, while for hydrothermal humification (HTH), the initial pH was 13 due to the presence of KOH additive in the process (see Table 1). Across this wide range of parameters, the Σ16 EPA PAHs levels remained either nondetectable (8 HYD) or low (6 HYD), between 40.59 and 332.75 µg∙kg−1, much below the standard limits of 6000 µg∙kg−1. No PAHs were detected in the HYD from the grass pellets, the same feedstock used in pyrolysis, which produced pyrochars containing PAHs from 130.74 to 1256.96 µg∙kg−1, depending on the process used. These results are in accordance with the few studies in the literature wherein HTC products were associated with lower levels of PAHs than pyrochars [45,46] or comparable levels [35,45]. Dieguez et al. found a low PAH range similar to ours (0 to 300 µg∙kg−1) for HYDs from four feedstocks (spent brewer’s grains, beetroot chips, wood chips, and Miscanthus), while they found much higher PAH values for HYD from sewage sludge (4900 µg∙kg−1) and pyrochars from the same feedstocks (1300 to 53,000 µg∙kg−1). However, Garlapalli et al. (2016) reported Σ16 EPA PAHs values for hydrochars (2120 to 9370 µg∙kg−1) that were similar to or higher than those for pyrochars (1330 to 4700 µg∙kg−1) from the same digestate based on cow manure and corn silage. The values increased in both processes with increasing reaction temperature (180 °C to 260 °C; 400 °C to 800 °C).
The relationship between HTC conditions and PAH contents in the HYD is not yet clear, but some previous studies have attempted to find a correlation. Peng et al. found a relationship between temperature and PAH formation during the HTC process. They performed the HTC process with the same feedstock (municipal solid waste) and different temperatures (160–260 °C), and the occurrence of PAHs increased with increasing temperature. Our results (HYD 2–5) found a similar tendency with similar feedstock and different temperature conditions. PAHs contamination was determined only in HYD made at 240 °C (HYD3 and HYD 5), and was not detected in HYD made at 200 and 220 °C. Although the relationship between the initial pH and the occurrence of PAH in the HTC process has not yet been reported, Garlapalli et al. (2016) reported the PAH content and pH of the final product of the HTC process. They found that at higher temperatures, the final pH shifted slightly higher, and the level of PAH also increased. In our results, the final pH of HYD 3 was higher than that of HYD 2 and 4, which may be related to the formation of PAH during the HTC process. Overall, the occurrence of PAH according to the condition of HTC should be studied further to confirm the influencing factors.
In this work, the hydrochar sample HYD 3 with the highest Σ16 EPA PAH value (332.75 µg∙kg−1) was produced at 240 °C and 200 rpm for 4 h from the hydrothermal humification of cowshed digestate as a feedstock, with an excess of potassium hydroxide (KOH) added to achieve an initial pH of 13.0 (see Table 1 and Table 2). Nevertheless, the relationship between the initial pH and the occurrence of PAH is not yet clear.

4.3. Comparison between PAH Levels in Pyrochars vs. Hydrochars

Overall, by comparing the pyrochar and hydrochar samples, it was observed that the hydrochars presented significantly lower values of the 16 PAHs and the 8 EFSA PAHs. While the seven pyrochar samples presented ∑16 EPA PAHs contents between 130.74 and 9858.24 µg∙kg−1, in the 14 hydrochar samples, the ∑16 EPA PAHs values ranged from 0.0 to 332.75 µg∙kg−1. In general, the range of PAHs found in the hydrochar samples in this work was considerably lower, especially those derived from HTC processes. Two HTH hydrochars presented higher values than the 10 HTC hydrochars. Nevertheless, these values are similar to or much lower than those of other hydrochars from the literature and below the threshold values (see Figure 3).
The PAH levels in the pyrochars, which all came from the same grass feedstock, were highly connected to the reactor design; in particular, adequate control of the pyrolysis process reduced the PAHs to low levels. No PAHs were detected in the hydrochar from the grass feedstock. Interestingly, we found that the formation of PAHs from hydrochar derived from the HTC of coffee processing byproducts, macroalgae (Fucus vesiculosus), and halophyte (Saliconia) residues as feedstock was almost negligible.
Despite the relatively abundant literature, there are still many gaps in the understanding of PAH occurrence in pyrochars. In particular, there is still a lack of studies that consider the different compositions of PAHs in large sets of pyrochars to recommend safe pyrochar production [24]. The knowledge of the PAH formation in hydrochars is not sufficient. For instance, the general occurrence of PAHs related to processing temperature has not been consistently observed. However, some studies reported that the PAH content increased with higher temperatures [13,47,48], others reported a decreasing trend [32,49], and others reported that PAHs peaked at intermediate temperatures [34]. Notably, it is still impossible to come to solid conclusions due to the scarce data available in the literature on PAH occurrence in HTC processes. Finally, to the best of our knowledge, there is no report about PAHs occurrence in hydrothermal humification products since it is still an emerging technology, and further research is needed on the occurrence and formation of PAHs and other toxic contaminants during the process of hydrothermal carbonization.

5. Conclusions

We established an analytical method for evaluating contaminated PAHs level in pyrochar using ultrasonic extraction and GC-MS, which could relieve researchers from time-consuming preparation using the Soxhlet method. Our study suggests that chars come from appropriate feedstock under a well-controlled carbonization system, which could dispel concerns about the unintended contamination of PAHs. In addition, HYD prepared using the hydrothermal carbonization technique could be a good char alternative for multiple purposes, including agricultural and environmental usage. Our HYD, which contains humic materials from various sources, has very low PAH and TEQ levels compared to PYR. Putting these factors together, using HYD would be a good option for resource recycling, energy saving, and human health.

Supplementary Materials

The following supporting information can be downloaded at https://www.mdpi.com/article/10.3390/agronomy14092040/s1, Figure S1: Chromatogram of the standard mix; Figure S2. Calibration curves for each compound of 16 polycyclic aromatic hydrocarbons: Table S1: Ions Table for analyzing PAHs using Selective Ion Monitoring mode of gas chromatography-mass spectrometry: Table S2: Short descriptions of the pyrolysis and hydrothermal reactors used, method of operation, and reference for more detailed information.

Author Contributions

H.-J.J.: Investigation, Writing-Original draft, Sample preparation, Visualization, Software, Methodology, and Statistical analysis. D.K.: Instrumental analysis, Data curation. K.S.R.: Methodology, Conceptualization, Investigation, Writing-Review and Editing. J.A.L.: Investigation, Conceptualization, Sample, Methodology, Writing-Review and Editing. F.B.S.: Investigation, Writing-Review and Editing. N.M.: Investigation, Sample, Writing—Review and Editing. H.C.: Investigation, Writing-Review and Editing. C.R.: Investigation, Writing—Review, and Editing. C.J.: Supervision, Conceptualization, Investigation, Methodology, Writing—Review, and Editing. All authors have read and agreed to the published version of the manuscript.

Funding

The authors would like to thank the USDA-NRCS (Award #: NR213A750013G014) and USDA-AFRI (Award # 2023-67019-39722) for funding this publication, and acknowledge the support by USDA Hatch funds (LAB#94446). The mention of trade names or commercial products in this publication is solely intended to provide specific information and does not imply a recommendation or endorsement by the USDA. The USDA is an equal opportunity provider and employer. Financial support for F.B.S. came from the Alexander von Humboldt Foundation (Germany) and Coordination for the Improvement of Higher Education Personnel–CAPES (Brazil)—CAPES-Humboldt Research Fellowship–Call 18, Project Ref 3.2-BRA-1229718-HFSTCAPES-E, published on 2 December 2022, by the Ministry of Education, CAPES, Brazil. This study was financed in part by the Coordenação de Aperfeiçoamento de Pessoal de Nível Superior-Brasil (CAPES)-Finance Code 001. H.C. acknowledges the USDA-NIFA (Award # 2022-67019-37177) for financial support. Title: Growing microalgae in livestock wastewater—Benefits in nutrient recycling, antibiotic removal, and potential biofuel production.

Data Availability Statement

The original contributions presented in the study are included in the article, and further inquiries can be directed to the corresponding author.

Conflicts of Interest

The authors declare no conflicts of interest.

Abbreviations

AceAcenaphthylene
AcpAcenaphthene
AntAnthracene
BaABenzo(a)anthracene
BaPBenzo(a)pyrene
BbFBenzo(b)fluoranthene
BghiPBenzo(g,h,i)perylene
BkFBenzo(k)fluoranthene
ChrChrysene
DbADibenzo(a,h)anthracene
EBCEuropean Biochar Certificate
EFSAEuropean Food Safety Authority
FluFluoranthene
FlFluorene
GHGGreenhouse gas
HTCHydrothermal carbonization
HTHHydrothermal humification
HYDHydrochar
IBIInternational Biochar Initiative
InPIndeno(1,2,3-cd)pyrene
NaPNaphthalene
PAHPolycyclic aromatic hydrocarbons
PhePhenanthrene
PyPyrene
PYRPyrochar
TEFToxic equivalency factor
TEQToxic equivalent (or toxic equivalency quotient)

References

  1. Alkharabsheh, H.M.; Seleiman, M.F.; Battaglia, M.L.; Shami, A.; Jalal, R.S.; Alhammad, B.A.; Almutairi, K.F.; Al-Saif, A.M. Biochar and Its Broad Impacts in Soil Quality and Fertility, Nutrient Leaching and Crop Productivity: A Review. Agronomy 2021, 11, 993. Available online: https://www.mdpi.com/2073-4395/11/5/993 (accessed on 2 September 2024). [CrossRef]
  2. Patel, A.B.; Shaikh, S.; Jain, K.R.; Desai, C.; Madamwar, D. Polycyclic Aromatic Hydrocarbons: Sources, Toxicity, and Remediation Approaches. Front. Microbiol. 2020, 11, 562813. [Google Scholar] [CrossRef] [PubMed]
  3. Kanaly, R.A.; Harayama, S. Advances in the field of high-molecular-weight polycyclic aromatic hydrocarbon biodegradation by bacteria. Microb. Biotechnol. 2010, 3, 136–164. [Google Scholar] [CrossRef]
  4. Hussar, E.; Richards, S.; Lin, Z.Q.; Dixon, R.P.; Johnson, K.A. Human Health Risk Assessment of 16 Priority Polycyclic Aromatic Hydrocarbons in Soils of Chattanooga, Tennessee, USA. Water Air Soil Pollut. 2012, 223, 5535–5548. [Google Scholar] [CrossRef]
  5. Odinga, E.S.; Waigi, M.G.; Gudda, F.O.; Wang, J.; Yang, B.; Hu, X.; Li, S.; Gao, Y. Occurrence, formation, environmental fate and risks of environmentally persistent free radicals in biochars. Environ. Int. 2020, 134, 105172. [Google Scholar] [CrossRef]
  6. Ronsse, F.; van Hecke, S.; Dickinson, D.; Prins, W. Production and characterization of slow pyrolysis biochar: Influence of feedstock type and pyrolysis conditions. GCB Bioenergy 2013, 5, 104–115. [Google Scholar] [CrossRef]
  7. United States Environmental Protection Agency (US EPA). Provisional Guidance for Quantitative Risk Assessment of Poly Aromatic Hydrocarbons (EPA 600/R-93/089). 1993. Available online: https://cfpub.epa.gov/ncea/risk/recordisplay.cfm?deid=49732 (accessed on 2 September 2024).
  8. Wang, J.; Xia, K.; Waigi, M.G.; Gao, Y.; Odinga, E.S.; Ling, W.; Liu, J. Application of biochar to soils may result in plant contamination and human cancer risk due to exposure of polycyclic aromatic hydrocarbons. Environ. Int. 2018, 121, 169–177. [Google Scholar] [CrossRef]
  9. Brandt, M.; Einhenkel-Arle, D. Polycyclic Aromatic Hydrocarbons Harmful to the Environment! Toxic! Inevitable? German Environmental Agency. 2016. Available online: https://www.umweltbundesamt.de/sites/default/files/medien/376/publikationen/polycyclic_aromatic_hydrocarbons_web.pdf (accessed on 2 September 2024).
  10. Zelinkova, Z.; Wenzl, T. The Occurrence of 16 EPA PAHs in Food—A Review. Polycycl. Aromat. Compd. 2015, 35, 248–284. [Google Scholar] [CrossRef]
  11. Certificate, E.B. Guidelines of the European Biochar Certificate—Version 10.3. 2023. Available online: https://www.european-biochar.org/media/doc/2/version_en_10_3.pdf (accessed on 2 September 2024).
  12. Initiative, I.B. Standardizaed Product Definition and Product Testing Guidelines for Biochar That Is Used in Soil. 2013. Available online: https://www.biochar-international.org/wp-content/uploads/2018/04/IBI_Biochar_Standards_V1.1.pdf (accessed on 2 September 2024).
  13. Liu, Z.; Wang, Z.; Chen, H.; Cai, T.; Liu, Z. Hydrochar and pyrochar for sorption of pollutants in wastewater and exhaust gas: A critical review. Environ. Pollut. 2021, 268 Pt B, 115910. [Google Scholar] [CrossRef]
  14. Djandja, O.S.; Liew, R.K.; Liu, C.; Liang, J.; Yuan, H.; He, W.; Feng, Y.; Lougou, B.G.; Duan, P.G.; Lu, X.; et al. Catalytic hydrothermal carbonization of wet organic solid waste: A review. Sci. Total Environ. 2023, 873, 162119. [Google Scholar] [CrossRef]
  15. Li, B.; Guo, J.Z.; Liu, J.L.; Fang, L.; Lv, J.Q.; Lv, K. Removal of aqueous-phase lead ions by dithiocarbamate-modified hydrochar. Sci. Total Environ. 2020, 714, 136897. [Google Scholar] [CrossRef] [PubMed]
  16. Kobayashi, T.; Kuramochi, H. Catalytic pyrolysis of biomass using fly ash leachate to increase carbon monoxide production and improve biochar properties to accelerate anaerobic digestion. Bioresour. Technol. 2023, 387, 129583. [Google Scholar] [CrossRef] [PubMed]
  17. He, M.; Zhu, X.; Dutta, S.; Khanal, S.K.; Lee, K.T.; Masek, O.; Tsang, D.C.W. Catalytic co-hydrothermal carbonization of food waste digestate and yard waste for energy application and nutrient recovery. Bioresour. Technol. 2022, 344 Pt B, 126395. [Google Scholar] [CrossRef]
  18. Cavali, M.; Libardi Junior, N.; de Sena, J.D.; Woiciechowski, A.L.; Soccol, C.R.; Belli Filho, P.; Bayard, R.; Benbelkacem, H.; de Castilhos, A.B., Jr. A review on hydrothermal carbonization of potential biomass wastes, characterization and environmental applications of hydrochar, and biorefinery perspectives of the process. Sci. Total Environ. 2023, 857 Pt 3, 159627. [Google Scholar] [CrossRef]
  19. Yang, F.; Zhang, S.; Cheng, K.; Antonietti, M. A hydrothermal process to turn waste biomass into artificial fulvic and humic acids for soil remediation. Sci. Total Environ. 2019, 686, 1140–1151. [Google Scholar] [CrossRef]
  20. Marzban, N.; Libra, J.A.; Rotter, V.S.; Herrmann, C.; Ro, K.S.; Filonenko, S.; Hoffmann, T.; Antonietti, M. Maximizing the value of liquid products and minimizing carbon loss in hydrothermal processing of biomass: An evolution from carbonization to humification. Biochar 2024, 6, 44. [Google Scholar] [CrossRef]
  21. Pavlovic, I.; Knez, Z.; Skerget, M. Hydrothermal reactions of agricultural and food processing wastes in sub- and supercritical water: A review of fundamentals, mechanisms, and state of research. J. Agric. Food Chem. 2013, 61, 8003–8025. [Google Scholar] [CrossRef] [PubMed]
  22. Gollakota, A.; Savage, P.E. Fast and Isothermal Hydrothermal Liquefaction of Polysaccharide Feedstocks. ACS Sustain. Chem. Eng. 2020, 8, 3762–3772. [Google Scholar] [CrossRef]
  23. Anna, Z.; Patryk, O. The conversion of sewage sludge into biochar reduces polycyclic aromatic hydrocarbon content and ecotoxicity but increases trace metal content. Biomass Bioenergy 2015, 75, 235–244. [Google Scholar] [CrossRef]
  24. Buss, W.; Hilber, I.; Graham, M.C.; Mašek, O. Composition of PAHs in Biochar and Implications for Biochar Production. ACS Sustain. Chem. Eng. 2022, 10, 6755–6765. [Google Scholar] [CrossRef]
  25. Keiluweit, M.; Kleber, M.; Sparrow, M.A.; Simoneit, B.R.; Prahl, F.G. Solvent-extractable polycyclic aromatic hydrocarbons in biochar: Influence of pyrolysis temperature and feedstock. Environ. Sci. Technol. 2012, 46, 9333–9341. [Google Scholar] [CrossRef]
  26. McGrath, T.E.; Wooten, J.B.; Geoffrey Chan, W.; Hajaligol, M.R. Formation of polycyclic aromatic hydrocarbons from tobacco: The link between low temperature residual solid (char) and PAH formation. Food Chem. Toxicol. 2007, 45, 1039–1050. [Google Scholar] [CrossRef]
  27. Dai, Q.; Jiang, X.; Jiang, Y.; Jin, Y.; Wang, F.; Chi, Y.; Yan, J.; Xu, A. Temperature Influence and Distribution in Three Phases of PAHs in Wet Sewage Sludge Pyrolysis Using Conventional and Microwave Heating. Energy Fuels 2014, 28, 3317–3325. [Google Scholar] [CrossRef]
  28. Hale, S.E.; Lehmann, J.; Rutherford, D.; Zimmerman, A.R.; Bachmann, R.T.; Shitumbanuma, V.; O’Toole, A.; Sundqvist, K.L.; Arp, H.P.; Cornelissen, G. Quantifying the total and bioavailable polycyclic aromatic hydrocarbons and dioxins in biochars. Environ. Sci. Technol. 2012, 46, 2830–2838. [Google Scholar] [CrossRef] [PubMed]
  29. Quilliam, R.S.; Rangecroft, S.; Emmett, B.A.; Deluca, T.H.; Jones, D.L. Is biochar a source or sink for polycyclic aromatic hydrocarbon (PAH) compounds in agricultural soils? GCB Bioenergy 2013, 5, 96–103. [Google Scholar] [CrossRef]
  30. Buss, W.; Graham, M.C.; MacKinnon, G.; Mašek, O. Strategies for producing biochars with minimum PAH contamination. J. Anal. Appl. Pyrolysis 2016, 119, 24–30. [Google Scholar] [CrossRef]
  31. Hilber, I.; Blum, F.; Leifeld, J.; Schmidt, H.-P.; Bucheli, T.D. Quantitative Determination of PAHs in Biochar: A Prerequisite To Ensure Its Quality and Safe Application. J. Agric. Food Chem. 2012, 60, 3042–3050. [Google Scholar] [CrossRef]
  32. Lang, Q.; Zhang, B.; Li, Y.; Liu, Z.; Jiao, W. Formation and toxicity of polycyclic aromatic hydrocarbons during CaO assisted hydrothermal carbonization of swine manure. Waste Manag. 2019, 100, 84–90. [Google Scholar] [CrossRef]
  33. Erdogan, E.; Atila, B.; Mumme, J.; Reza, M.T.; Toptas, A.; Elibol, M.; Yanik, J. Characterization of products from hydrothermal carbonization of orange pomace including anaerobic digestibility of process liquor. Bioresour. Technol. 2015, 196, 35–42. [Google Scholar] [CrossRef]
  34. Peng, N.; Li, Y.; Liu, T.; Lang, Q.; Gai, C.; Liu, Z. Polycyclic Aromatic Hydrocarbons and Toxic Heavy Metals in Municipal Solid Waste and Corresponding Hydrochars. Energy Fuels 2017, 31, 1665–1671. [Google Scholar] [CrossRef]
  35. Mohammad, I.A.-W.; Muhammad Imran, R.; Mahtab, A.; Munir, A.; Abid, H.; Adel, R.A.U. Pyrolytic and hydrothermal carbonization of date palm leaflets: Characteristics and ecotoxicological effects on seed germination of lettuce. Saudi J. Biol. Sci. 2019, 26, 665–672. [Google Scholar] [CrossRef]
  36. Heinrich, T.; Kaetzl, K.; Libra, J.A.; Hoffmann, T. Influence of Thermochemical Conversion Technologies on Biochar Characteristics from Extensive Grassland for Safe Soil Application. Energies 2023, 16, 1896. Available online: https://www.mdpi.com/1996-1073/16/4/1896 (accessed on 2 September 2024). [CrossRef]
  37. Fernandes, M.B.; Brooks, P. Characterization of carbonaceous combustion residues: II. Nonpolar organic compounds. Chemosphere 2003, 53, 447–458. [Google Scholar] [CrossRef]
  38. Kim, L.; Jeon, H.-J.; Kim, Y.-C.; Yang, S.-H.; Choi, H.; Kim, T.-O.; Lee, S.-E. Monitoring polycyclic aromatic hydrocarbon concentrations and distributions in rice paddy soils from Gyeonggi-do, Ulsan, and Pohang. Appl. Biol. Chem. 2019, 62, 18. [Google Scholar] [CrossRef]
  39. Wang, D.; Ma, J.; Li, H.; Zhang, X. Concentration and Potential Ecological Risk of PAHs in Different Layers of Soil in the Petroleum-Contaminated Areas of the Loess Plateau, China. Int. J. Environ. Res. Public Health 2018, 15, 1785. Available online: https://www.mdpi.com/1660-4601/15/8/1785 (accessed on 2 September 2024). [CrossRef] [PubMed]
  40. Fagernäs, L.; Kuoppala, E.; Simell, P. Poly cyclic Aromatic Hydrocarbons in Birch Wood Slow Pyrolysis Products. Energy Fuels 2012, 26, 6960–6970. [Google Scholar] [CrossRef]
  41. Kloss, S.; Zehetner, F.; Dellantonio, A.; Hamid, R.; Ottner, F.; Liedtke, V.; Schwanninger, M.; Gerzabek, M.H.; Soja, G. Characterization of Slow Pyrolysis Biochars: Effects of Feedstocks and Pyrolysis Temperature on Biochar Properties. J. Environ. Qual. 2012, 41, 990–1000. [Google Scholar] [CrossRef]
  42. Canadian Council of Ministers of the Environment. Polycyclic Aromatic Hydrocarbons. Canadian Soil Quality Guide-Lines for Protection of Environmental and Human Health. In Canadian Soil Quality Guidelines; Canadian Council of Ministers of the Environment: Winnipeg, MB, Canada; Available online: http://ceqg-rcqe.ccme.ca/en/index.html (accessed on 18 August 2024).
  43. Kuśmierz, M.; Oleszczuk, P. Biochar production increases the polycyclic aromatic hydrocarbon content in surrounding soils and potential cancer risk. Environ. Sci. Pollut. Res. 2014, 21, 3646–3652. [Google Scholar] [CrossRef]
  44. Dieguez-Alonso, A.; Funke, A.; Anca-Couce, A.; Rombolà, A.G.; Ojeda, G.; Bachmann, J.; Behrendt, F. Towards Biochar and Hydrochar Engineering—Influence of Process Conditions on Surface Physical and Chemical Properties, Thermal Stability, Nutrient Availability, Toxicity and Wettability. Energies 2018, 11, 496. Available online: https://www.mdpi.com/1996-1073/11/3/496 (accessed on 2 September 2024). [CrossRef]
  45. Schimmelpfennig, S.; Glaser, B. One Step Forward toward Characterization: Some Important Material Properties to Distinguish Biochars. J. Environ. Qual. 2012, 41, 1001–1013. [Google Scholar] [CrossRef]
  46. Bargmann, I.; Rillig, M.C.; Buss, W.; Kruse, A.; Kuecke, M. Hydrochar and Biochar Effects on Germination of Spring Barley. J. Agron. Crop Sci. 2013, 199, 360–373. [Google Scholar] [CrossRef]
  47. Garlapalli, R.K.; Wirth, B.; Reza, M.T. Pyrolysis of hydrochar from digestate: Effect of hydrothermal carbonization and pyrolysis temperatures on pyrochar formation. Bioresour. Technol. 2016, 220, 168–174. [Google Scholar] [CrossRef] [PubMed]
  48. Wiedner, K.; Naisse, C.; Rumpel, C.; Pozzi, A.; Wieczorek, P.; Glaser, B. Chemical modification of biomass residues during hydrothermal carbonization—What makes the difference, temperature or feedstock? Org. Geochem. 2013, 54, 91–100. [Google Scholar] [CrossRef]
  49. Li, Y.; Zhai, Y.; Zhu, Y.; Peng, C.; Wang, T.; Zeng, G.; Wu, D.; Zhao, X. Distribution and Conversion of Polycyclic Aromatic Hydrocarbons during the Hydrothermal Treatment of Sewage Sludge. Energy Fuels 2017, 31, 9542–9549. [Google Scholar] [CrossRef]
Figure 1. Recovery rates of 16 US EPA polycyclic aromatic hydrocarbons by two different extraction methods, (a) ultrasonic extraction method and (b) Soxhlet extraction method (16 h).
Agronomy 14 02040 g001
Figure 2. Determined levels of 16 US EPA PAHs in each of the twenty-two samples. Heatmap of the level of each of the 16 PAHs in the 22 samples (a), and graphs of four specific samples (be), with higher PAH levels: 3 PYR samples (bd), and one HYD sample containing (e).
Agronomy 14 02040 g002
Figure 3. Sum of the 16 US EPA-regulated PAHs (EBC, IBI) in the 22 samples compared to the limit values of EBC and IBI standards (6000 µg∙kg−1 for IBC and IBI standards, blue) (a), and the sum of eight EFSA PAHs compared to the limit values of the EPC standard (1000 µg∙kg−1, red) (b).
Agronomy 14 02040 g003
Figure 4. Health risk assessment of the 16 PAHs found in the 22 samples based on their carcinogenic effect using BaP toxic equivalency factors. The sum of toxic equivalent values (TEQ) of 16 US EPA PAHs (a) and the contribution of each congener to the total TEQ is illustrated as a heatmap (b).
Agronomy 14 02040 g004
Table 1. Information on char samples (feedstock material, reactor type, process conditions, pH in the inputs and outputs, and solid yield of char produced).
SampleSample TypeInputs: Feedstock/Water/AdditiveReactorTemperature
(°C)
Duration (h)%Solids
(%wt, db)
Stirring
(rpm)
Initial pH *
(-)
Final pH
(-)
SY
(%wt, db)
PYR 1PyrocharGrass briquettesfarm-scale SPSC ovenn.m.4n.a.n.a.5.69.636.3
PYR 2PyrocharGrass bale (loose)Farm-scale carbon Twister oven6002n.a.n.a.6.39.912.9
PYR 3PyrocharGrass pelletsfarm-scale Biomacon oven800n.m.n.a.n.a.5.910.820.5
PYR 4PyrocharGrass pelletslab-scale top-lit up-draftn.m.n.m.n.a.n.a.5.99.323.8
PYR 5PyrocharGrass pelletslab-scale muffle oven4501.3n.a.n.a.5.910.632.5
PYR 6PyrocharGrass pelletslab-scale muffle oven5500.9n.a.n.a.5.910.427.4
PYR 7PyrocharGrass pelletslab-scale muffle oven6500.67n.a.n.a.5.910.526.6
HYD 1HydrocharGrass pellets18.75 L Parr reactor2205151255.94.261
HYD 2HTH-solidsSugar beet pellets/unseparated cattle manure digestate from biogas plant/DI water/KOH18.75 L Parr reactor200640200138.375.6
HYD 3HTH-solidsUnseparated cattle manure digestate from biogas plant/KOH18.75 L Parr reactor240412.52001310.623.9
HYD 4HTH-solidsGrass pellets/unseparated cattle manure biogas digestate/KOH18.75 L Parr reactor220629.5200138.153.6
HYD 5HydrocharSeparated cattle manure digestate from biogas plant/DI water18.75 L Parr reactor2401132009.05.362.6
HYD 6HydrocharFresh skin from coffee berries/DI water/Mg(OH)21 L Parr reactor16051510013 (9.5)7.598.8
HYD 7HydrocharFresh skin from coffee berries/DI water1 L Parr reactor1605202007 (9.5)6.994.3
HYD 8HydrocharFresh skin from coffee berries/DI water1 L Parr reactor24052507 (9.5)7.561.6
HYD 9HydrocharDry husk from dried coffee berries/DI water1 L Parr reactor2405152007 (6.5)4.750.5
HYD 10HydrocharDry husk from dried coffee berries/DI water1 L Parr reactor2401251007 (6.5)4.561.7
HYD 11HydrocharBrown macroalgae, Fucus vesiculosus/DI water1 L Parr reactor190335200n.m.5.168
HYD 12HydrocharBrown macroalgae, Fucus vesiculosus/recirculated process water1 L Parr reactor190335200n.m.4.973.4
HYD 13HydrocharHalophyte, Salicornia/DI water1 L Parr reactor190335200n.m.4.251.9
HYD 14HydrocharHalophyte, Salicornia/recirculated process water1 L Parr reactor190335200n.m.4.297.2
NATSoil/char from burned forest5 cm topsoil/forest fire (pine trees)n.a.Natural forest firen.a.n.a.n.a.n.m.n.m.n.a.
n.m.; not masured; n.a.; not applicable; * Initial pH (in mixture or feedstock); Final pH (in Slurry or char).
Table 2. Description of feedstock: moisture content before carbonization and feedstock source.
Feedstock TypeMC (%wt)Source
Grass briquettes14.4Extensive grassland (harvest 2021), Lower Oder Valley National Park, Germany
Grass bale (loose)9
Grass pellets6.7
Sugar beet pellets 9.4Purchased animal feed in Germany
Unseparated digestate from biogas plant 92.6Biogas plant (input from cowshed), Brandenburg, Germany
Separated digested from biogas plant 72.3Biogas plant (input from cowshed), Brandenburg, Germany
Fresh skin from wet processing of coffee berries72.3–74.9Byproducts from coffee semi-wash process (wet processing), Vietnam
Dry husk from processing of dried coffee berries 7.3–13.4Byproducts from coffee dry processing, Vietnam
Brown macroalgae, Fucus vesiculosus 15.6Coast of North Sea, Germany
Halophyte, Salicornia14.5Greenhouse trials, Germany
5 cm topsoil/forest fire (pine trees)n.m.Topsoil sample from floor of pine forest after forest fire, Brandenburg, Germany
Table 3. Determined levels of polycyclic aromatic hydrocarbons in the samples (unit: µg∙kg−1).
PYR 1PYR 2PYR 3PYR 4PYR 5PYR 6PYR 7HYD 1HYD 2HYD 3HYD 4HYD 5HYD 6HYD 7HYD 8HYD 9HYD 10HYD 11HYD 12HYD 13HYD 14NAT
Nap6191.06 ± 77.02644.42 ± 48.80234.28 ± 5.6264.80 ± 11.48847.33 ± 10.18128.13 ± 41.05389.24 ± 24.9300115.22 ± 44.14065.78 ± 13.3441.86 ± 4.8400000000370.87 ± 2.39
Ace40.16 ± 2.3235.61 ± 0.07000015.43 ± 15.43000000000000000
Acp243.27 ± 9.36000000000000000000000
Fl90.63 ± 15.3547.61 ± 1.4000000000000051.10 ± 0.030000040.59 ± 9.730
Phe1769.75 ± 48.50203.05 ± 13.0193.25 ± 2.7865.94 ± 7.41246.12 ± 4.6488.79 ± 9.43204.82 ± 0.800000144.29 ± 3.9555.39 ± 5.03000000067.02 ± 0.05
Ant342.92 ± 18.7921.48 ± 21.480052.34 ± 0.0039.19 ± 3.46000000000000000
Flu389.37 ± 34.3552.58 ± 8.490047.81 ± 0.13037.80 ± 0.52000000000000000
Py427.46 ± 39.6764.68 ± 4.880063.36 ± 1.31043.39 ± 2.71000000000000000
BaA *79.38 ± 14.58000000000000000000000
Chr *245.80 ± 14.6537.84 ± 2.9800000000000000000000
BbF *0000000000000000000000
BkF *0000000000000000000000
BaP *38.44 ±5.33000000000000000000000
InP *000000000217.53 ± 28.40000000000000
DbA *0000000000000000000000
BghiP *0000000000000000000000
Σ16 EPA PAHs9858.241107.28327.53130.741256.96216.92729.8700332.75065.78186.1555.3951.100000040.59437.89
Σ8 EFSA PAHs *363.6237.840000000217.53000000000000
TEQ 61.421.640.330.131.730.221.080.000.0021.870.000.070.190.060.050.000.000.000.000.000.040.44
* included in the eight EFSA PAHs; TEQ in µg∙kg−1. 0–0.19, 0.13–1.73 over 85 come from three congeners BaP, BaA, and Nap, and 99 from InP.
Disclaimer/Publisher’s Note: The statements, opinions and data contained in all publications are solely those of the individual author(s) and contributor(s) and not of MDPI and/or the editor(s). MDPI and/or the editor(s) disclaim responsibility for any injury to people or property resulting from any ideas, methods, instructions or products referred to in the content.

