Article

Potential Impact of Drought and Rewatering on Plant Physiology and Fruit Quality in Long-Shelf-Life Tomatoes

by
Cristina Patanè
1,*,
Sarah Siah
2,
Valeria Cafaro
1,
Salvatore L. Cosentino
3 and
Sebastiano A. Corinzia
3
1
CNR-Istituto per la BioEconomia (IBE), Sede Secondaria di Catania, Via P. Gaifami 18, 95126 Catania, Italy
2
Natural Sciences Laboratory, Nature and Life Sciences Institute, University of Constantine 1, Ain El Bey Way, Constantine 25017, Algeria
3
Dipartimento di Agricoltura, Alimentazione e Ambiente, Università degli Studi di Catania, Via Valdisavoia 5, 95123 Catania, Italy
*
Author to whom correspondence should be addressed.
Agronomy 2024, 14(9), 2045; https://doi.org/10.3390/agronomy14092045
Submission received: 15 July 2024 / Revised: 30 August 2024 / Accepted: 4 September 2024 / Published: 6 September 2024

Abstract

:
In this study, the effects of repeated cycles of drying and rehydration on some physiological traits were assessed in long shelf-life tomatoes cultivated in a typical semi-arid area of Southern Italy. Three Sicilian landraces (‘Custonaci’, ‘Salina’, and ‘Vulcano’) from the germplasm collection at CNR-IBE (Catania, Italy) and a commercial tomato mini-plum (‘Faino Hy., control) were investigated under three water regimes: DRY (no irrigation), IRR (long-season full irrigation) and REW (post-drought rewaterings). Net photosynthetic assimilation rate (Pn), leaf transpiration (E), stomatal conductance (gs), instantaneous water use efficiency (WUEi), leaf intercellular CO2 (Ci, ppm), and leaf temperature (°C), were measured during the growing season. At harvest (late July), fruit production per plant was measured and ripened fruits were analysed for total solids (TS), soluble solids (SS), reducing sugars (RS), vitamin C (AscA), and total phenols (TP). Pn promptly responded to rewatering (REW), quickly increasing immediately after irrigation, and declined with soil drying up. All genotypes had similar physiological pathways in DRY, but in IRR, ‘Faino’ had higher Pn (up to 31 μmol CO2 m−2s−1) and E (up to 18 mmol H2O m−2s−1). Stomatal conductance (gs) after rewatering steeply increased and quickly declined after that. All local landraces had the same gs in IRR and REW. Variations in RWC were less pronounced than those in other physiological parameters. WUEi in REW and DRY proceeded similarly (up to 3 μmol CO2 mmol H2O). Irrigation in REW significantly promoted plant productivity over the DRY control (up to +150% in ‘Vulcano’). TS and SS in REW were lower than those in DRY, but higher (+19 and +7%, respectively) than in IRR. Vitamin C was greater in DRY and REW (26 and 18% higher than in IRR, respectively). TP in all local tomatoes were significantly higher (up to +29% in ‘Vulcano’) than those in the commercial control. Water regime had a minor effect on TP in ‘Custonaci’ and ‘Salina’. Principal Component Analysis (PCA) provided information on the changes in physiological and fruit quality traits in tomatoes in relation to cultivars and water regimes. The results of this study also revealed that a water-saving irrigation strategy where few irrigations are applied after prolonged periods of drought might be profitable in terms of fruit production enhancement in long shelf-life tomatoes and that limited rewaterings in most cases, help retaining high levels of fruit quality traits.

1. Introduction

The world is experiencing one of the greatest crises of all time. Indeed, climate change, referring to significant changes in precipitation, temperature, wind, and snow patterns [1], is becoming a serious and incessant threat caused by the release in the atmosphere of GHG emissions, the overuse of fertilisers, herbicides, and pesticides, and above all by human influence [2]. The current scenario is characterised by extreme events, with severe flooding and, on the other hand, harsh drought, which leads to a water supply restriction for the near future. In this regard, the Mediterranean environment is becoming a critical climatic hotspot [3].
The sustainable development goals (SDGs) of Agenda 2030 establish parameters that must be achieved by this time limit [4]. SDGs 6 and 13, which refer to water availability and the fight against climate change, are strongly related to the agriculture sector as a high-water consumer for food production and a high CO2 discharger [5]. The sustainable use of natural resources in agriculture, in addition to fulfilling the increasing food demand, is one of the new goals of millennials.
Drought stress alters several physiological and biochemical processes in crops, ultimately leading to yield losses. Plants respond differently to drought stress at physiological levels, and several physiological mechanisms are involved in their adaptation to water stress [6].
Water stress can improve the resistance and adaptability of crops, keeping in mind the close relationship between the photosynthetic mechanism and the crop yield. Several physiological processes come into play to tolerate stress [7]. As an alternative, deficit irrigation is a water-saving irrigation technique recently proposed for agriculture, under which plants are deliberately allowed to sustain a certain degree of drought [8]. As a result, water productivity is optimised, adequate yields are maintained, and fruit quality is improved [9]. Xu et al. [10] confirmed that deficit irrigation improves photosynthetic performance, increases dry matter accumulation and soil moisture conditions, and, consequently, promotes plant growth and development. Post-drought rehydration (rewatering) may represent an alternative strategy to more common deficit irrigation to save a large amount of irrigation water. This irrigation technique consists of alternate cycles of drought, imposed by withholding irrigation for a long period in order to reach a condition of severe plant stress [11], and rehydration through irrigation [6]. Rewatering somehow reproduces the occurrence of sporadic rainfall in open fields. Indeed, drought/rehydration cycles occur more frequently under climatic change conditions [12], and even a small amount of rainfall in dry and semi-dry agroecosystems after a long period of drought may induce a quick plant response in terms of physiology, growth, and productivity. Knowing such a response is crucial for better insight into the mechanisms of plant recovery under prolonged soil water deficit and better practical management of irrigation water under climatic change.
Due to their tropical origin, tomatoes require high temperatures during the growing season. Therefore, in the Mediterranean areas of South Italy, under open-field conditions, they are cultivated during hot and dry summers and subjected to frequent drought stresses when the water for irrigation is scarce.
Among tomatoes, local landraces of long shelf-life tomatoes are typical of the semi-arid areas of the Mediterranean regions. They are so called because their fruits have thick skin, which allows them to extend their shelf life [13]. These tomatoes are greatly appreciated by consumers for their high sensory and nutritional traits [14]. To retain such valuable characteristics, long shelf-life tomatoes are traditionally cultivated under rainfed conditions that, however, limit their productivity [15]. Isolated water events, or, in the alternative, occasional rewaterings may promote plant productivity while maintaining high nutritional qualities, according to previous findings [16]. However, little is known about the physiological responses of these tomatoes to the application of alternate cycles of drought/rewatering. To this end, a research was conducted to evaluate the effects of repeated rewaterings on some physiological traits in overstressed plants of long shelf-life tomatoes open-field cultivated in a semi-arid environment. The effects of this strategy on fruit production and some quality traits were also investigated.

2. Materials and Methods

2.1. Open-Field Experiment

The experiment was conducted during the summer season of 2017 in a site on the Eastern coast of Sicily (South Italy, 10 m a.s.l., 37°24′35.8″ N Lat, 15°03′31.7″ E Long). The soil was a vertic xerochrepts soil, having the following characteristics: clay 28.3%, sand 49.3%, loam 22.4%, organic matter 1.4%, pH 8.6, total N 1.0‰, available P2O5 5 mg kg−1, exchangeable K2O 245 mg kg−1, bulk density 1.1 g cm−3, field capacity (−0.03 MPa) 0.27 g g−1, wilting point (−1.5 MPa) 0.11 g g−1. No cultivation was conducted before the experiment. The soil was ploughed in early autumn and then milled at 20 cm soil depth just before transplant.
Tomato plants were transplanted at the four-leaf stage on April 21. A single plot measured 12.0 m2 (3.0 × 4.0 m). Plants were spaced 0.75 m between rows and 0.40 m within a row, leading to a 3.3 plants m−2 plant density. Before transplanting, 75, 100, and 100 kg ha−1 of N (as ammonium sulphate), P2O5 (as mineral simple perphosphate), and K2O (as potassium sulphate), respectively, were distributed in the field. Thirty days after transplanting, an additional 75 kg ha−1 of N (as ammonium nitrate) was supplied as a top dressing.
The experiment consisted of a total of 12 treatments derived from the combination of three water regimes and four genotypes of tomato. Treatments were arranged in a 3 × 4 factorial split plot with three replicates. Water regime (I) was applied to the main plot, and genotype (G) was applied to the sub-plot. Three Sicilian landraces of long shelf-life tomatoes (‘Custonaci’, ‘Salina’, and ‘Vulcano’), from the germplasm collection at CNR-IBE (Catania, Italy) and the commercial ‘Faino Hy.’ (Syngenta seeds, De Lier, The Netherland) of mini-plum, were used for the experiment. Three water regimes were applied to all genotypes by means of a drip irrigation system: DRY (no irrigation), IRR (long-season full irrigation), and REW (post-drought rewaterings). At transplant, all plots were irrigated to restore the field capacity (FC). To this end, the volume of water (~45 mm) was calculated, considering soil water content, measured gravimetrically on five soil samples collected randomly at 0.40 m soil depth and oven-dried at 105 °C. Thereafter, irrigation was suspended in DRY and continued in IRR until fruit ripening (July), restoring 100% of evapotranspiration (ETc) at each watering, according to the soil water balance method (ETc = ET0 × kc). ET0 (reference ET) was measured by means of a class-A evaporation pan, and kc (crop coefficients) were those reported for tomatoes by Patanè et al. [17]. The amount of water to distribute at each irrigation (V) was calculated on the basis of the maximum available soil water content in the first 0.4 m soil depth [9]. Irrigation was applied when the cumulative daily ETc corresponded to V (~42 mm). In REW, two long-lasting periods of water stress were imposed on the crop by repeated cycles of drying and watering: as in DRY, irrigation was suspended after the watering at transplant, and the soil was left drying until available soil water content achieved wilting point (~8 weeks after transplant), then irrigation was applied to restore field capacity at ~0.40 m soil depth (~70 mm of water applied by irrigation), and the soil was left again to dry down to wilting point until the next irrigation (after 3 weeks), for a total of two irrigations after that initial. The total seasonal volume of water distributed by irrigation in DRY, IRR, and REW was 450, 4710, and 1849 m3ha−1, respectively.
For weed control, hand weeding was performed at a very early stage of plant growth. Later on, no further weeding was required.

2.2. Measurements in Field

During the crop growing season, the following weather variables were recorded: maximum and minimum air temperature, rainfall, and class-A pan evaporation, using a data logger (CR10, Campbell Scientific, Logan, UT, USA) placed ~50 m from the field experiment.
Soil water content was measured by means of gypsum blocks (Soilmoisture Equipment Corp., Santa Barbara, CA, USA) placed in all plots at 0.4 m soil depth. Measurements were taken approximately before and after each irrigation. Soil water deficit was then calculated as follows:
SWD (%) = (1 − (WC − WP)/(FC − WP))100
where SWD is soil water deficit, WC is soil water content as a percentage of dry soil, FC is soil water content at field capacity, and WP is soil water content at the wilting point. SWD ranged between 0% (field capacity) and 100% (wilting point).
Fruits were harvested at the full ripening stage (late July). At harvest, fruit production per plant (kg) was measured. Approximately 2 kg of ripened fruits were selected from each plot for laboratory analyses.

2.3. Physiological Measurements

Net photosynthetic assimilation rate (Pn, μmol CO2 m−2s−1), leaf transpiration (E, mmol H2O m−2s−1), stomatal conductance (gs, mol H2O m−2s−1), leaf intercellular CO2 (Ci, ppm), leaf temperature (°C), were measured along the growing season in field at 5 subsequent dates after transplanting, from late May (when irrigation was already differentiated in IRR respect to DRY and REW) to July, by means of a LCi-SD Portable Photosynthesis system (ADC BioScientific Ltd., Hoddesdon, UK). Measurements were taken during clear sunshine hours between 10:00 and 12:00 (solar time) in fully developed and healthy leaves. One reading was carried out on three randomly chosen, fully expanded young leaves from each plot.
At the same dates, the relative water content (RWC, %) of the leaves was also measured as follows: one leaf was removed from eight representative plants in each plot, weighed for fresh weight measurement, quickly immersed in distilled water, and left to imbibe overnight to saturation. The day after, all leaves were weighed for turgor weight measurement after removing excess water and oven-dried in a thermo-ventilated oven at 70 °C until constant weight for dry weight measurement. RWC was calculated as follows [18]:
RWC (%) = (FW − DW)/(TW − DW) × 100
where FW (g) is leaf fresh weight, DW (g) is leaf dry weight, and TW (g) is leaf turgor weight.
At the end of the field experiment, instantaneous water use efficiency (WUEi) was calculated as follows [19]:
WUEi (μmol CO2 mmol−1 H2O) = Pn/E
where Pn is the net photosynthetic assimilation rate (μmol CO2 m−2s−1) and E is leaf transpiration (mmol H2O m−2s−1).
Stress degrees were calculated from leaf temperature, as measured by a portable photosynthesis system, and air temperature of the corresponding measurement date, according to Idso et al. [20], modified as follows:
Stress degree (°C): Ta − Tl
where Ta is the air temperature (°C) at the measurement date and Tl is the leaf temperature (°C) (the higher the value, the lower the stress).

2.4. Laboratory Analyses

At harvest, ripened fruits (~2 kg) were randomly sampled from each plot, washed with running water to remove dirt, dried thoroughly with absorbent paper, and analysed in the laboratory for total solids (TS), total soluble solids (SS), reducing sugars (RS), vitamin C (AscA), and total phenols (TP). All chemical analyses were conducted on fruit samples homogenised in Ultraturrax T25 (Janke & Kunkel, Staufen, Germany), previously washed to remove dirt, and dried with absorbent paper. All analyses were carried out in triplicate.
All solvents and reagents were provided by Sigma (Sigma-Aldrich s.r.l., Milano, Italy).

2.4.1. Total Solids (TS) and Total Soluble Solids (SS)

Total solids (TS, g 100 g−1 fresh weight-FW) were determined in homogenate tomato samples dried at 70 °C in a thermo-ventilated oven until constant weight (72 h).
Total soluble solids (SS, °Brix) were measured using a portable digital refractometer (Digital Brix Refractometer, HI96801, Hanna Instruments, Padova, Italy) at 20 °C. Before use, the refractometer was standardised by adding a few drops of distilled water (0 °Brix).

2.4.2. Reducing Sugars (RS)

Reducing sugars (RS, g 100 g−1 FW) were determined spectrophotometrically according to the 3,5-dinitrosalicylic acid (DNS) method [21]. A 5 g homogenate sample was diluted in 5 mL distilled water and then centrifuged at 3500× g for 5′. An aliquot of the diluted sample was mixed with 1 mL of DNS reagent and then incubated in a water bath at 90 °C for 15′. After fast cooling in a cold water bath, the extract was mixed with 1 mL of 40% sodium and potassium tartrate solution. Absorbance was read in a UV spectrophotometer (UV-30 Scan Spectrophotometer, Onda, Carpi, Italy) at 575 nm, using glucose (0 to 1 mg mL−1) as the standard curve (R2 = 0.99).

2.4.3. Vitamin C (AscA)

Vitamin C, expressed as ascorbic acid (AscA, mg 100 g−1 FW), was estimated by the 2,6-dichlorophenolindophenol method [13]. Briefly, a 10 g sample of homogenate was diluted in 5 mL of a 3% (w/v) metaphosphoric acid solution and 5 mL of 8% (v/v) acetic acid solution and then filtered. A 2.5 mL filtrate was titrated with a solution of 2,6-dichlorophenolindophenol standardised in a standard stock solution (1 mg mL−1) of ascorbic acid with a known concentration.

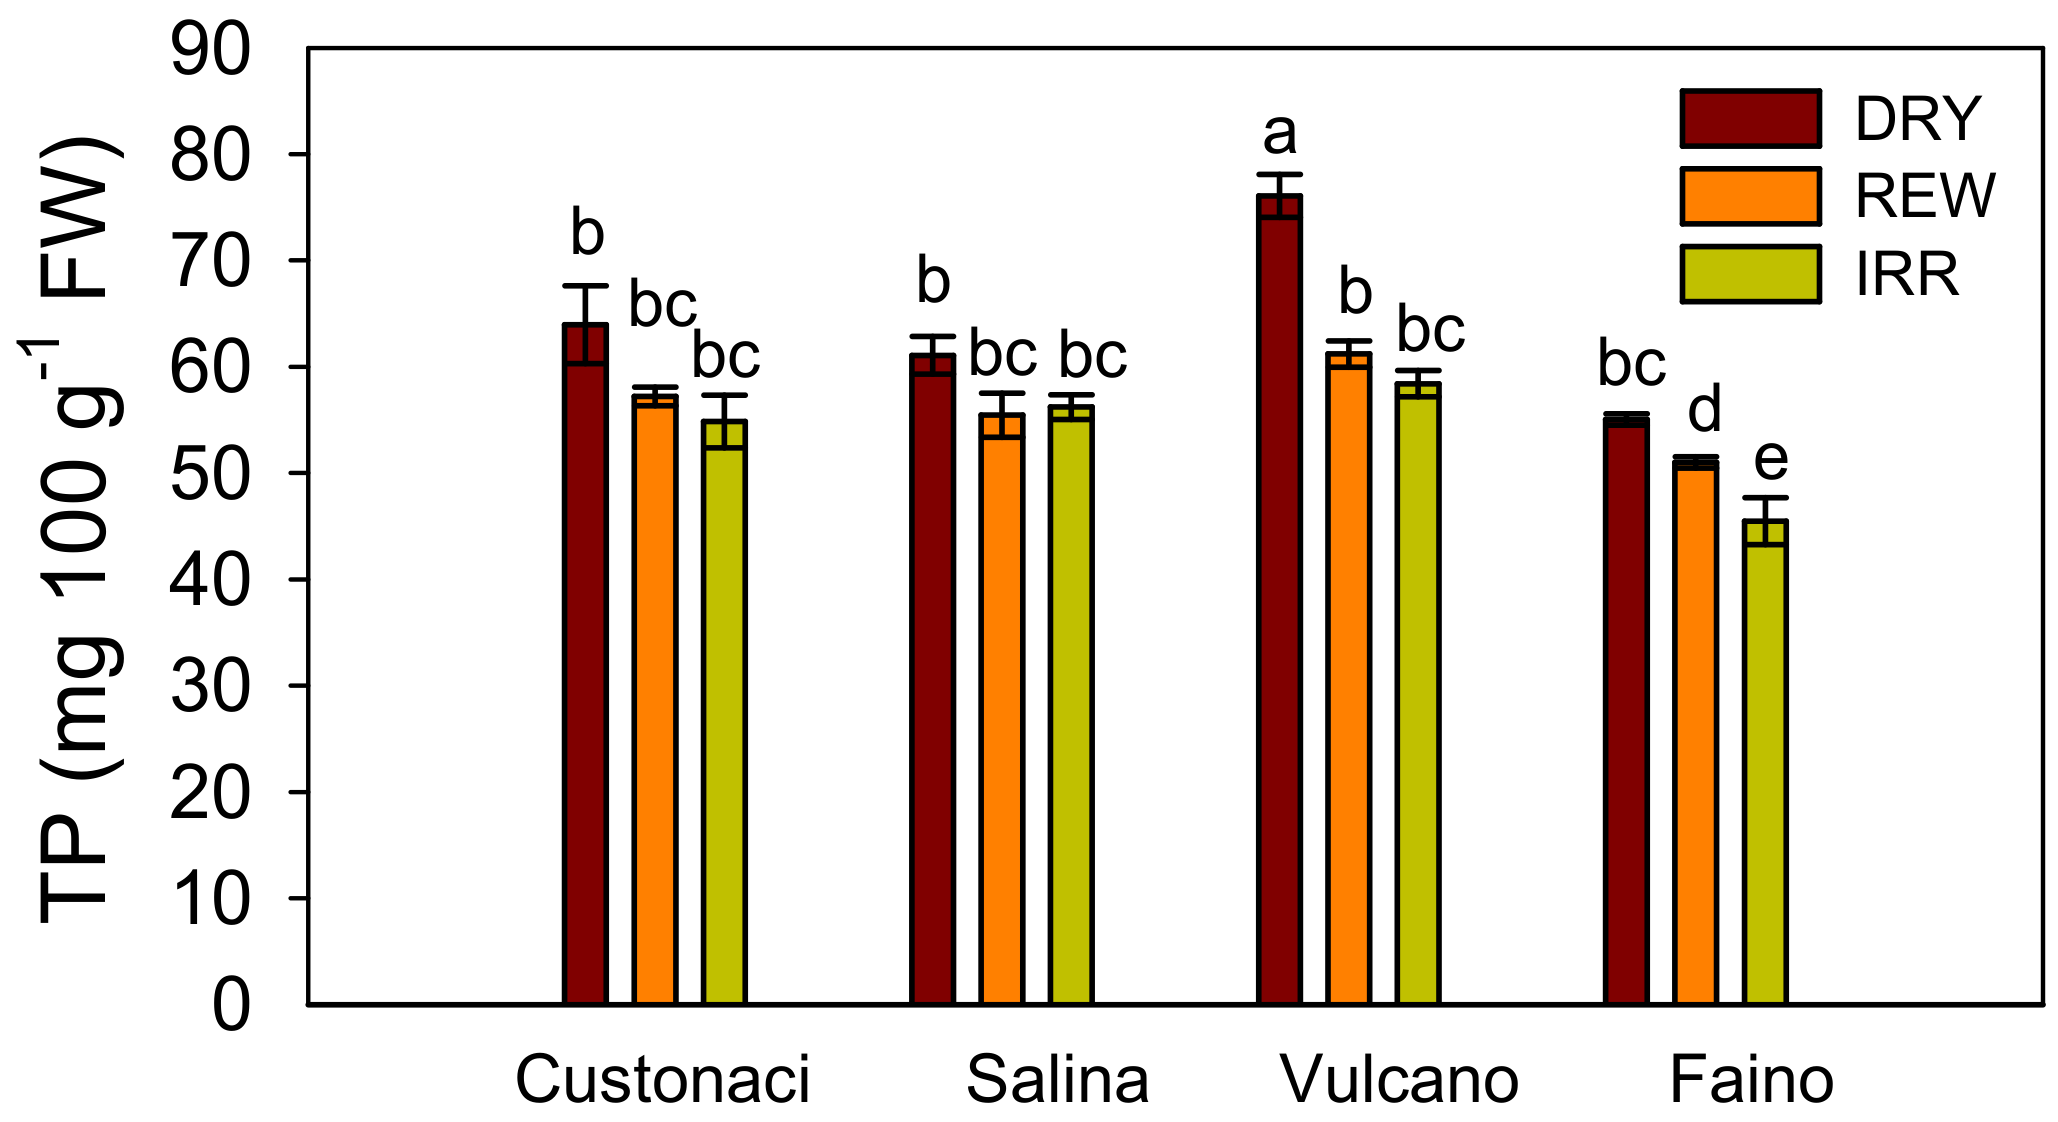
2.4.4. Total Phenols (TP)

Total phenols were estimated using the Folin-Ciocalteu reagent [22]. A 2 g sample of homogenate was extracted in 10 mL of 80% MeOH. The extract was vortexed and incubated for 15 h at room temperature, and then centrifuged at 5000× g for 5′. After that, 125 μL of supernatant was diluted in 500 μL of distilled water, then mixed with 125 μL of the Folin-Ciocalteu reagent, and after a few minutes, 1.5 mL of a 7% (w/v) Na2CO3 solution and 1 mL of distilled water were added. All samples were incubated for 90 min at room temperature. Absorbance was read spectrophotometrically at 760 nm, using gallic acid (0 to 250 μg mL−1) as the standard curve (R2 = 0.99). Results were expressed as mg gallic acid equivalent (GAE) 100 g−1 FW.

2.5. Statistical Analyses

Data of physiological traits on two dates (June 23 and July 11, i.e., two days after the first rewatering and one day after the second rewatering, respectively) and those of fruit production and fruit quality traits, were subjected to a two-way analysis of variance (ANOVA) using CoStat version 6.003 software (CoHort Software, Monterey, CA, USA), considering water regime and genotype and their interaction as sources of variation. Means were separated using Tukey’s test at a 95% confidence level.
Pearson’s correlation test was conducted for all traits (SigmaPlot11, Systat Software Inc., San Jose, CA, USA). Principal component analysis (PCA) was also performed using Minitab Statistical Software version 19, LLC, Minitab Inc., State College, PA, USA). In both cases, data from physiological measurements of July 11 were considered.

3. Results

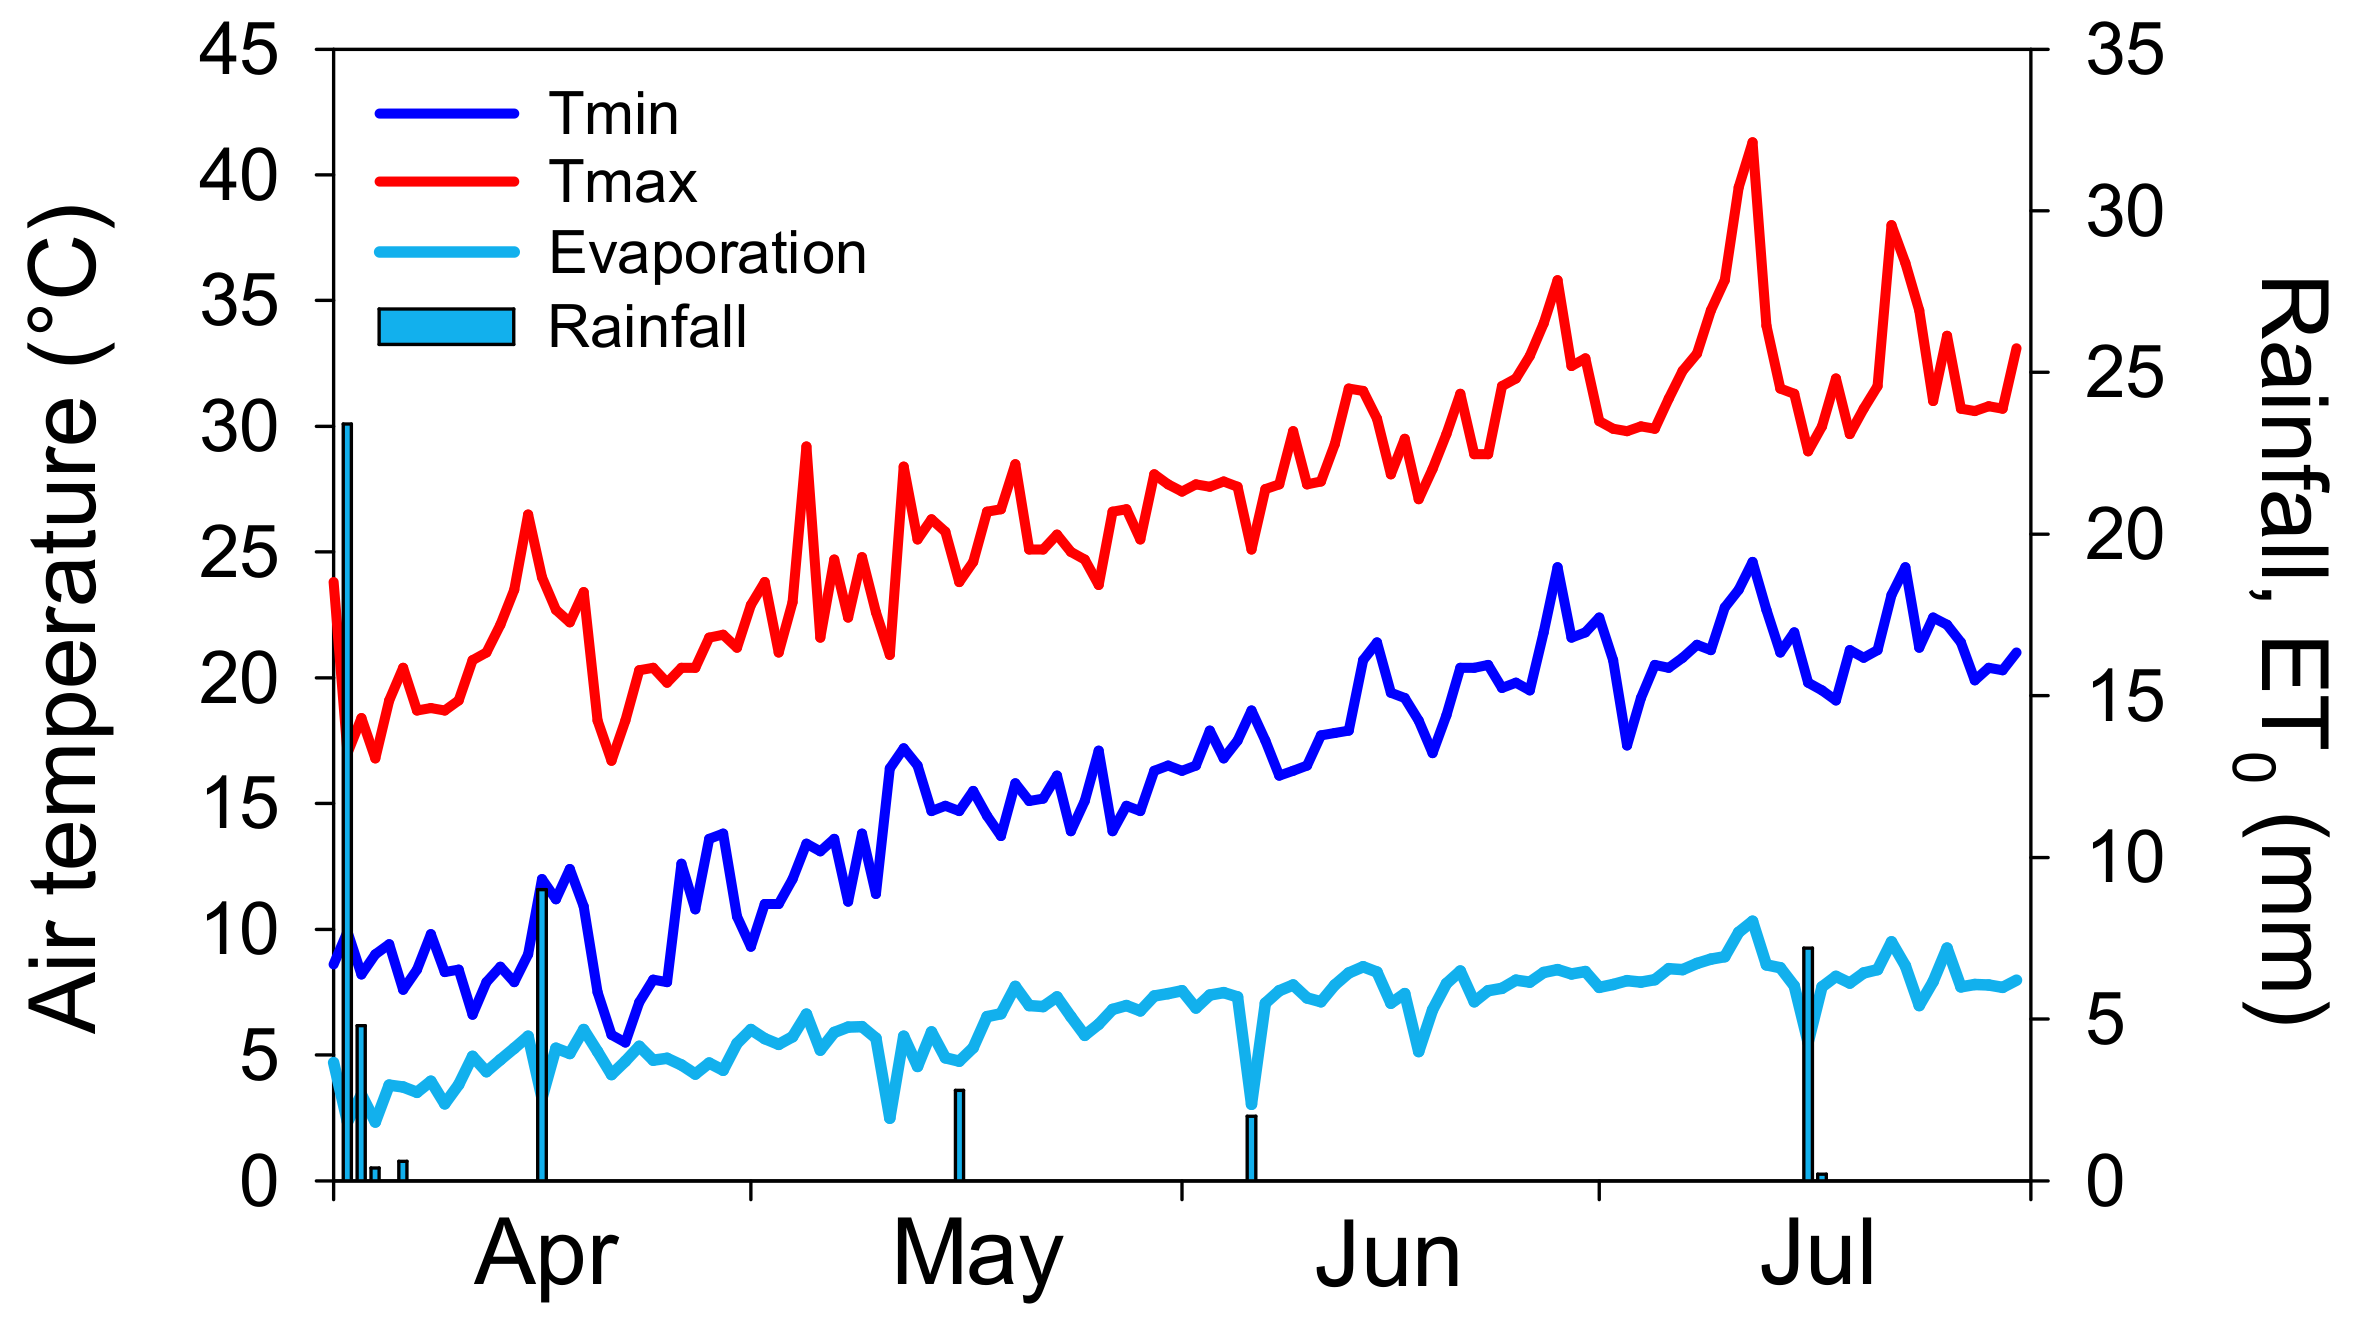
3.1. Weather Conditions during the Field Experiment

The course of the weather parameters recorded during the field experiment is shown in Figure 1. Maximum temperatures ranged from 19.8 °C to 41.3 °C, those minimum from 7.1 and 24.6 °C. The lowest values of both maximum and minimum temperatures were recorded in late April and the highest in mid-July. Rain from transplant to harvest was very scarce (~12 mm); therefore, the soil water content was totally derived from irrigation. Accordingly, the meteorological course was that of a typical Mediterranean environment, with hot and dry summers. Daily reference evapotranspiration (ET0) followed the course of air temperature; therefore, its maximum (8 mm) was recorded in mid-July.

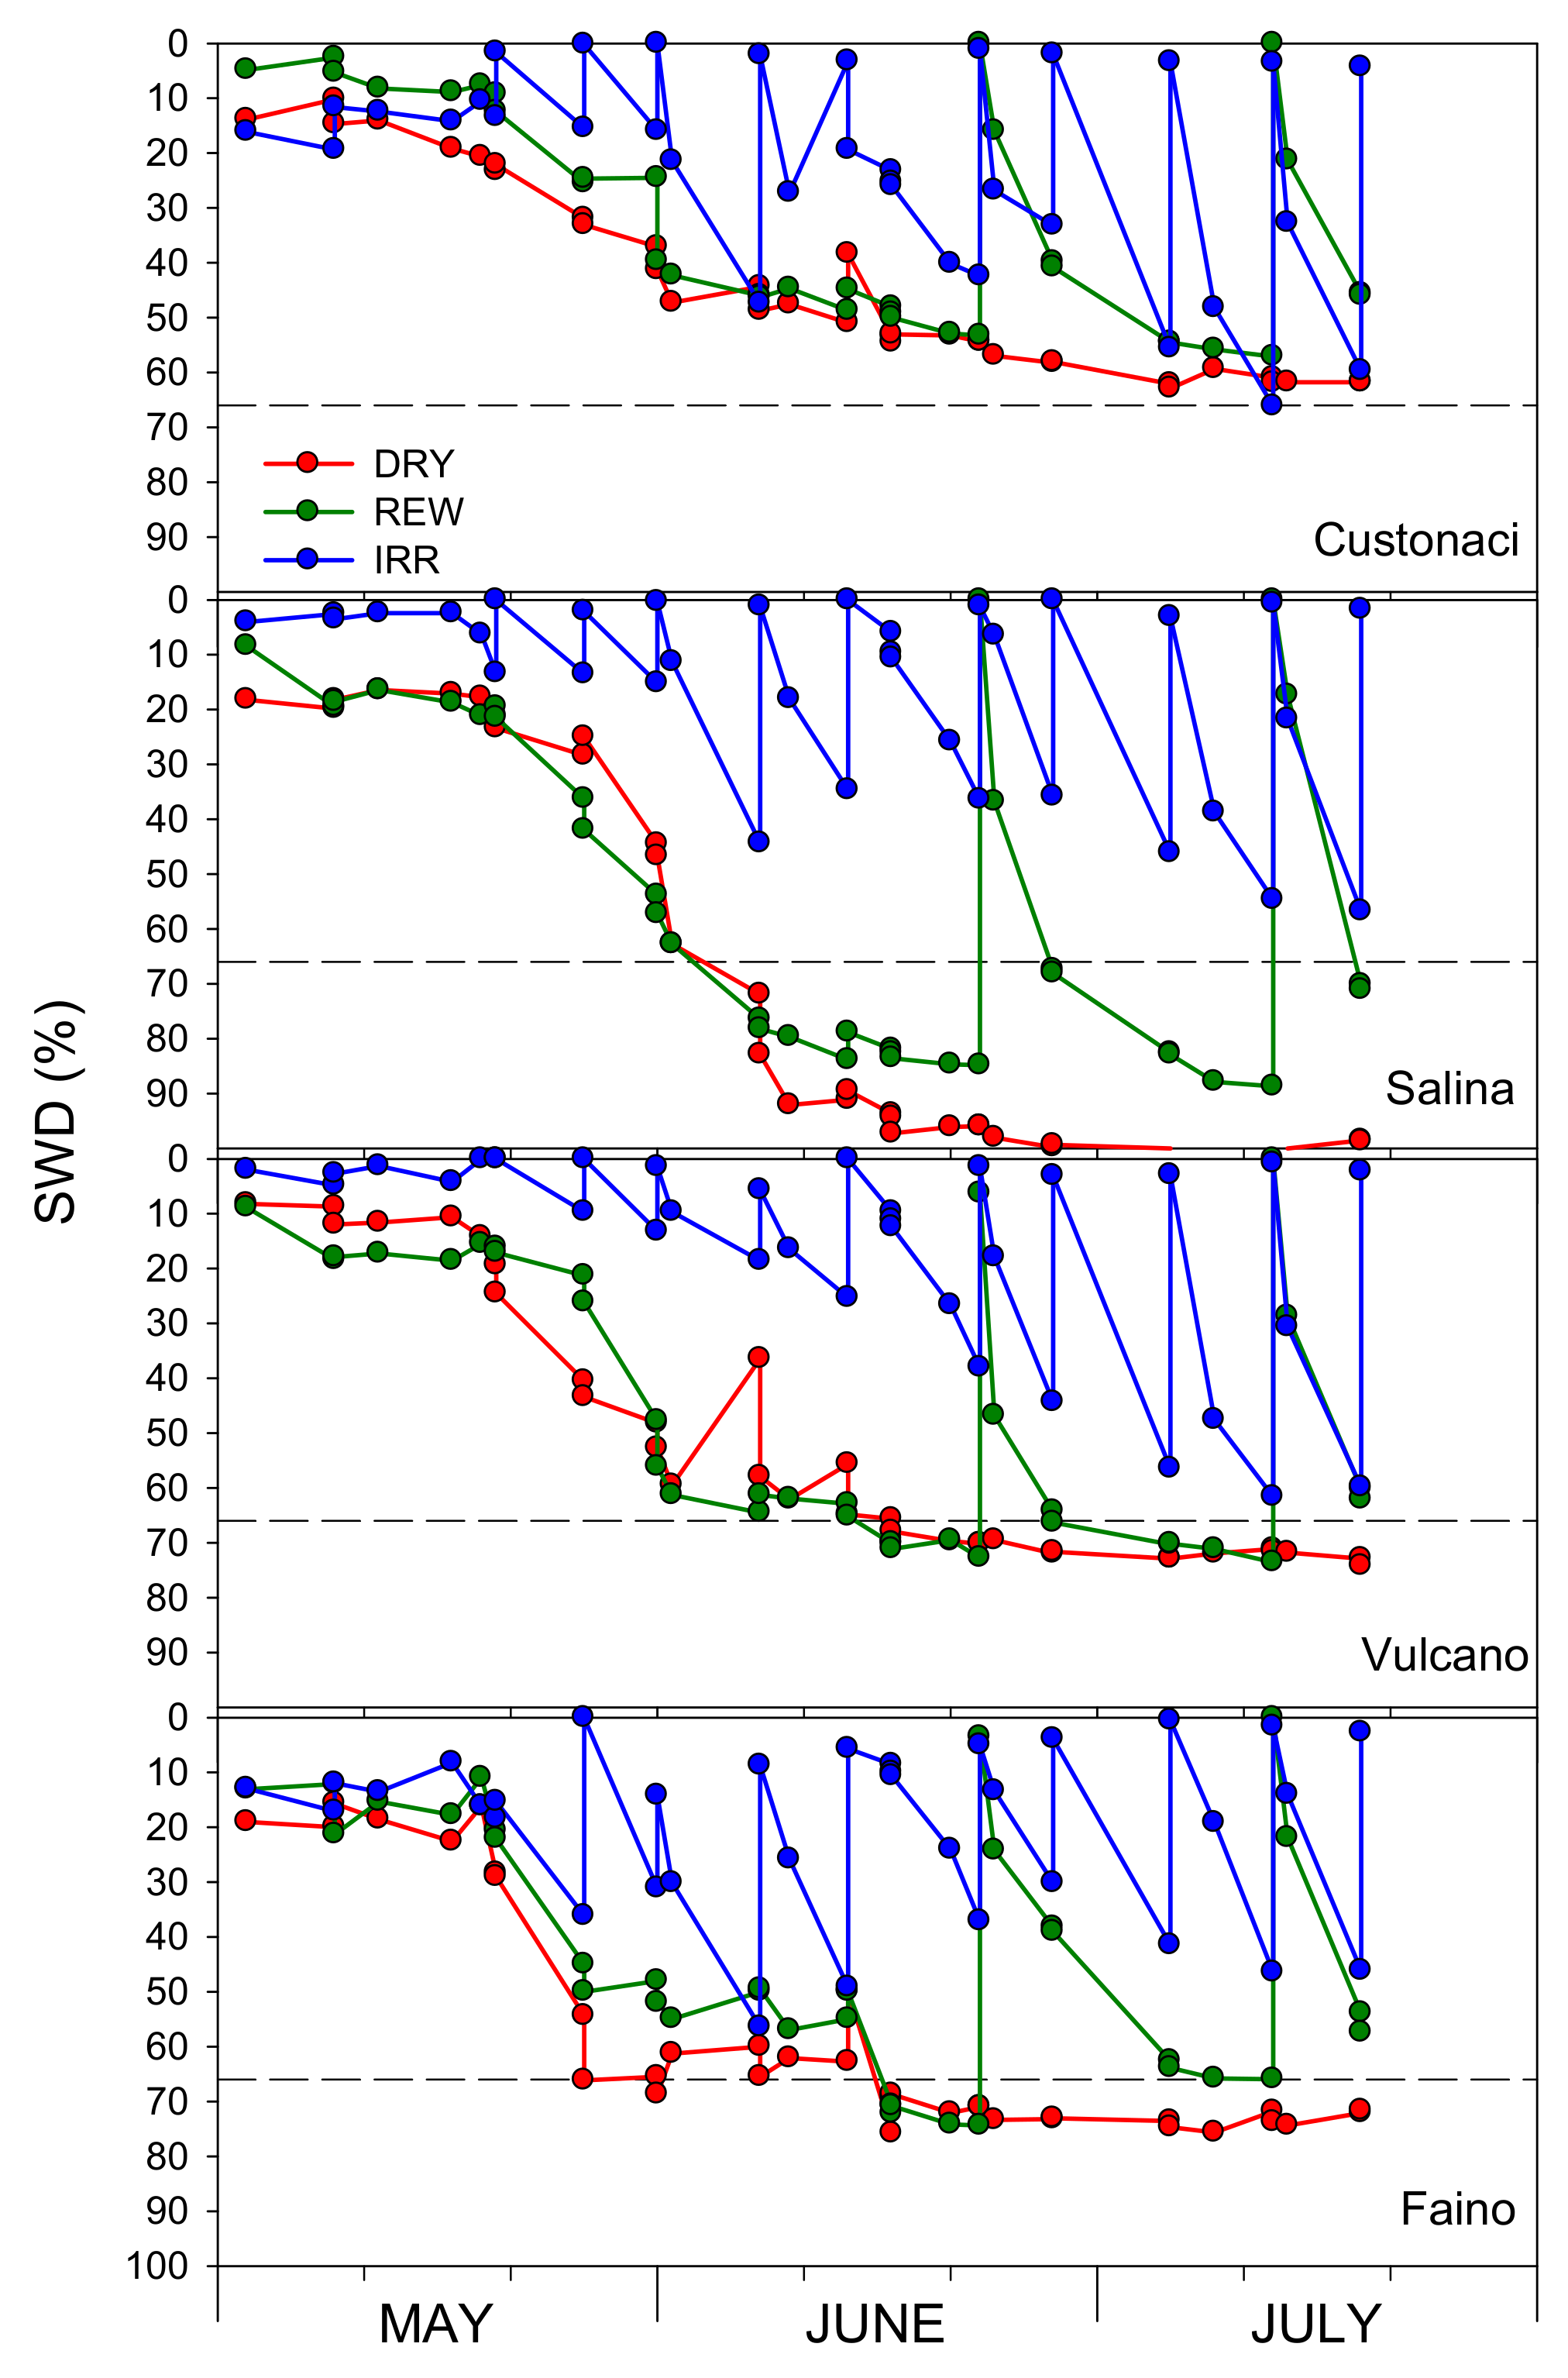
3.2. Course of Soil Water Content

The course of soil water deficit measured during the field experiment in all plots revealed that soil gradually dried up in DRY, reaching the threshold for irrigation (i.e., when SWD approached 66%) in late May, in ‘Faino’, in early June, in ‘Salina’ and ‘Vulcano’, and later (July), in ‘Custonaci’ (Figure 2).
In ‘Salina’, soil water content in both DRY and REW dropped below the theoretical threshold for irrigation, approaching the wilting point (SWD > 90%) already in mid-June.
In IRR, the soil water content fluctuated widely according to irrigation, always above the theoretical threshold. However, the volume of water to be applied in each irrigation (approximately constant) was calculated empirically according to cumulative ET0 and not on the basis of the actual water content of the soil. Therefore, irrigation was often applied earlier than reaching the threshold (SWD 66%).
In REW, SWD followed the same course as in DRY until the first rewatering (June 21), which restored field capacity (SWD = 0), then SWD started decreasing again down to threshold (or below that in ‘Salina’), to approach zero again until the second rewatering (July 10) which fulfilled the soil to field capacity again. After that, the soil water content started to decrease again down to the threshold.

3.3. Physiological Traits

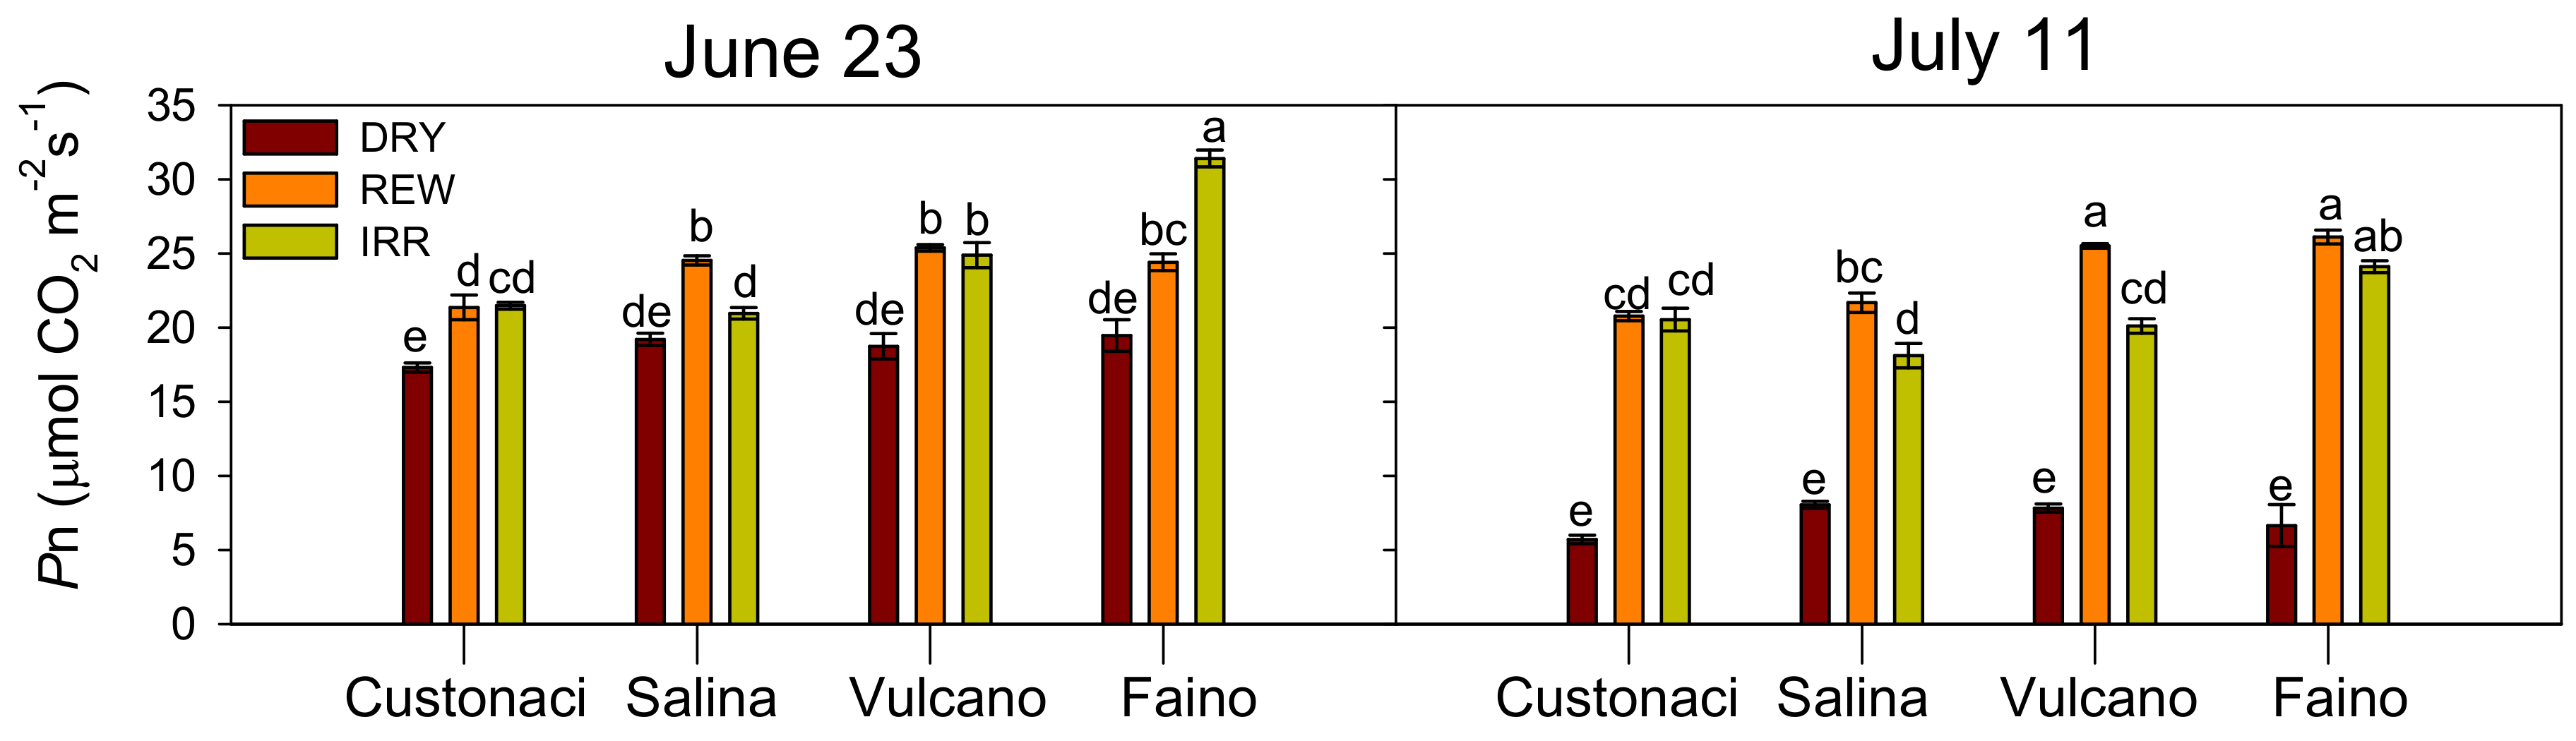
3.3.1. Net Photosynthetic Assimilation Rate (Pn)

Figure 3 shows the variations with time in the net photosynthetic assimilation rate (Pn) measured from approximately one month after transplant (when plants were at the flowering stage) onwards.
In all tomatoes, Pn progressively decreased in plants exposed to dry soil (DRY), with greater rates from the third measurement onwards when the SWD was close to or even lower than the theoretical threshold (66%) for irrigation. In IRR, Pn was kept more or less stable (in ‘Custonaci’ and ‘Faino’) or slightly decreased (in ‘Salina’ and ‘Vulcano’) along the growing season up to the final measurement. In REW, Pn initially followed the same trend as in DRY, but after the first rewatering it quickly increased, more steeply in ‘Salina’ and ‘Vulcano’, to decline again according to soil drying up, and increased again after the second rewatering. In all cases, after the first rewatering, Pn in REW never dropped down to the levels in DRY but was kept quite high, close to or even higher than those in IRR. When single measurements at two dates (June 23 and July 11) were considered, plants in REW photosynthesised as high as those in IRR in the first measurement and even more in the second measurement (I, p < 0.001) (Table 1 and Table 2). Among the genotypes, on both dates, the highest and the lowest photosynthetic activities were measured in ‘Faino’ and ‘Custonaci’, respectively (G, p < 0.001). However, significant ‘I × G’ (p < 0.001) was observed in the ANOVA (Figure 4). Indeed, in both measurements, all genotypes had the same levels of Pn under severe water stress conditions (DRY), but under REW and IRR, they behaved differently. In particular, in the measurement of June 23, the commercial ‘Faino’ assimilated significantly more CO2 than local landraces under no water limitation (IRR), but under REW its Pn declined to the same levels of the other tomatoes (except ‘Custonaci’). In the last measurement (July 11), all genotypes (except ‘Custonaci’) in REW assimilated more CO2 than those in the IRR.

3.3.2. Leaf Transpiration (E)

Leaf transpiration (E) was less influenced than Pn by the continuous drying of soil in DRY, maintaining quite constant levels with time (in ‘Custonaci’ and ‘Salina’) or slightly decreasing late in the growing season (in ‘Vulcano’ and ‘Faino’) (Figure 5).
In both IRR and REW, all tomatoes exhibited increasing rates of E late in June, according to the rise of air temperature in its maximum values (>30 °C), when fruit buds were visible on plants. After that, E was kept constant or further increased until the last measurement, according to a further increase in air temperature.
When the main effects of the experimental factors at the two dates were considered, a significant effect of the water regime (I, p < 0.001) revealed that the plant transpired less in DRY, with wider differences (up to 66% lower) with respect to REW and IRR, late in the growing season. Indeed, the differences among water regimes in the levels of water transpired by plants were less pronounced in the first measurement (that of June 2023) than those measured two weeks later (July 11), when E in DRY was lower while in REW and IRR was much higher, in response to good soil water conditions and increased thermal conditions. ‘Genotype’ significantly affected E only in the measurement of June 23, with lower rates of transpiration measured in ‘Custonaci’. Significant interaction ‘I × G’ (p < 0.001) suggests that the leaf transpiration response of tomato plants to changing soil water content varied with genotype (Figure 6). In DRY, on both dates of measurement, tomatoes had the same levels of E. Under unrestricted soil water conditions (IRR), ‘Faino’ transpired more than local genotypes (except ‘Custonaci’ in June 11). In REW, ‘Custonaci’ transpired less than the other genotypes on June 23, but late in the season, the levels of E were the same in all tomatoes.

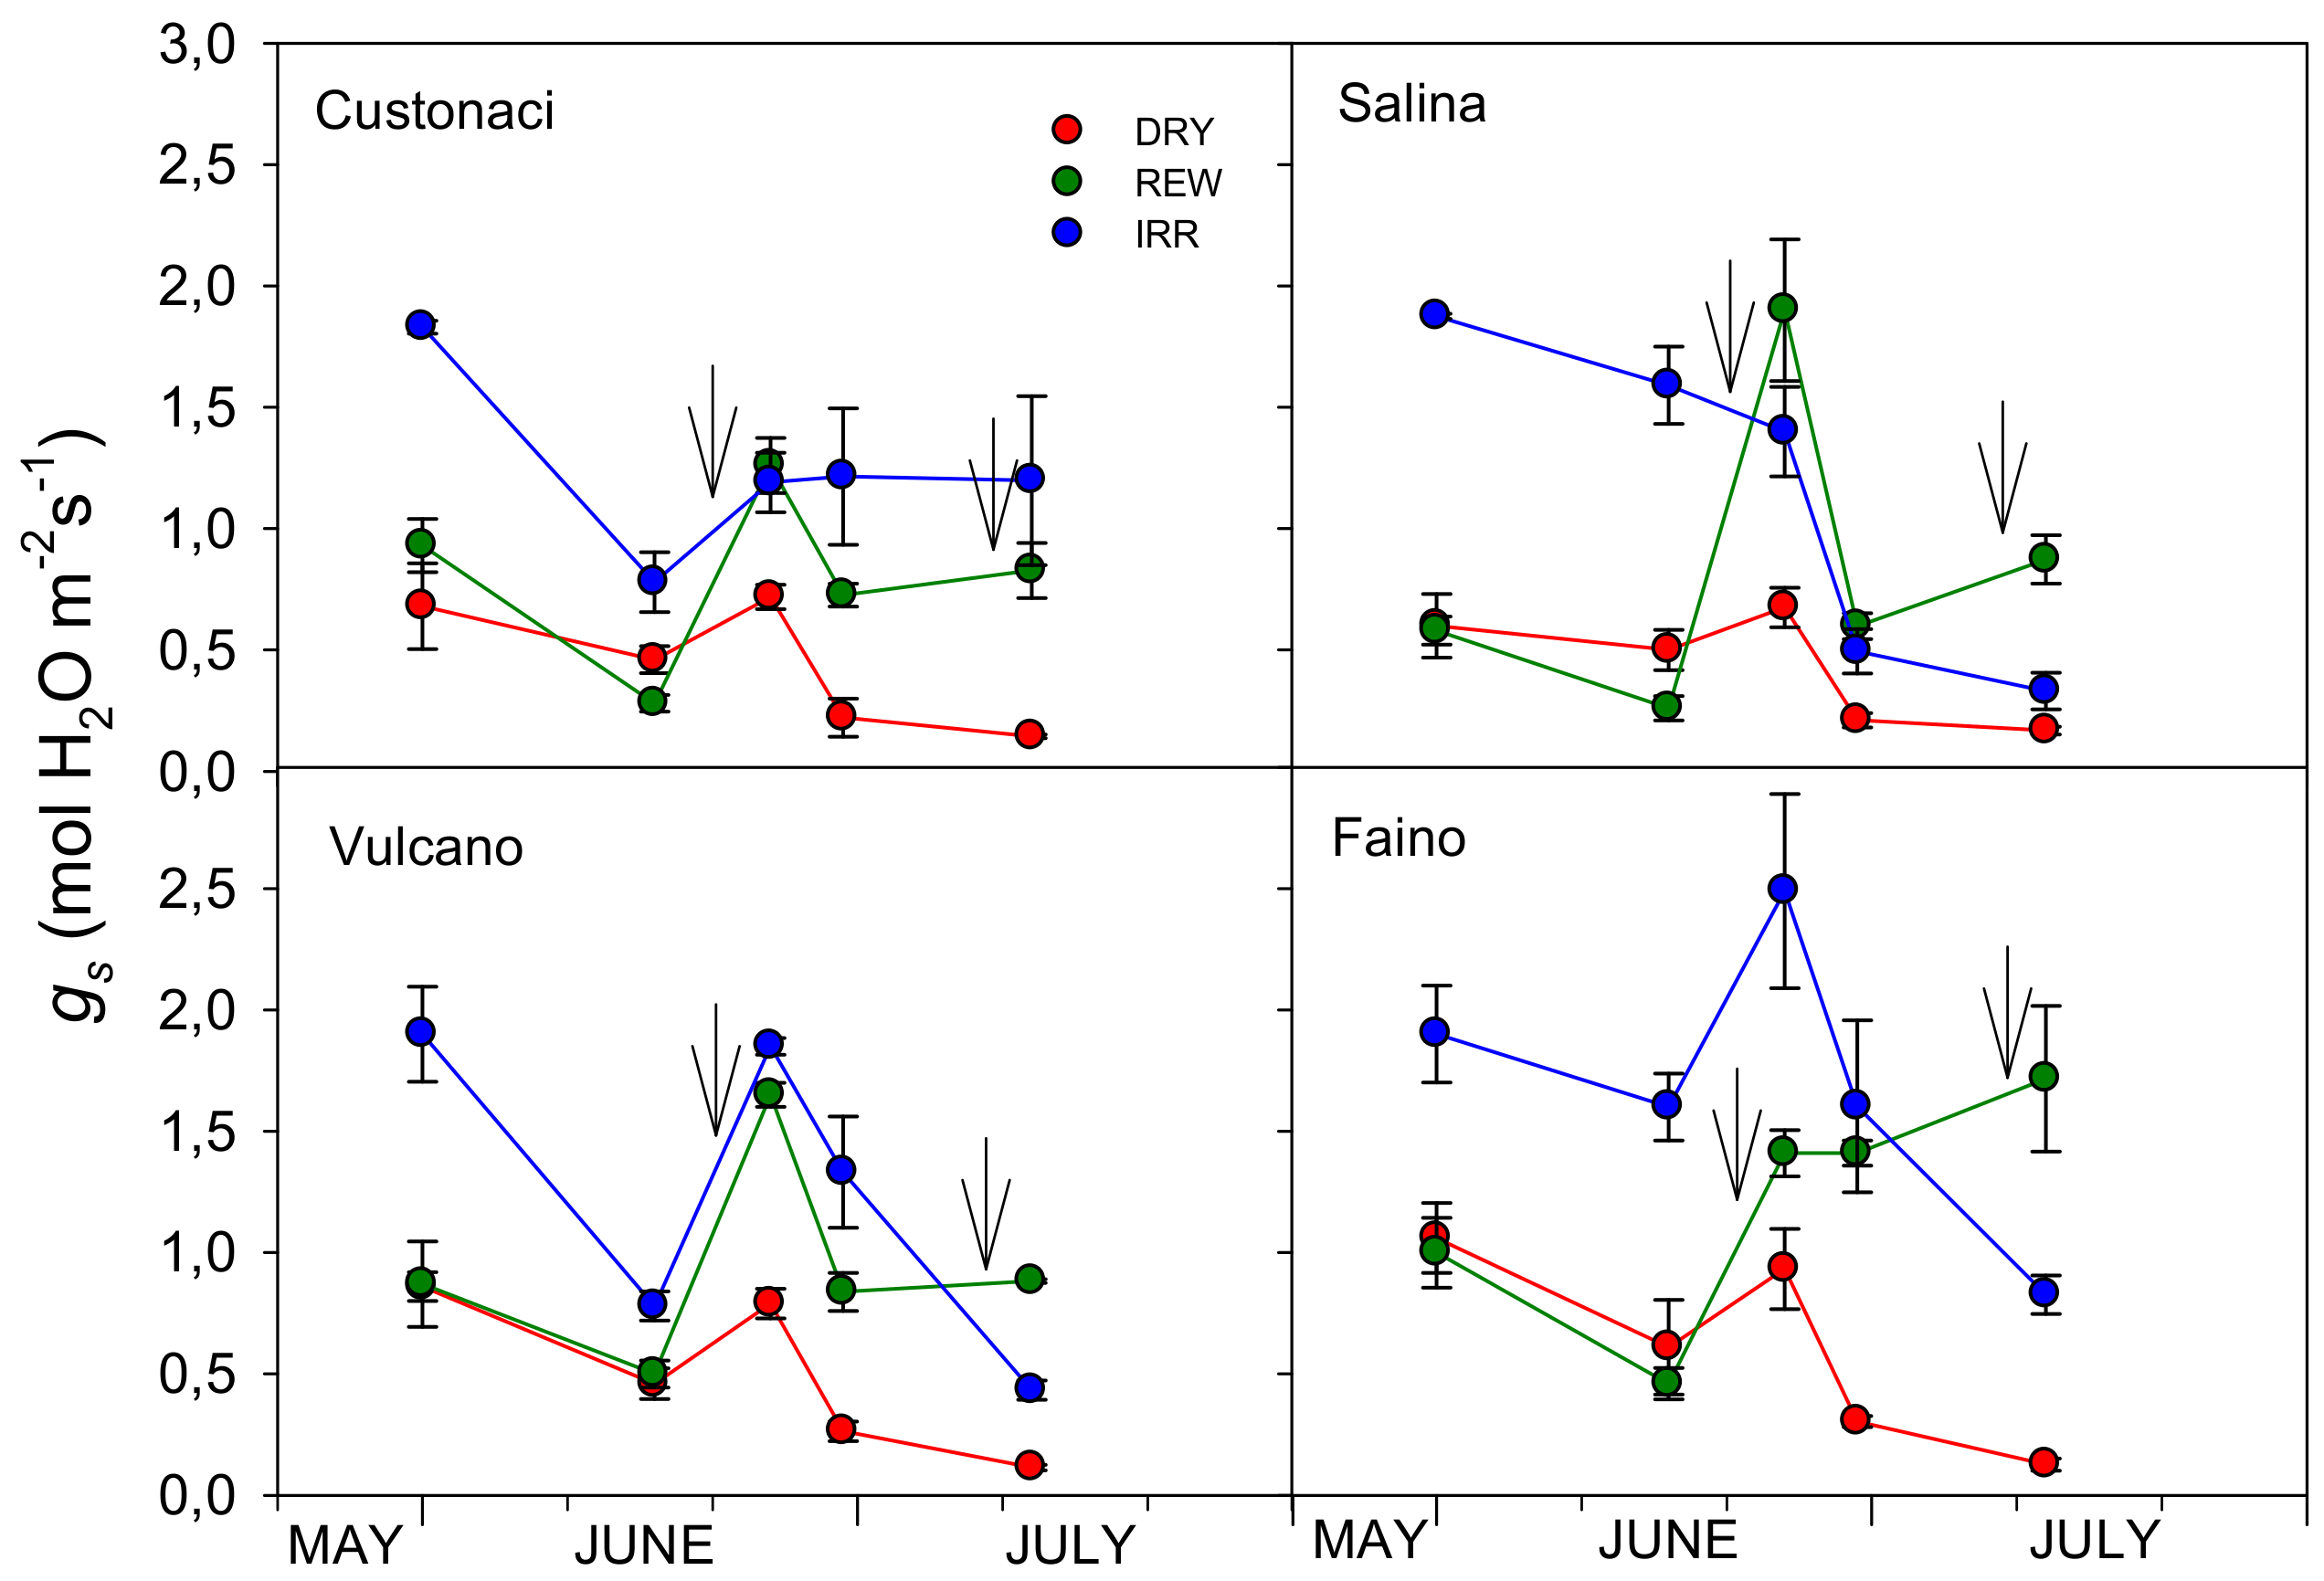
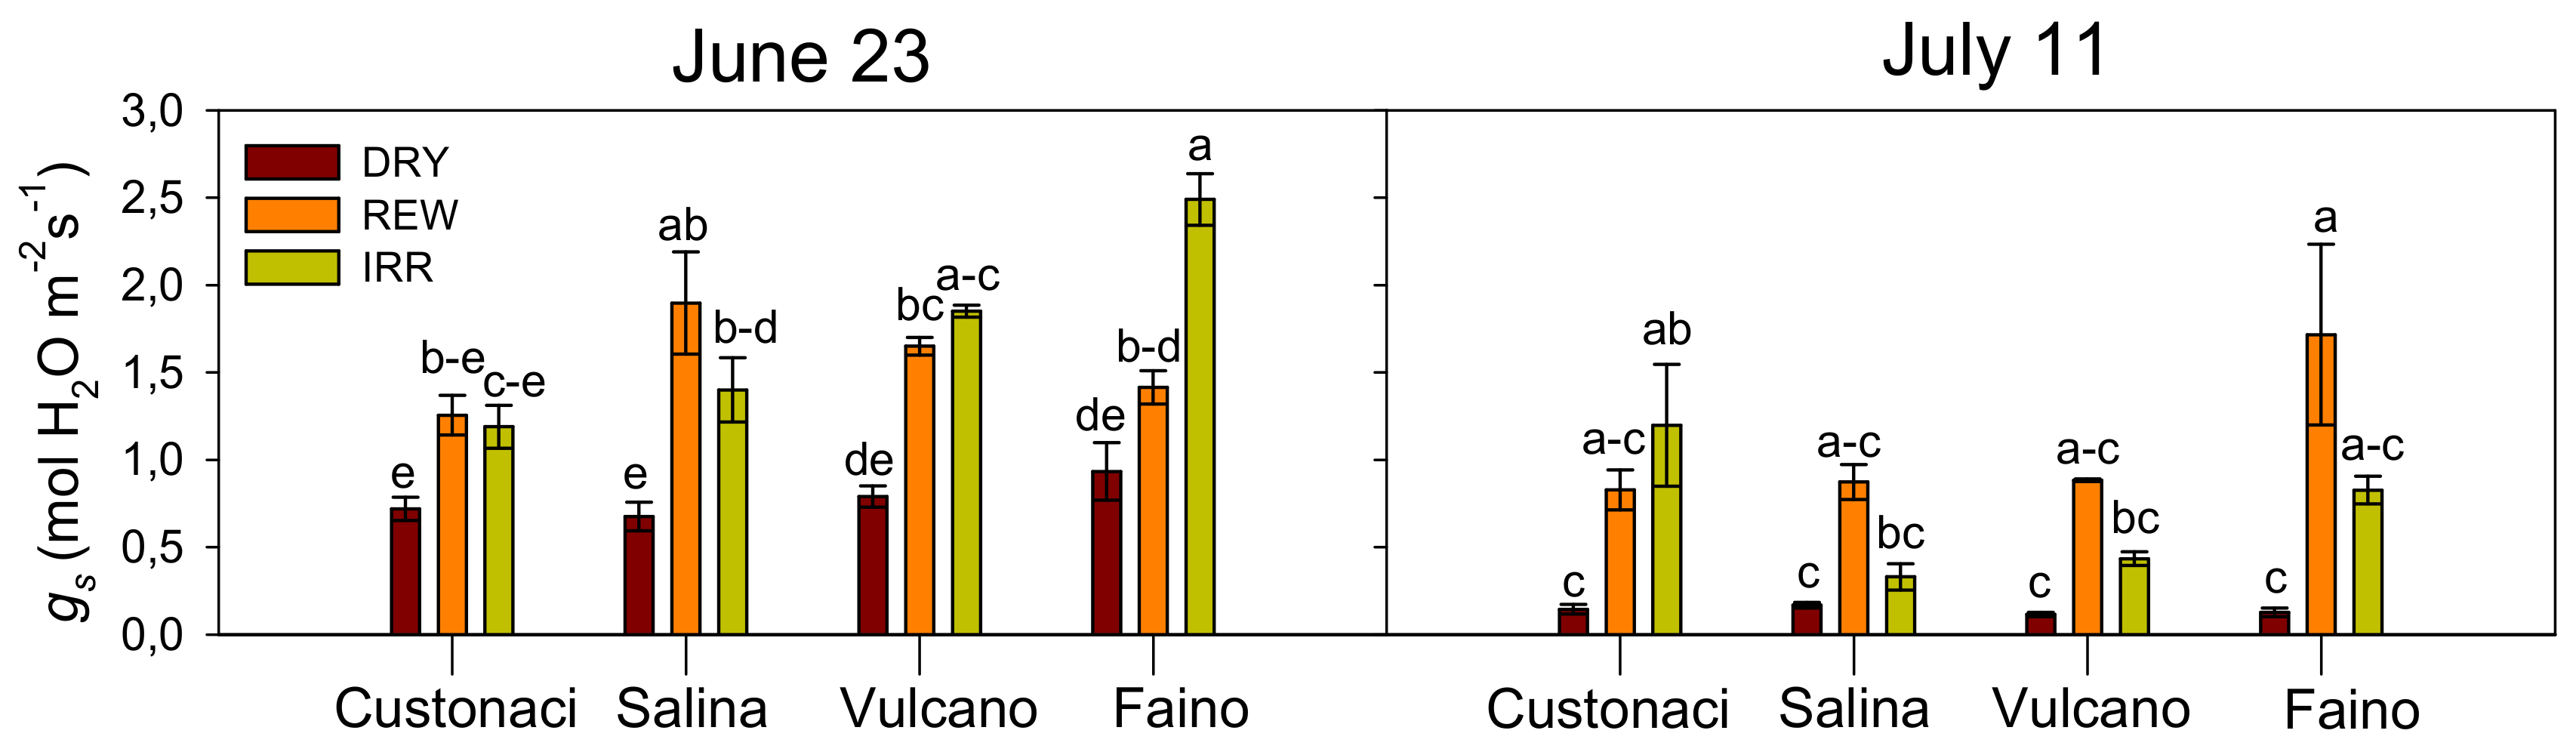
3.3.3. Stomatal Conductance (gs)

Stomatal conductance exhibited large fluctuations during the growing season in response to changes in soil water content (Figure 7).
Overall, the maximum levels of gs were recorded on June 23, which was different from the maximum E, measured a week later. As observed for Pn, but with wider fluctuations, in DRY and REW gs proceeded quite similarly, but just a couple of days after the first rewatering, gs in REW steeply increased, and quickly declined after that and rose again after the second rewatering. Although continuously irrigated, unlike what was observed for E, stomatal conductance in plants of IRR progressively declined (except in ‘Custonaci’) from late June onwards.
Water regime effects on gs were found in ANOVA at two dates, and plants in DRY had significantly lower rates of stomatal conductance than those in REW and IRR (I, p < 0.001). Tomato genotype affected gs as E in the measurement of June 23, with the highest rates in ‘Faino’ and ‘Vulcano’, but later (July 11) ‘Vulcano’ exhibited the lowest gs.
Significant ‘I × G’ in ANOVA revealed a combined effect of the two experimental factors on stomatal conductance (Figure 8). In the measurement on June 23, no genetic differences were highlighted both under REW and IRR. Moreover, each genotype achieved the same levels of gs under the two water regimes. However, the commercial ‘Faino’ behaved differently, with much higher levels of stomatal conductance under no water limitations in IRR (I × G, p < 0.001).

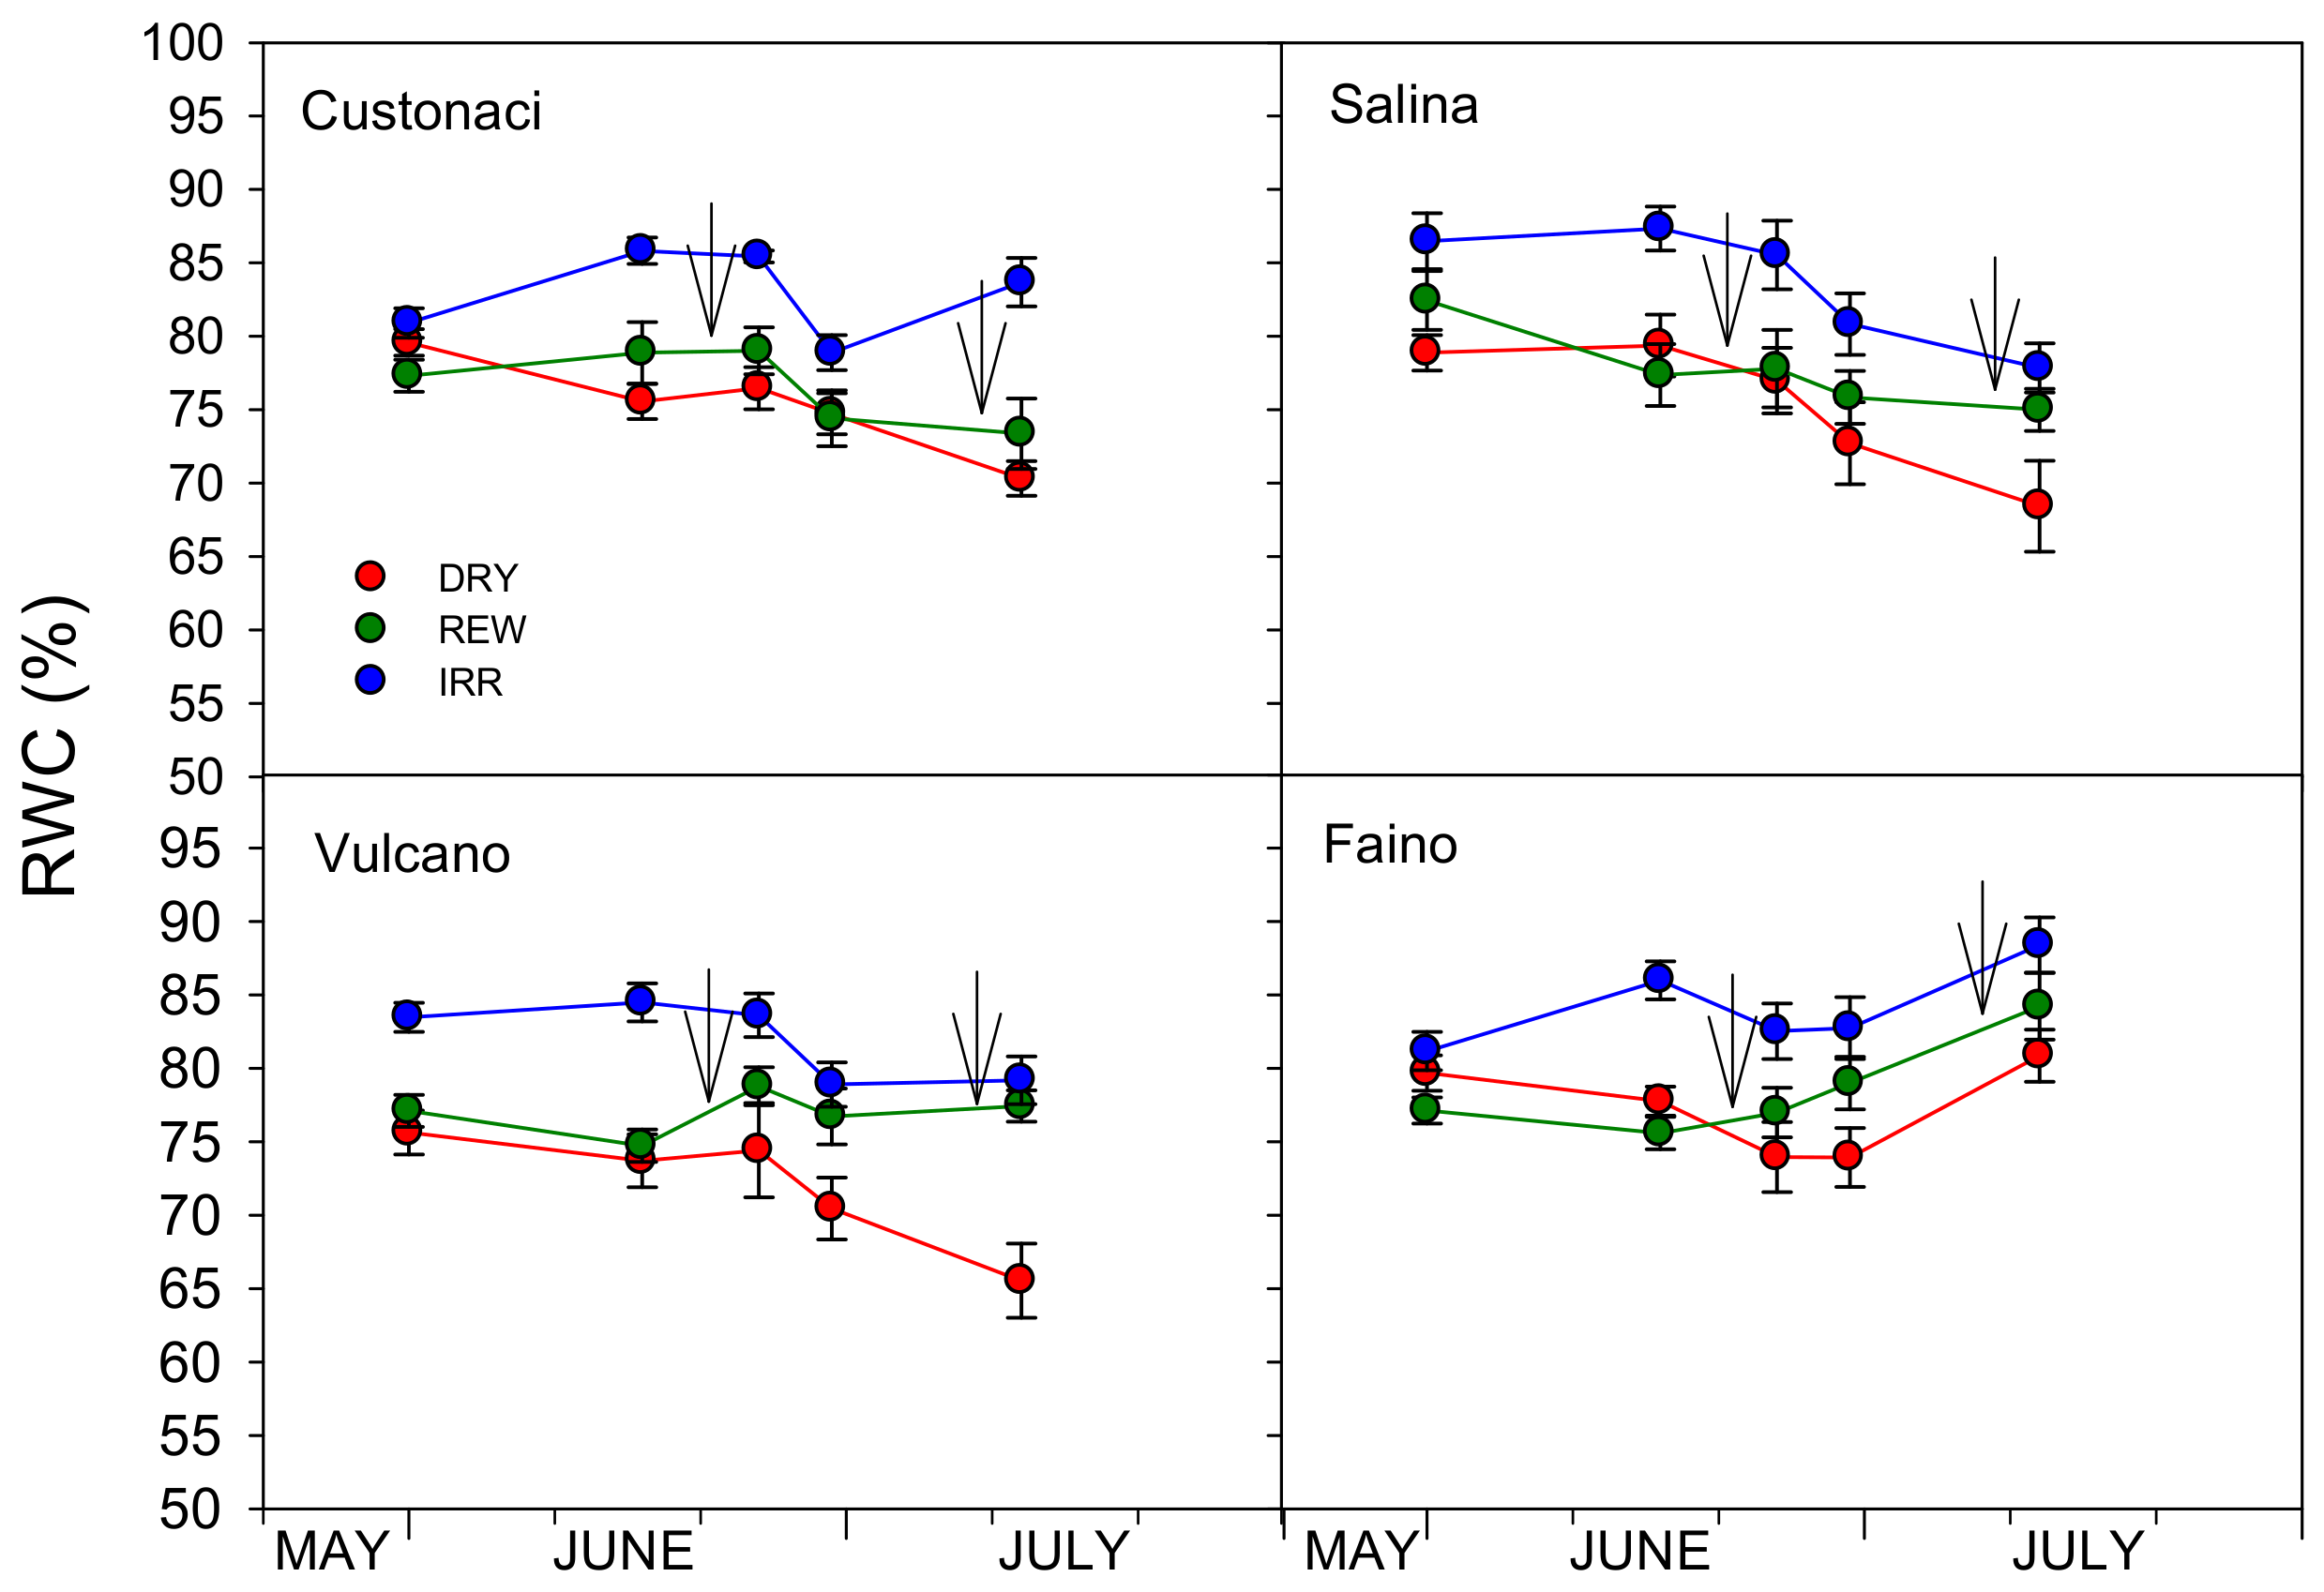
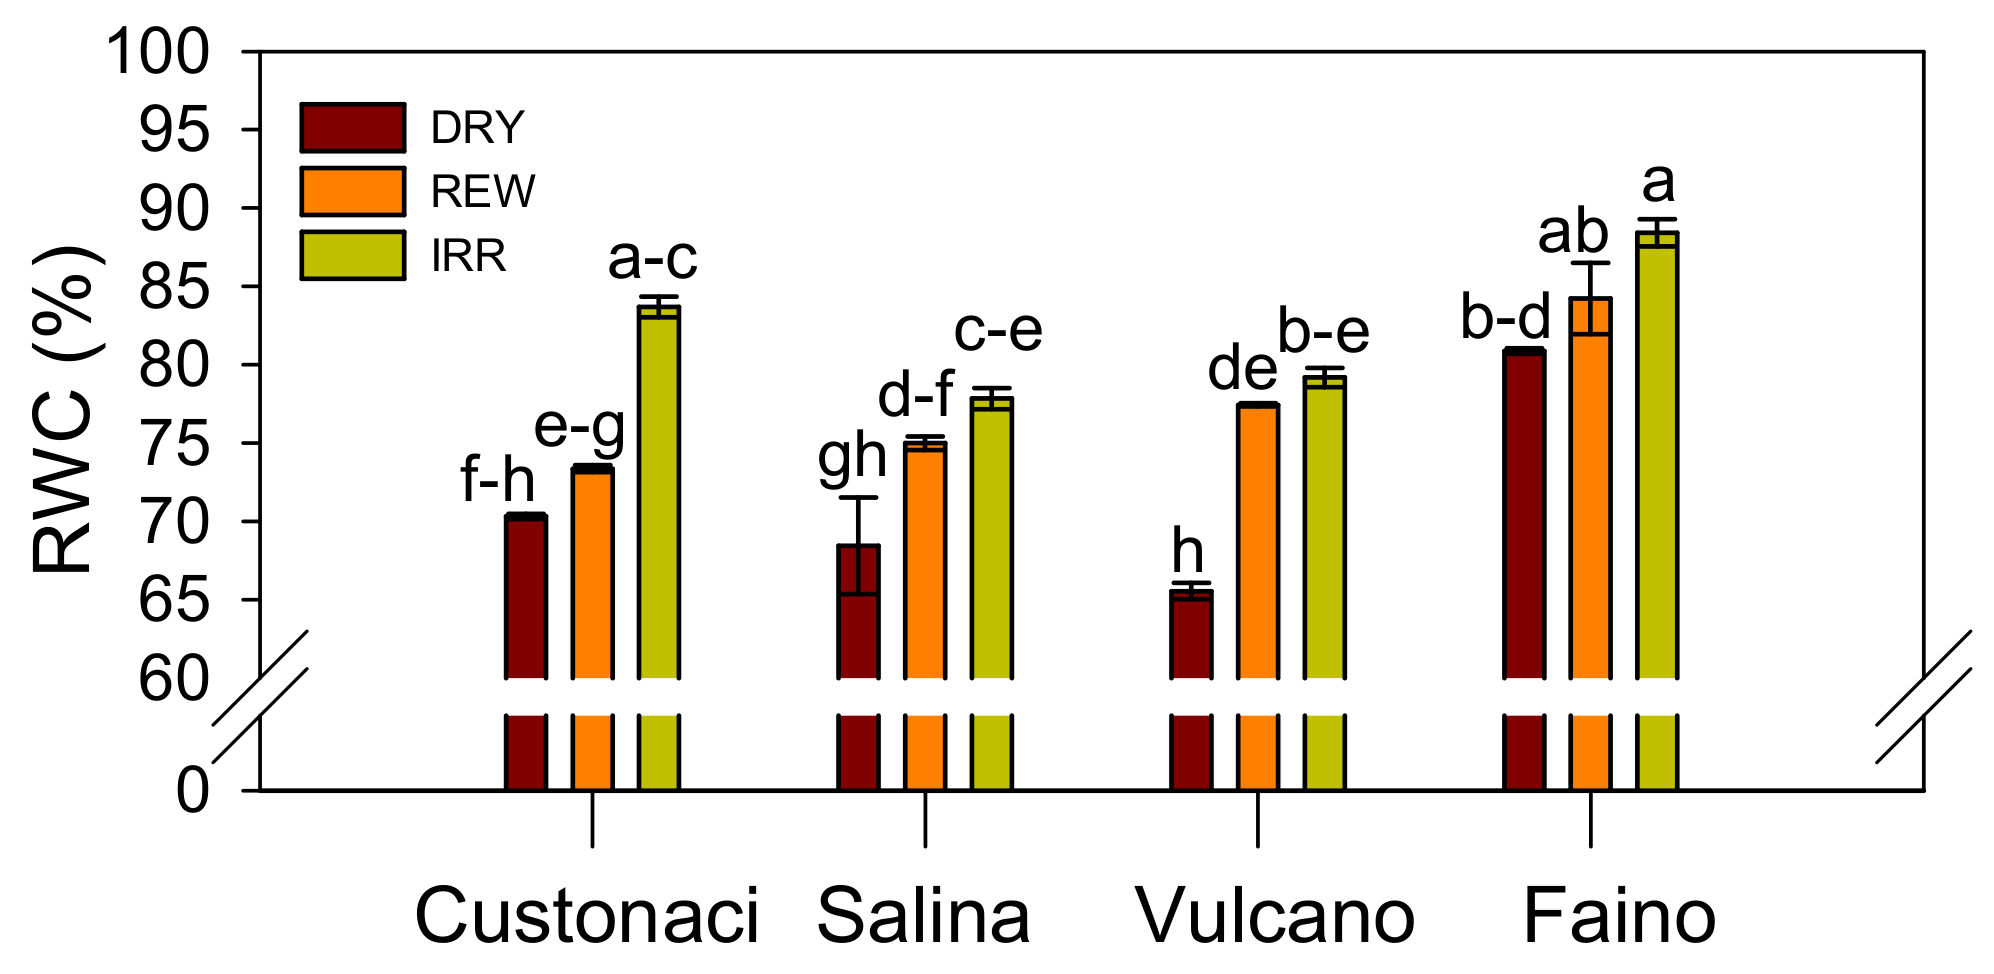
3.3.4. Leaf Relative Water Content (RWC)

Variations in relative water content (RWC) with time were less pronounced than those in the above-described physiological parameters (Figure 9). Under restricted soil water conditions (DRY), RWC declined slightly during the growing season (except in ‘Faino’ in the last measurement). According to the continuous water supply, plants in the IRR maintained a higher RWC (>80%), which did not vary much during the growing season. In REW, RWC proceeded as in DRY, but differently than in DRY, where leaves progressively lost water according to soil drying; after the first rewatering, leaves were well rehydrated and RWC was maintained constant or slightly increased until the second rewatering, approaching values in IRR. Only plants of ‘Custonaci’ revealed a low capacity to rehydrate after irrigation in REW, with values of RWC kept at the levels of those in DRY, despite the two rewaterings. Regardless, in all tomatoes, the RWC in DRY (except in ‘Vulcano’) never dropped below 70%, indicating a good plant water status, even under prolonged water shortage.
Significant effects of both experimental factors were found on RWC. In IRR, RWC was always higher than that in REW and DRY. Among tomatoes, the highest RWC was measured in the commercial ‘Faino’, with no differences within local landraces in plant rehydration capacity. In the measurement of June 23, all tomatoes had the same response to water regimes (I × G, ns). In the latest measurement (July 11), local landraces had lower RWC than ‘Faino’ in both DRY and REW, and in IRR only ‘Custonaci’ approached the commercial control (Figure 10).

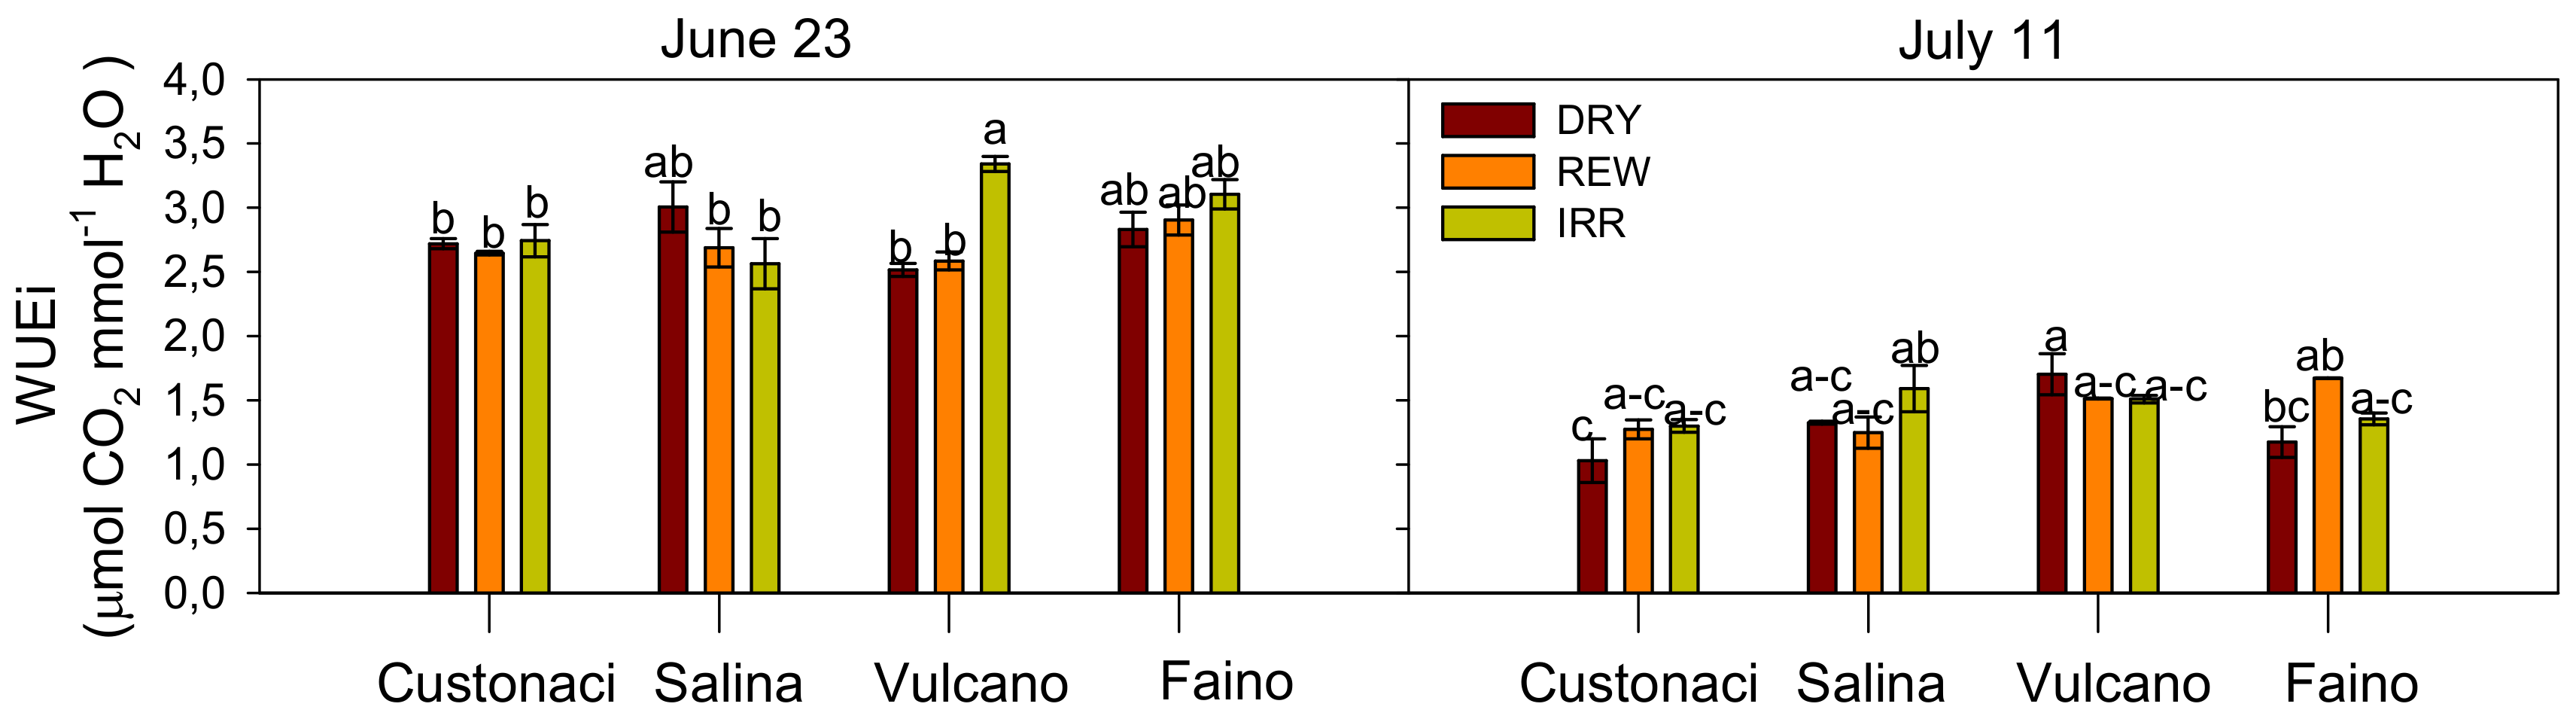
3.3.5. Instantaneous Water Use Efficiency (WUEi)

The course of instantaneous water use efficiency (WUEi) with time is shown in Figure 11. In the first measurements, WUEi in the IRR tended to maintain values lower than those in REW and DRY until mid-June. In late June, the efficiency in IRR steeply dropped, according to the rise in leaf transpiration rates, and was kept more or less constant afterward. In REW, WUEi proceeded quite similarly to that in DRY, despite the two rewaterings.
Genetic differences were found only late in the growing season (July 11), with the greatest and the lowest efficiencies measured respectively in ‘Vulcano’ and ‘Custonaci’ (G, p < 0.01). Opposite results were obtained for the effects of the water regime, with values of WUEi significantly higher under IRR (I, p < 0.05) but only on June 23.
Interestingly, in the measurement of June 2023, each genotype had the same WUEi at all water regimes, except the landrace ‘Vulcano’, which exhibited a significantly greater efficiency when continuously irrigated (I × G, p < 0.001). WUEi measured on July 11, much lower than that on June 23, did not differ among genotypes under IRR and REW. Under severe soil water deficit conditions, a significantly higher efficiency was measured in ‘Vulcano’ (I × G, p < 0.01) (Figure 12).

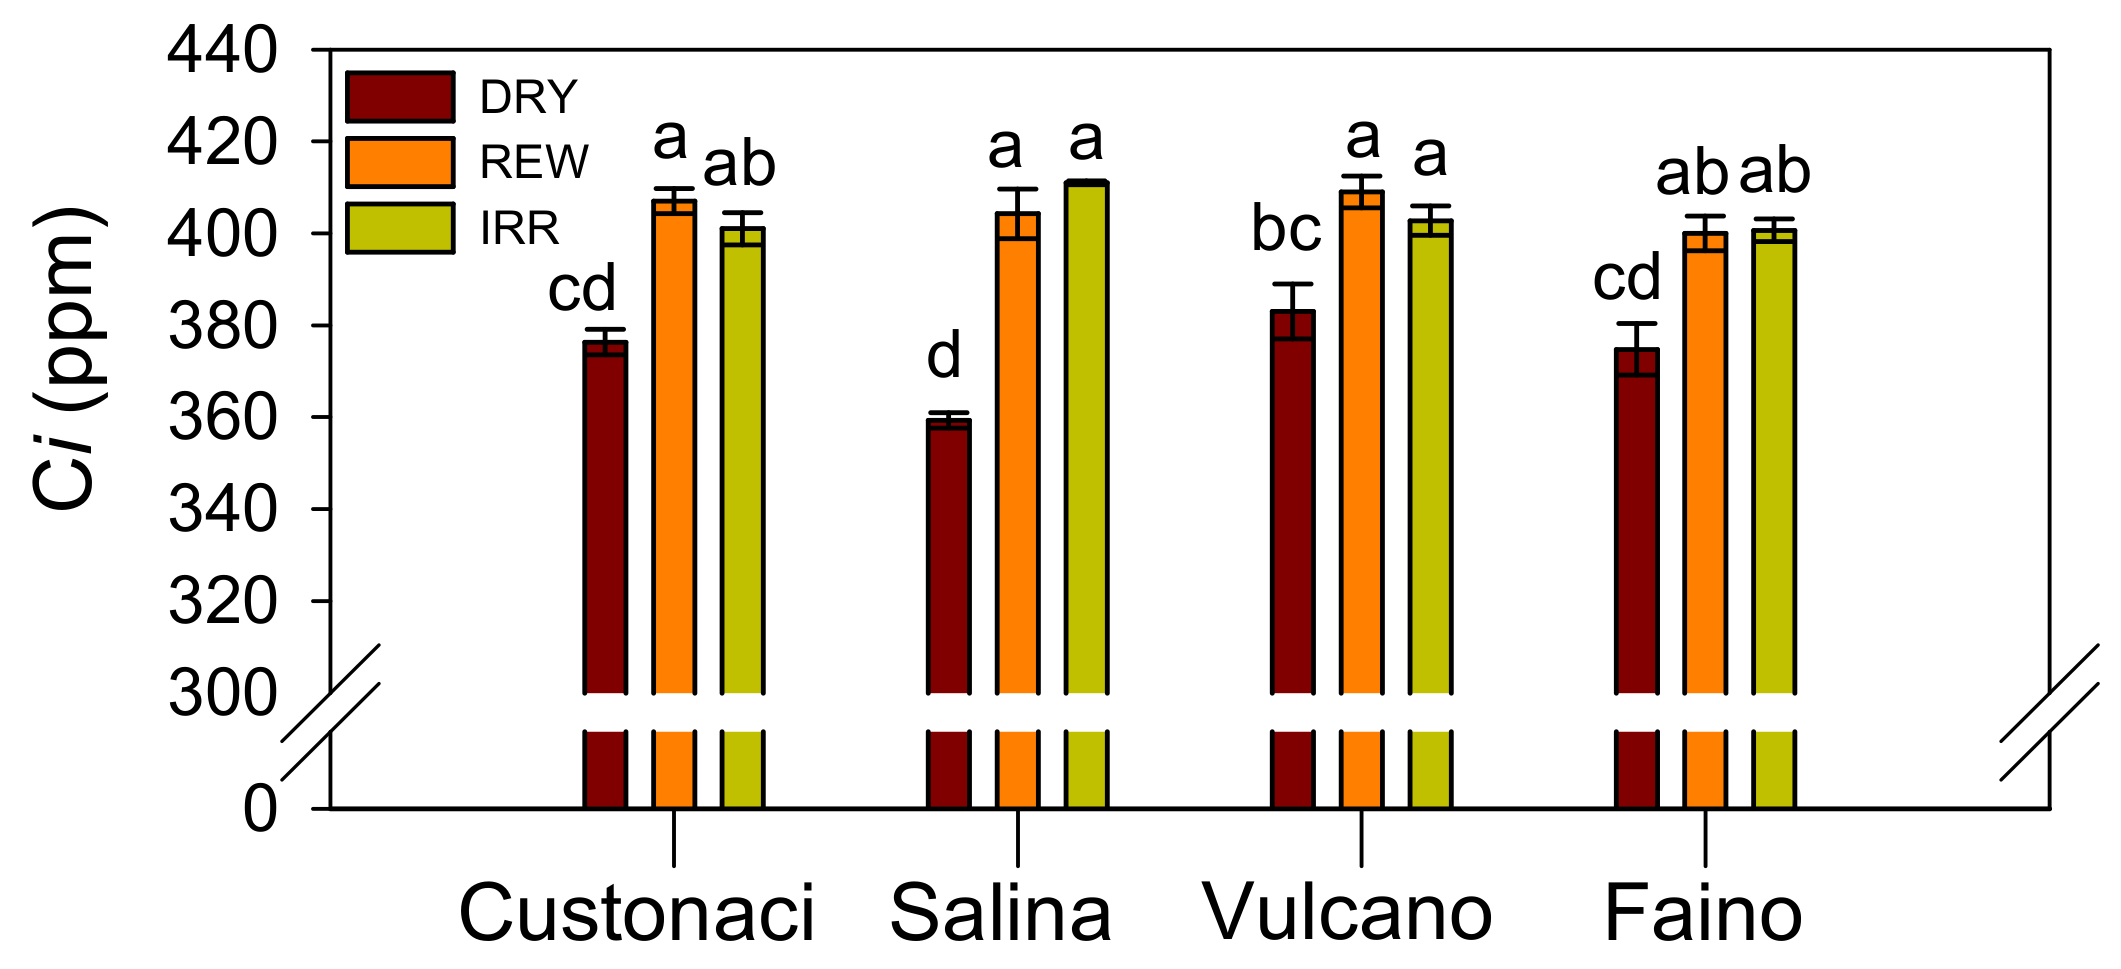
3.3.6. Leaf Intercellular CO2 (Ci)

The time course of Ci is shown in Figure 13. A similar pattern was observed in DRY and REW, in both cases quite lower than that in IRR, until the first rewatering, when Ci in REW sharply increased, approaching the values in IRR. A small increase in Ci values was also observed in DRY, probably due to proximate irrigated plots. Afterwards, Ci decreased in all water regimes, but in REW, it never dropped to the levels of DRY.
Values of Ci on two dates (June 23 and July 11) differed in ANOVA with water regime, genotype, or their interaction. In the earliest measurement, the values in DRY were significantly lower than those in REW and IRR. At that time, no effect of genotype was ascertained. Later (July 11), the effect of the water regime remained significant, with the significantly lowest values measured in DRY, but Ci also changed with genotype, with the highest and the lowest Ci measured respectively in ‘Custonaci’ and ‘Vulcano’. The two factors significantly interacted with Ci only in the first measurement (I × G, p < 0.01) (Figure 14).

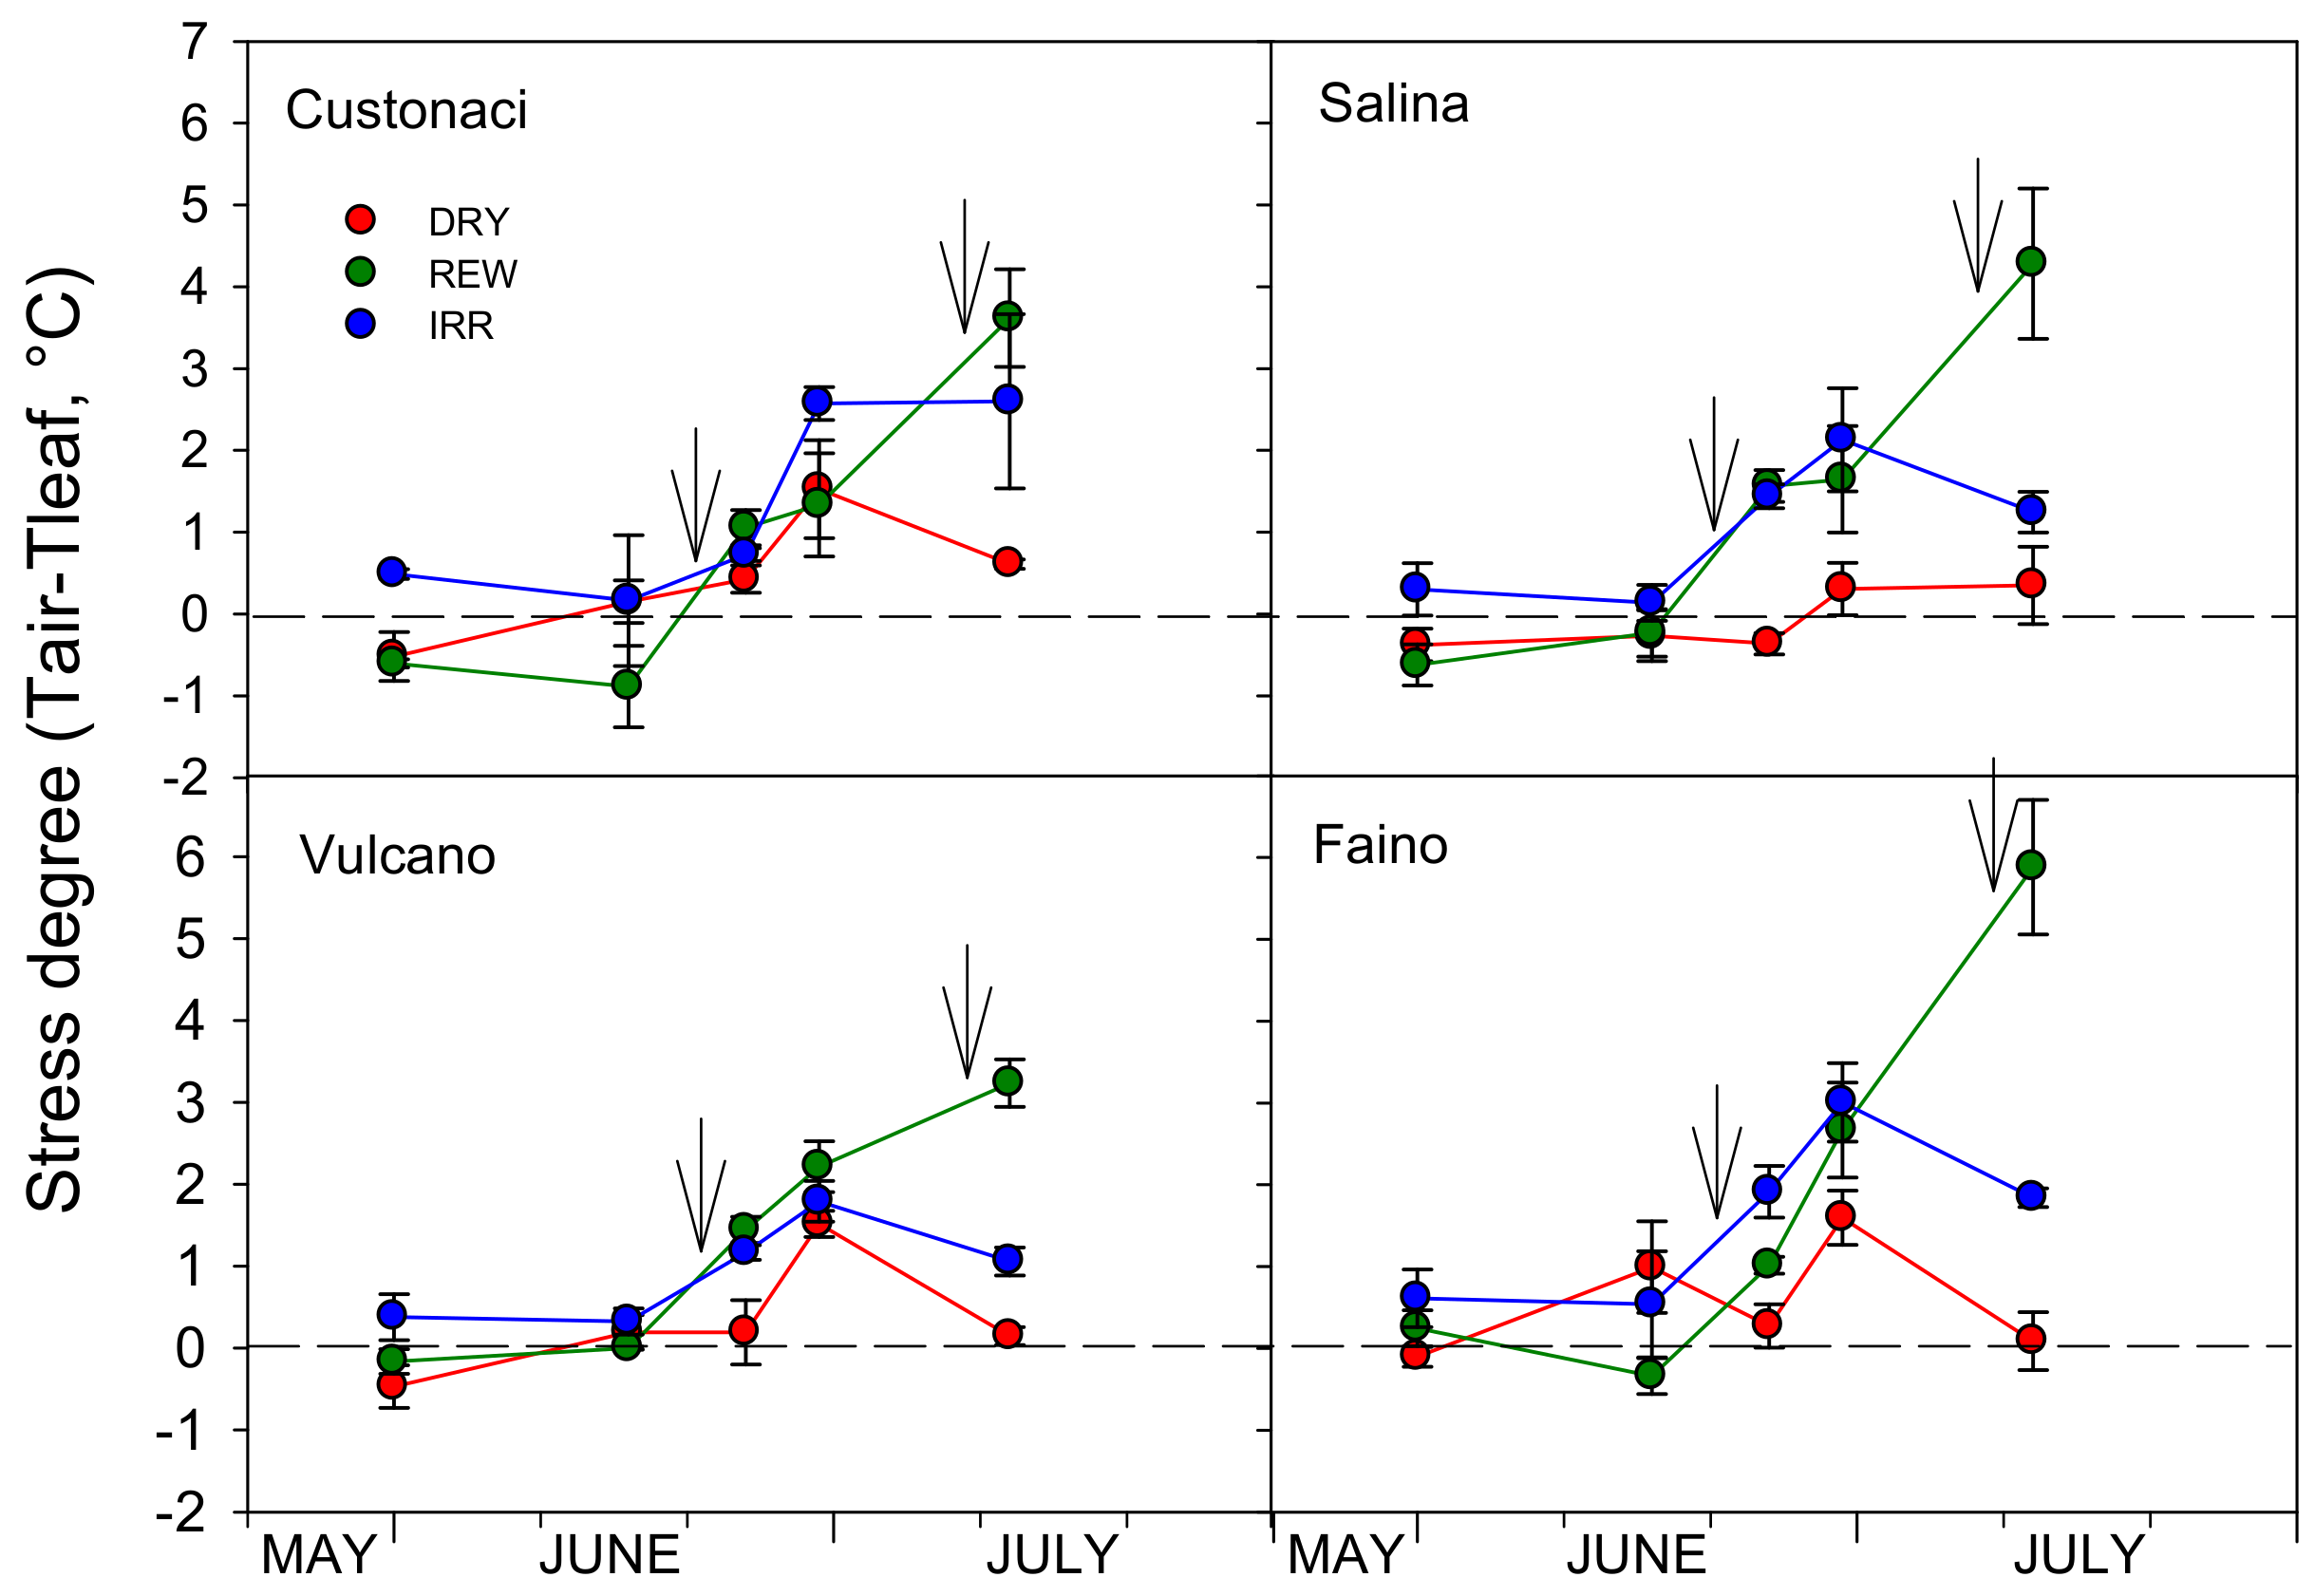
3.3.7. Stress Degree (Ta-Tl)

The difference between air temperature (Ta) and leaf temperature (Tl), both measured by means of a portable photosynthesis system, was used in this study as an indicator of the level of water stress in the plant (the higher the difference, the lower the stress, and the better the water status of the plant). Except in a few cases, stress degrees kept positive values throughout the growing season, indicating that leaf temperature never dropped below that of the air (Figure 15). Only the local ‘Salina’ suffered for stress degrees in DRY, with negative values recorded until mid-June.
Water regime (I), but not cultivar (C), significantly affected the stress degrees in both measurements, with lower values (higher stress) in DRY than in IRR and REW. Significant ‘I × G’ (p < 0.001) on stress degrees were found in late June but not in July (Figure 16).

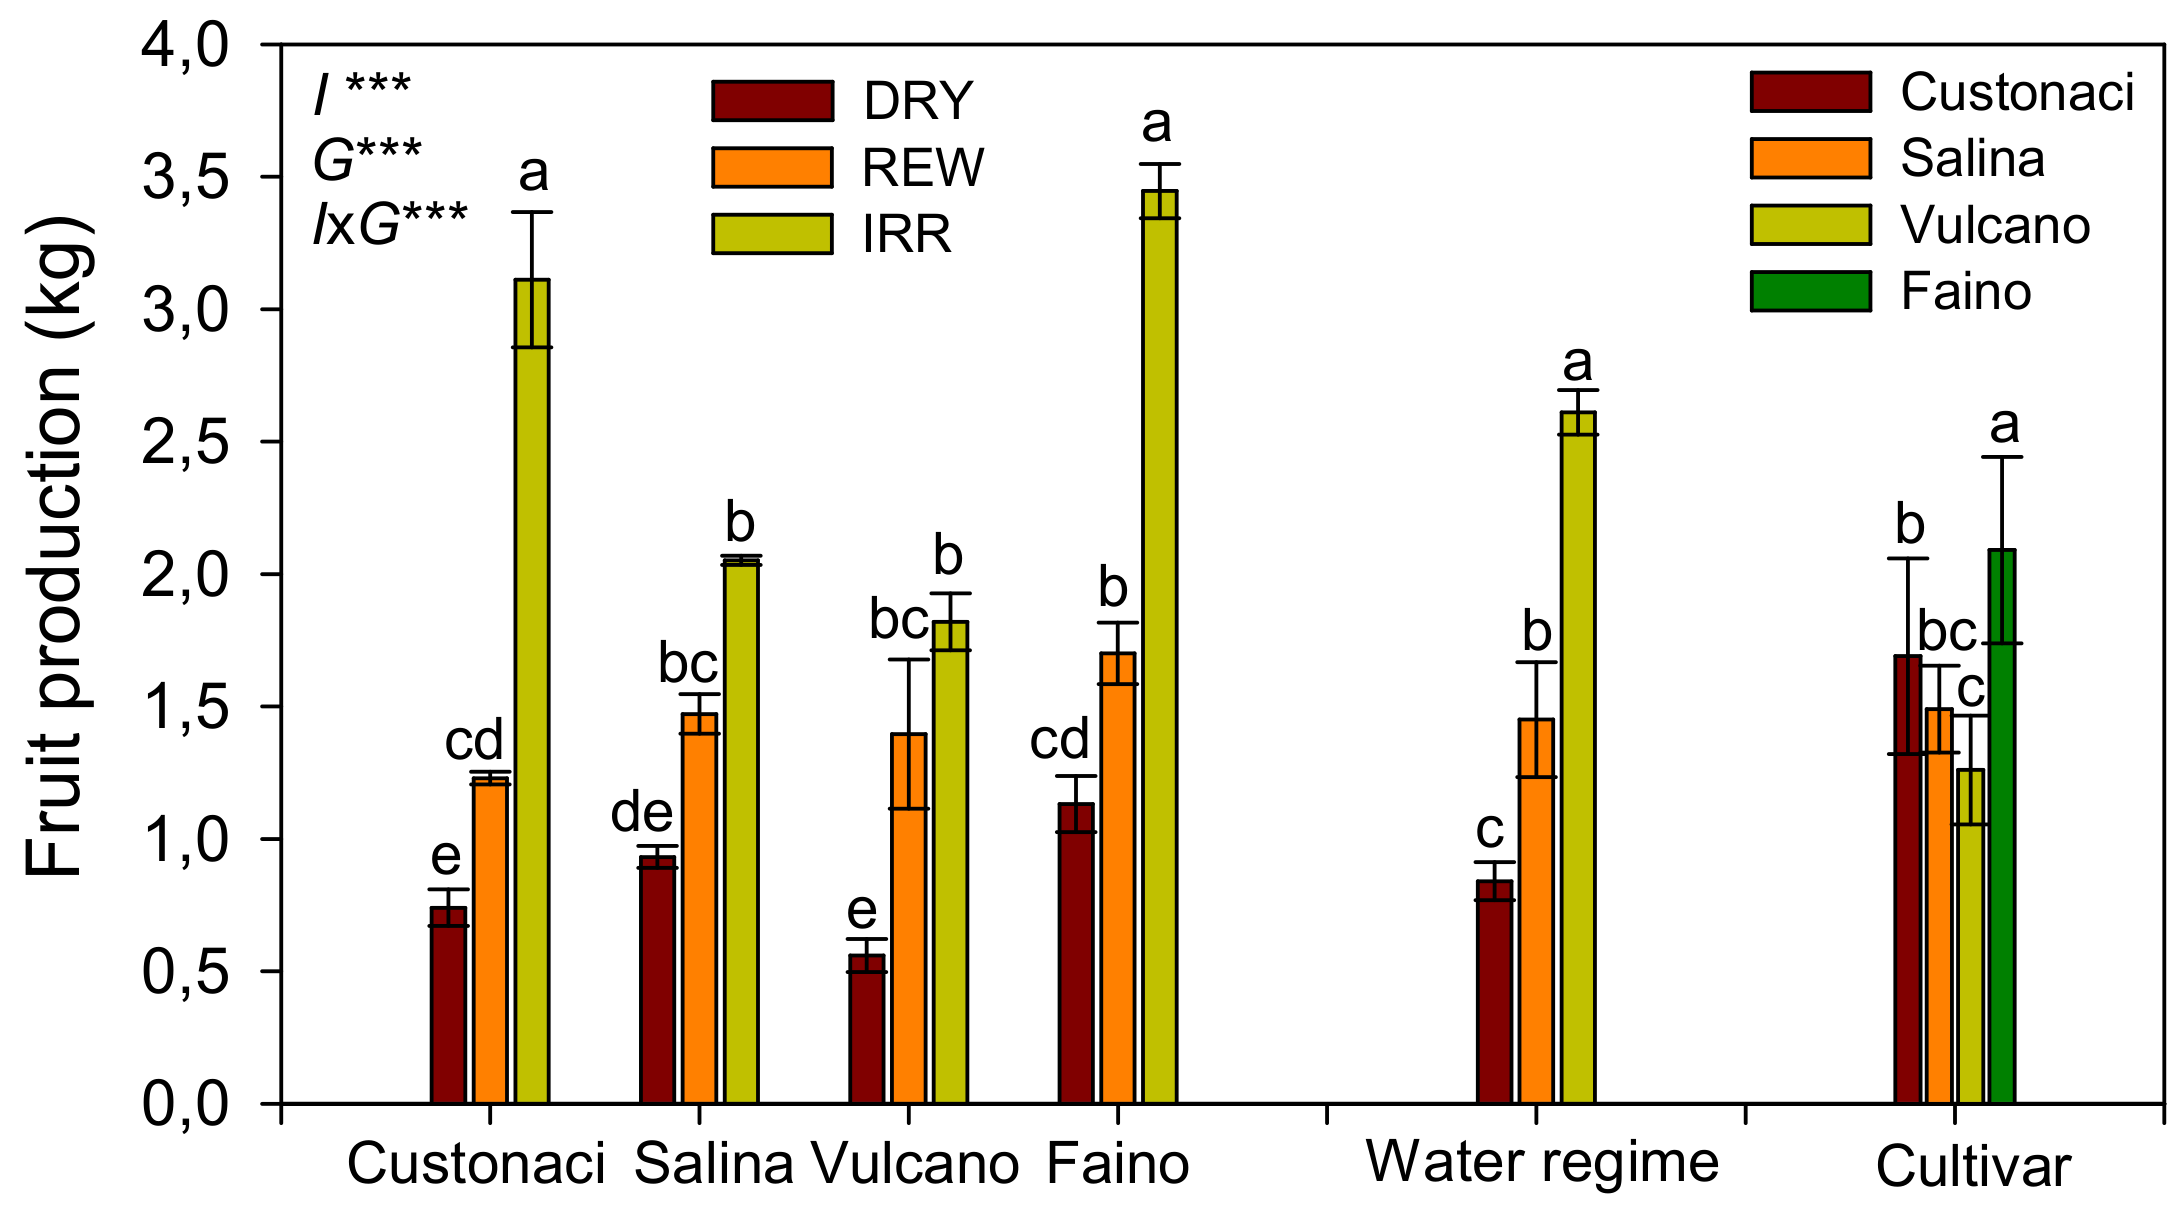
3.4. Fruit Production

Fruit production significantly varied with water regime, cultivar, and their interaction (p < 0.001). As expected, all cultivars produced more when fully irrigated (IRR) (Figure 17). However, irrigation after a long period of drought (REW) significantly promoted plant productivity compared with the unirrigated control. Among cultivars, the most productive was the commercial ‘Faino’ (2 kg plant−1, on average). Among local landraces, an average fruit production > 1.6 kg was measured in ‘Custonaci’. Significant ‘I × G’ indicated a different genetic response to irrigation in terms of productivity. Indeed, plants of the two local ‘Salina’ and ‘Vulcano’ did not much benefit from unrestricted irrigation (IRR), and when fully irrigated, they produced respectively 39 and 30% more than when rewatered (against a +103% measured in the control ‘Faino’).

3.5. Quality Traits

Tomato quality was greatly affected by the water regime and cultivar. All tomatoes exhibited higher TS and SS when unirrigated (I, p < 0.001) (Table 3). Rewatering reduced both TS and SS; however, under this water regime, they remained significantly higher (+19 and +7%, respectively) than those in IRR. Local tomatoes had higher TS and SS than the commercial genotype (G, p < 0.001). Significant ‘I × G’ (p < 0.001) for SS indicated a different effect of the water regime depending on the cultivar (Figure 18). Indeed, the depressive action of frequent irrigation on this trait was more relevant in commercial control.
Reducing sugars content (RS) was significantly higher under dry conditions (DRY). Few irrigations in REW caused significant reductions in RS to the levels of well-watered plants (IRR). Fruits from all local landraces were sweeter (RS approaching 5 mg 100 g−1) than those of the control (G, p < 0.01).
Water regime also affected the content of vitamin C (I, p < 0.001), which was greater in fruits of plants not irrigated or rehydrated (26 and 18% higher than in IRR, respectively). Among the genotypes, long shelf-life tomatoes ‘Salina’ and ‘Vulcano’ were richer than commercial ‘Faino’.
TP were maximised under no irrigation (I, p < 0.001). As for RS, rewatering adversely affected the TP content, which was depressed to the levels of IRR. TP in all local tomatoes were significantly higher (>57 mg GAE 100 g−1) than those in the commercial control. Among them, ‘Vulcano’ exhibited the highest content (+29% than ‘Faino’). Significant ‘I × G’ (p < 0.05) for TP indicated a different genetic response to irrigation, with the water regime having a minor effect on this trait in ‘Custonaci’ and ‘Salina’ (Figure 19).

3.6. Pearson’s Correlation among Physiological and Quality Traits

Pearson’s correlation test was carried out to study the correlations among fruit production, crop physiology, and fruit quality in tomatoes (Table 4). Pn, E, and gs were positively correlated with most physiological traits and negatively correlated with most of quality traits. As expected, fruit production (FP) was positively correlated with Pn (p < 0.05). Similar but stronger correlations (p < 0.001) were found between FP and RWC, indicating that a better water status of plants led to greater fruit production. Neither Ci nor WUEi was correlated with FP. Overall, the better the plant water status, the worse the fruit quality, as indicated by the negative correlations among physiological traits (Pn, E, gs, and RWC) and fruit quality traits (TS, SS, RS, AscA, and TP). The negative correlation between TP and fruit production per plant also indicates that total phenols tended to decrease as fruit production increased.

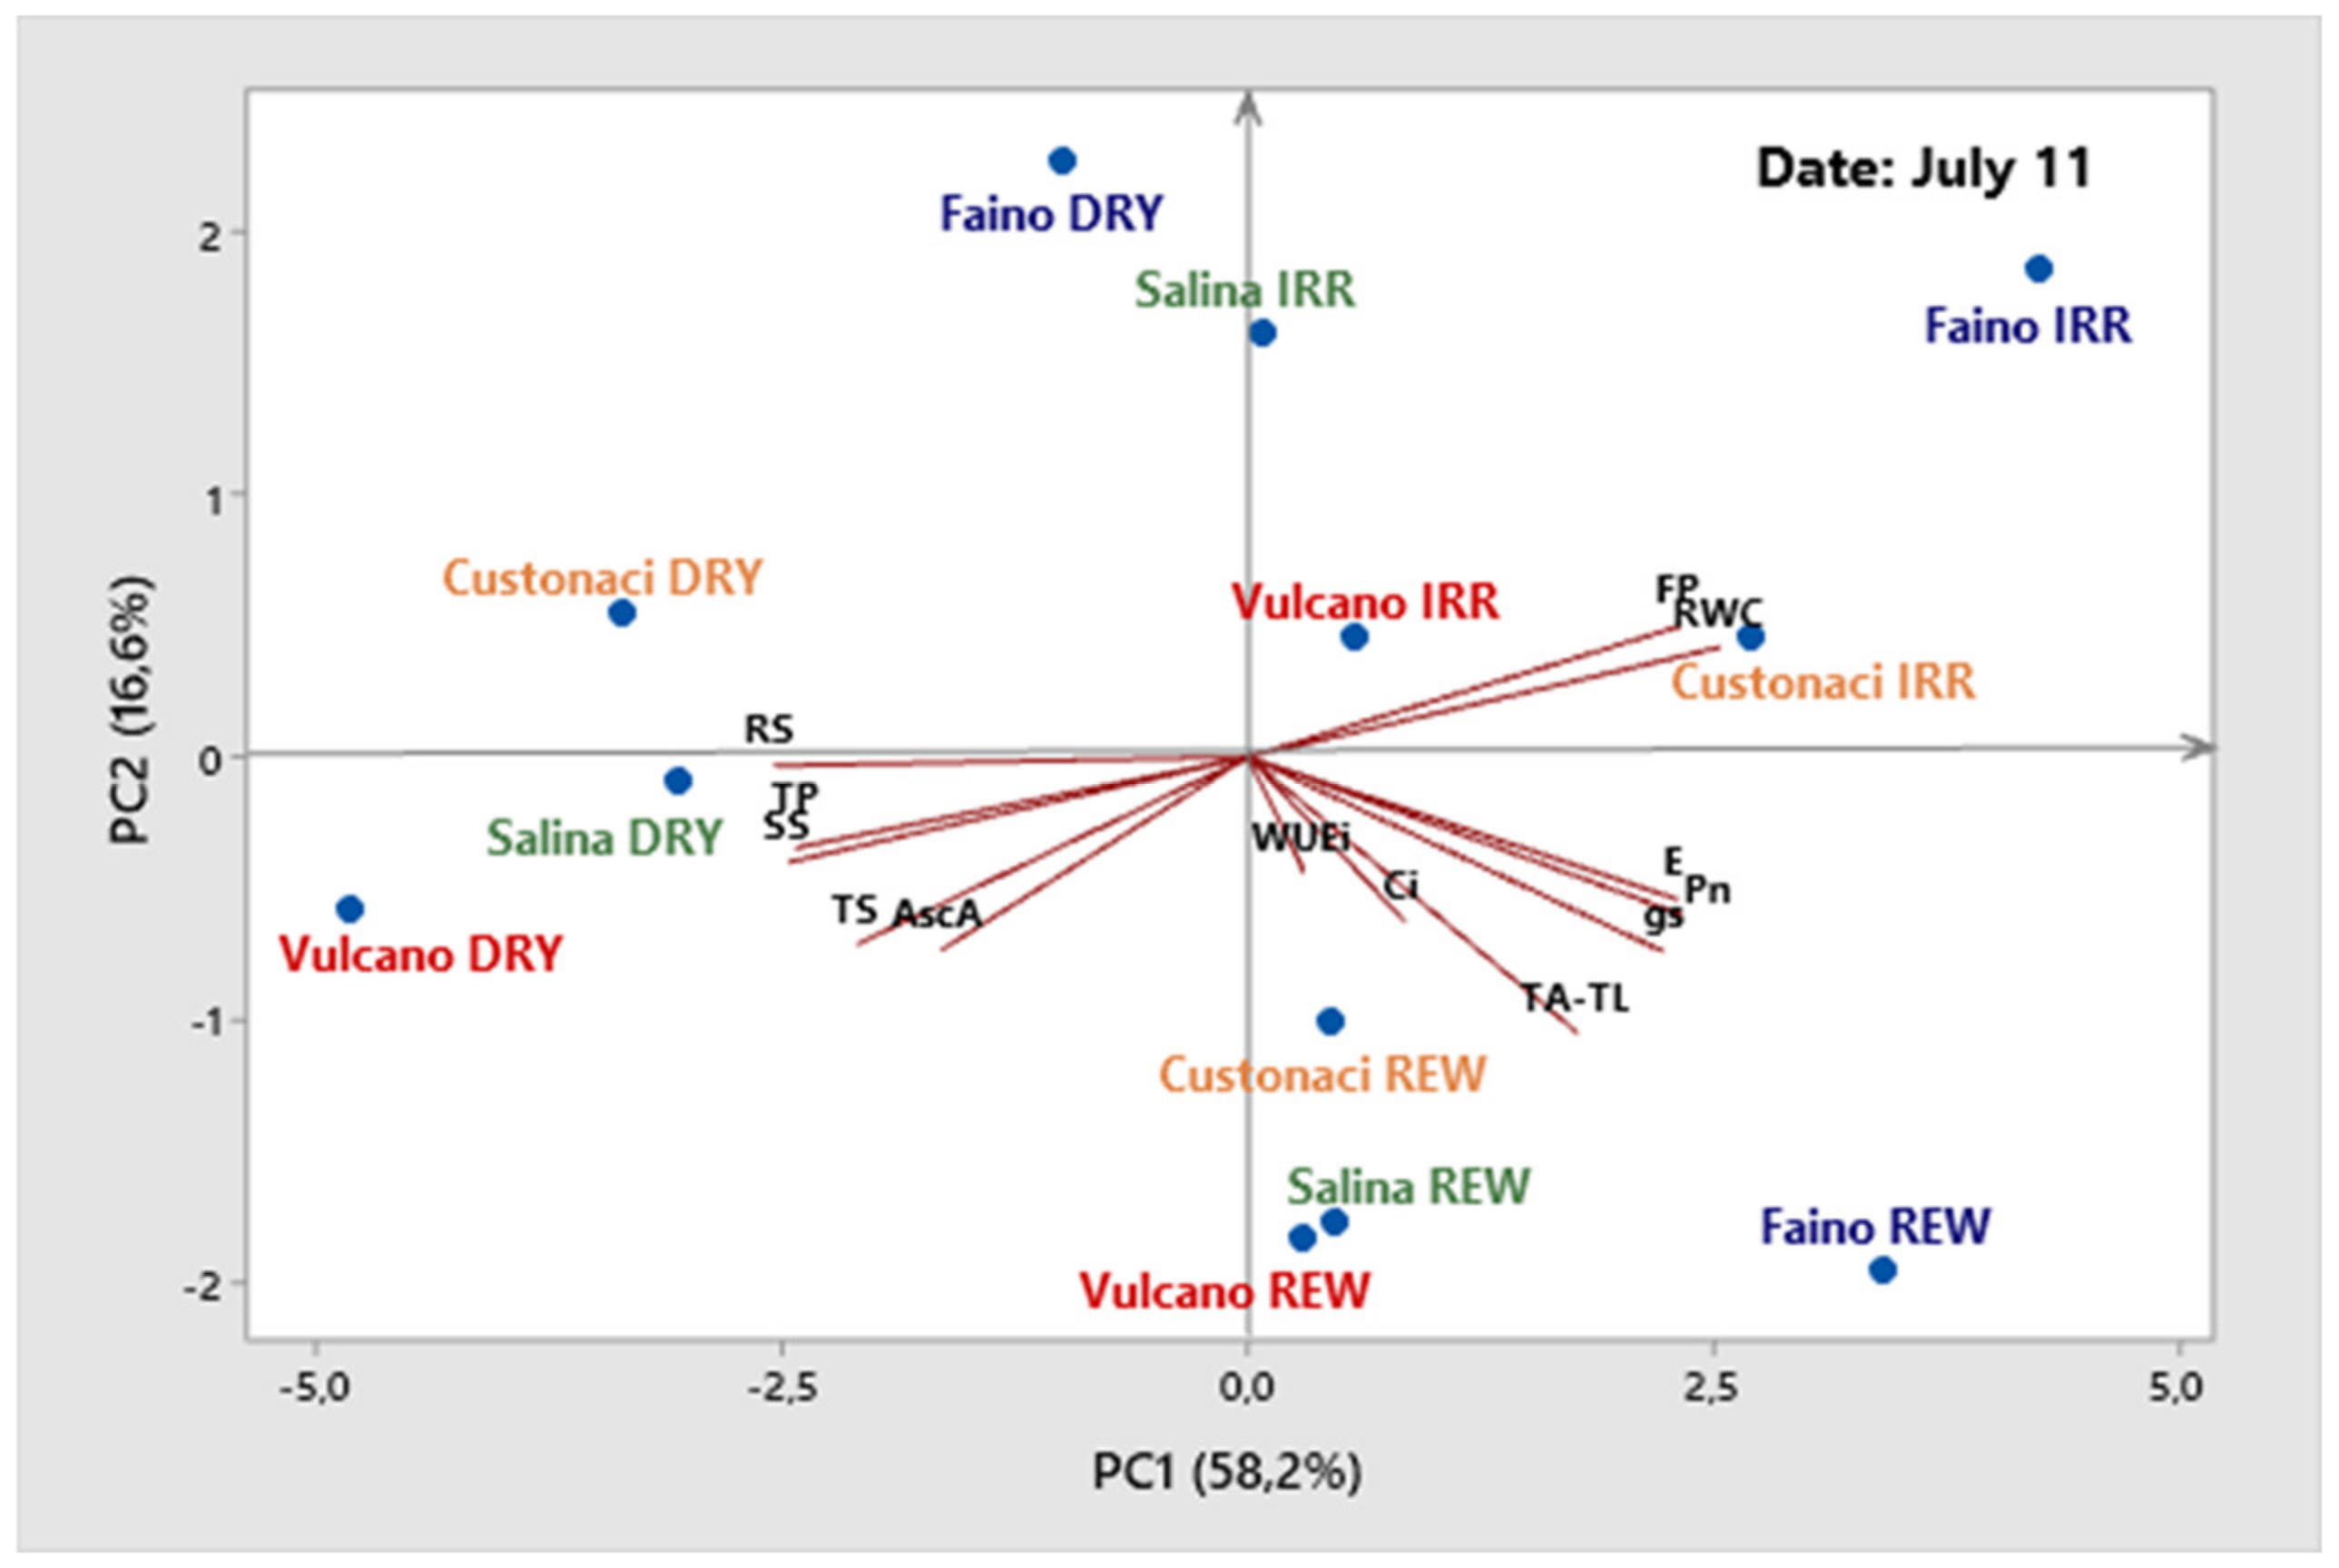
3.7. Principal Component Analysis of (PCA)

Principal Component Analysis (PCA) was conducted to highlight existing clusters within cultivars and water regimes according to physiological, productivity, and quality traits. To this end, the physiological measurement dataset of July 11 was used. PCA identified two factors (PC1 and PC2) accounting for 74.8% of the total variance. These two factors were used for score plots (Figure 20).
The first component (PC1) includes the variability for fruit production (FP) and relative water content (RWC), as well as for most of the quality traits (total solids, soluble solids, vitamin C, and total phenols). The second component (PC2) includes the variability for all physiological traits, excluding RWC.
The score plot analysis provided information on the changes in physiological and fruit quality traits in tomatoes in relation to cultivar and water regime. All cultivars in IRR clustered into a group in the upper quadrant on the right, which included FP and RWC. All cultivars in REW clustered in the lower quadrant on the right, which included all physiological traits. Both ‘Vulcano’ and ‘Salina’ in DRY clustered into a third group in the lower quadrant on the left, which included all quality traits. A fourth group, in the upper quadrant on the left with the DRY treatments of ‘Custonaci’ and ‘Faino’, clustered with none of the traits considered.

4. Discussion

In this study, the effects of drought conditions on plant physiology, fruit production, and some quality traits of fruits were examined in three local landraces of long shelf-life tomatoes originating from Sicily (South Italy) and compared with a commercial hybrid of mini-plum tomato. Drought conditions were induced by no irrigation imposed after transplant (DRY treatment) or by rewatering after long periods of drought (REW treatment). A fully irrigated treatment (IRR) was used as the control.
Overall, the effects of irrigation treatments on physiological traits were more pronounced than those of the genotype. The net assimilation rate (Pn) remained quite high during the growing season up to late June, even in unirrigated plants. These findings indicate that prolonged severe soil water deficit does not cause permanent damage to the plant photosynthetic system. Similarly, Patanè et al. [23], working on several landraces of long shelf-life tomatoes, observed that plants can maintain good levels of leaf gas exchange, even at soil water content below the wilting point. Similar findings were also reported by Guida et al. [24] in long shelf-life tomatoes grown under rainfed or full irrigation. Moreover, in the present study, photosynthesis was stimulated immediately after rehydration in REW. According to Xu et al. [12], the magnitude of this recovery due to rewatering depended on the tomato genotype, being greater in the two local ‘Vulcano’ and ‘Salina’.
Leaf transpiration (E) in unirrigated plants was kept quite constant throughout the growing season in all genotypes, even when soil water content approached the wilting point. It has been reported that, overall, under open-field conditions, tomatoes can survive prolonged periods of low soil water content [25]. Moreover, E and gs in plants of long shelf-life tomatoes rewatered approached the levels of those fully irrigated, and these levels were maintained until the end of the growing season. These results demonstrate the high capacity of these tomatoes to adapt to long-lasting drought following rehydration.
Relative water content (RWC) is considered a reliable indicator of plant water status [23]. Cultivars able to retain more water (higher RWC) during soil water content depletion are more tolerant to drought stress than those with low RWC [26,27]. However, the capacity to maintain normal physiological functions (e.g., normal E) at low RWC may represent a strategy for coping with stress [26]. Indeed, in this study, late in the growing season (July 11), when the rise of air temperatures emphasised the differences in leaf transpiration among genotypes, all local landraces exhibited the same levels of E but significantly lower levels of RWC than the commercial ‘Faino’. Interestingly, Zhang et al. [27], in their study with two cultivars of wheat, one sensitive and one tolerant to water stress, observed that RWC decreased and H2O2, a reactive oxygen species (ROS), and SOD and POD, two antioxidant enzymes which mediate the degradation of the membrane components in the cells [28], increased during the whole period of water withholding, to a lesser extent in the tolerant cultivar. After rewatering, RWC increased, but to a greater extent in the sensitive cultivar, together with the antioxidant enzymes. Differently, in the tolerant cultivar, the levels of RWC, SOD, and CAT after rewatering remained quite stable. In this sense, fluctuations in RWC levels may provide information on the water stress sensitivity or resistance of a given cultivar. In this study, commercial ‘Faino’ exhibited the highest levels of RWC, irrespective of the water regime. High RWC in this genotype but the same E levels of local landraces may indicate low water use efficiency in this hybrid.
The ability to recover from severe drought after rewatering in plants is generally associated with the synthesis of osmoregulators in leaves, such as proline, which are produced in stressed plants to maintain adequate cell turgidity and mitigate oxidative damage due to stress [29,30]. In a previous experiment conducted with the same tomatoes, strict positive correlations were found between proline content in leaves and soil water deficit in local landraces but not in the commercial hybrid, suggesting the occurrence of osmotic adjustment through an increased synthesis of proline in these landraces in response to drought conditions [18]. In a second experiment, an inverse relationship of RWC vs. proline, changing from linear to exponential due to greater osmoregulation at reduced soil water potentials, was described in long-shelf-life tomatoes cultivated in the same semi-arid environment as in the present study [23].
Instantaneous water efficiency (WUEi), as calculated by Pn and E, was higher in water-stressed plants (DRY and REW) than in those continuously well irrigated until the onset of the ripening stage (mid-June), but afterward it dropped in all water regimes. Indeed, at high levels of soil water deficit, stomata close and leaf transpiration (E) decreases, while WUEi increases. Similar higher values of WUEi in plants exposed to water stress than those fully irrigated were reported by Galmés et al. [31] in a long-storage cultivar of tomato from the Balearic Islands as a response of plants to soil water deficit. Interestingly, under severe water stress conditions (DRY), the local ‘Vulcano’ exhibited low RWC, as an adaptive mechanism to drought [23] and high WUEi in the last measurement (July 11), differently than the hybrid ‘Faino’ that, under the same soil water conditions, had high RWC but low WUEi. These patterns indicate that ‘Vulcano’ used the low leaf water content for carbon assimilation more efficiently than ‘Faino’. In a previous experiment on the same local tomato landraces, differently than a commercial hybrid used as control, quite stable levels of malondialdehyde (MDA), were measured even under no irrigation, revealing a great tolerance to oxidative stress in these landraces [18]. As well known, MDA is a product of lipid peroxidation, which is overproduced when cell damage occurs in plants exposed to water stress [32]. However, high values of WUEi do not imply high fruit production, as revealed by the lack of correlation between the two traits. Similar results were reported by Patanè et al. [23], who studied several landraces of long shelf-life tomatoes under rainfed conditions.
Intercellular CO2 (Ci) plays an important role in regulating Pn through its effect in determining the CO2 concentration gradient with the atmosphere [33]. In tomatoes grown under greenhouse conditions, it has been observed that when water stress was mild, Ci was reduced because partial stomata closure occurred; as a result, Pn decreased. When water stress became moderate or severe, Ci increased again to values close to those of ambient CO2, but Pn further decreased. Indeed, at high levels of water stress, the decrease in net photosynthetic rate is not associated with stomata limitation, but it results from photosystem damage [34]. Similar observations were made in the present experiment late in the growing season, when Ci in DRY even raised again, but Pn dropped in all tomatoes except ‘Vulcano’ where Ci decreased together with Pn. This last result could reveal that, unlike in the other tomatoes, the Pn decrease in ‘Vulcano’ is associated with partial stomata closure rather than photosystem damage.
Local landraces of long-storage tomatoes are traditionally cultivated under no irrigation [18]. Under these soil water conditions, they achieve excellent taste and quality [35] but maintain low levels of productivity. Few water applications (rewaterings) after long-lasting periods of drought, when soil water content approached or dropped below the wilting point, alleviated the negative impact of prolonged water stress on productivity, significantly boosting plant productivity over unirrigated plants, to a greater extent in local landraces (up to +150% production increase in ‘Vulcano’). Different responses to rewatering have also been reported in the literature for both local and commercial tomatoes [11,18].
Interestingly, the two local landraces, ‘Salina’ and ‘Vulcano’, when rewatered matched the production levels of the commercial hybrid, but under continuous full irrigation, they did not further improve their productivity, keeping the same production levels as when rewatered. In this sense, full irrigation of these two landraces would lead to a waste of water, inducing, at the same time, a decline in fruit quality. Moreover, rewatering is a good option in irrigation management for these two long-shelf tomatoes, since it leads to a good compromise between fruit production and quality, saving a great amount of irrigation water and energy. Previous studies on tomatoes under irrigation at reduced rates (50% ETc restoration for the whole growth season) revealed the promoting effects of deficit irrigation on fruit yield and water saving [9]. In our study, REW led to productions comparable to those in fully irrigated plants (100% ETc restoration), but the economic benefit in terms of water saving (approx. 61% in this study) was even higher than a potential 50% ETc restoration.
According to most of the literature on tomatoes grown under different water regimes [17,36,37], fruit quality was maximised under long-lasting drought and minimised under no water limitation. Total solids and soluble solids were significantly higher in DRY basically since their concentrations were increased. A wide literature exists supporting these findings [24,38,39]. Indeed, the imposition of water stress has been suggested as a tool to improve fruit quality in tomatoes [40]. The contents of TS and SS were not compromised by repeated cycles of dehydration/rehydration (REW) and remained higher than those in well-watered fruits.
Sugars, vitamin C, and total phenols also reached maximum levels under no irrigation. However, sugars in REW were reduced to the same levels as those in IRR, basically since the last irrigation in REW was made approximately ten days before harvest, when fruits were at the turning stage; thus, fruit sugars became less concentrated.
In contrast to RS, irrigation at the onset of the ripening stage, after a long period of drought, did not alter the content of vitamin C with respect to DRY. These results confirm the beneficial effect of long-lasting water shortage on ascorbic acid content, which has been widely reported in the literature [17,37,41], even if it is interrupted by irrigation. In turn, it is reasonable to believe that a wider canopy developed in well-watered plants, which led to greater fruit shading during ripening, may have depressed the synthesis of ascorbate acid that, as well known, requires high levels of irradiance [42]. Indeed, previous studies on tomatoes, where a higher leaf area index was found to be negatively associated with ascorbic acid content, support this assumption [24]. Contrary to what was expected, few irrigations in REW did not ameliorate the content of total phenols with respect to continuous full irrigation. These results do not match those of Patanè et al. [16], who reported enhanced phenol content in tomatoes s
Subjected to rewatering in an open-field. Indeed, unlike vitamin C, the content of phenols in tomatoes is affected by the spectral quality of solar UV radiation rather than irradiance [43].
All local tomatoes exhibited better organoleptic quality than the commercial hybrid. These results confirm the superiority of these local landraces of tomatoes in terms of sugars and total and soluble solids, as already reported in the literature [13]. Similarly, an overall higher vitamin C (except for ‘Custonaci’) and phenol content than the control ‘Faino’ revealed a better nutritional quality of fruits in these landraces at all water regimes, as also reported in the literature [13,44]. An adaptive mechanism developed by these landraces, traditionally cultivated under no irrigation in response to unfavourable conditions, may be responsible for the greater amounts of phenols in long shelf-life tomatoes than in commercial varieties. Indeed, during water stress, plants generally synthesise secondary metabolites such as polyphenols to alleviate the oxidative damage caused by stress [45]. The two local ‘Custonaci’ and ‘Salina’ exhibited low responsiveness to irrigation in terms of phenols, maintaining the same levels of these secondary metabolites at all water regimes.
Correlations were found between all traits. RWC was positively correlated with E and gs, indicating that E and gs increased proportionally with the degree of leaf hydration. Interestingly, the E levels in July were similar (in DRY) or even higher (in REW and IRR) than those measured in June, despite the lower RWC. This pattern may be ascribed to an adaptive mechanism to soil water deficit in tomatoes that allows plants to maintain high turgor even at low RWC, allowing E to proceed at high rates. As mentioned above, osmotic adjustment is reported in the literature for tomatoes through the accumulation of osmolites, such as proline, that decrease the osmotic potential of cells, increasing the gradient for water influx while keeping stomata open even at low RWC [46].
Ultimately, PCA analysis allowed to identify two main components that accounted for the most part of the total variability of the dataset. Moreover, four groups were identified, having distinct traits. Among these, the most relevant groups included the two local tomatoes ‘Vulcano’ and ‘Salina’, for all quality traits, and all cultivars under rewatering, for physiological traits. A third group of low interest was clustered with none of the traits considered, indicating low productivity potential, low gas exchange, low leaf hydration capacity, and low fruit quality. This last group included the dry treatment of the landrace ‘Custonaci’ and the commercial control, indicating that unlike local ‘Vulcano’ and ‘Salina’ they do not adapt to severe soil water deficiency.

5. Conclusions

Global warming is a major concern in human activities, and the adoption of more appropriate plants/cultivars and/or more appropriate water stress management may help farmers face such a growing concern. The resumption of physiological processes after rehydration following drought is evidenced in the long shelf-life tomatoes ‘Vulcano’ and ‘Salina’, in addition to their ability to maintain high levels of leaf transpiration after rehydration, denoting their great adaptation to progressive post-rewatering soil drying up. In this regard, these two landraces may be included as gene sources in breeding programmes for water stress tolerance in both fresh market and processing tomatoes.
The results of this study also revealed that a water-saving irrigation strategy, where few irrigations are applied after prolonged periods of drought, may be profitable in terms of fruit production enhancement in long shelf-life tomatoes in semi-arid climates, considering their low-yielding trait under rainfed conditions, which is the traditional method of cultivation of these tomatoes. Local landraces are appreciated by consumers mainly for the taste and nutritional quality of fruits, and this study demonstrated that limited rewaterings, in most cases, help retain high levels of these quality traits. This aspect is an important goal in the cultivation of long shelf-life tomatoes in the semi-arid climate of Southern Italy if we consider the increasing interest of consumers towards healthy food.

Author Contributions

Conceptualisation, C.P. and S.L.C. Data curation, C.P., V.C., and S.A.C.; Formal analysis, C.P., S.S., and S.A.C.; Investigation, C.P. and S.S. Methodology, C.P., S.S., and S.A.C. Software, C.P., and S.L.C. Validation, C.P. Writing—original draft, C.P. and V.C.; Writing—review and editing, S.L.C., V.C., and S.A.C. All authors have read and agreed to the published version of the manuscript.

Funding

This research received no external funding.

Data Availability Statement

The original contributions presented in the study are included in the article, further inquiries can be directed to the corresponding author.

Acknowledgments

Authors are grateful to Alessandra Pellegrino, CNR-Institute of BioEconomy (IBE), Catania (Italy), for her technical assistance in the laboratory.

Conflicts of Interest

The authors declare no conflicts of interest.

References

  1. Pope, J.O.; Brown, K.; Fung, F.; Hanlon, H.M.; Neal, R.; Palin, E.J.; Reid, A. Investigation of future climate change over the British Isles using weather patterns. Clim. Dyn. 2022, 58, 2405–2419. [Google Scholar] [CrossRef]
  2. Bibi, F.; Rahman, A. An overview of climate change impacts on agriculture and their mitigation strategies. Agriculture 2023, 13, 1508. [Google Scholar] [CrossRef]
  3. Straffelini, E.; Tarolli, P. Climate change-induced aridity is affecting agriculture in Northeast Italy. Agric. Syst. 2023, 208, 103647. [Google Scholar] [CrossRef]
  4. UN General Assembly. Transforming Our World: The 2030 Agenda for Sustainable Development. A/RES/70/1, 21 October 2015. Available online: https://www.refworld.org/legal/resolution/unga/2015/en/111816 (accessed on 3 July 2024).
  5. Kyoi, S.; Mori, K.; Matsushita, K. Solution of trade-offs between food production, water use, and climate change mitigation in global agriculture. Sustain. Dev. 2024, 32, 2314–2324. [Google Scholar] [CrossRef]
  6. Upadhyaya, H.; Panda, S.K.; Dutta, B.K. Variation of physiological and antioxidative responses in tea cultivars subjected to elevated water stress followed by rehydration recovery. Acta Physiol. Plant. 2008, 30, 457–468. [Google Scholar] [CrossRef]
  7. Hao, S.; Cao, H.; Wang, H.; Pan, X. The physiological responses of tomato to water stress and re-water in different growth periods. Sci. Hortic. 2019, 249, 143–154. [Google Scholar] [CrossRef]
  8. Pereira, L.S.; Oweis, T.; Zairi, A. Irrigation management under water scarcity. Agric. Water Manag. 2002, 57, 175–206. [Google Scholar] [CrossRef]
  9. Patanè, C.; Saita, A. Biomass, fruit yield, water productivity and quality response of processing tomato to plant density and deficit irrigation under a semi-arid Mediterranean climate. Crop Pasture Sci. 2015, 66, 224–234. [Google Scholar] [CrossRef]
  10. Xu, J.; Wan, W.; Zhu, X.; Zhao, Y.; Chai, Y.; Guan, S.; Diao, M. Effect of regulated deficit irrigation on the growth, yield, and irrigation water productivity of processing tomatoes under drip irrigation and mulching. Agronomy 2023, 13, 2862. [Google Scholar] [CrossRef]
  11. Giorio, P.; Guida, G.; Mistretta, C.; Sellami, M.H.; Oliva, M.; Punzo, P.; Iovieno, P.; Arena, C.; De Maio, A.; Grillo, S.; et al. Physiological, biochemical and molecular responses to water stress and rehydration in Mediterranean adapted tomato landraces. Plant Biol. 2018, 20, 995–1004. [Google Scholar] [CrossRef]
  12. Xu, Z.; Zhou, G.; Shimizu, H. Plant responses to drought and rewatering. Plant Signal. Behav. 2010, 5, 649–654. [Google Scholar] [CrossRef] [PubMed]
  13. Patanè, C.; Malvuccio, A.; Saita, A.; Rizzarelli, P.; Siracusa, L.; Rizzo, V.; Muratore, G. Nutritional changes during storage in fresh-cut long storage tomato as affected by biocompostable polylactide and cellulose based packaging. LWT 2019, 101, 618–624. [Google Scholar] [CrossRef]
  14. Siracusa, L.; Avola, G.; Patanè, C.; Riggi, E.; Ruberto, G. Re-evaluation of traditional Mediterranean foods. The local landraces of ‘Cipolla di Giarratana’ (Allium cepa L.) and long-storage tomato (Lycopersicon esculentum L.): Quality traits and polyphenol content. J. Sci. Food Agric. 2013, 93, 3512–3519. [Google Scholar] [CrossRef] [PubMed]
  15. Conesa, M.A.; Fullana-Pericàs, M.; Granell, A.; Galmés, J. Mediterranean long shelf-life landraces: An untapped genetic resource for tomato improvement. Front. Plant Sci. 2020, 10, 1651. [Google Scholar] [CrossRef] [PubMed]
  16. Patanè, C.; Siah, S.; Pellegrino, A.; Cosentino, S.L.; Siracusa, L. Fruit yield, polyphenols, and carotenoids in long shelf-life tomatoes in response to drought stress and rewatering. Agronomy 2021, 11, 1943. [Google Scholar] [CrossRef]
  17. Patanè, C.; Tringali, S.; Sortino, O. Effects of deficit irrigation on biomass, yield, water productivity and fruit quality of processing tomato under semi-arid Mediterranean climate conditions. Sci. Hortic. 2011, 129, 590–596. [Google Scholar] [CrossRef]
  18. Patanè, C.; Cosentino, S.L.; Romano, D.; Toscano, S. Relative water content, proline, and antioxidant enzymes in leaves of long shelf-life tomatoes under drought stress and rewatering. Plants 2022, 11, 3045. [Google Scholar] [CrossRef]
  19. Yan, M.; Lian, H.; Zhang, C.; Chen, Y.; Cai, H.; Zhang, S. The role of root size and root efficiency in grain production, and water-and nitrogen-use efficiency in wheat. J. Sci. Food Agric. 2023, 103, 7083–7094. [Google Scholar] [CrossRef]
  20. Idso, S.B.; Jackson, R.D.; Pinter, P.J.; Reginato, R.J.; Hatfield, J.L. Normalizing the stress-degree-day parameter for environmental variability. Agric. Meteorol. 1981, 24, 45–55. [Google Scholar] [CrossRef]
  21. Bailey, M.J.; Biely, P.; Poutanen, K. Interlaboratory testing of methods for assay of xylanase activity. J. Biotech. 1992, 23, 257–270. [Google Scholar] [CrossRef]
  22. Singleton, V.L.; Orthofer, R.; Lamuela-Raventos, R.M. Analysis of total phenols and other oxidation substrates and antioxidants by means of Folin–Ciocalteu reagent. Meth. Enzymol. 1999, 299, 152–178. [Google Scholar]
  23. Patanè, C.; Scordia, D.; Testa, G.; Cosentino, S.L. Physiological screening for drought tolerance in Mediterranean long-storage tomato. Plant Sci. 2016, 249, 25–34. [Google Scholar] [CrossRef] [PubMed]
  24. Guida, G.; Houssemeddine Sellami, M.H.; Mistretta, C.; Oliva, M.; Buonomo, R.; De Mascellis, R.; Patanè, C.; Rouphael, Y.; Albrizio, R.; Giorio, P. Agronomical, physiological and fruit quality responses of two Italian long-storage tomato landraces under rain-fed and full irrigation conditions. Agric. Water Manag. 2017, 180, 126–135. [Google Scholar] [CrossRef]
  25. Patanè, C.; Cosentino, S.L. Effects of soil water deficit on yield and quality of processing tomato under a Mediterranean climate. Agric. Water Manag. 2010, 97, 131–138. [Google Scholar] [CrossRef]
  26. Blum, A. Drought resistance water-use efficiency, and yield potential-are theycompatible, dissonant, or mutually exclusive? Aust. J. Agric. Res. 2005, 56, 1159–1168. [Google Scholar] [CrossRef]
  27. Zhang, F.; Guo, J.K.; Yang, Y.L.; He, W.L.; Zhang, L.X. Changes in the pattern of antioxidant enzymes in wheat exposed to water deficit and rewatering. Acta Physiol. Plant. 2004, 26, 345–352. [Google Scholar] [CrossRef]
  28. Galić, V.; Mlinarić, S.; Marelja, M.; Zdunić, Z.; Brkić, A.; Mazur, M.; Begović, L.; Šimić, D. contrasting water withholding responses of young maize plants reveal link between lipid peroxidation and osmotic regulation corroborated by genetic analysis. Front Plant Sci. 2022, 6, 804630. [Google Scholar] [CrossRef]
  29. Hosseinifard, M.; Stefaniak, S.; Ghorbani Javid, M.; Soltani, E.; Wojtyla, Ł.; Garnczarska, M. Contribution of exogenous proline to abiotic stresses tolerance in plants: A review. Int. J. Mol. Sci. 2022, 23, 5186. [Google Scholar] [CrossRef]
  30. Raza, A.; Charagh, S.; Abbas, S.; Hassan, M.U.; Saeed, F.; Haider, S.; Sharif, R.; Anand, A.; Corpas, F.J.; Jin, W.; et al. Assessment of proline function in higher plants under extreme temperatures. Plant Biol. 2023, 25, 379–395. [Google Scholar]
  31. Galmés, J.; Conesa, M.A.; Ochogavía, J.M.; Perdomo, J.A.; Francis, D.M.; Ribas-carbó, M.; Savé, R.; Flexas, L.; Medrano, H.; Cifre, J. Physiological and morphological adaptations in relation to water use efficiency in Mediterranean accessions of Solanum lycopersicum. Plant Cell Environ. 2011, 34, 245–260. [Google Scholar] [CrossRef]
  32. Li, G.; Wan, S.; Zhou, J.; Yang, Z.; Qin, P. Leaf chlorophyll fluorescence, hyperspectral reflectance, pigments content, malondialdehyde and proline accumulation responses of castor bean (Ricinus communis L.) seedlings to salt stress levels. Ind. Crop Prod. 2010, 31, 13–19. [Google Scholar] [CrossRef]
  33. Sreeman, S.; Prasad, B.T.K.; Nataraj, K.N.; Shankar, A.G.; Ganesh, P.; Udayakumar, M. Ratio of intercellular CO2 concentration to stomatal conductance is a reflection of mesophyll efficiency. Current Sci. 1996, 70, 672–675. [Google Scholar]
  34. Yuan, X.K.; Yang, Z.Q.; Li, Y.X.; Liu, Q.; Han, W. Effects of different levels of water stress on leaf photosynthetic characteristics and antioxidant enzyme activities of greenhouse tomato. Photosynthetica 2016, 54, 28–39. [Google Scholar] [CrossRef]
  35. Patanè, C.; Pellegrino, A.; Saita, A.; Siracusa, L.; Ruberto, G.; Barbagallo, R. Mediterranean long storage tomato as a source of novel products for the agrifood industry: Nutritional and technological traits. LWT 2017, 85, 445–448. [Google Scholar] [CrossRef]
  36. Kazemi, S.; Zakerin, A.; Abdossi, V.; Moradi, P. Fruit yield and quality of the grafted tomatoes under different drought stress conditions. Asian J. Agric. Biol. 2021, 1, 1–14. [Google Scholar] [CrossRef]
  37. Medyouni, I.; Zouaoui, R.; Rubio, E.; Serino, S.; Ahmed, H.B.; Bertin, N. Effects of water deficit on leaves and fruit quality during the development period in tomato plant. Food Sci. Nutr. 2021, 9, 1949–1960. [Google Scholar] [CrossRef]
  38. Marín, A.; Rubio, J.S.; Martínez, V.; Gil, M.I. Antioxidant compounds in green and red peppers as affected by irrigation frequency, salinity and nutrient solution composition. J. Agric. Food Chem. 2009, 89, 1352–1359. [Google Scholar] [CrossRef]
  39. Nangare, D.D.; Singh, Y.; Kumar, P.S.; Minhas, P.S. Growth, fruit yield and quality of tomato (Lycopersicon esculentum Mill.) as affected by deficit irrigation regulated on phenological basis. Agric. Water Manag. 2016, 171, 73–79. [Google Scholar] [CrossRef]
  40. Jin, N.; Zhang, D.; Jin, L.; Wang, S.; Yang, X.; Lei, Y.; Meng, X.; Xu, Z.; Sun, J.; Lyu, J.; et al. Controlling water deficiency as an abiotic stress factor to improve tomato nutritional and flavour quality. Food Chem. 2023, 19, 100756. [Google Scholar] [CrossRef]
  41. Barbagallo, R.N.; Di Silvestro, I.; Patanè, C. Yield, physicochemical traits, antioxidant pattern, polyphenol oxidase activity and total visual quality of field-grown processing tomato cv. Brigade as affected by water stress in Mediterranean climate. J. Sci. Food Agric. 2013, 93, 1449–1457. [Google Scholar] [CrossRef]
  42. Ntagkas, N.; Woltering, E.; Nicole, C.; Labrie, C.; Marcelis, L.F.M. Light regulation of vitamin C in tomato fruit is mediated through photosynthesis. Environ. Exp. Bot. 2019, 158, 180–188. [Google Scholar] [CrossRef]
  43. Luthria, D.L.; Mukhopadhyay, S.; Krizek, D.T. Content of total phenolics and phenolic acids in tomato (Lycopersicon esculentum Mill.) fruits as influenced by cultivar and solar UV radiation. J. Food Compos. Anal. 2006, 19, 771–777. [Google Scholar] [CrossRef]
  44. Siracusa, L.; Patanè, C.; Rizzo, V.; Cosentino, S.L.; Ruberto, G. Targeted secondary metabolic and physico-chemical traits analysis to assess genetic variability within a germplasm collection of “long storage” tomatoes. Food Chem. 2018, 244, 275–283. [Google Scholar] [CrossRef] [PubMed]
  45. Sarker, U.; Oba, S. Response of nutrients, minerals, antioxidant leaf pigments, vitamins, polyphenol, flavonoid and antioxidant activity in selected vegetable amaranth under four soil water content. Food Chem. 2018, 252, 72–83. [Google Scholar] [CrossRef] [PubMed]
  46. Chatterjee, A.; Solankey, S.S. Functional physiology in drought tolerance of vegetable crops-An approach to mitigate climate change impact. In Climate Dynamics in Horticultural Science, Volume 1: The Principles and Applications; Chaudhary, M.L., Patel, V.B., Siddiqui, M.W., Mahdi, S.S., Eds.; CRC Press: Boca Raton, FL, USA, 2015; Chapter 9; pp. 150–171. [Google Scholar]
Figure 1. Meteorological data recorded during the field experiment.
Agronomy 14 02045 g001
Figure 2. Soil water deficit at a depth of 0.40 m in each irrigation treatment. The constant horizontal short dashed lines indicate the empirical minimum threshold for irrigation in IRR.
Agronomy 14 02045 g002
Figure 3. Course of net photosynthetic assimilation rate (Pn, μmol CO2 m−2s−1) during the field experiment in the four tomato genotypes under different water regimes. Vertical arrows indicate the time of irrigation in the REW. Small vertical bars indicate the standard error (n = 3).
Agronomy 14 02045 g003
Figure 4. Effect of interaction between ‘water regime (I) × genotype (G)’ on net photosynthetic assimilation rate (Pn) in tomatoes on two dates (June 23 and July 11). IRR: full irrigation; DRY: no irrigation; REW: rewatering. Bars with the same letter do not significantly differ at p < 0.05, according to Tukey’s test. Small black vertical bars indicate the standard error (n = 3).
Agronomy 14 02045 g004
Figure 5. Course of leaf transpiration (E, mmol H2O m−2s−1) during the field experiment in four tomato genotypes under different water regimes. Vertical arrows indicate the time of irrigation in REW. Small vertical bars indicate the standard error (n = 3).
Agronomy 14 02045 g005
Figure 6. Effect of interaction between ‘water regime (I) × genotype (G)’ on leaf transpiration (E) in tomatoes at two dates (June 23 and July 11). IRR: full irrigation; DRY: no irrigation; REW: rewatering. Bars with the same letter do not significantly differ at p < 0.05 according to Tukey’s test. Small black vertical bars indicate the standard error (n = 3).
Agronomy 14 02045 g006
Figure 7. Course of stomatal conductance (gs, mol H2O m−2s−1) during the field experiment in the four tomato genotypes under different water regimes. Vertical arrows indicate the time of irrigation in REW. Small vertical bars indicate the standard error (n = 3).
Agronomy 14 02045 g007
Figure 8. Effect of interaction between ‘water regime (I) × genotype (G)’ on stomatal conductance (gs) in tomatoes on two dates (June 23 and July 11). IRR: full irrigation; DRY: no irrigation; REW: rewatering. Bars with the same letter do not significantly differ at p < 0.05 according to Tukey’s test. Small black vertical bars indicate the standard error (n = 3).
Agronomy 14 02045 g008
Figure 9. Course of leaf relative water content (RWC, %) during the field experiment for four tomato genotypes under different water regimes. Vertical arrows indicate the time of irrigation in REW. Small vertical bars indicate the standard error (n = 3).
Agronomy 14 02045 g009
Figure 10. Effect of interaction between ‘water regime (I) × genotype (G)’ on leaf relative water content (RWC) in tomatoes (July 11). IRR: full irrigation; DRY: no irrigation; REW: rewatering. Bars with the same letter do not significantly differ at p < 0.05 according to Tukey’s test. Small black vertical bars indicate the standard error (n = 3).
Agronomy 14 02045 g010
Figure 11. Course of Instantaneous water use efficiency (WUEi, μmol CO2 mmol−1 H2O) during the field experiment in four tomato genotypes under different water regimes. Vertical arrows indicate the time of irrigation in REW. Small vertical bars indicate the standard error (n = 3).
Agronomy 14 02045 g011
Figure 12. Effect of interaction between ‘water regime (I) × genotype (G)’ on instantaneous water use efficiency (WUEi) in tomatoes on two dates (June 23 and July 11). IRR: full irrigation; DRY: no irrigation; REW: rewatering. Bars with the same letter do not significantly differ at p < 0.05 according to Tukey’s test. Small black vertical bars indicate the standard error (n = 3).
Agronomy 14 02045 g012
Figure 13. Course of intercellular CO2 (Ci, ppm) during the field experiment in the four tomato genotypes under different water regimes. Vertical arrows indicate the time of irrigation in REW. Small vertical bars indicate the standard error (n = 3).
Agronomy 14 02045 g013
Figure 14. Effect of interaction between ‘water regime (I) × genotype (G)’ on intercellular CO2 (Ci) in tomatoes (June 23). IRR: full irrigation; DRY: no irrigation; REW: rewatering. Bars with the same letter do not significantly differ at p < 0.05 according to Tukey’s test. Small black vertical bars indicate the standard error (n = 3).
Agronomy 14 02045 g014
Figure 15. Course of stress degree (Ta-Tl, °C) during the field experiment in four tomato genotypes under different water regimes. Vertical arrows indicate the time of irrigation in REW. Small vertical bars indicate the standard error (n = 3).
Agronomy 14 02045 g015
Figure 16. Effect of interaction between ‘water regime (I) × genotype (G)’ on stress degrees (Tair-Tleaf) in tomatoes (June 23). IRR: full irrigation; DRY: no irrigation; REW: rewatering. Bars with the same letter do not significantly differ at p < 0.05 according to Tukey’s test. Small black vertical bars indicate the standard error (n = 3).
Agronomy 14 02045 g016
Figure 17. Effect of interaction ‘water regime (I) × genotype (G)’ and mean effects ‘water regime’ and ‘cultivar’ on fruit production. IRR: full irrigation; DRY: no irrigation; REW: rewatering. Within the interaction values for each mean effect, bars with the same letter do not significantly differ at p < 0.05, according to Tukey’s test. Small black vertical bars indicate the standard error (n = 3). Significant at p < 0.001 ***.
Agronomy 14 02045 g017
Figure 18. Effect of interaction between ‘water regime (I) × genotype (G)’ on total soluble solids content (SS). IRR: full irrigation; DRY: no irrigation; REW: rewatering. Bars with the same letter do not significantly differ at p < 0.05, according to Tukey’s test. Small black vertical bars indicate the standard error (n = 3).
Agronomy 14 02045 g018
Figure 19. Effect of interaction between ‘water regime (I) × genotype (G)’ on total phenol content. IRR: full irrigation; DRY: no irrigation; REW: rewatering. Bars with the same letter do not significantly differ at p < 0.05, according to Tukey’s test. Small black vertical bars indicate the standard error (n = 3).
Agronomy 14 02045 g019
Figure 20. Principal component biplot and scores of PCA for physiological traits (Pn: net photosynthetic assimilation rate; E: leaf transpiration; gs: stomatal conductance; Ta−Tl: stress degree; RWC: relative water content, Ci: leaf intercellular CO2; WUEi: instantaneous water use efficiency), fruit production (FP), and quality traits (TS: total solids; SS: soluble solids; RS: reducing sugars; AscA: ascorbic acid; TP: total phenols) in tomato, as modulated by water regime (DRY: no irrigation; REW: rewaterings; IRR: full irrigation) and cultivar.
Agronomy 14 02045 g020
Table 1. Main effects of water regime (I) and genotype (G) on some physiological traits of tomatoes (date: June 23). IRR: full irrigation; DRY: no irrigation; REW: rewatering.
Pn
(μmol CO2
m−2s−1)
E
(mmol
H2O m−2s−1)
gs
(mol H2O
m−2s−1)
WUEi
(μmol CO2 mmol−1 H2O)
Ci
(ppm)
Ta−Tl
(°C)
RWC
(%)
DRY18.67 ± 0.39 b6.81 ± 0.19 b0.78 ± 0.05 b2.77 ± 0.07 ab373.4 ± 3.0 b0.13 ± 0.14 b75.5 ± 0.55 c
Water regimeREW23.91 ± 0.46 a8.89 ± 0.24 a1.55 ± 0.10 a2.71 ± 0.05 b405.1 ± 2.0 a1.27 ± 0.10 a78.1 ± 0.48 b
(I)IRR24.67 ± 1.10 a8.45 ± 0.30 a1.73 ± 0.14 a2.94 ± 0.10 a403.9 ± 1.6 a1.31 ± 0.14 a84.3 ± 0.59 a
Cultivar
(G)
Custonaci (Local)20.04 ± 0.65 d7.44 ± 0.26 b1.05 ± 0.09 b2.70 ± 0.04 a394.8 ± 4.3 a0.74 ± 0.12 a80.3 ± 1.24 a
Salina (Local)21.56 ± 0.70 c8.01 ± 0.43 ab1.32 ± 0.19 ab2.75 ± 0.11 a391.5 ± 7.1 a0.88 ± 0.28 a80.1 ± 1.38 a
Vulcano (Local)22.99 ± 0.98 b8.25 ± 0.38 a1.43 ± 0.14 a2.81 ± 0.12 a398.3 ± 4.1 a0.84 ± 0.21 a78.9 ± 1.22 ab
Faino (Hy)25.08 ± 1.53 a8.49 ± 0.42 a1.61 ± 0.21 a2.95 ± 0.07 a391.8 ± 4.2 a1.07 ± 0.24 a77.8 ± 1.13 b
SignificanceI*******************
G********nsnsns*
I × G****************ns
For each main effect, values (mean ± se) within each column, followed by the same letter, do not significantly differ at p < 0.05, according to Tukey’s test; ns = not significant; significant at p < 0.05 (*), 0.01 (**), and 0.001 (***).
Table 2. Main effects of water regime (I) and genotype (G) on the physiological traits of tomatoes (date: July 11). IRR: full irrigation; DRY: no irrigation; REW: rewatering.
Pn
(μmol CO2
m−2s−1)
E
(mmol
H2O m−2s−1)
gs
(mol H2O
m−2s−1)
WUEi
(μmol CO2 mmol−1 H2O)
Ci
(ppm)
Ta-Tl
(°C)
RWC
(%)
DRY7.05 ± 0.41 c5.59 ± 0.32 c0.14 ± 0.01 c1.31 ± 0.06 a336.0 ± 5.9 b0.23 ± 0.15 c71.3 ± 1.19 c
Water regimeREW23.51 ± 0.63 a16.69 ± 0.41 a1.07 ± 0.15 a1.43 ± 0.09 a362.0 ± 3.8 a4.19 ± 0.39 b77.5 ± 1.65 b
(I)IRR20.68 ± 0.63 b14.68 ± 0.67 b0.72 ± 0.12 b1.44 ± 0.05 a350.5 ± 6.0 ab1.69 ± 0.33 b82.3 ± 1.12 a
Cultivar
(G)
Custonaci (Local)15.66 ± 2.15 b12.81 ± 1.47 a0.72 ± 0.17 ab1.20 ± 0.07 b363.6 ± 6.2 a2.28 ± 0.53 a75.8 ± 1.74 b
Salina (Local)15.93 ± 1.78 b11.89 ± 1.53 a0.49 ± 0.10 b1.39 ± 0.08 ab347.7 ± 6.9 ab1.96 ± 0.64 a73.8 ± 1.53 b
Vulcano (Local)17.77 ± 2.24 a11.62 ± 1.55 a0.48 ± 0.10 b1.58 ± 0.06 a334.4 ± 6.6 b1.48 ± 0.41 a74.1 ± 1.85 b
Faino (Hy)18.95 ± 2.68 a12.95 ± 1.67 a0.89 ± 0.25 a1.40 ± 0.07 ab352.3 ± 5.2 ab2.42 ± 0.77 a84.5 ± 1.19 a
SignificanceI*********ns*********
G***ns*****ns***
I × G*********nsns**
For each main effect, values (mean ± se) within each column, followed by the same letter do not significantly differ at p < 0.05 according to Tukey’s test; ns = not significant; significant at p < 0.05 (*), 0.01 (**) and 0.001 (***).
Table 3. Main effects of water regime (I) and cultivar (G) on some quality traits of tomatoes (on a fresh weight basis).
TS
(g 100 g−1 FW)
SS
(°Brix)
RS
(g 100 g−1)
AscA
(mg 100 g−1 FW)
TP
(mg GAE 100 g−1 FW)
DRY9.63 ± 0.18 a7.41 ± 0.26 a5.25 ± 0.16 a14.15 ± 0.93 a64.0 ± 2.51 a
Water regimeREW9.13 ± 0.14 b6.55 ± 0.14 b4.52 ± 0.18 b13.32 ± 0.87 a56.2 ± 1.61 b
(I)IRR7.36 ± 0.24 c6.07 ± 0.18 c4.34 ± 0.14 b11.21 ± 0.89 b53.7 ± 2.30 b
Cultivar
(G)
Custonaci (Local)9.10 ± 0.19 a6.92 ± 1.01 c4.84 ± 0.22 a10.80 ± 0.67 b58.7 ± 2.33 b
Salina (Local)8.89 ± 0.14 a7.02 ± 1.09 b4.84 ± 0.17 a14.64 ± 1.17 a57.6 ± 1.78 b
Vulcano (Local)8.98 ± 0.35 a7.15 ± 0.62 a4.97 ± 0.22 a15.01 ± 0.99 a65.2 ± 3.21 a
Faino (Hy)7.85 ± 0.16 b5.63 ± 1.08 d4.15 ± 0.20 b11.12 ± 0.70 b50.5 ± 1.74 c
SignificanceI***************
G*************
I × Gns***nsns*
For each main effect, values (mean ± se) within each column, followed by the same letter do not significantly differ at p < 0.05 according to Tukey’s test; ns = not significant; significant at p < 0.05 (*), 0.01 (**) and 0.001 (***).
Table 4. Pearson’s correlation test between fruit production (FP) and physiological traits of tomatoes (date: July 11).
PnEgsRWCCiTa-TlWUEiTSSSRSAscATP
E0.96 ***-----------
gs0.85 ***0.80 **----------
RWC0.64 *0.61 *0.62 *---------
Ci0.24 ns0.35 ns0.47 ns0.20 ns--------
Ta-Tl0.81 **0.80 **0.92 ***0.38 ns0.46 ns-------
WUEi0.37 ns0.12 ns0.27 ns0.05 ns−0.40 ns0.20 ns------
TS−0.54 ns−0.50 ns−0.36 ns−0.82 ***0.18 ns−0.10 ns−0.24 ns-----
SS−0.61 *−0.62 *−0.55 ns−0.95 ***−0.29 ns−0.37 ns0.07 ns0.76 **----
RS−0.74 **−0.66 *−0.76 **−0.88 ***−0.27 ns−0.55 ns−0.21 ns0.69 *0.88 ***---
AscA−0.25 ns−0.31 ns−0.33 ns−0.67 *−0.06 ns−0.12 ns−0.26 ns0.57 ns0.60 *0.51 ns--
TP−0.60 *−0.64 *−0.57 *−0.87 ***−0.24 ns−0.45 ns−0.19 ns0.69 *0.93 ***0.86 ***0.61 *
FP0.62 *0.65 *0.52 ns0.84 ***0.10 ns0.25 ns0.05 ns−0.91 ***−0.76 **−0.73 *−0.61 *−0.74 **
Significant at p ≤ 0.05 (*), 0.01 (**), and 0.001 (***); not significant (ns).
Disclaimer/Publisher’s Note: The statements, opinions and data contained in all publications are solely those of the individual author(s) and contributor(s) and not of MDPI and/or the editor(s). MDPI and/or the editor(s) disclaim responsibility for any injury to people or property resulting from any ideas, methods, instructions or products referred to in the content.

